
Abstract
In today’s highly competitive market environment, service providers are beginning to recognize that customer referral plays an important role in enhancing firm value through cost-effective acquisition of new customers. While a significant body of research has focused on exploring customer referral, surprisingly limited research to date has addressed how customer referral may vary for different customer groups, particularly among switchers and stayers. This article examines the moderating effect of switchers and stayers on the relationships between service quality and perceived value on customer referral behavior. Actual referral data were collected from 441 customers of an Internet Service Provider in two waves for this study. The results show that the effects of positive changes in service quality and perceived value on customer referral behavior are stronger for recently acquired customers (switchers) than for long-term customers (stayers). The findings of the study suggest that investment in service quality and value improvements yield significantly higher returns (through greater customer referrals) for switchers than for stayers. Based on the findings, the authors recommend that service managers should identify and target newly acquired customers, who have switched from different service providers, right from the outset of the relationship with service offerings that signify higher quality and value in order to maximize customer referrals.
Introduction
Relationship marketing has predominantly focused on customer satisfaction, customer loyalty, and marketing-induced strategies for retention and acquisition (Oliver 1999). Only recently have service firms begun to understand the growing importance of customer referrals in achieving long-term customer value, profitability, and customer loyalty through new customer acquisition (Schmitt, Skiera, and Van den Bulte 2011; Wirtz et al. 2013). With the rise in Internet, mobile, and social networking technologies, it has become increasingly important for service providers to encourage positive word of mouth, word of “mouse,” and customer referrals, as these new technologies are making it easier to spread “the word” faster. Nowadays, it is a lot easier for users to become opinion leaders and encourage (or discourage) their peers to try or buy various products and services. When an individual is seeking information prior to a purchase, they generally search for unbiased, noncommercial information which they can trust (Mizerski 1982). This is especially common when a customer is searching for a subscription service, since these services are substantially more difficult to evaluate (Harrison-Walker 2001) and potentially expose customers to larger risks than tangible products (Schumann et al. 2010). To reduce risk and uncertainty, consumers may seek information from other people who have prior experience in the service (Murray 1991). Therefore, they depend less on outright purchase, observation, or trial; instead, they engage in information acquisition activities such as customer recommendations or referrals (Schumann et al. 2010).
In recognition of this, marketing scholars have begun to examine customer referral behavior (e.g., de Matos and Rossi 2008; Ryu and Feick 2007; Schmitt, Skiera, and Van den Bulte 2011; Wentzel, Tomczak, and Henkel 2014). However, these past studies do not shed light on the differences, if any, among distinct customer groups with regard to customer referral behavior. An in-depth understanding of the differences in the customer referral behavior among distinct customer groups is essential for service providers, as customer referral is a key element of customer acquisition strategies and customer value (Schmitt, Skiera, and Van den Bulte 2011). If differences between customer groups exist, service providers could target different groups with separate strategies for effective customer management.
Considering the importance of understanding the differences among customer groups in relation to customer referral behavior, our study specifically focuses on two distinct customer groups –“switchers” (customers who have switched to the service provider from another) and “stayers” (customers who have never switched their service provider). Within the context of a service provider, the customer base can broadly be categorized into these two groups (Ganesh, Arnold, and Reynolds 2000). Research on this topic has been limited to date with only a few studies examining switching behavior (Roos 1999; Roos and Gustafsson 2007), and comparing differences between switchers and stayers (e.g., Chiu et al. 2005; Ganesh, Arnold, and Reynolds 2000; Peng and Wang 2006; Wangenheim and Bayón 2004).
Research specifically examining whether customer referral behavior differs between switchers and stayers is limited. We seek to extend this area of research by considering the moderating role of switchers and stayers on the effects of customer perceptions of service quality and perceived value on actual customer referral behavior. A more comprehensive understanding of how switchers and stayers differ in their attitudes and referral behavior could provide crucial insights for service providers in designing and implementing effective customer acquisition and retention strategies.
To achieve these objectives, we take the following steps. First, we present a theoretical framework that draws on comparison-level theory (Thibaut and Kelley 1959) to help explain differences between switchers and stayers. This framework also helps us form some expectations about how these customer groups may moderate the influence of service quality and perceived value on customer referral behavior. Following this, we outline a series of hypotheses based on a review of the literature. Next, we conduct moderated regression analysis to test our hypotheses using a combination of attitudinal and actual referral data collected from a leading Internet Service Provider (ISP). We conclude with a discussion of the implications of our findings and present possible directions for future research.
Theoretical Background
In consideration of the specific objectives of the study, we aim to understand whether the effects of service quality and perceived value on customer referral behavior differ between switchers and stayers. In measuring the effects of service quality and perceived value, we account for consumers’ baseline and comparison levels by considering the change between two time waves (t2 − t1) that reflect consumers’ true evaluation of these constructs. In this section, we propose a model of service quality, perceived value, and customer referral behavior, which is moderated by switchers and stayers (see Figure 1). We rely on zone of tolerance (Berry and Parasuraman 1991), comparison-level theory (Thibaut and Kelley 1959), and past research to formulate hypotheses related to the differences between switchers and stayers.
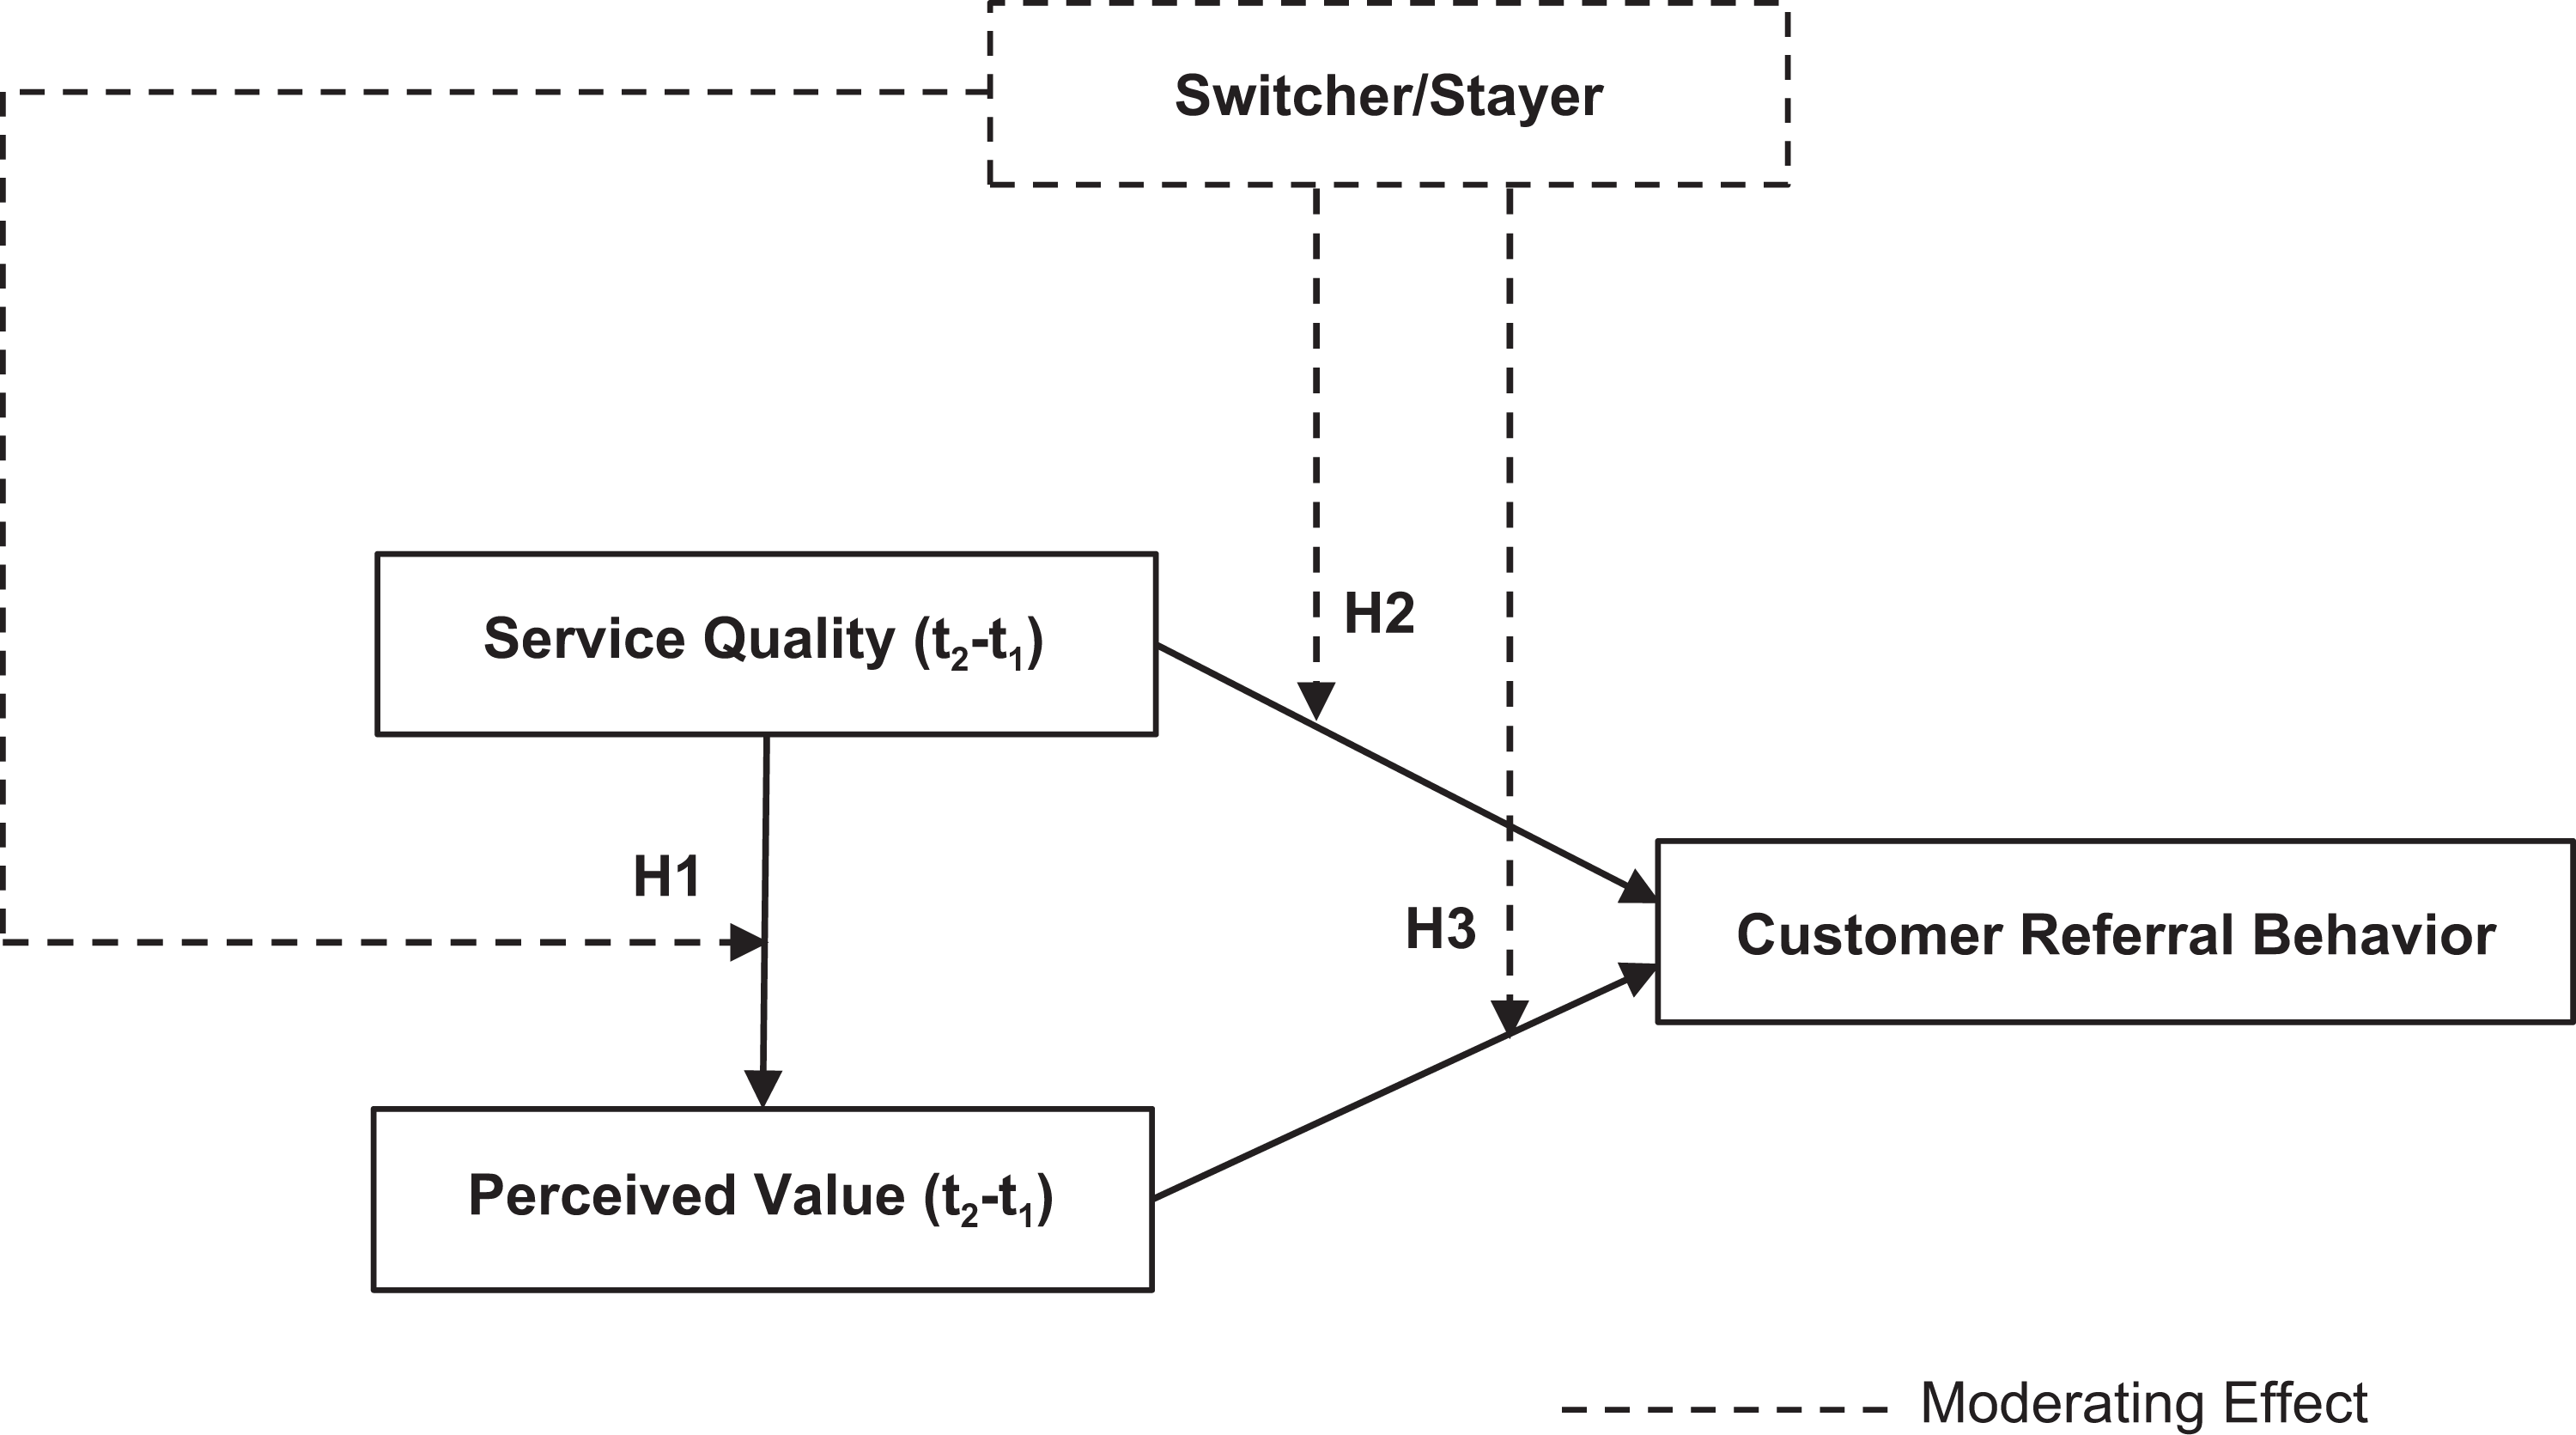
Theoretical model.
Service Quality and Perceived Value
Prior studies have confirmed the link between service quality and perceived value (e.g., Bolton and Drew 1991; Cronin, Brady, and Hult 2000; Parasuraman and Grewal 2000). There has been a convergence of opinion that favorable service quality evaluations lead to improved value perceptions (Cronin, Brady, and Hult 2000). Customers’ assessment of service quality is primarily shaped by their expectations (Berry and Parasuraman 1991). In service encounters, customers hold different levels of service expectations, which can be explained through the zone of tolerance (Berry and Parasuraman 1991; Teas and DeCarlo 2004). The zone of tolerance represents the difference between two levels; the level of service that the customer hopes to receive (i.e., desired service level) and the minimum level of service the customer will accept (i.e., adequate service level) (Berry and Parasuraman 1991). A performance level below the tolerance zone will engender customer frustration and decrease service quality evaluations, while performance above the tolerance zone will please customers (Berry and Parasuraman 1991).
In service encounters, switchers and stayers hold different levels of service expectations. The expectations of switchers, who have experienced other service providers, vary from the expectations of stayers, who have no prior experience with other providers. Customers who switch service providers (switchers) are generally those who have experienced outcomes below their adequate service level. Therefore, switchers’ adequate service-level expectations are reduced when entering into a relationship with a new service provider. This implies that the zone of tolerance for switchers should broaden as a consequence of their experience with prior service providers. On the other hand, as stayers’ adequate service-level expectations are not shaped by prior experiences with other providers, they have a relatively narrow zone of tolerance. Hence, drawing from the zone of tolerance model (Berry and Parasuraman 1991), we expect switchers to evaluate their current service provider less rigorously compared to other customers (i.e., stayers). This means that switchers’ evaluations of service quality from their current service provider should be more favorable and have a greater effect on their value perceptions in comparison with stayers. Thus, the following hypothesis:
Service Quality, Perceived Value, and Customer Referral Behavior
The effect of service quality and perceived value on customer recommendations, positive word-of-mouth, and referral intentions has been well documented in the literature (e.g., Bolton and Drew 1991; Gounaris, Tzempelikos, and Chatzipanagiotou 2007; Wang 2009; Zeithaml, Berry, and Parasuraman 1996). From an exchange theory perspective, a customer’s decision about whether to engage in referral depends on the perceived costs and benefits of the exchange (Frenzen and Nakamoto 1993). A customer’s perception of value is based on his or her overall assessment of the utility of a product or service, which is measured by the trade-off between benefits and sacrifices (Zeithaml 1988). Therefore, when customers perceive higher value from a service, they have a higher tendency to refer the service provider to others. On a similar note, service quality comprises of evaluations of the benefits received from a service and should therefore influence referral behavior when evaluations are positive (Zeithaml, Berry, and Parasuraman 1996). In evaluating service quality and value received from a service provider, customers use comparison levels (Thibaut and Kelley 1959). The comparison level is a standard representing what people think or feel they should receive from a particular relationship. According to comparison-level theory (Thibaut and Kelley 1959), when perceived outcomes (i.e., service quality and value) fall below a customer’s comparison level, the customer is motivated to leave the relationship and switch to another service provider (Mazursky, LaBarbera, and Aiello 1987). As a consequence, the customer sets a reduced consideration for available alternatives, which therefore brings down his or her comparison level to represent the next best set of outcomes that could be attained (Thibaut and Kelley 1959). Therefore, switchers who experience declining outcomes with a previous service provider and switch to a new provider enter the relationship with a reduced comparison level (Ganesh, Arnold, and Reynolds 2000), as they seek to move to a state in which perceived outcomes are significantly above the prior comparison level. On the other hand, relatively small shifts in comparison levels are experienced among customers who have not switched service providers at all (stayers). Thus, we see that the comparison level that stayers set for available alternatives and perceived actual outcomes with their current service provider remain relatively unchanged. Switchers evaluate their current service provider with lower expectations (i.e., reduced comparison level) than other customers (i.e., stayers) who have experienced negligible change in their comparison levels. In light of the previous discussion, we expect switchers, in comparison to stayers, to have more favorable evaluations of service quality and perceived value, with a stronger influence on referral behavior, since they enter into a new relationship with a relatively low level of expectations.
The above argument is supported by prior research, which has found that switchers are more satisfied, more loyal, and are more likely to engage positive word of mouth, in comparison to stayers (e.g., Ganesh, Arnold, and Reynolds 2000; Wangenheim and Bayón 2004). Although these past studies did not consider service quality, perceived value, and actual customer referral behavior, it could be inferred from these findings that switchers evaluate their provider more favorably, perceive higher value, and are more likely to engage in referral behavior in comparison to stayers, and as such the effects of service quality and perceived value on customer referral behavior should be stronger for switchers than for stayers. Hence, the following hypotheses are proposed:
Method
The data used for this study were collected from a leading ISP located in Australia. The ISP provided us with customer transaction data from their internal records as well as attitudinal data from an online customer survey. More than 16,000 account holders are e-mailed to participate in a customer survey annually, with the request to provide information on aspects relating to the service provider. We screened all the customers considered for this study based on their contract start date. Customers whose contract commenced within 1 year were not included in this study to ensure that all respondents would have spent adequate time with the company to make an evaluation.
We used data from two consecutive annual survey waves. The first and second waves contained 2,531 and 1,763 usable questionnaires, respectively. We thus ended up with 441 cases that provided data across both measurement waves. In line with Eggert et al. (2014), we limited our analysis to the matching cases obtained in both waves to avoid large amounts of missing values. From the final sample of 441 respondents, 215 were stayers and 226 were switchers.
A preliminary analysis of the data revealed that 78% of the final sample were males, while 22% were females. Approximately 40% of the sample respondents were aged 18–35 years, 44% were aged 36–55 years, and 16% were over 56 years. In relation to employment, 16% of the sample respondents were employed in administration and management services, 27% in information technology industries, 17% in engineering and mining industries, 15% in government and education, and 25% in other industries. We tested for nonresponse bias using an accepted procedure comparing early versus late responses (Armstrong and Overton 1977) and found no evidence of differences between the two groups.
A longitudinal perspective is needed to comprehensively explore our hypotheses, as the true impact of customer attitudes on performance measures is not apparent when taking a cross-sectional approach (Bernhardt, Donthu, and Kennett 2000). Cross-sectional studies only measure absolute values that do not account for customer comparison levels of alternatives (Liljander and Strandvik 1993), zones of tolerance (Berry and Parasuraman 1991), and service improvements (Kandampully 1998). Measuring changes in customer attitudes over a period of time will take into account the respondent’s baseline and comparison levels, which will therefore enable consumers to evaluate service improvements. Thus, a longitudinal approach was used for this study.
To analyze causal changes in the predictor variables included in our model, we followed the method suggested by Menard (1991), whereby the value of the dependent variable (customer referral behavior) was expressed as a function of the change in the independent variables (service quality and perceived value). For each of the independent variables, the rating from each customers survey in the first wave (t1) was subtracted from the rating in the second wave (t2), resulting in the differential as a measure of change for each of the variables.
Measures
Prior studies have found organizational survey-based secondary data to be more relevant to the context of their study and have therefore employed such measures to capture data on consumer relationship constructs in the context of service organizations (e.g., Bolton 1998; Bolton and Lemon 1999). The scales and items in these studies were produced by the organizations based on organizational knowledge (Bolton 1998) and were considered to be more relevant to the particular service offering. Accordingly, for the purpose of this research, we employed survey-based secondary data that were collected by the ISP’s annual customer survey with the company’s original variable constructs and scales. In the annual survey, customers were asked to evaluate the ISP’s service quality and value. The scale items are presented in Table 1.
Scale Items.
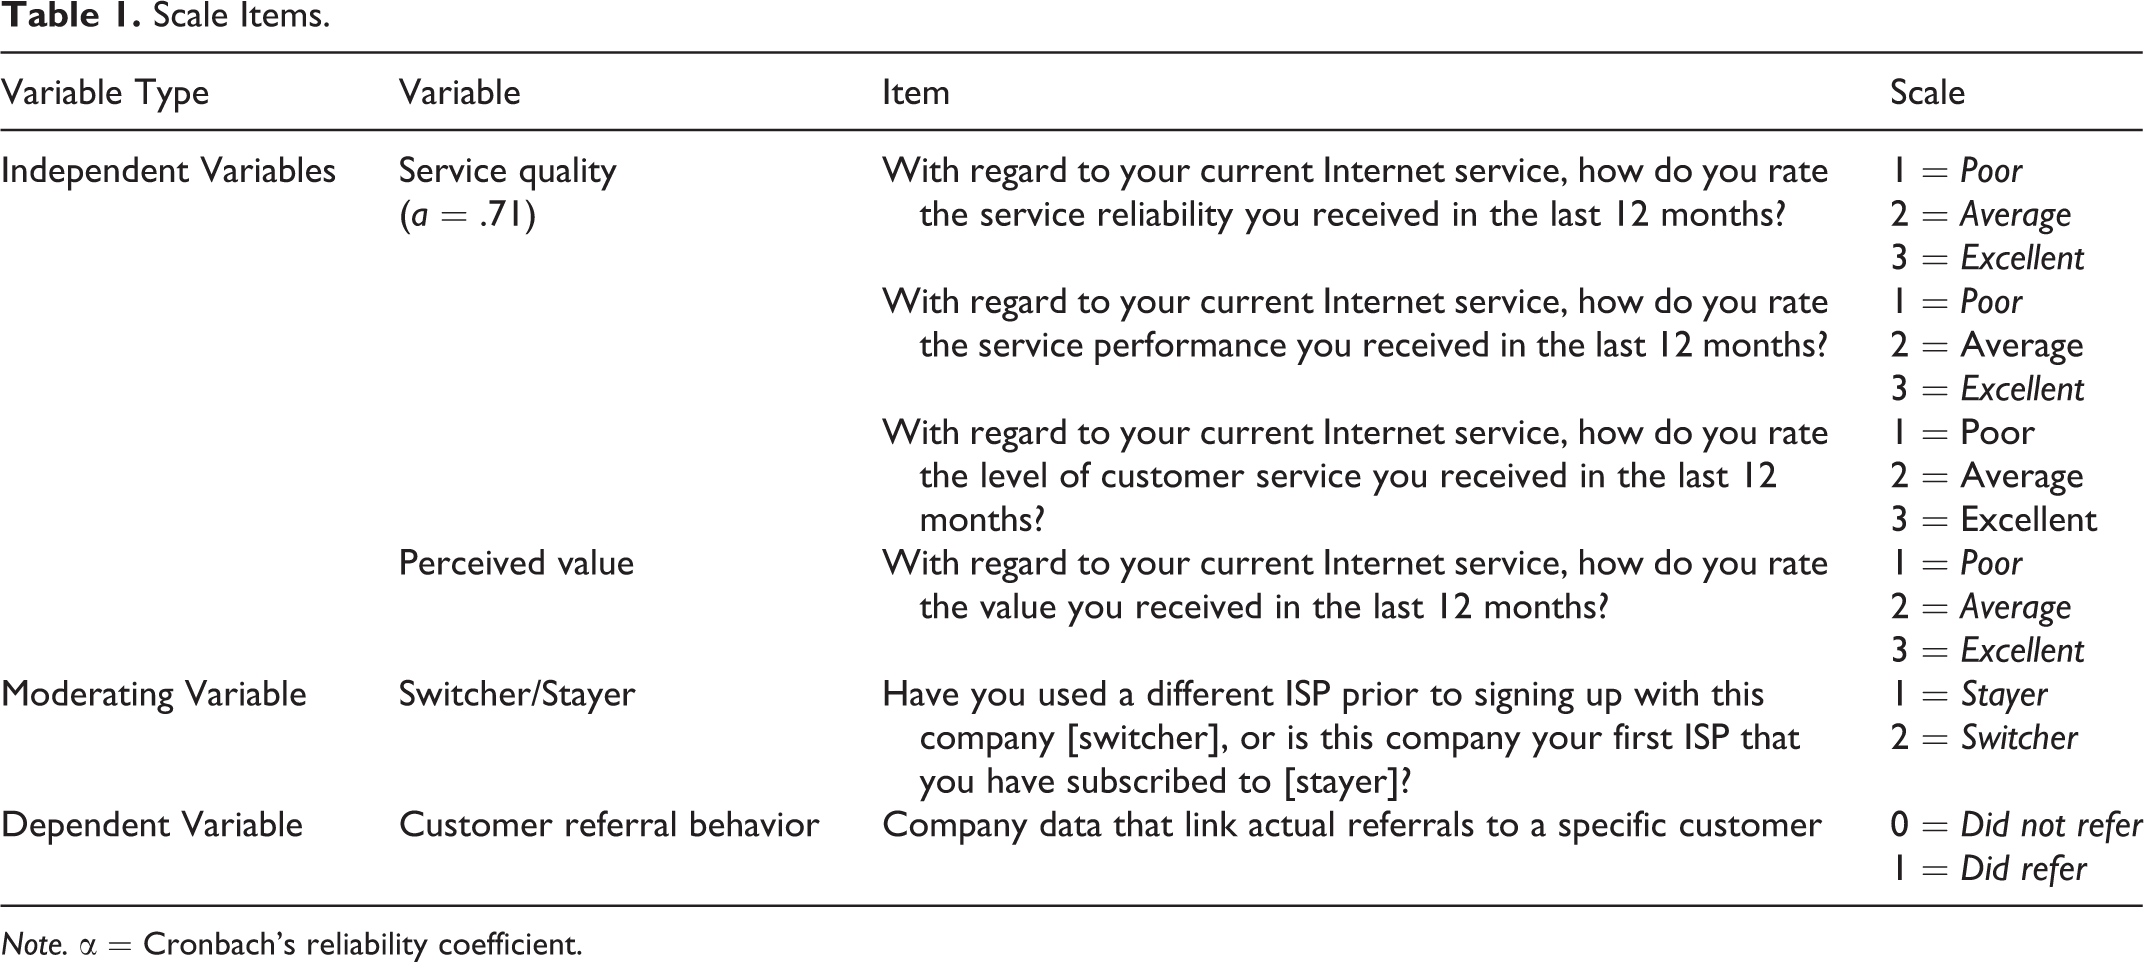
Note. α = Cronbach’s reliability coefficient.
Service quality has two main components—functional and technical service quality (Parasuraman, Zeithaml, and Berry 1988). In the context of the ISP, functional service quality is recognized as customer service, and technical service quality is the service reliability and service performance. Thus, service quality was measured using a 3-item scale to reflect the components of functional and technical service quality.
Perceived value was measured with a single item: “With regard to your current Internet service, how do you rate the value you received in the last 12 months?” Many studies have begun to highlight the importance of using single-item scales to measure customer attitudes and evaluations (Bergkvist and Rossiter 2007; Diamantopoulos et al. 2012). For instance, Bergkvist and Rossiter (2007) examined the predictive validity of single-item and multiple-item measures and found that single-item scales have equally high predictive validity as a multiple-item measure. They also find no evidence of common method bias in single-item measures for measuring both independent and dependent variables.
Customer referral behavior was measured using company data that link actual referrals to a specific customer. These data were obtained from the ISP’s internal records. When a new customer signs up to the company, the ISP asks whether he or she was referred to the company by an existing customer of the ISP and if so, by whom. Thus, the ISP has a complete record of existing customers who have referred new customers to the company. Of the 441 respondents, 177 (40.1%) customers had not made a referral and 264 (59.9%) customers had made a referral. The referral data for each respondent were matched to the attitudinal survey data through customer IDs.
Moderator
Switchers and stayers were identified from the data collected by the ISP during the survey. The respondents were asked whether they had used a different ISP prior to signing up with this company (switcher) or whether this company was their first ISP that they had subscribed to (stayer). Of the sample, 59.9% were found to be switchers (i.e., customers who have experience with other ISPs) and 40.1% were stayers (i.e., customers who have no experience with other ISPs).
Control Variables
In an effort to provide rigorous tests of the proposed theoretical model and to control for extraneous variation, we included gender and age of the respondents (dummy coded) as covariates in the analyses. These covariates help to account for respondent heterogeneity and avoid confounding influences on the results (Dawes 2009). Age has been found to be associated with heightened loyalty (Lambert-Pandraud, Laurent, and Lapersonne 2005), which may have an influence on the relationship between the independent variables and customer referral behavior. Similarly, males and females have been found to differ in terms of their loyalty intentions and word-of-mouth recommendations (Melnyk, van Osselaer, and Bijmolt 2009).
Results
An examination of the correlations among the variables included in the analysis revealed absence of multicollinearity (see Table 2). To demonstrate the existence of a significant difference between groups—switchers and stayers, as a prelude to testing the hypothesized relationships, we conducted an independent sample t-test. The results reveal that the two groups are significantly different with regard to all the variables considered for this study.
Correlations.
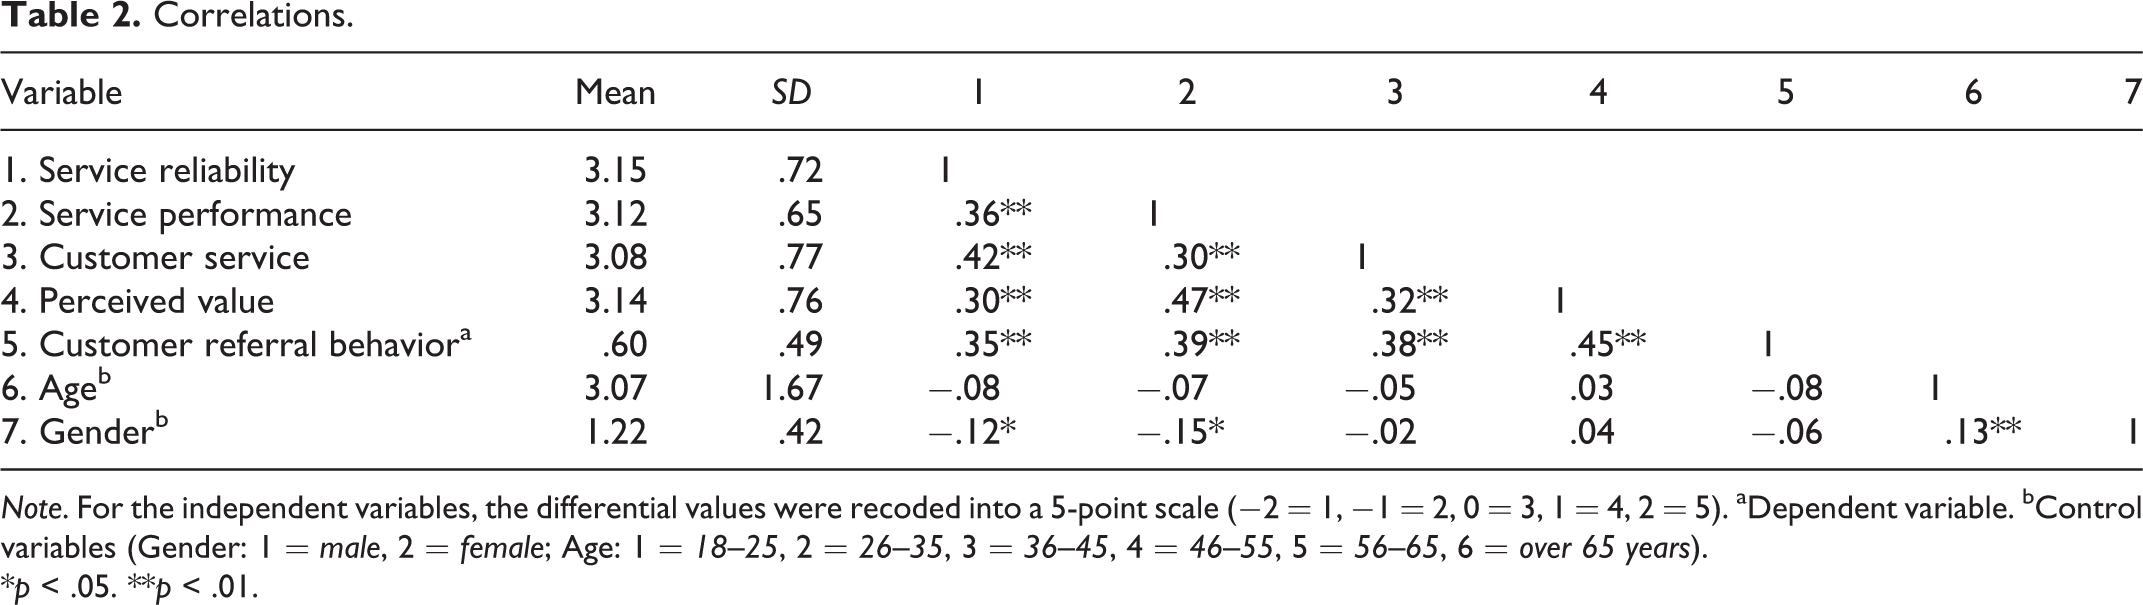
Note. For the independent variables, the differential values were recoded into a 5-point scale (−2 = 1, −1 = 2, 0 = 3, 1 = 4, 2 = 5). aDependent variable. bControl variables (Gender: 1 = male, 2 = female; Age: 1 = 18–25, 2 = 26–35, 3 = 36–45, 4 = 46–55, 5 = 56–65, 6 = over 65 years).
*p < .05. **p < .01.
Past studies have examined moderating effects in regression models through interaction variables (Bell and Luddington 2006; Mittal and Kamakura 2001; Wirtz et al. 2013). Specifically, Mittal and Kamakura (2001) tested the effect of several demographic variables as moderators through interactions on the link between satisfaction and repurchase behavior, using moderated regression analysis. Bell and Luddington (2006) assessed the main effects of independent variables and moderating effects on dependent variables using interaction terms in a hierarchical moderated regression analysis. Following these studies, we conducted hierarchical moderator regression analysis for the continuous dependent variable—perceived value, and a moderated logistic regression analysis for the dichotomous dependent variable—customer referral behavior.
Hierarchical moderated regression was used to assess the moderating effects of switchers and stayers on the relationship between service quality and perceived value. To test the moderating effects, we first created a multiplicative interaction terms (Service Quality × Switcher/Stayer). We created the interaction terms by taking the product of the variables after mean centering. This was done to minimize problems of multicollinearity between the interaction effects and the main effects in the model (Aiken and West 1991). Table 3 reports the hierarchical moderated regression analysis for perceived value, including the multiplicative interaction terms.
Hierarchical Moderated Regression Analysis for Perceived Value.
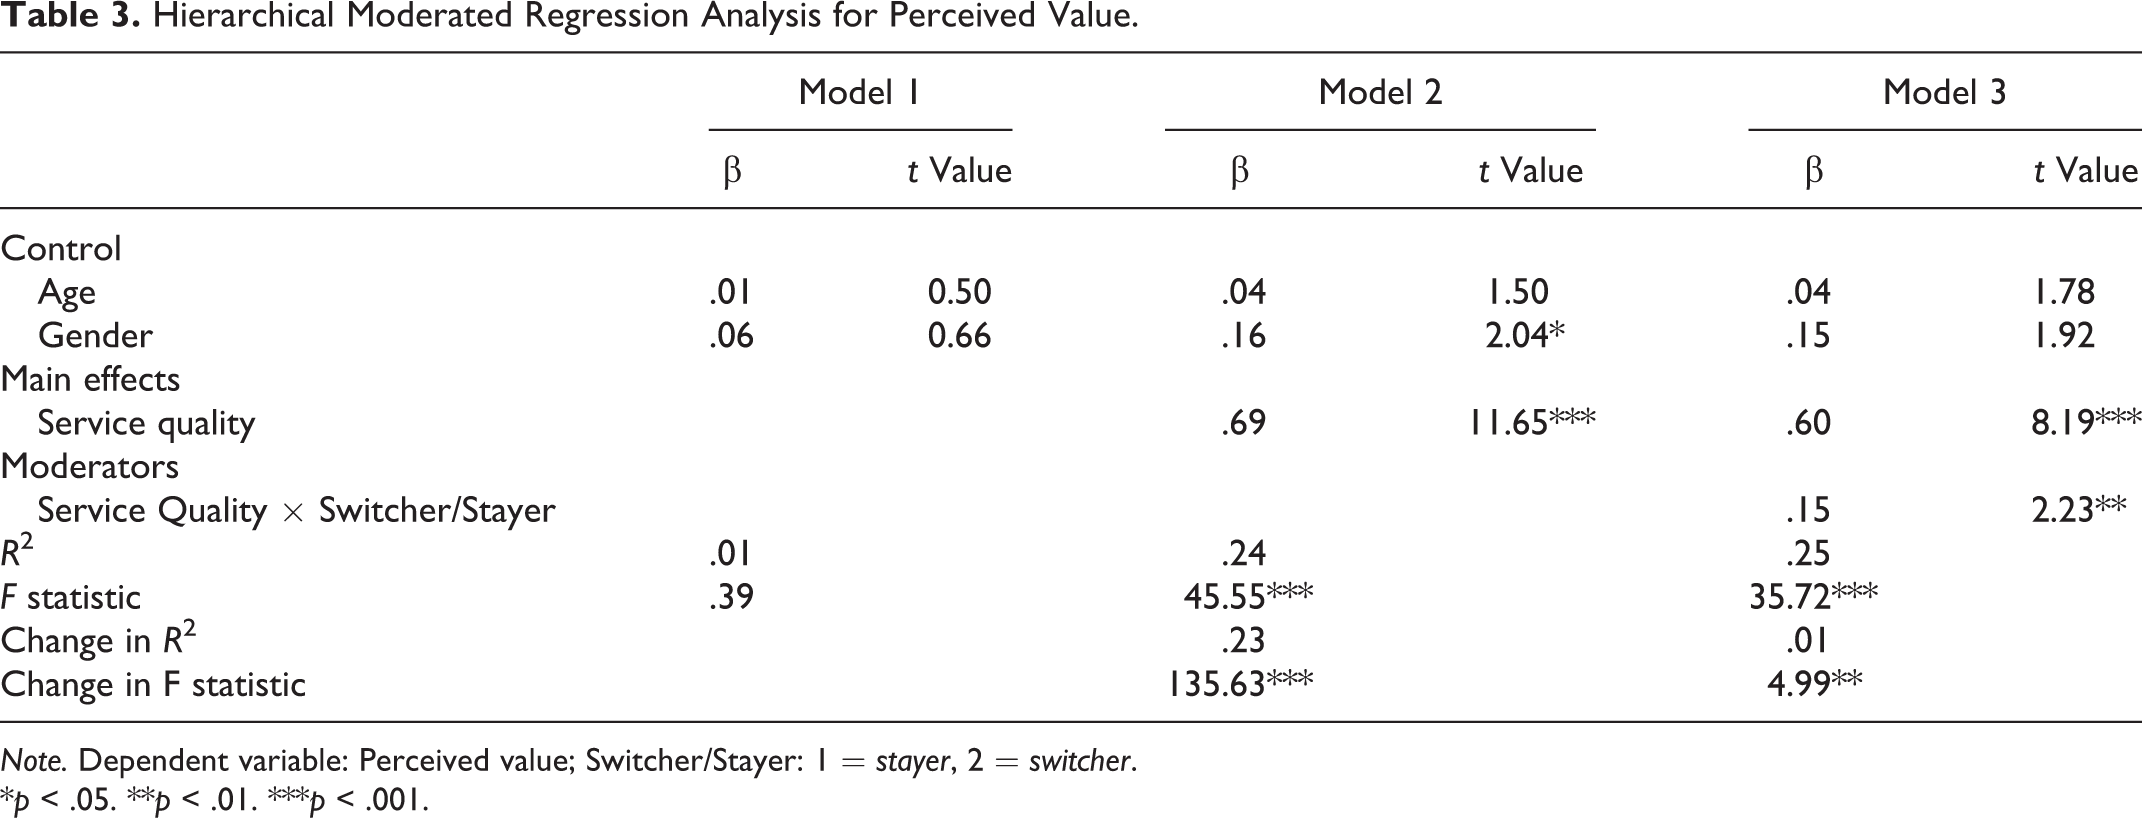
Note. Dependent variable: Perceived value; Switcher/Stayer: 1 = stayer, 2 = switcher.
*p < .05. **p < .01. ***p < .001.
The results presented in Table 3 show that the main effect (Service quality) has a direct effect on perceived value while controlling for gender and age. The standardized regression coefficient of service quality is .69 which is significant at p < .001; and the R2 for Model 2 is .24.
After adding the interaction term (Service Quality × Switcher/Stayer) into the model (Model 3) the main effect (Service quality) remains significant (β = .60, p < .001) and the interaction term (Service Quality × Switcher/Stayer) was found to have a significant positive impact on perceived value (β = .15, p < .01). This indicates that a positive change in service quality leads to stronger positive changes in perceived value for switchers than for stayers (Figure 2), thus supporting Hypothesis 1.
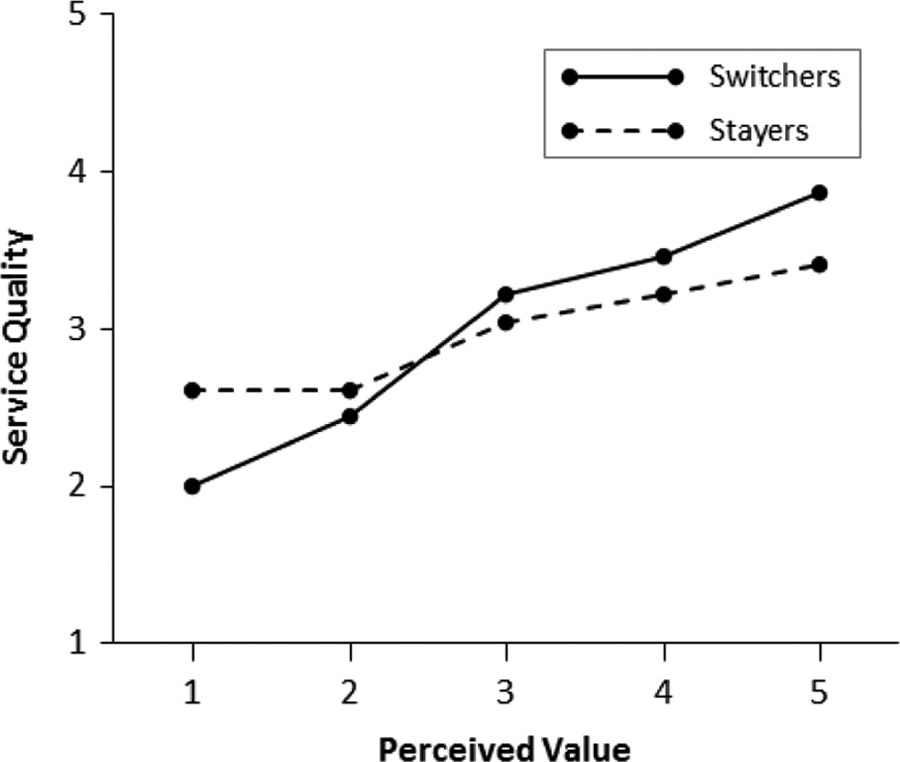
Service quality and perceived value: Interaction effects of Switchers/Stayers.
Given that our criterion variable is binary (refer/not refer), we used moderated logistic regression for the analysis to assess the moderating effects of switchers and stayers, on the relationship between (i) service quality and customer referral behavior and (ii) perceived value and customer referral behavior. This approach has been used in past studies for the identification of moderator variables in logistic regression models (e.g., Dawes 2009). Initially, we created multiplicative interaction terms (Service Quality × Switcher/Stayer) and (Perceived Value × Switcher/Stayer). The interaction terms were formed by multiplying the respective mean-centered variables. Thus, the probability of a customer engaging in an actual referral (in preference to nonreferral) is estimated as follows: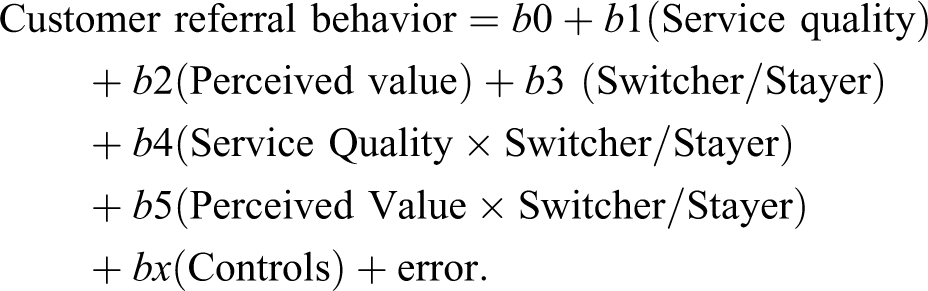
Table 4 reports the results of the moderated logistic regression. The probability of a customer referring and not referring was estimated for switchers and stayers for varying levels of service quality and perceived value, while controlling for gender and age. The model was found to be significant with χ2 = 390.77.648, p < .01, Nagelkerke R 2 = .45). The main effects of service quality (2.08, p < .001), perceived value (1.20, p < .001), and Switcher/Stayer (1.44, p < .001) were all found to be significant. The Service Quality × Switcher/Stayer interaction parameter is statistically significant (.24, p < .05). The positive interaction term indicates that the effect of positive changes in service quality on customer referral behavior is stronger for switchers than for stayers, thus, providing support for Hypothesis 2. Further, the interaction effect of Perceived Value × Switcher/Stayer (.46, p < .01) supports Hypothesis 3, demonstrating that positive changes in perceived value had a stronger positive effect on customer referral behavior for switchers than for stayers. The interaction effects for switchers and stayers are presented in Figures 3 and 4.
Moderated Logistic Regression for Customer Referral Behavior.
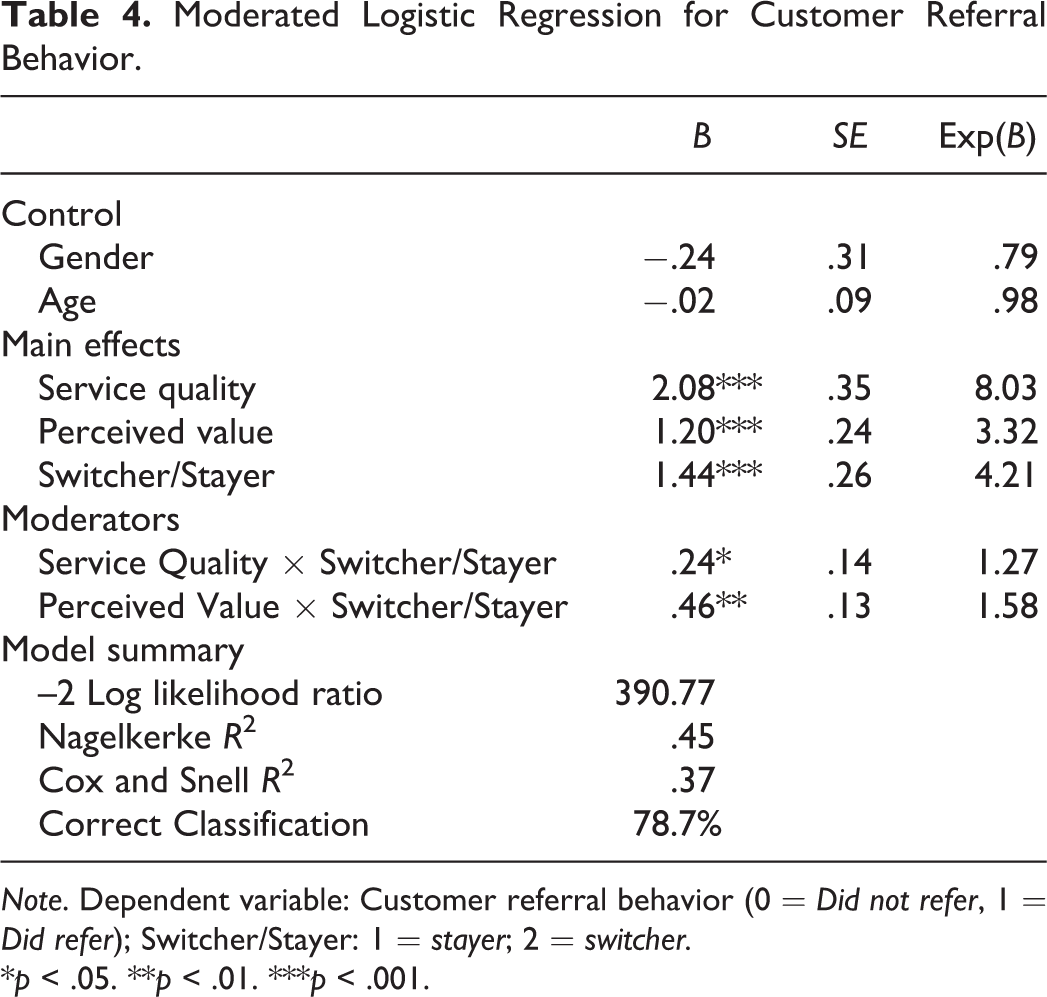
Note. Dependent variable: Customer referral behavior (0 = Did not refer, 1 = Did refer); Switcher/Stayer: 1 = stayer; 2 = switcher.
*p < .05. **p < .01. ***p < .001.
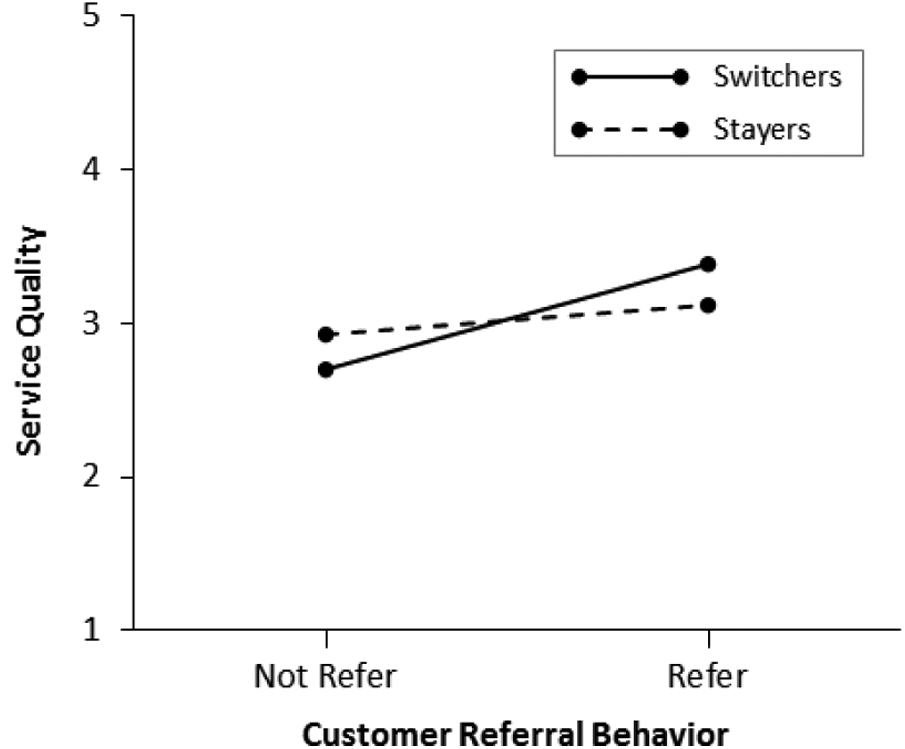
Service quality and customer referral behavior: Interaction effects of Switchers/Stayers.
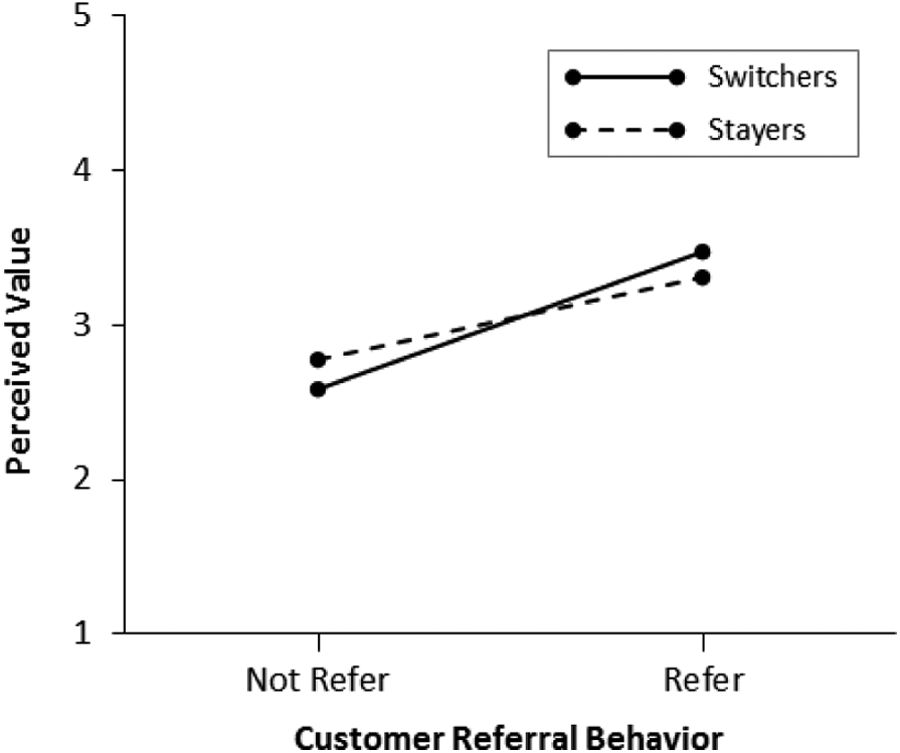
Perceived value and customer referral behavior: Interaction effects of Switchers/Stayers.
Discussion
The research presented in this study provides a much-needed perspective on the differences between switchers and stayers with reference to customer referral behavior. While past research has considered the differences between switchers and stayers (e.g., Chiu et al. 2005; Ganesh, Arnold, and Reynolds 2000; Wangenheim and Bayón 2004), research specifically examining whether customer referral behavior differs among switchers and stayers is limited. In this study, we examined the effects of positive changes in service quality and perceived value on actual customer referral behavior and found significant differences to exist between switchers and stayers. Specifically, positive changes in service quality and perceived value have stronger effects on customer referral behavior for switchers than for stayers. This could be explained by the fact that switchers enter a new relationship with a reduced expectations based on declining outcomes with a previous service provider and therefore evaluate their current service provider with lower expectations (i.e., reduced comparison level) than other customers (i.e., stayers). Thus, when switchers perceive an improvement in service quality and value, they exhibit more favorable attitudes toward the service provider compared to stayers and therefore engage in considerably more positive behavior toward the provider, such as customer referral. The direction of our finding for switchers and stayers is consistent with Ganesh, Arnold, and Reynolds (2000) and Wangenheim and Bayón (2004).
The phenomenon of the differences between switchers and stayers could also be explained through the zone of tolerance (Berry and Parasuraman 1991). Customer frustration and reduced customer loyalty occurs when a customer experiences a service performance level below the tolerance zone, while customers are pleased when they experience a performance level above the tolerance zone (Berry and Parasuraman 1991). Therefore, the zone of tolerance for switchers broadens as a consequence of their experience with prior service providers, while stayers have a relatively narrow zone of tolerance. This provides support for switchers to be more tolerant and evaluate their current service provider less rigorously compared to other customers (i.e., stayers).
Furthermore, different levels of customer expectations may lead to different levels of service evaluations, explaining the possible behavioral differences among switchers and stayers (Oliver 1980). Switchers are predominantly disconfirmation driven, as these customers evaluate their service provider through an implicit comparison based on prior expectations. On the other hand, stayers, who do not have experience with other service providers, may perceive higher switching costs and will stay with the service provider even when they are dissatisfied (Oliva, Oliver, and MacMillan 1992). By having lower expectations, switchers are more likely than stayers to have their expectations met or exceeded, making them more likely to engage in positive actions, such as referral behavior.
Our study makes several important theoretical and methodological contributions to the word-of-mouth and services marketing research. First, we extend the word-of-mouth literature by exploring customer referral behavior across two distinct two customer groups—switchers and stayers. While prior word-of-mouth research has examined the influence of service quality (Bloemer, de Ruyter, and Wetzels 1999; Boulding et al. 1993; de Matos and Rossi 2008; Harrison-Walker 2001; Zeithaml, Berry, and Parasuraman 1996) and perceived value (de Matos and Rossi 2008; Durvasula et al. 2004; Gruen, Osmonbekov, and Czaplewski 2006; Hartline and Jones 1996; Keiningham et al. 2007) on word-of-mouth behavior, surprisingly no research to date has considered how these relationships vary for switchers and stayers. Our study thus makes an important contribution by indicating the existence of significant differences between switchers and stayers with regard to customer referral behavior.
Second, the limited number of studies that have explored the differences between switchers and stayers within the services marketing literature (Chiu et al. 2005; Ganesh, Arnold, and Reynolds 2000; Peng and Wang 2006; Wangenheim and Bayón 2004) has predominantly drawn on cognitive dissonance theory (Festinger 1957) and expectancy-disconfirmation theory (Oliver 1980). We used comparison-level theory (Thibaut and Kelley 1959) as a theoretical foundation to explore the differences between switchers and stayers. Through this theoretical lens, we were able to foster a better understanding of switching behavior and determine how switchers assess their service provider in relation to their experience with their prior service provider.
Third, we used actual referral data to measure customer referral behavior rather than the more common approach of using referral intentions (e.g., Brown et al. 2005; Hartline and Jones 1996; Zeithaml, Berry, and Parasuraman 1996). This is a key methodological contribution of our study due to the paucity of research using actual company data to measure word-of-mouth behavior. Given that intentions do not necessarily translate into actual behavior, existing research using referral intentions as a measure of customer referral behavior may be overstated (de Matos and Rossi 2008; Kumar, Petersen, and Leone 2007).
Finally, our study examined the effects of changes in service quality and perceived value on customer referral behavior using data collected from two time periods to take into account the respondent’s baseline and comparison levels. This is a noteworthy methodological contribution of our study, since the majority of studies that examine customer referral and its antecedents rely exclusively on cross-sectional data, which does not offer the same insight into the dynamics of customer relationships with a firm as a longitudinal design (Wang 2009). A cross-sectional approach does not reflect the true impact of customer attitudes on customer outcomes (Bernhardt, Donthu, and Kennett 2000). This is especially important to consider in the services context as cross-sectional studies do not generally consider customer comparison levels of alternatives (Liljander and Strandvik 1993), zones of tolerance (Berry and Parasuraman 1991), and service improvements (Kandampully 1998).
Implications and Limitations of the Study
Customer referral plays an important role in enhancing firm value through cost-effective acquisition of new customers. In view of this, service managers should be continually seeking strategies to enhance customer referral behavior from their existing customer base. Toward this end, it is important for service managers not only to consider the drivers of customer referral behavior but also to understand the differences between switchers and stayers.
While we show that referral behavior is predominantly driven by evaluations of service quality and perceived value for both switchers and stayers, the effects are significantly stronger for switchers. This highlights that investment in service quality and value improvements yields significantly higher returns (through actual customer referrals) for switchers than for stayers. Thus, it is important for managers to identify and target newly acquired customers (who have switched from a different service provider) with service offerings that signify “service quality” and “value” at the early stage of the relationship to foster customer referrals. In order to improve the quality of service in the employee-customer interaction, service managers should focus on investing in the development of customer service operations through human resource practices. Furthermore, given that the reliability and performance of the service is critical in customers’ service quality evaluations, service providers must ensure that their service offering is consistently of high quality and meets the expectations of their customers. Improving service quality also contributes to the value perceived by customers. Therefore, service managers need to ensure that customers, in particular switchers, recognize value in the service offering, which means not only providing exceptional service quality but also offering value in terms of low prices, customer privileges, convenience, and loyalty programs.
An improved evaluation of services and value not only leads to referral behavior but can also translate into future sales, revenues, and profits (Mittal and Frennea 2010) through newly referral-acquired customers. Such referral-acquired customers have been found to be more profitable and loyal (Schmitt, Skiera, and Van den Bulte 2011) than customer acquired through other channels. Thus, it is imperative for firms to continually drive referral behavior through the effective management of service quality and value for switchers and stayers.
While this study has provided promising insights into the customer referral behavior of switchers and stayers, it has several limitations and directions for future research. This research has examined only one service provider in one country, thus limiting the generalizability of the results. Future research could replicate this study in other industries and countries, possibly with larger samples, to provide a deeper differentiation between switchers and stayers. Furthermore, future studies could broaden this work by considering other variables such as contextual factors (e.g., switching barriers) and relationship variables (e.g., relationship quality) that could influence customer referral behavior.
While we were able to capture actual customer referral behavior from company transaction records, the information provided was limited to only successful referrals. There may be cases of customers who spread the word to many other peers but none adheres. These unsuccessful referrals have not been captured in our study. Similarly, we were unable to measure the number of successful referrals made by each customer. We treated all successful referrals equally, independent of the number of successful referrals made by the customer. These aspects should be considered for future research on customer referral behavior. Notwithstanding these limitations, we hope the contribution of our study will provide impetus to further research in this area.
Footnotes
Declaration of Conflicting Interests
The author(s) declared no potential conflicts of interest with respect to the research, authorship, and/or publication of this article.
Funding
The author(s) received no financial support for the research, authorship, and/or publication of this article.
References
Supplementary Material
Please find the following supplemental material available below.
For Open Access articles published under a Creative Commons License, all supplemental material carries the same license as the article it is associated with.
For non-Open Access articles published, all supplemental material carries a non-exclusive license, and permission requests for re-use of supplemental material or any part of supplemental material shall be sent directly to the copyright owner as specified in the copyright notice associated with the article.