
Abstract
The meetings, incentives, conventions, and exhibitions (MICE) industry has evolved into a vital sector of business tourism. The vast majority of research to date has focused on the convention/meeting sector, with studies on convention site selection being especially prominent. In contrast, the exhibition sector and particularly, exhibition destination attractiveness, have received relatively little research attention. This study aims to address this research gap by examining, from the exhibitors’ perspective, key factors for an attractive and successful exhibition destination. Based on 616 survey responses from exhibitors collected at nine trade fairs in four cities in Mainland China, study findings highlighted the critical importance of two types of cluster effects—“host city leadership in the industry” and “host city/region as a source of exhibitors”—to an exhibition destination’s attractiveness for exhibitors. Accessibility, venue facilities, and the destination’s leisure and economic environment were considered less important. Implications of the study results are discussed and directions for future research provided.
The meetings, incentives, conventions, and exhibitions (MICE) industry has evolved into a vital sector of business tourism, following significant growth in the past decades. It is increasingly recognized by governments as highly lucrative (Jago & Deery, 2010; McCabe, 2008). Both trade and consumer exhibitions, like meetings and conventions, are business events that potentially grow to be attractions, catalysts, animators, place marketers, and image makers to a destination that can enhance its tourism industry (Getz, 2008). Interest in the value of business events has been intense for the past decade in particular so that now almost all major cities have invested in state-of-the-art convention and exhibition facilities, together with relevant bodies devoted to selling the space and bidding for events (Weber & Ladkin, 2011).
Concurrently, there has been a significant increase in research related to this important industry that generates substantial economic and noneconomic benefits for destinations around the world. The vast majority of research to date has focused on the convention sector (Lee & Back, 2005; Yoo & Weber, 2005), with conventions being defined as “formal assemblies attracting a large number of people for a common or specific purpose” (Kirchgeorg, 2005, p. 35) that sometimes, but not always, incorporate an exhibition to showcase products of relevance and interest to convention attendees. However, the focus of this study is on exhibitions that rather than being part of conventions, are stand-alone events held regularly at a fixed location with the primary purpose of exhibiting products relating predominantly to a single industry.
In contrast to the convention sector, the exhibition sector has received relatively little research attention. Jin’s (2010) review of the major studies on exhibitions published in English language trade, marketing, and hospitality journals during the period from 1974 until 2010 reveals that studies relating to exhibition selection, performance, management, and effectiveness evaluations from the perspective of exhibitors have received most research attention. There are a number of studies on visiting objectives and ongoing search behavior (e.g., Godar & O’Connor, 2001; Smith, Hama, & Smith, 2003), yet studies from the visitors’ perspective are relatively few in number. Studies from the organizer and venue perspective are rare (e.g., Luo, 2007), with studies focusing on the perspectives of other stakeholders being even less. It is also apparent that the spatial distribution of exhibitions and exhibition destination attractiveness are underresearched. Yet a destination’s attractiveness is a key component contributing to the success of an exhibition, together with the exhibition event itself, the exhibition organizer, and the exhibition venue (Sasserath, Wenhart, & Daly, 2005). Destination/venue attractiveness and the event together form an integrated exhibiting experience for exhibitors, forming a synergistic relationship with exhibition development. It is a key factor for exhibitors, as well as visitors, when making decisions on whether or not to participate in an exhibition.
Mainland China presents a suitable setting to examine the various dimensions of exhibition destination attractiveness for two reasons. First, there is its exhibition industry’s current size and future growth potential, following rapid growth in the past decades (Jin, Weber, & Bauer, 2010). It is regarded as a valuable resource in showcasing the country’s economic vision, has a tangible positive impact on local revenues, and plays a significant role in promoting success for Chinese brands in a global market, in addition to the direct value of its own commercial success (Reed, 2007). In 2007, China’s indoor exhibition space amounted to 2,516,581 square meters, the third highest in the world after the United States and Germany (UFI, 2007) whereas revenue generated from exhibitions was estimated at approximately US$ 1.7 billion in 2005, with exhibition center revenue totaling US$ 373 million (Kay, 2007). In view of anticipated growth rates of China’s economy of 7% to 9% per annum for another two to three decades (Holz, 2008), demand for exhibitions in Mainland China is expected to rise concurrently. Second, China’s exhibition industry is based on the German exhibition model whereby exhibition development is closely linked to the development of industrial clusters (Kirchgeorg, 2005). Furthermore, numerous international exhibition organizing companies, such as AUMA 1 member companies Reed Exhibitions and UBM have brand-name trade shows not only in China but also in numerous other countries around the world. Thus, China’s exhibition industry shares similarities with many other exhibition destinations that are also based on the German exhibition model.
Based on city size, prestige, economic strength, tradition, and history in hosting exhibitions, and the number of exhibitions hosted per annum, Shanghai, Beijing, and Guangzhou are typically classified as first-tier cities in the exhibition sector in China whereas provincial capital cities or economically developed cities striving to develop the exhibition industry are classified as second-tier cities (e.g., Chan, 2008; Guo, 2007). Shanghai, Beijing, and Guangzhou dominate the market, with the number of exhibitions in these cities increasing. Many state-of-the-art facilities in second-tier cities across the country are underutilized, with exhibitions fluctuating and positioning of these cities being more challenging, as noted by Jin, Bauer, and Weber (2010).
Given the significance of the exhibition industry for many destinations around the world, and the development state of the exhibition industry in Mainland China, this study aims to address the current gap in research by examining exhibitors’ perceptions of exhibition destination attractiveness. In the context of Mainland China’s exhibition industry, two research questions in particular will be addressed, namely
What constitutes destination attractiveness for an exhibition destination from the exhibitors’ perspective?
Do first- and second-tier destinations perform differently with regard to destination attractiveness factors from the exhibitors’ perspective?
Literature Review
Convention and Exhibition Site Selection
Numerous studies have identified convention site selection variables and their relative perceived importance. Factors affecting site selection decisions can be broadly divided into site-specific and association factors (Weber & Chon, 2002). Go and Zhang (1997) classified the convention site selection criteria into two primary categories: (a) destination environment (capacity) and (b) meeting facilities. Thus, the destination environment, meeting facilities, and association factors form the three key constructs in convention site selection from the meeting planners’ perspective. Many convention studies empirically verified the destination being an important consideration for convention attendees. Oppermann (1996) first discussed the relationship between destination image and convention site selection. Baloglu and Love (2005) established the link between the perceived cognitive, affective, and overall image of five cities in the United States by association meeting planners and their site selection intention. The perceived image of the cities includes perceived restaurant/retail accessibility, facilities, logistics, city image, and the support and services from the Convention and Visitors Bureaus (CVBs). Chacko and Fenich (2000) aimed to quantify the influence and importance of specific destination attributes in the overall destination image for seven convention cities in the United States. They found that image is the result of a city’s attractiveness, based largely on its physical attributes, and that location is a critical factor in determining success whereas the promotional appeal is a significant contributor to overall destination image. In a subsequent study, Fenich (2001) proposed a conceptual framework that may be used by a community or a convention center to benchmark itself against immediate competitors. Bookable hotel rooms, restaurants, the size of the convention center, air service, local transportation, cost, climate, safety/security, and the prosperity of the community were the primary categories of this framework.
Following a comprehensive review of the literature on convention site selection, Crouch and Ritchie (1998) identified eight key dimensions considered in the site selection process by association meeting planners, namely (a) accessibility, (b) local support, (c) extra-conference opportunities, (d) accommodation facilities, (e) meeting facilities, (f) information, (g) site environment, and (h) other criteria. Subsequently, Crouch and Louviere (2004) established that the venue cost, food quality, plenary rooms, on-site/off-site accommodation, and participant proximity are the five most important attributes influencing convention site selection of meeting planners. More recently, Lee and Back (2008) examined factors affecting brand satisfaction and attitudinal brand loyalty of convention attendees. Their findings confirm that convention site selection has a significant, positive impact on (convention) brand satisfaction, which results in attitudinal brand loyalty (Chaudhuri & Holbrook, 2001).
Although the vast majority of studies have focused on an assessment of first-tier destinations, Nelson and Rys (2000) analyzed a number of factors especially relevant to the attractiveness of smaller convention destinations (second-tier cities) in the United States. They concluded that a lack of direct air access and clear destination image constrained the development of smaller cities as potential convention sites, although affordability, friendliness of staff and local people, quality food service, shopping opportunities, and centrality of sites might help second-tier convention destinations to attract local/regional association business. In short, convention site selection variables and their relative perceived importance are well established, in contrast to exhibition destination attractiveness.
Considering the “promotable” (Hedorfer & Todter, 2005, p. 119) nature of travel to an exhibition, relating to its program, venue, and host destination, factors that affect convention selection are likely to also have a certain impact on exhibition selection decisions. Both conventions and exhibitions potentially provide host destinations with business and income, investment and sponsorship, tax revenue, employment and training, increased business opportunities, an improved destination image, and increased visitor numbers. Thus, literature on decision making for convention participation, site selection, and convention feasibility is conducive to understanding similar aspects in exhibition organization and site selection. However, exhibitions are business events that are fundamentally different from conventions in a number of ways, namely (a) the location for conventions is usually not fixed whereas it is for trade exhibitions; (b) for conventions, there is only one group of participants targeted by the event organizers, that is, convention attendees (or delegates) whereas in exhibitions, there are two groups who attend and are targeted by the event organizer—exhibitors and exhibition visitors (or buyers)—with the relationship between the two parties potentially influencing exhibition participation; (c) educational and networking opportunities regardless of the convention location are critical for convention attendees whereas business transactions and information exchange serve as the primary purpose for exhibition attendees; (d) exhibitions often involve a display of goods, with a requisite construction of exhibition booths, and thus, logistics is a major concern for both organizers and exhibitors, and (e) costs for convention attendees are generally the same, given the set registration fees. In contrast, fees to participate in an exhibition can differ greatly for exhibitors and visitors (Blythe, 1999), with exhibitors in particular paying different fees depending on their booth size and location. Most important, numerous authors emphasize the impact of economic attributes of a destination, such as “market leadership,” “composition of the regional industry,” “industry fragmentation,” and “economic concentration” (Fuchslocher, 2005; Hedorfer & Todter, 2005; Rubalcaba-Bermejo & Cuadrado-Roura, 1995) on destinations being successful exhibition hosts.
Exhibition Destination Attractiveness
Several studies have discussed the impact of “location” on exhibition cultivation and attendance. For example, Hedorfer and Todter (2005) identified the following advantages of Germany as a destination for promotable business travel: central location in Europe, scenery, town development and history, accommodation variety and facilities, shopping and food provision, market leadership, services, high standard of infrastructure, and excellent public transport. Fuchslocher (2005) pointed out that location has considerable influence on the success of exhibitions. He argued that exhibitors would not acknowledge the merit of location factors but would react both immediately and negatively to problems resulting from location factors.
Rubalcaba-Bermejo and Cuadrado-Roura’s (1995) study represents a key study that examines and empirically confirms the relationship between urban hierarchies and exhibitions distribution. Using data from 140 fair-hosting cities in Europe, they aimed to identify the relationship between exhibition development and city characteristics. Data used included the number of fairs, sectors represented, direct exhibitors, visitors, direct foreign exhibitors, and foreign visitors, in addition to net rented area. They noted that a set of varying destination factors explains why some destinations are more attractive exhibition hosts than others. These factors include (a) tradition and history, (b) local income and population, (c) infrastructure and communication availability, (d) location, (e) tourism, environmental, and weather conditions, (f) public investment and support policies, (g) the city’s international standing, (h) exhibition center size, and (i) the composition of the regional industry. Another finding was that the size of exhibitions in a city depends on industry fragmentation and sector specialization. Bigger cities have a greater number of fairs and a higher level of sector diversification. Interestingly, they found that exhibition size and internationalization may be noncorrelated in European trade exhibitions. Big exhibition-hosting cities compete with one another within the different combinations of size and internationalization. As they grow, cities tend to enhance their international position. Although Rubalcaba-Bermejo and Cuadrado-Roura’s study provided a comprehensive list of success factors for exhibition destinations, these factors were not the focus of their study, and thus, the importance of these factors was not examined.
Integrating destination attributes discussed in the convention site selection and exhibition literature, the following dimensions are identified that are potentially important for a destination to be competitive as exhibition host: (a) accessibility, (b) exhibition facilities, (c) accommodation, (d) city leisure environment, (e) local support/policies, (f) composition of the regional economy, (g) tradition and history, (h) local income and population, (i) international prestige, and (j) local support and policies. In addition, more recently, Jin (2010) introduced the construct of “clusters” into the exhibition destination attractiveness context, drawing on Porter’s (1998) cluster theory. Cluster theory traces its origin to the notion of “industrial districts” discussed by Marshall (1966, p. 225), which refers to a “concentration of small businesses of a similar character in particular localities.” Porter’s (1998, p. 197) cluster theory renewed worldwide interest in industrial districts, with clusters being defined as “geographic concentrations of interconnected companies, specialized suppliers, service providers, firms in related industries, and associated institutions in particular fields that compete but also cooperate.” He points out that “the roots of productivity lie in the national and regional environment for competition” (1998, p. 7) and the “presence of clusters suggests that much competitive advantage lies outside a given company or even outside its industry, residing instead in the locations of its business units” (1998, p. 198). Cluster advantages relate to colocation and localization externalities, such as specialized labor markets and infrastructure (Enright, 2003; Gordon & McCann, 2000) and interactive learning and knowledge creation (Maskell, 2001; Wolfe & Gertler, 2004). Enright (2003) pointed to a significant impact of clusters on corporate performance, regional economic development, and national competitiveness. Clusters, as concentrations of businesses in particular localities, may explain the spatial distribution of exhibitions (Rubalcaba-Bermejo & Cuadrado-Roura, 1995). Accepting this notion, and based on in-depth interviews with 32 exhibitors, Jin (2010) advanced nine measurement items to capture the cluster effect in the context of exhibitions. These items were subsequently subjected to purification by an expert panel that consisted of three prominent exhibition organizers and four academics who are actively involved in event-related research. They were then pilot tested and confirmed at an exhibition in Guangzhou, which collected 216 responses. These measurements are used in the context of this study to further advance our understanding of exhibition destination attractiveness.
Based on the review of literature covering convention site selection, exhibition destination attractiveness, and China’s exhibition industry, this article proposes the following hypothesis and proposition:
Hypothesis 1: Exhibition destination attractiveness is a second-order construct composed of six factors: (a) cluster effect, (b) venue facilities, (c) accommodation, (d) economic environment, (e) city leisure environment, and (f) accessibility.
Proposition 1: First- and second-tier cities in China perform differently pertaining to destination attractiveness factors from the exhibitors’ perspective.
Method
This research employed a quantitative approach and collected 616 responses via a face-to-face survey method from exhibitors exhibiting at nine trade exhibitions hosted in four cities in Mainland China—Shanghai, Hangzhou, Nanjing, and Wuhan. As previously noted, Shanghai, Beijing, and Guangzhou are the key first-tier cities in the exhibition market in China. Shanghai and Guangzhou respectively lead two exhibition-active industrial belts—the Yangtze River belt and the Pearl River belt, with a number of second-tier cities located within or near these belts. Since the pilot test was conducted in Guangzhou, the focus of the main survey was on the Yangtze River belt. As a key purpose of the study was to compare perceptions of destination attractiveness of first- and second-tier cities, Shanghai was selected as a first-tier city, and Hangzhou, Nanjing, and Wuhan as second-tier cities. The lack of second-tier cities near Beijing resulted in this city being considered unsuitable for the study.
Sampled exhibitions were selected based on availability, organizer, and host destination category, geographical location and dates. These exhibitions were of diverse ownerships, namely (a) government-owned, (b) local entrepreneur and local industry association-owned, (c) foreign exhibition company-owned, and (d) joint partnerships. They also covered varied industry sectors, thus the representativeness of the population is enhanced, with non-observation error being low. The sample size was determined based on the purpose of this study to collect a heterogeneous sample and the requirement of the statistical analysis methods used.
The development of the instrument followed Churchill’s (1979) approach. Measurements were adapted from the destination attractiveness/convention site selection literature. Destination infrastructure, accessibility, and environment indicators were mainly adapted from Lin, Morais, Kerstetter, and Hou (2007) and Chi and Qu (2008). Destination business environment items were based on Enright and Newton (2005) while items measuring venue facilities were mainly based on the opinions of the interviewed exhibitors, although Jung (2005) served as an additional reference. The construct “cluster effect” follows the definition of Porter (1998) and Enright (2003), with measurement items adopted from Jin (2010). Although a number of studies have used exploratory factor analysis (EFA) to classify destination-related items, these studies are not congruent in terms of measurement items, and different labels were given to name the emergent latent factors in different studies (e.g., Chi & Qu, 2008; Lin et al., 2007). Thus, measurement items adapted from the literature were subjected to purification and validation via EFA.
The questionnaire was developed in both English and Chinese to cover both international and domestic (Chinese) exhibitors. The questionnaire was first developed in English, then translated into Chinese and finally, translated back into English, adopting a back-to-back translation procedure (Chapman & Carter, 1979). The translations were compared, any discrepancies discussed and resolved, with questionnaires being revised accordingly. Two professional interpreters were employed for this task; both were native Chinese speakers with many years of professional experience. A 7-point Likert-type scale indicating a level of agreement ranging from 1 (strongly disagree) to 7 (strongly agree) was used for all measurements. With the support of exhibition organizers, 24 survey helpers conducted face-to-face surveys on-site under the supervision of the lead author. They were assigned to different halls in an exhibition and instructed to cover both bigger and smaller booths. One exhibition booth was treated as one interviewee. Questionnaire completion took around 15 to 20 minutes. The response rate ranged from 70% to 90% in different exhibitions.
EFA, confirmatory factor analysis (CFA), and independent sample t tests were used for data analyses employing SPSS 17.0. EFA and CFA were conducted following a general practice of using a calibration and validation sample respectively (Hair, Anderson, Tatham, & Black, 2006), obtained by randomly splitting the data into two data sets with equal numbers. Differences in perceptions of destination attractiveness variables were assessed between exhibitors exhibiting in the first-tier city (Shanghai) versus exhibitors exhibiting in second-tier cities (Hangzhou, Nanjing, and Wuhan). Independent sample t tests were conducted at the factor level, based on the EFA results.
Results
Respondent Profile
Table 1 provides the sample profile both at the aggregate and venue-specific level, as the latter can disclose more detailed information about the participants in each sampled exhibition. At the aggregate level, about half of the sample was from medium-sized enterprises with 50 to 300 employees. Smaller enterprises with less than 50 employees and larger enterprises with more than 300 employees accounted for approximately 25% each, although this differed slightly among the sampled exhibitions. About one third of the respondents were first-time exhibitors, yet again, this figure fluctuated among different exhibitions. In terms of annual exhibition attendance in China, aggregately, more than 60% of firms attended more than two exhibitions per annum. As for global exhibition attendance, almost 50% of firms exhibited at least twice per annum at overseas exhibitions. The frequency with which firms in China exhibit both domestically and internationally indicates that they are actively seeking exhibiting opportunities, which is not restricted to first-tier cities in China.
Sample Characteristics
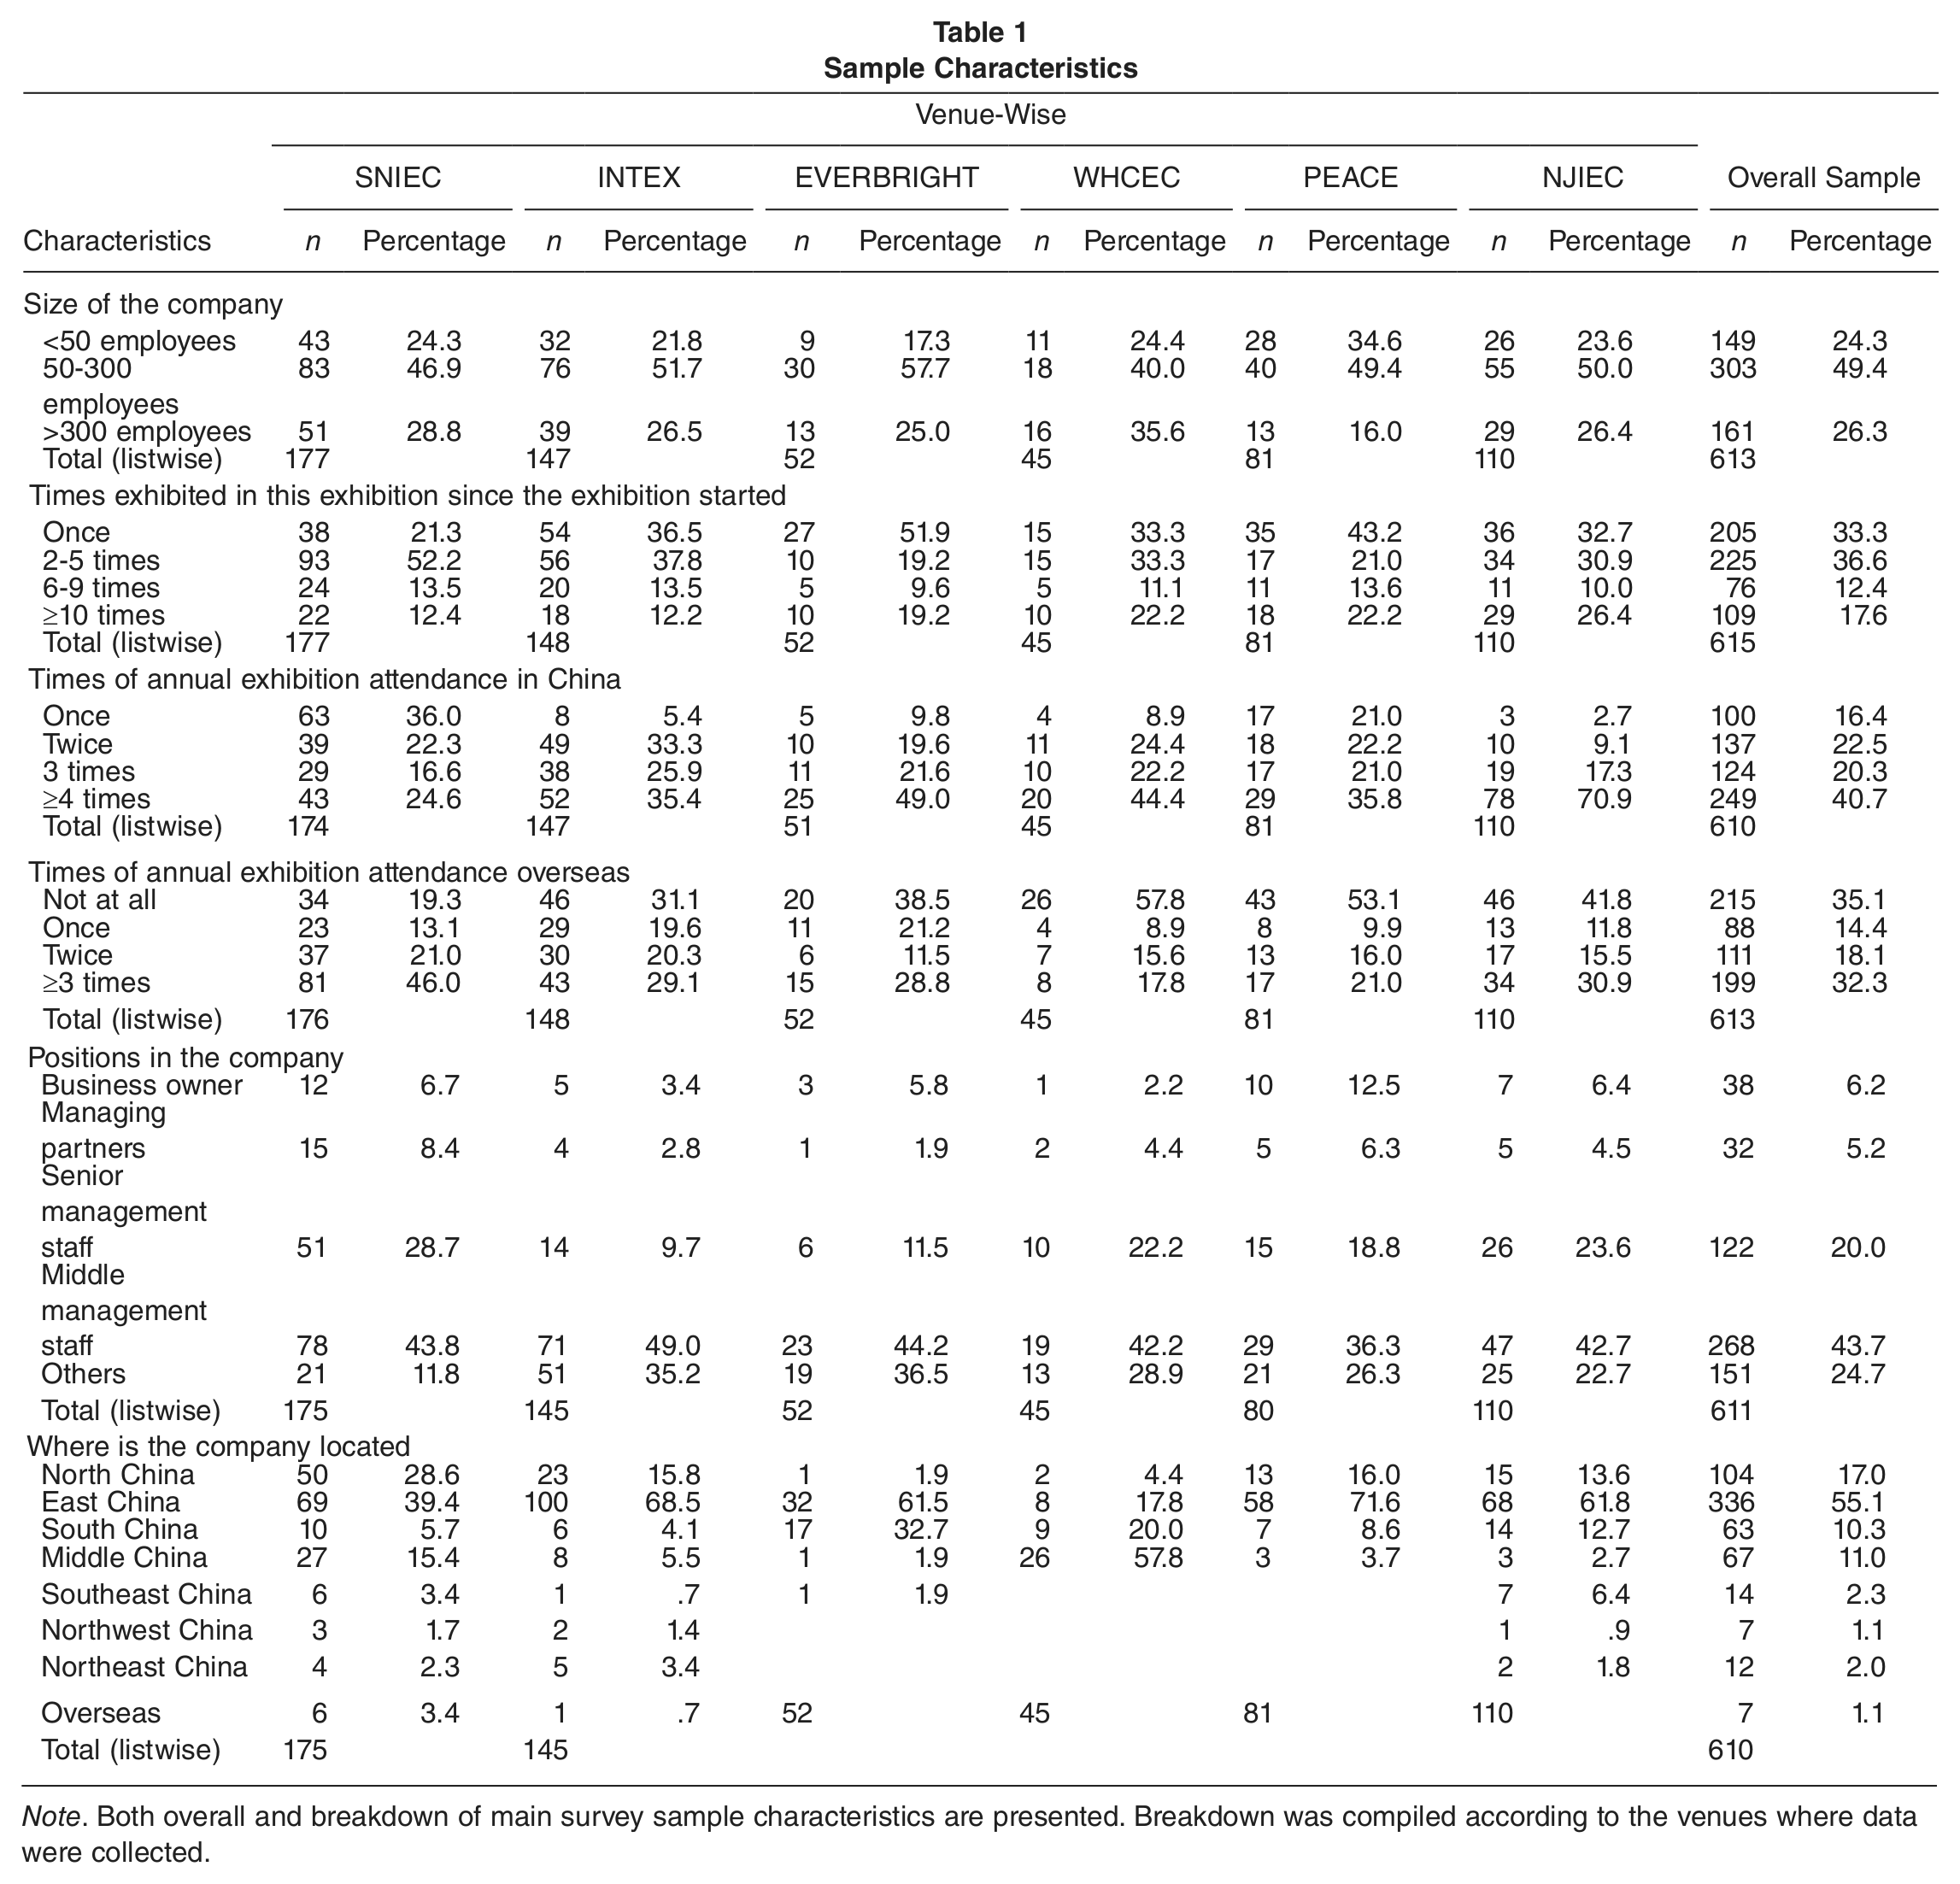
Note. Both overall and breakdown of main survey sample characteristics are presented. Breakdown was compiled according to the venues where data were collected.
Exploratory Factor Analysis of Destination Attractiveness
Using a calibration sample, EFA was employed to assess the dimensionality of the destination attractiveness construct. Tests for reliability (Cronbach’s alpha) for each dimension were performed to ensure the quality of measurements (Churchill, 1979). A value greater than .9 is considered excellent, greater than .8 is regarded as good, whereas a value greater than .7 is acceptable (Field, 2005). The Kaiser–Mayer–Olkin measure of sampling adequacy (KMO) and Barlett’s Test of Sphericity examine the adequacy of sample size and validity of the correlation matrix; KMO values between .7 and .8 are considered good, values greater than .8 are judged great (Field, 2005). The EFA test met all the criteria and the result was a six-factor solution, explaining 61.4% of the total variance. These six factors were labeled destination leisure environment, Cluster Effect 1 (leadership of the host city in the industry), venue facilities, accessibility, Cluster Effect 2 (host city/region as a source of exhibitors), and destination economic environment. Table 2 summarizes the results of the EFA. Next, factors and indicators identified by the EFA were used for first-order CFA analysis.
Exploratory Factor Analysis Results: Destination Attractiveness
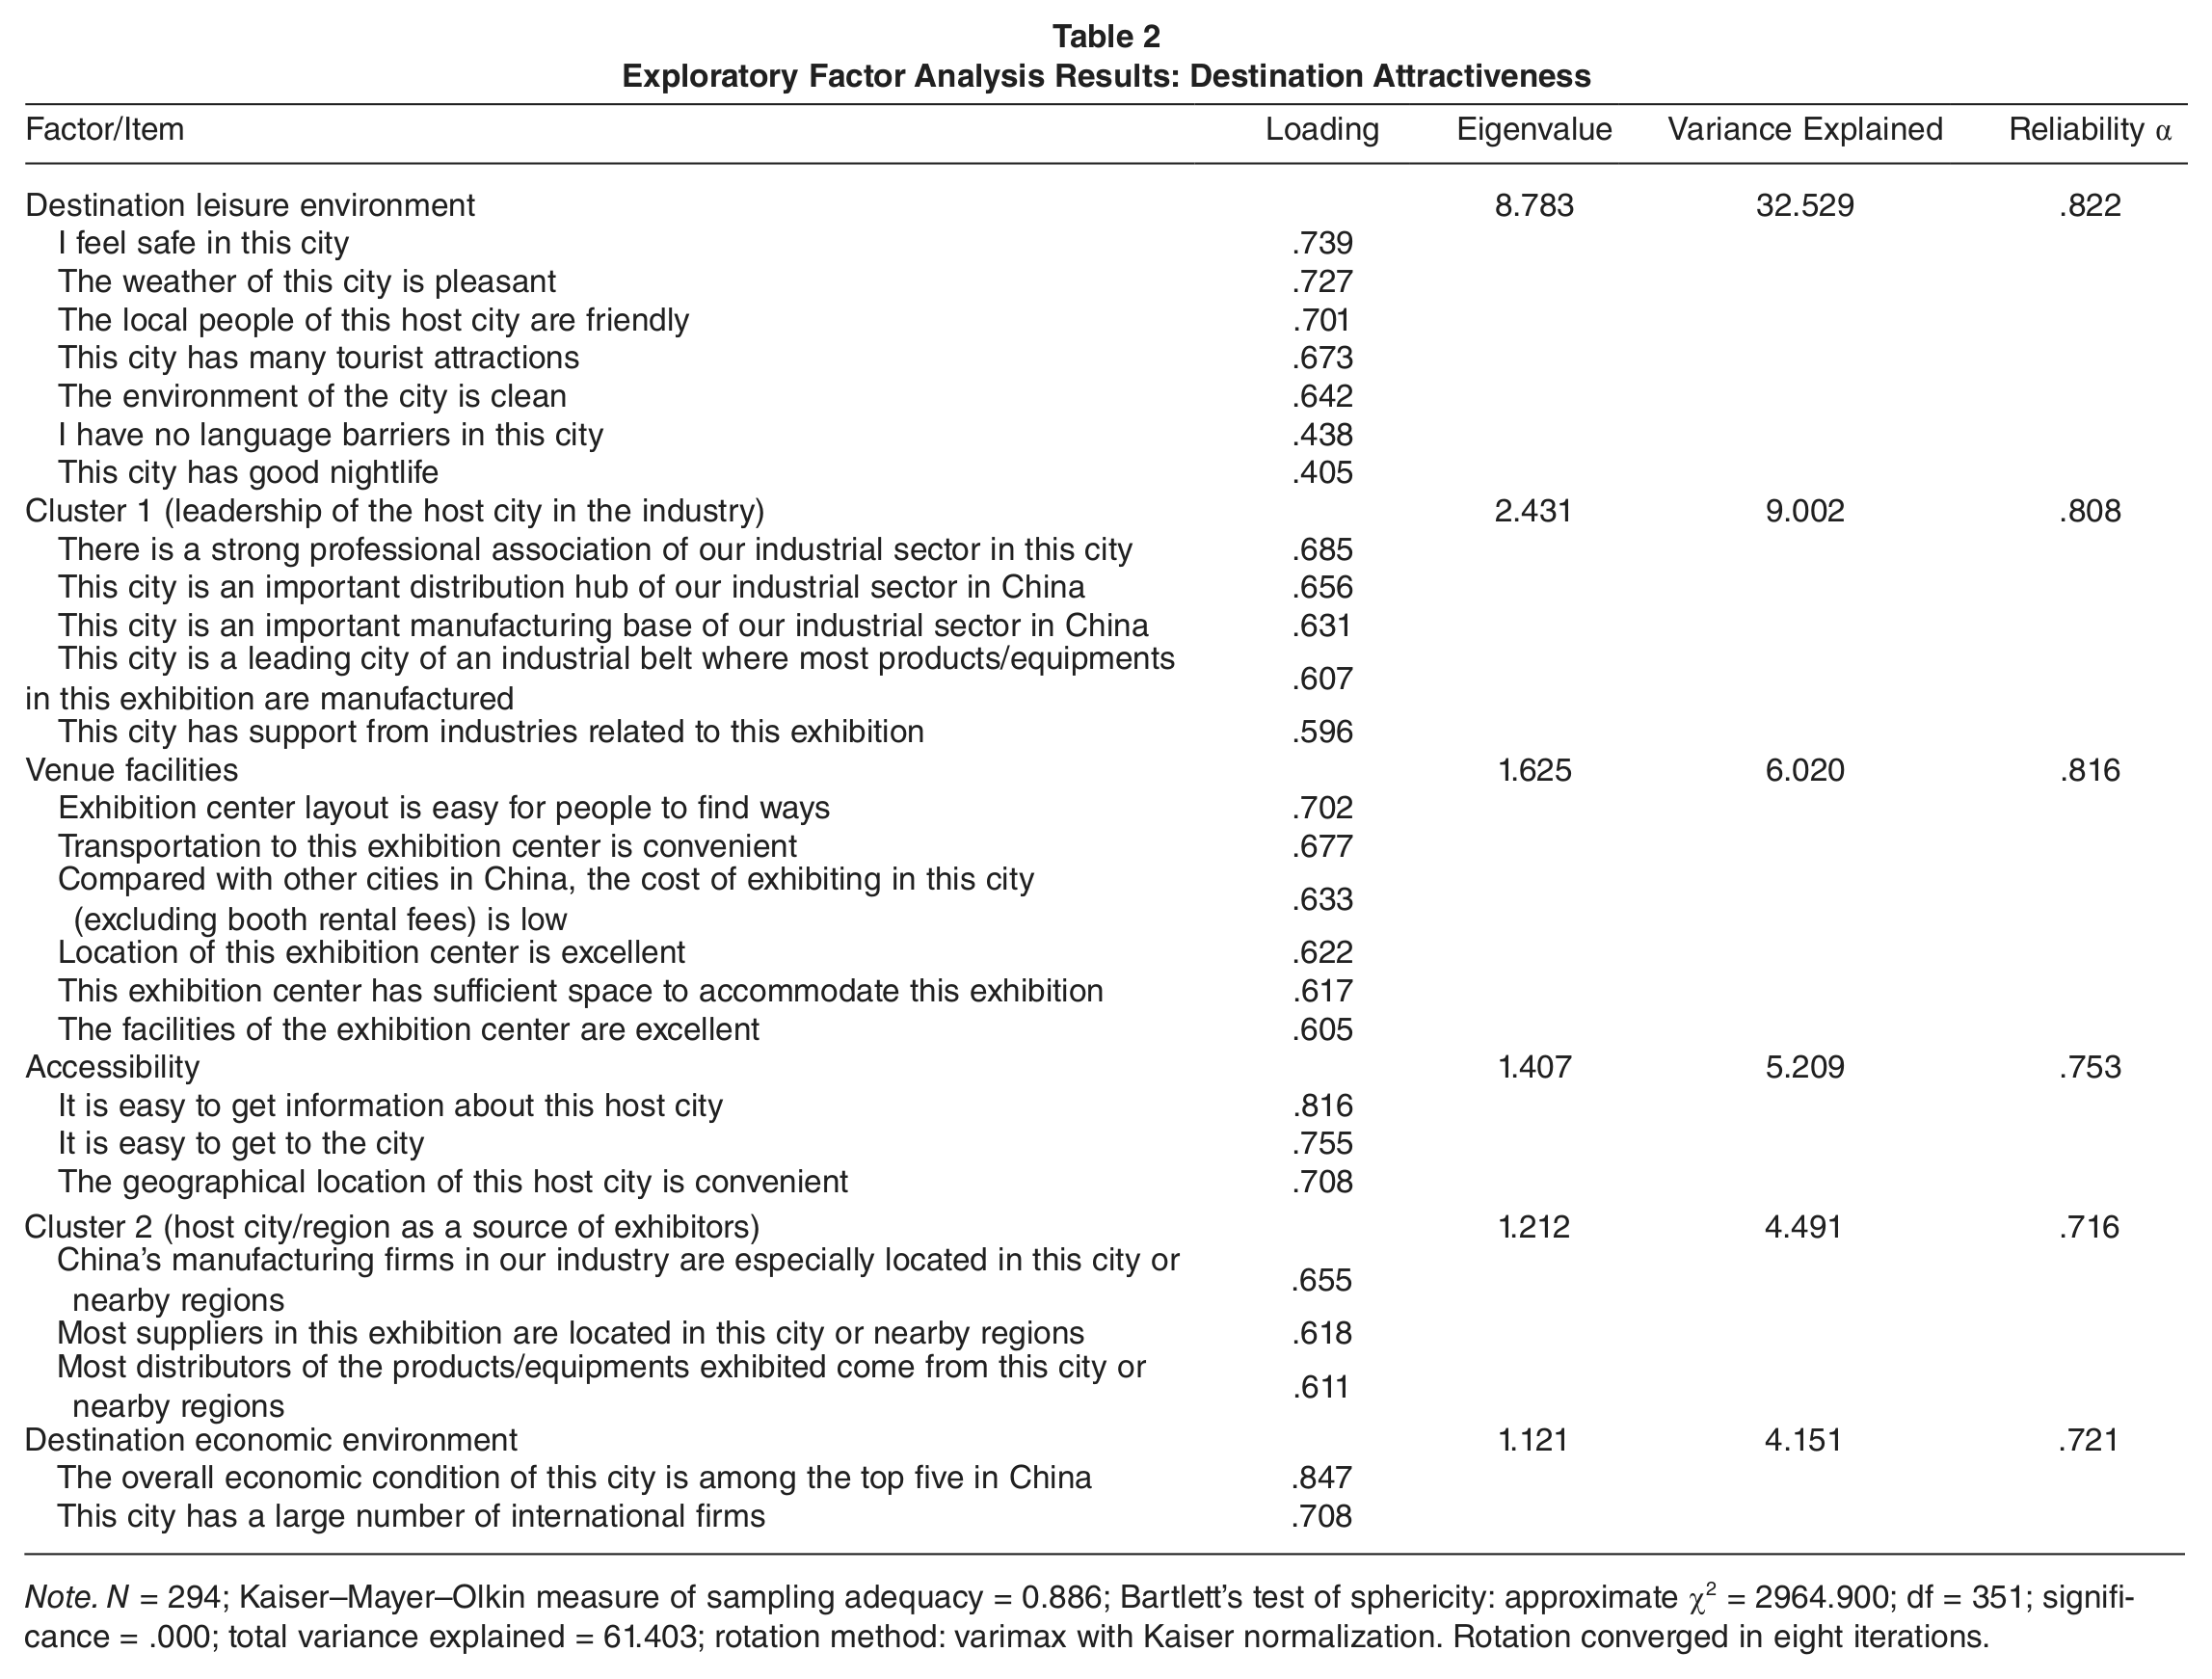
Note. N = 294; Kaiser–Mayer–Olkin measure of sampling adequacy = 0.886; Bartlett’s test of sphericity: approximate χ2 = 2964.900; df = 351; significance = .000; total variance explained = 61.403; rotation method: varimax with Kaiser normalization. Rotation converged in eight iterations.
First-Order Confirmatory Factor Analysis of Destination Attractiveness
Based on the EFA result, a first-order CFA model for destination attractiveness was first tested (Table 3) on a validation sample. Standard factor loadings, t values, squared multiple correlations (SMC), and composite reliabilities (CR) were reported to measure the reliability and validity of the measurement models. All factor loadings were above 0.5 and each indicator t value exceeds 7.0 (p < .001), suggesting that these indicators were viable measures for the designated constructs. SMC measures the reliability of the indictors by showing the proportion of variance in an indicator that is explained by its underlying latent variable. A high SMC value indicates high reliability for the indicator concerned (Diamantopoulos & Siguaw, 2000). CR exceeding .6 indicates good construct validity (Bagozzi & Yi, 1988). CR was calculated for each of the six latent constructs. The values demonstrated good internal consistency as follows: destination leisure environment (.80), venue facilities (.80), accessibility (.75), destination economic environment (.75), cluster effect 2 (.74), and cluster effect 1 (.64). Model fit indices, such as chi-square (χ2), goodness-of-fit index (GFI), root mean square error of approximation (RMSEA), and comparative fit index (CFI), indicate if the proposed measurement model was plausible or not. According to Hair et al. (2006), significant p values can be expected for a sample size of more than 250 and containing more than 30 measurement items. Thus, if CFI is greater than .9 and RMSEA is lower than .07, the model indicates reasonable fit. Model fit indices in this study showed that the measurement model fitted the data well (χ2 = 435.279, df = 211, p < .001, χ2/df = 2.063, GFI = .886, CFI = .914, RMSEA = .060).
Measurement Model of Destination Attractiveness: First-Order Confirmatory Factor Analysis
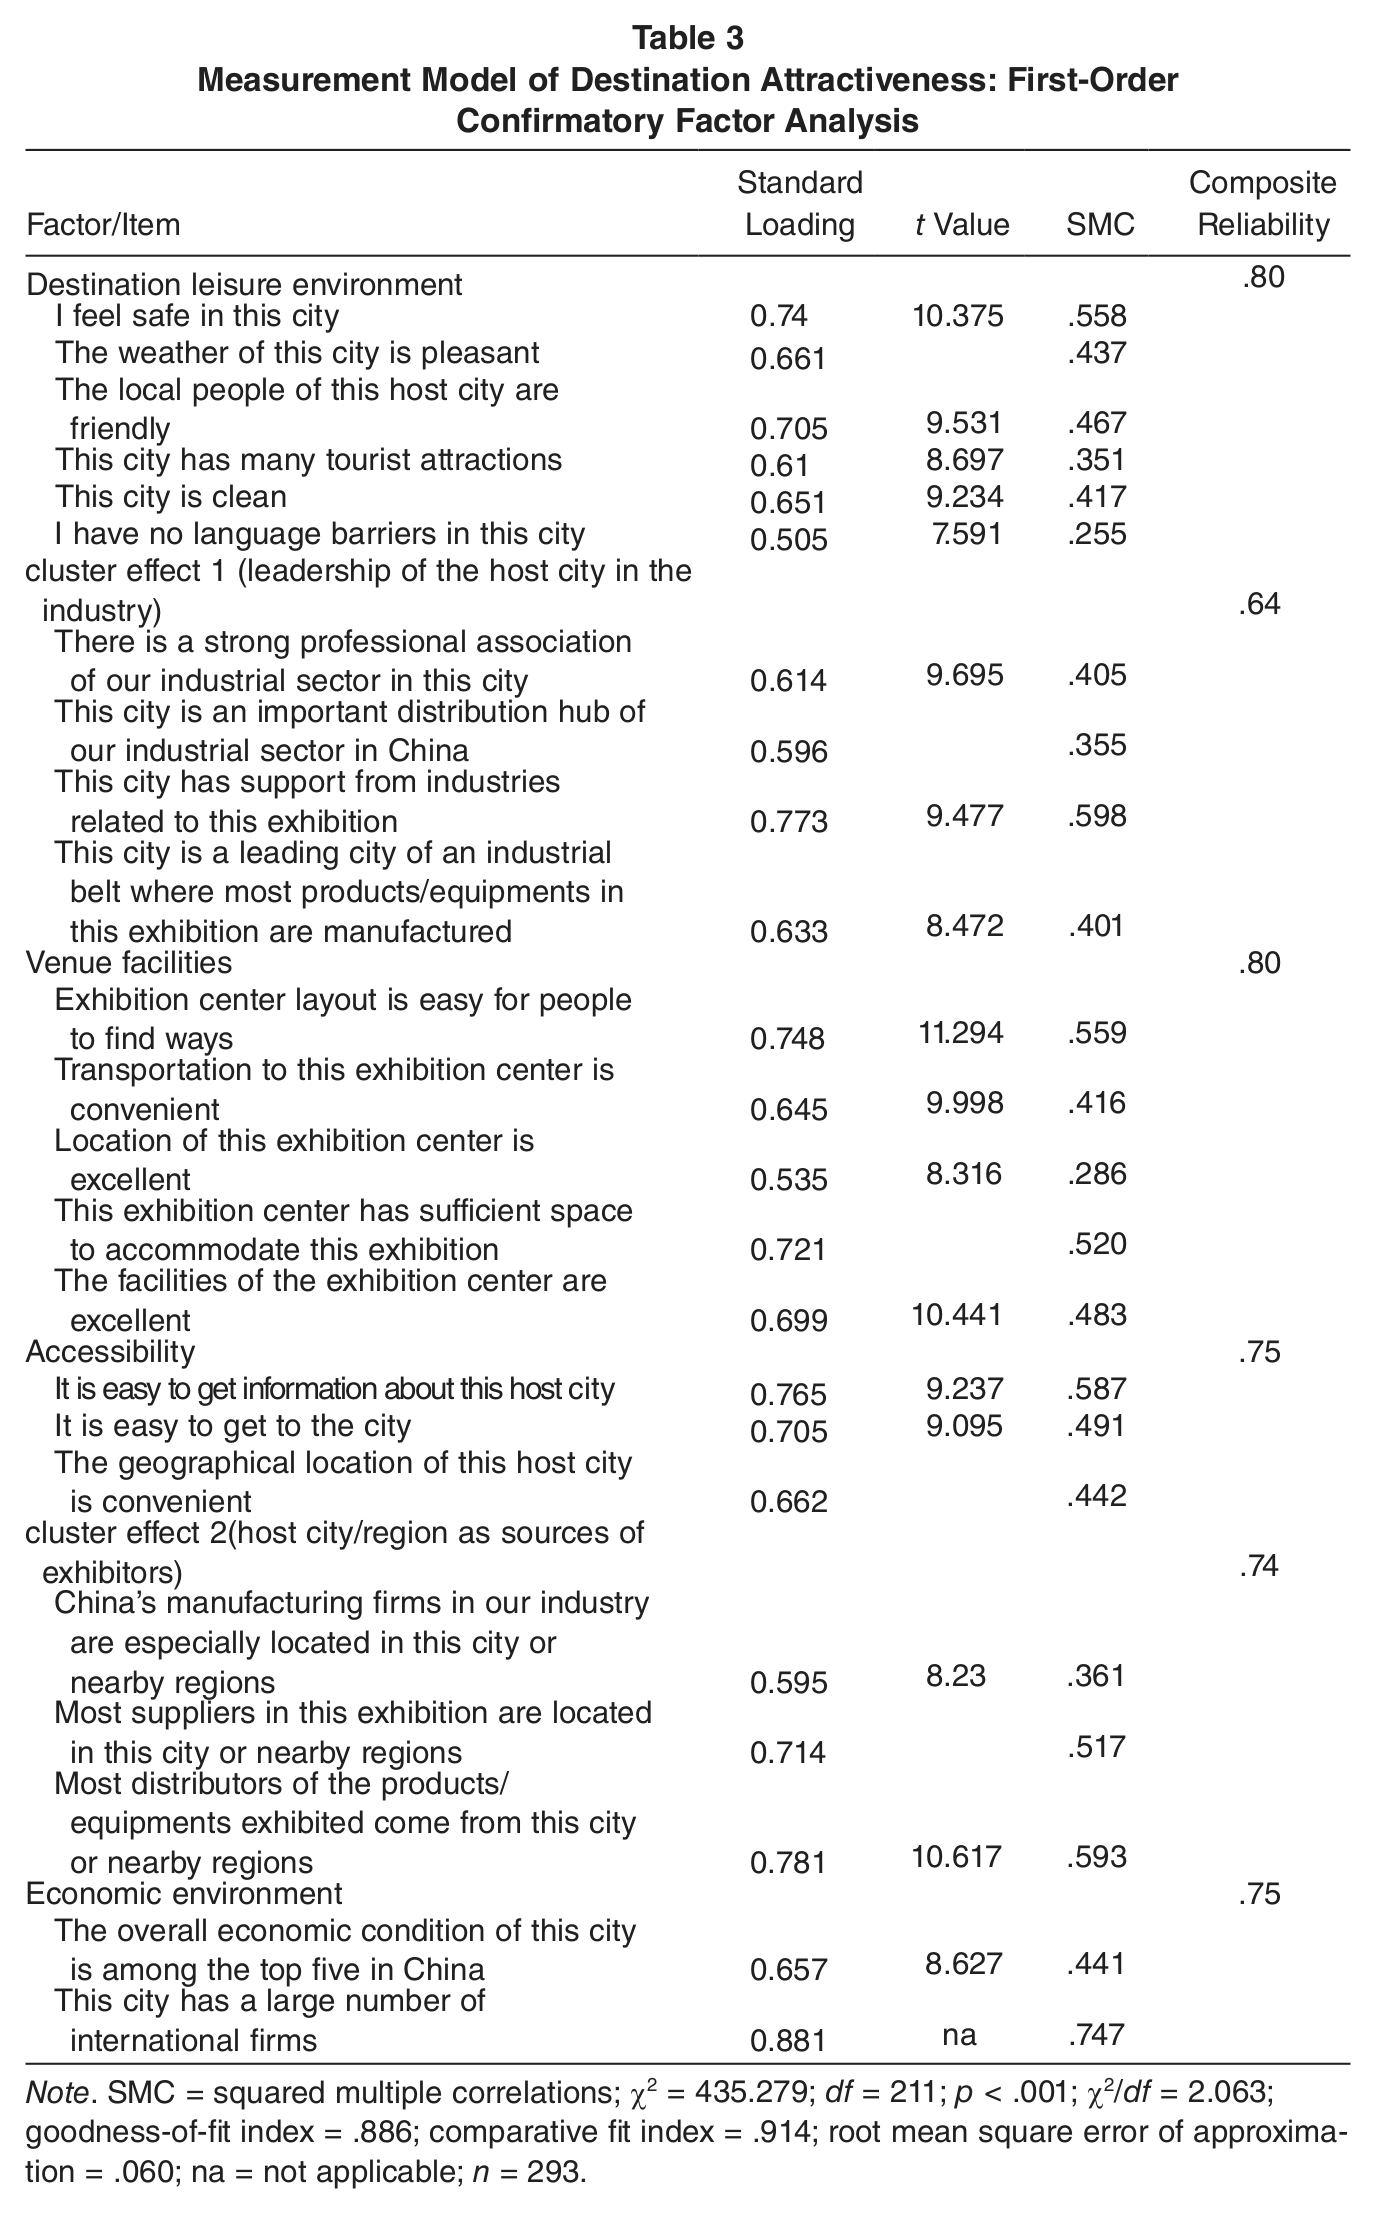
Note. SMC = squared multiple correlations; χ2 = 435.279; df = 211; p < .001; χ2/df = 2.063; goodness-of-fit index = .886; comparative fit index = .914; root mean square error of approximation = .060; na = not applicable; n = 293.
Two indicators (“I have no language barriers in this city,” and “location of this exhibition center is excellent”) had a low SMC value (0.255 and 0.286, respectively), suggesting that about 25% and 28% of variances in these indicators, respectively were explained by the underlying latent variables. However, considering that the overall construct validity (.80 for both constructs) was good and that fit indices were not improved significantly if the two indicators were removed, they were kept to fully represent the construct and maximize reliability. Thus, first-order CFA confirmed the six-factor model for destination attractiveness and indicators for each of the six factors.
Second-Order Confirmatory Factor Analysis of Destination Attractiveness
With dimensions confirmed by the first-order CFA, a second-order CFA (Table 4) was conducted to establish the correlation parameters between the underlying dimensions and the second-order construct (destination attractiveness). A second-order factor can be regarded as “one way of accounting for covariance between constructs, just as first-order factors account for covariation between observed variables” (Hair et al., 2006, p. 816). A second-order model is still subject to construct validity standards. Thus, standard factor loadings, t value, SMC, and CR were reported to measure the reliability and validity of the second-order model. Result shows that the second-order model exhibits adequate fit (χ2 = 712.831, df = 220, p < .001, χ2/df = 3.240, GFI = .905, CFI = .909, parsimony normed fit index (PNFI) = .761, RMSEA = .060), and compared with the first-order measurement model, it is more parsimonious and performs better on indices that reflect parsimony (PNFI = .761, PCFI = .791, PRATIO = .870). Other fit indices (GFI, CFI, RMSEA, etc.) are as good as, or even better than, the first-order model. CRs of the factors all comfortably exceed .70. Thus, all statistics support the assumption that the destination attractiveness construct reflects variances in multiple first-order latent factors as a second-order factor. In summary, based on the results of EFA, first- and second-order CFA, it can be concluded that destination attractiveness, in the exhibition context in Mainland China, perceived from the exhibitors’ perspective, is a higher order construct composed of six factors: (a) cluster effect 1 (host city leadership in the industry), (b) venue facilities, (c) cluster effect 2 (host city/region as a source of exhibitors), (d) destination leisure environment, (e) destination economic environment, and (f) accessibility.
Measurement Model of Destination Attractiveness: Second-Order Confirmatory Factor Analysis
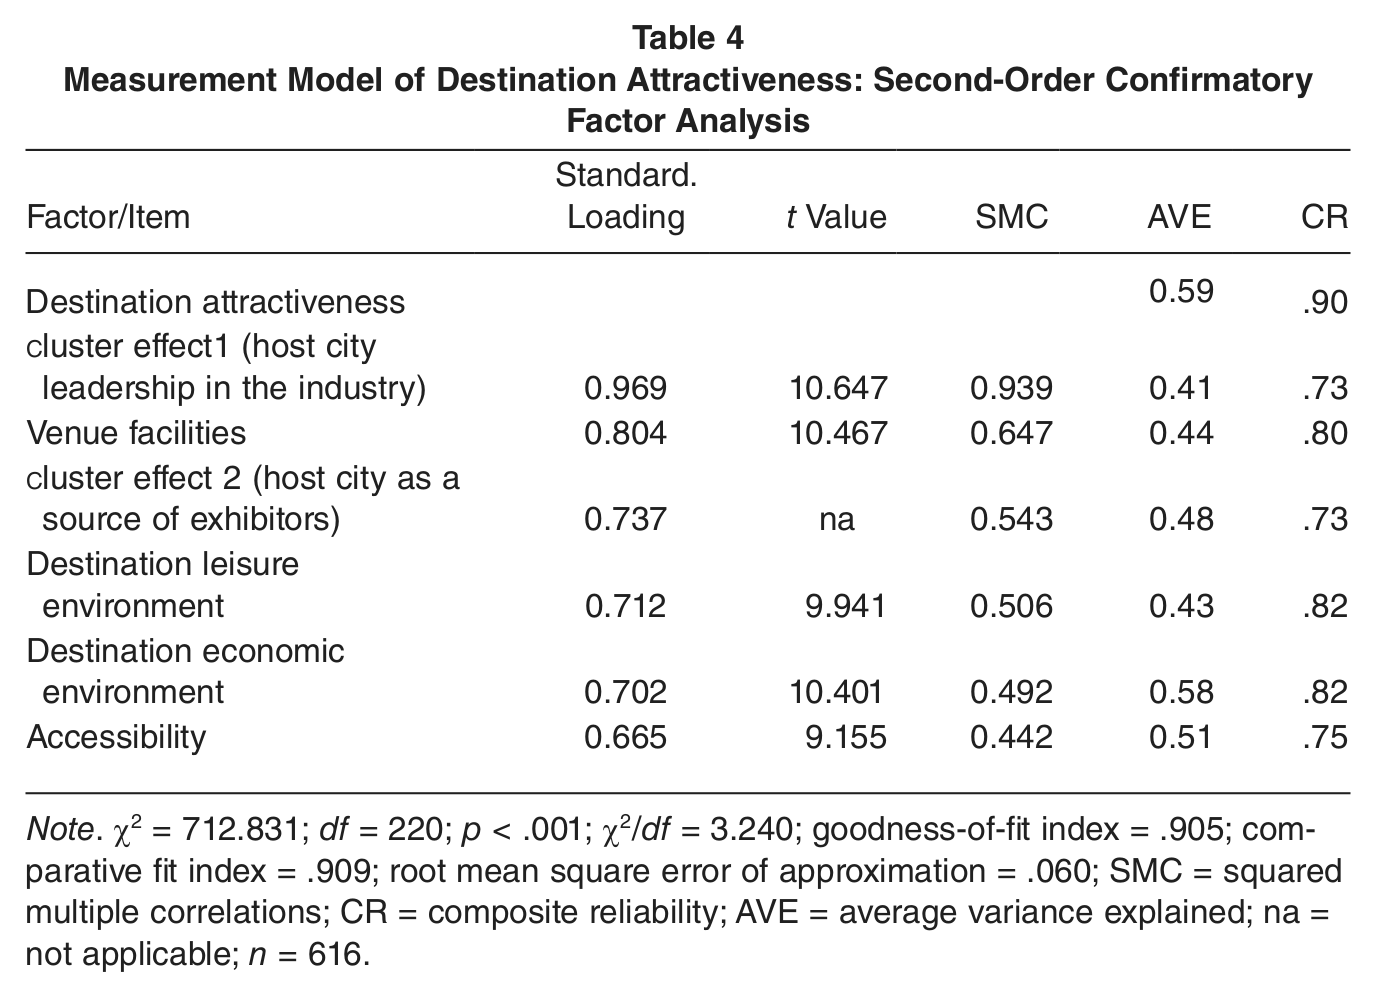
Note. χ2 = 712.831; df = 220; p < .001; χ2/df = 3.240; goodness-of-fit index = .905; comparative fit index = .909; root mean square error of approximation = .060; SMC = squared multiple correlations; CR = composite reliability; AVE = average variance explained; na = not applicable; n = 616.
Differences in Exhibitor Perceptions of First- Versus Second-Tier Cities
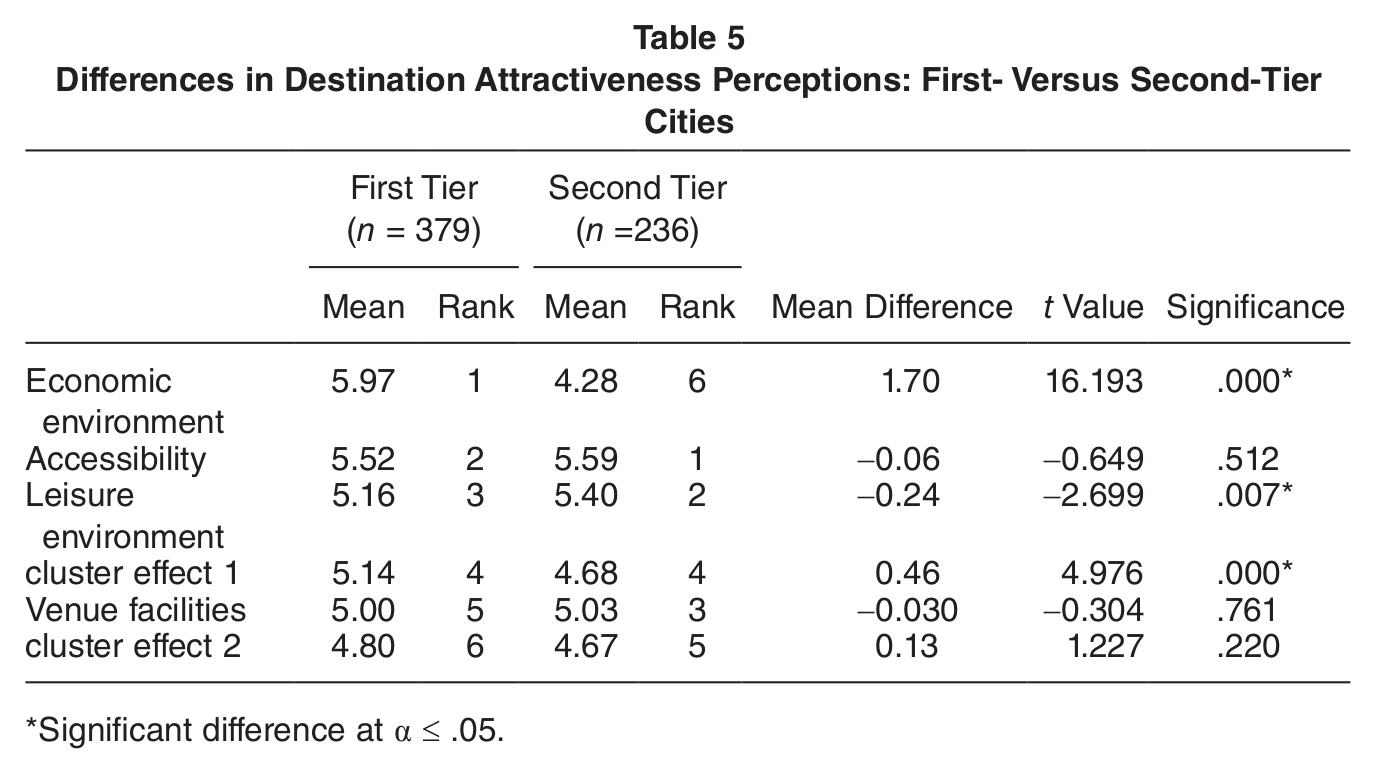
To examine potential differences in perceptions of destination attractiveness, perceptions of exhibitors attending exhibitions in the first-tier city were compared with those who exhibited in second-tier cities (Table 5). Independent sample t tests showed that there were significant differences in terms of Cluster 1 (leadership of host city in the industry), economic standing of the destination, and leisure environment. Results indicate that Shanghai rated significantly higher in terms of economic standing and Cluster Effect 1 than second-tier cities (Hangzhou, Nanjing, and Wuhan), in line with their actual economic development. Interestingly, Shanghai’s leisure environment was rated lower than that of the second-tier cities, with Nanjing and Hangzhou in particular being famous tourist destinations. Furthermore, there was no significant difference in terms of venue facilities, destination as a source of exhibitors, and accessibility, indicating that second-tier cities are perceived as having as good venue facilities and accessibility as the first-tier city.
Differences in Destination Attractiveness Perceptions: First- Versus Second-Tier Cities
Significant difference at α ≤ .05.
Conclusions
This research empirically tested dimensions of exhibition destination attractiveness in the Mainland China context from the perspective of exhibitors. It confirmed that destination attractiveness is a higher order construct composed of six factors: (a) Cluster Effect 1 (host city leadership in the industry), (b) venue facilities, (c) Cluster Effect 2 (host city/region as a source of exhibitors), (d) destination leisure environment, (e) destination economic environment, and (f) accessibility.
Accessibility and a destination’s economic and leisure environments had a significant impact on exhibition destination attractiveness, albeit to a lesser extent than cluster effects and venue facilities. Economic environment was measured by strong economic conditions and the presence of a large number of international firms. This is in line with previous studies that stress the importance of economic standing of an exhibition destination (e.g., Fuchslocher, 2005; Rubalcaba-Bermejo & Cuadrado-Roura, 1995). Regarding destination leisure environment, findings of this research support previous studies positing that exhibitors and visitors typically prefer cities with pleasant environments (e.g., Jin, Bauer, et al., 2010). Compared with German destinations for exhibitions, China’s second- and third-tier cities lack both international prestige and a history of hosting exhibitions. Thus, cities with a better leisure environment with regard to safety, cleanliness, tourist facilities, and openness should be more competitive in developing the exhibition industry in their locality. Accessibility, measured by ease of access to the city, location, and ease of getting information on the city was perceived as important, lending support to similar findings in previous studies on convention site selection and exhibition center success factors (e.g., Crouch & Louviere, 2004; Hiller, 1995; Rubalcaba-Bermejo & Cuadrado-Roura, 1995). However, the most important constituents of destination attractiveness were cluster effects.
Two dimensions for the cluster effect were established: (a) host city leadership in the industry and (b) host city/region as a source of exhibitors. Cluster effects result in distinct differences for exhibition destinations versus convention or tourism destinations. “Host city leadership in the industry” was manifested in a host city being an important distribution hub of a specific industry sector, having support from related industries and a strong professional industry association. It had the greatest impact on exhibition destination attractiveness, closely followed by the “Host city/region being a source for exhibitors.” Exhibitors are aware of and prefer host destinations with cluster effects that have developed over time, thus, supporting arguments that the maturity of an industry in a destination is important to the cultivation of exhibitions for a specific industry sector (Butler, Bassiouni, El-Adly, & Widjaja, 2007; Chan, 2005), and that exhibitions mirror economic and industry developments (e.g., Kirchgeorg, 2005). It also provides evidence that the development of China’s exhibition industry is similar to that in Germany where exhibitions gained strength as a result of cluster effects, both past and current (Brenner & Gildner, 2006). It is likely to prove very difficult to start an exhibition in a city in China without any of the cluster advantages. This is in marked contrast to exhibitions developed in, for example, Las Vegas, where exhibition development is based on available space, professional operation, and touristic value (Sanders, 2002) rather than any cluster effects.
This research provides practitioners and policy makers with a means of assessing and enhancing the competitiveness of their destination. It identified the various destination business factors; it also confirmed that destination business factors have a greater impact than leisure factors on exhibition destination attractiveness. Since destinations are able to directly compete on the basis of business-related factors (Enright & Newton, 2005), this finding offers a direction for destinations to develop and enhance their competitiveness in the exhibition sector.
Destinations that possess leadership in a particular industry, have good venue facilities and accommodation options, are accessible, and are located near the manufacturing base for the exhibited products are likely to be more attractive to both organizers and exhibitors. Thus, gateway cities and leading regional cities, which have strong financial support to build venue facilities, ease of access, and a variety of quality accommodation, are likely to be more competitive as exhibition destinations. However, this is not to say that smaller cities are automatically excluded from developing successful exhibitions, as the ability to locate or relocate an exhibition not only depends on destination attractiveness dimensions but also on the professionalism of organizers, their effort and determination, and support gained from industry associations, local government, and venues.
Indeed, second-tier cities were found to possess the necessary resources to host large-scale exhibitions. However, they are not as competitive as benchmark cities because of the absence of leadership of the city in the industry and a less favorable business environment. Hence, premier exhibitions may still be located in first-tier cities, yet destination decentralization is possible in that regional flagship exhibitions in different growth regions will increase in number and significance. Thus, relocating exhibitions to destinations with market demand but less advanced venue facilities and destination amenities appears viable, and well-developed and managed exhibition centers in second-tier cities will have good opportunities to attract exhibitions. Decentralization of destinations should be in the interest of exhibitors as they could have easier access to regional markets and enhance their regional presence (Tan, Hock, & Piaw, 2004). As decentralization is a worldwide trend, the findings of this research may also have implications for other second-tier cities around the world.
The exhibition destination attractiveness dimensions developed in this study may be adopted to rate the attractiveness of other destinations, especially emerging markets possessing similar market and destination conditions to those of the first- and second-tier cities sampled in this research. First, measurements of these dimensions possess a high level of universality. Second, there is a trend of exhibitions moving from traditional markets such as Europe and North America to Asia, and within Asia moving from a few gateway cities to second-tier cities (Beier & Damböck, 2008). Asia experienced the highest rate of growth in venue space from 2006 to 2010 (25%), compared with Europe (10%), North America (7%), and the Middle East (18%; Beier & Damböck, 2008). China is the largest emerging market and leads Asia’s exhibition industry development. Considering the decentralization of exhibitions and destinations, it should be possible to generalize the findings of this study, with the requisite caution, to other countries, especially developing countries in Asia and the Middle East where the exhibition industry is advancing fast.
Finally, the study findings indicate that exhibition destination attractiveness is different from convention destination attractiveness, primarily for the importance of factors, such as the cluster effect (leadership of the city in the industry and the host city as a source of exhibitors) and economic environment. Thus, in future research on site selection, a clear distinction has to be made between exhibitions and conventions rather than approaching the subject from a more general MICE segment perspective.
Study Limitations and Future Research Directions
This study has arbitrary boundaries and limitations. First, this study focuses on location-fixed, trade-to-trade exhibitions with a variety of topics, scopes, and scales of importance. Findings from this research may not be transferable to trade-to-consumer exhibitions or location-mobile exhibitions. Second, this study examines exhibitions at international and national levels that were hosted in first- and second-tier cities in Mainland China. There are special conditions present in this exhibition setting that may not readily be found in exhibitions hosted in other destinations. Thus, caution shall be taken when generalizing the findings to other exhibition settings. Third, this study deals with dimensions and perceptional differences of exhibition destination attractiveness. However, the impact of this construct on other variables has not been explored and presents a fruitful area for future research. More specifically, the impact of exhibition destination attractiveness on customer loyalty, behavioral intentions, and exhibition brand preference may be explored. This can empirically demonstrate if and to what extent this construct is important in the broader exhibition context. Furthermore, exhibition destination attractiveness from the visitors’ perspective may be investigated, given the focus of the current study on the exhibitors’ perspective. This would provide a more comprehensive assessment of the construct and determine whether perceptual differences exist between these two key players who drive exhibition demand. Finally, factors beyond exhibition destination attractiveness may be explored to better understand the decision-making process of both exhibitors and visitors to attend a particular exhibition among a range of alternatives.