
Abstract
The main purpose of this study is to measure and explore the dimensionality of the event image by using the case of 2010 Shanghai World Expo. After literature review, this study used Keller’s framework of brand image as the conceptual base, followed the free associations method to identify the preliminary items, adopted expert opinions to further revise the items, used the exploratory factor analysis to explore the underlying structure of the event image, and adopted the confirmatory factor analysis to further validate the measurement scale. Finally, five dimensions including 17 items were extracted. They are labeled as Benefit, Facility, Service, Theme, and Event Content. The results of the current study were relatively consistent with some conceptual frameworks and to some extent confirmed previous empirical studies, which could provide useful implications for both future research and industry practice.
Keywords
Introduction
Events are known to play more and more important roles in destination marketing and branding by deriving economic benefit, expanding the tourist season of the destination (Allen, O’Toole, McDonnell, & Harris, 2002), providing cultural and educational opportunities, fostering a feeling of community pride, helping conserve the sensitive natural environment and/or social and cultural environment, and contributing to sustainable development (Backman, Backman, Uysal, & Sunshine, 1995). In recognizing the significance of events, many scholarly efforts have been made on topics such as the evaluation of the impacts brought by events (e.g., Getz, 2008; Lee & Taylor, 2005; May, 1995; Sherwood, 2007), the event market demand (e.g., Getz, 1991), the consumer behavior research of event participants (e.g., Crompton & McKay, 1997; Hede, Jago, & Deery, 2005), the effect of events on changing the image of the hosting destination (e.g., S. S. Kim & Morrsion, 2005; Lee, Lee, & Lee, 2005; Richards & Wilson, 2004), and so on. Among all the topics concerned, the impacts of events on the host community and local residents are well documented and many efforts have been made to investigate the economic, social, and environmental impacts of events. However, the event attendees or visitors, as the major stakeholders of the event, are largely ignored in literature, despite the fact that their perceptions and evaluations are critical in providing valuable implications to the organizers and sponsors of the event.
The consumer-perceived image is a significant construct in conditioning consumer behavior, because it is valuable to comprehensively capture the consumers’ cognitive and affective evaluations and to predict consumers’ responses (e.g., attitude, loyalty, behavioral intentions, etc.). Image studies are therefore always an important research stream. The research of image began in the early 1960s in the field of retailing based on theory derived from the Wharton Studies (Fisk, 1961). In 1961, Fisk outlined a conceptual model to measure the influence of image on the basis of its six dimensions concerning consumer patronage. Since Fisk, abundant studies on brand image have emerged, and the brand image has been regarded as a critical component in companies’ marketing strategy. As a key part of the brand equity, the brand image is usually examined in relation with other brand equity components (e.g., brand attitude, brand loyalty; D. A. Aaker, 1996; Hsieh, 2000; Keller, 1993, 2003). Additionally, the brand image is also discussed in the context of brand sponsorship on how to use events to improve the sponsor brand image (Chedi, 2008; Gwinner & Eaton, 1999; Smith, 2004). In tourism, studies on destination image can be traced back to the early 1970s, when Hunt (1975) believed image is a critical development factor in destination’s tourism success. Since then, destination image has emerged as a crucial marketing concept and research area in the tourism field (Echtner & Ritchie, 1991; H. Kim & Richardson, 2003), and there is a large and expanding body of studies on this topic. Despite the progresses in understanding brand image or destination image, the study on event image is rarely seen. In extant literature, event image is often loosely defined, and the dimensionality of the construct is yet to be explored.
Therefore, the current study is carried out to fit the research gap by exploring the content and the structure of the event image, and developing a comprehensive measurement scale for the event image construct.
Literature Review
Event
Although studies trying to define events can be easily identified, there is still no widely accepted definition in the tourism literature, and many terms have been used loosely. One commonly used term, special event, refers to
a onetime or infrequently occurring event outside the normal program or activities of the sponsoring or organizing body. To the consumer, a special event is an opportunity for a leisure, social, or cultural experience outside the normal range of choices or beyond everyday experience. (Getz, 1991, p. 44)
Another noticeable effort is the concept of “planned events” proposed by Getz (2008), which incorporates almost all types of events and other terms in event and festival field. Planned events are “spatial–temporal phenomenon and each is unique because of interactions among the setting, people, and management systems—including design elements and the program” (Getz, 2008, p. 404). This concept is more comprehensive and appropriate for the current study.
As for the typology of events, Getz (2008) provides comprehensive categories of planned events on their form in terms of the purposes and programs. Some are for public celebration (this category includes so-called “community festivals” which typically contain a large variety in their programming and aim to foster civic pride and cohesion), whereas others are planned for the purposes of competition, fun, entertainment, business, or socializing.
The reason why events attract so much industry and academic attention lies in their contribution to the destination. In the context of tourism destination marketing and branding, events can play a number of important roles, such as attractions, image maker, animators of statistic attractions, and catalysts for other developments (Getz, 2005). From the long-term development perspective, image makers could be the most important role of events. Events can shape the image of the host city or country, and lead to its favorable perception as a potential travel destination. With media focus on the host city, even for a relatively short duration, the publicity value is enormous (Getz, 1991). The relationship between events and the overall themed image of a destination can be illustrated through examples. Cameron (1989) noted the role of festival and events, and cultural tourism in general, in altering the image of the Lehigh Valley in Pennsylvania, which was an old industry town. By fostering cultural attractions and events, the town successfully began to attract both investment and tourists.
Although the positive relationship between events and destination image has been supported by studies and examples (e.g., S. S. Kim & Morrsion, 2005; Lee et al., 2005; Richards & Wilson, 2004), it can be seen from previous experience that not all events can generate positive or huge benefits for the hosting place. The effectiveness of hosting events to some extent depends on the size or reputation of events. Most successful cases share the commonality of mega-events or upper-class events. The more prestigious and famous the event, the more and bigger effects the event can bring. Therefore, the case used in the current study is narrowed down to the mega event.
The definition of the mega-event is still in debate, and scholars tried to define it from different angles. Marris (1987) suggested that mega-events can be defined in terms of their volume of visitors, cost, or psychology. The volume should exceed one million visitors, the capital cost should be at least $500 million, and the reputation of these events should be that of a must-see event. Among these factors, the key characteristic is the prestige factor. However, others emphasized the economic effects of the event instead. For instance, Vanhove and Witt (1987) stressed that a mega event must be able to attract worldwide publicity. Rooney (1988) summarized the common features of mega-event: they are loaded with tradition; they have profound historical significance; they have developed a mystique or taken on almost mythical proportions; they benefit from media overload, frequently at the international level; they are often complemented by other events, such as parades and festivals; and they are sometimes tied to specific places. Getz (1991) concluded that from the perspective of tourism, the mega event must be linked to “attractiveness” and his definition focuses on “the proportion and number of visits made by overnight travelers to the event.”
Although the definition of mega event has not been agreed on, the widely acknowledged mega events include the Olympic Games, the World Cup, and the World Expositions. These events almost meet all the standards set for mega events. These events are attractive not only to generate abnormally large number or proportion of tourists who travel long distances and stay overnight but also to shape the destination image in a major way. In the current study, the 2010 World Expo in Shanghai is the case adopted to understand and explore the event image construct.
Event Image
In tourism literature, event image has been less thoroughly studied than destination image, and the literature does not currently provide a well-acknowledged definition or measurement scale for event image. However, in event sponsorship, some efforts on the construct conceptualization can be notified. The closest attempt in defining the image of events was made by Gwinner (1997), who proposed a model of image creation and image transfer in event sponsorship. Gwinner (1997) defined event image as “the cumulative interpretation of meanings or associations attributed to events by consumers” (p. 147). In addition, Ferrand and Pages (1996, p. 282) defined the image of events as “a cognitive construction associating rational and affective representations of an event by a person or a group” from the perspective of psychosociology.
Event image is usually discussed in the context of sponsorship, as researchers (e.g., Rifon, Choi, Trimble, & Li, 2004; Roy & Cornwell, 2004; Schiffman & Kanuk, 2010; Weeks, Cornwell, & Drennan, 2008; Xing & Chalip, 2006) believe and find that through sponsorship, the sponsoring brand image can be beneficially modified to generate positive outcomes (e.g., memory recall, purchase intention, or improved brand attitude). Therefore, event image is generally regarded to share the same theoretical foundation with brand image, which is in Keller’s (1993) framework of brand equity. Keller in 1993 presented a thorough theoretical framework on brand knowledge and brand component: brand awareness and brand image. According to the associative network memory model (ANMM), brand image was defined as “perceptions about a brand as reflected by the brand associations held in consumer memory” (Keller, 1993, p. 3). The ANMM explains the content and the structure of human memory. According to this theory, human memory is consisting of a network of nodes and connecting links, in which nodes represent stored information or concepts and links represent the strength of association between this information and concepts. The image of a brand or an event, as part of the human memory or knowledge, is also formed and composited in this mechanism. In the current study, Keller’s (1993) framework is regarded as suitable to explore the conceptual meaning and dimensionality of the event image, and the event image is correspondently defined as “perceptions of an event as reflected by the associations in consumer’s memory” (p. 3).
An important characteristic of event image, which is similar to that of destination image and brand image, is its dynamic nature. Event image does not remain still in human mind; instead, it varies and changes due to a variety of factors. In Gwinner’s (1997) model he proposed that an event’s image is a function of type of event (e.g., sports, festival, arts), event characteristics (e.g., size, professional status, history, venue, promotion appearance), and individual factors (e.g., meanings associated with the event). Although these factors have not been empirically examined yet, one feature of event image has been generally agreed: Every event owns a distinctive image which is derived from its unique set of attributes (Chien, Cornwell, & Stokes, 2005). Furthermore, from previous image literature (e.g., destination image, brand image), it can be inferred that the formation of event image is affected by various factors, including information sources and personal factors (Baloglu & McCleary, 1999; Beerli & Martın, 2004a; Gartner, 1993). The information sources refer to the amount and diverse nature of information sources to which individuals are exposed, including promotion, opinions of others, media reports, popular culture, and tourists’ personal and direct experience. On the other hand, the personal factors refer to an individual’s internal determinants, which can be generally grouped into three kinds: the sociodemographic characteristics of the individuals (gender, age, level of education, family life cycle, social class, place of residence, etc.), psychological factors (motivations, values, personality, lifestyle, etc.), and the experience of previous trips.
With regard to the dimensionality of event image, the literature on brand image and destination image can serve as reference for the current discussion. In event sponsorship field, according to Keller (1993), various associations in people’s mind can be classified into three major categories: attributes, benefits, and attitudes. Attributes refer to those descriptive features that characterize a product or service, and they could be product-related attributes or non-product-related attributes. Benefits are the personal value consumers attach to the product or service attributes that consumers think the product or service can do for them. Brand attitudes are defined as consumer’s overall evaluations of a brand.
In tourism literature, an important study underlining the destination image studies is Gartner’s (1993) study, which proposed that the destination image consists of three important aspects: functional–psychological, attribute–holistic, and common–unique features. According to Baloglu and McCleary (1999), the destination image is also composed of three dimensions: the cognitive, affective, and conative images. The cognitive image refers to an evaluation of the known attributes of the product or the understanding of the product in an intellectual way, whereas the affective component of image is related to the motives one has for destination selection and the conative component is concerned with the action and behavior adopted. However, the conative component was gradually ignored by researchers, since in most empirical studies tourists’ behavior (intentions) was regarded as a separate construct. Therefore, Baloglu and McCleary’s (1999) study was more widely and commonly used. In their research, they believed that the destination image includes cognitive, affective, and global evaluations.
Comparing research of destination image and studies of brand image, the similarity can be noticed that the image construct includes similar dimensions: attribute (cognitive), benefit (affective), and attitude (global). Since the current study believes that the global evaluation of the image is not at the same level with the attribute and affective images and it should be measured with another individual construct, the attitude (global) dimension was not incorporated as one of the dimensions for the event image. Therefore, the current study, based on both the branding and tourism literature, considers event image to consist of the cognitive attributes and benefits dimensions.
Since no agreement has been reached on the theoretical foundation of event image, the empirical results also turn out to be very inconsistent. As far as the measurement of event image is concerned, there are only a limited number of studies and their ways to operationalize this construct greatly limit this concept’s theoretical meaning (Kaplanidou & Vogt, 2003). For example, Gwinner and Eaton (1999) used a set of personified adjectives to measure event image and the sponsoring brand image, which equates the image to brand personality. By closely examining these adjectives in their scale, two dimensions can be identified. One is concerned with activities, including calm, leisurely, slow, fast, exciting, and monotonous, which is also identified by Mehrabian (1980), Foxall (1996), and Osgood, Suci, and Tannenbaum (1957). Another dimension represents the potency of the event, including adjectives such as aggressive, masculine, and wild. In 2006, Xing and Chalip developed a scale, which covers evaluation, activity, and potency dimensions and includes nine adjective pairs. These adjective pairs are “valuable–worthless,” “unsatisfying–satisfying,” “inspiring–uninspiring,” “unenjoyable–enjoyable,” “pleasant–unpleasant,” “busy–quiet,” “fast–slow,” “leisurely–active,” and “calm–exciting.” From these studies, it can be easily seen that the efforts on this aspect are still in great need.
In the current literature, although studies on measuring event image are limited, there are many studies focusing on examining attendees’ satisfaction with, and quality of an event and so on. However, after close examination of the definitions of these constructs, it should be noted that the event image is different from satisfaction and quality. Satisfaction mainly stands for an overall evaluation of consuming behavior or travel behavior. Tourists’ satisfaction usually forms on the basis of their need or motivation of travelling (Lee et al., 2005). Perceived quality refers to a comparison between expectations and performance as perceived by consumers (Parasuraman, Zeithaml, & Berry, 1985, 1988). It is described as the degree and direction of the discrepancies between the perceptions of the performance and the consumer’s expectations of the service (Parasuraman et al., 1988). Therefore, although satisfaction and quality are related to the perception of a subject, they also involve a further comparison with some other factors, such as their motivation, and expectation, but the event image only represents visitors’ perceptions of the event. Therefore, event attendees’ satisfaction and their perceived quality of the event should be regarded as the outcomes of, instead of components of the event image.
Method
This study is conducted in the context of one mega event: the 2010 Shanghai World Expo. The image of the event is regarded as “perceptions reflected by associations held in consumer’s mind” (Keller, 1993). D. A. Aaker (1991) suggested many ways, including qualitative and quantitative methods, to measure various associations. The qualitative method is used to capture as many associations as possible, whereas the quantitative method can evaluate the favorability and strength of various associations. Since the present study aims to explore event associations as comprehensively as possible from the perspective of tourists, both qualitative and quantitative methods are used. The measurement scale for the event destination image was developed following the steps suggested by Hair, Black, Babin, and Anderson (2010) and Churchill (1979), which are widely adopted by researchers for scale development (e.g., J. L. Aaker, 1997; Hung & Petrick, 2010, 2011).
After finalizing the operational definition of the event image through literature review (Ferrand & Pages, 1996; Gwinner, 1997; Keller, 1993), the second step is to develop a list of potential scale items that are correspondent to the definitions of the event image. The free association procedure (Chen, 2001) was then followed to interview both tourists and local residents who had some experience with the 2010 Shanghai World Expo to identify as many relevant event associations as possible. Convenient sampling method was adopted and nine in-depth interviews were conducted until no new theme emerged. During the interview, interviewees were asked to tell whatever came to their mind when they thought of the 2010 Shanghai World Expo. All the interviews were recorded for data analysis with the permission of the interviewees. Next, all the interviews were transcribed and analyzed by two researchers through content analysis to ensure the validity of data analysis. From the data analysis, 50 items related to the event image of the 2010 Shanghai World Expo were generated.
To further ensure the face validity of this measurement scale, a list of items generated from the in-depth interviews was sent to experts to rate how well the definition and the items match and to examine items for redundancy. In this study, five experts from both academia and industry were invited by convenient sampling method. As a result, 18 items were deleted or revised, and finally 37 measurement items were retained for the data collection.
The questionnaire used a 7-point Likert-type scale (1 = extremely disagree and 7 = extremely agree). A pilot study was carried out in August, 2010 during the Shanghai World Expo. The subject of this survey is the leisure tourist who has visited 2010 Shanghai World Expo. Convenient sampling method was used at some tourist attraction sites in Shanghai, such as the Bund, the Nanjing Road, and the People’s Square. At the sites, the respondents were asked to illustrate their level of agreement on all 37 statements about the 2010 Shanghai World Expo. In all, 320 questionnaires were distributed and 302 were completed and returned with a response rate of 94.4%. After data examination, the number of valid data sets for further analysis was 296. Following this, exploratory factor analysis (EFA) and the reliability test were used to further explore the dimensionality of this construct and further refine the research instrument. Finally, the main survey was carried out in late August at major tourism attractions in Shanghai by a group of trained and experienced student helpers following the judgmental sampling method. Overall, 800 questionnaires were distributed to suitable respondents, and finally, 725 completed questionnaires were returned and collected, which represents a response rate of 90.6%. The collected data went through the EFA to purify and confirmatory factor analysis (CFA) to finalize the measurement scale for event image.
Scale Development
Step 1: Development of the Research Instrument
In-depth interview
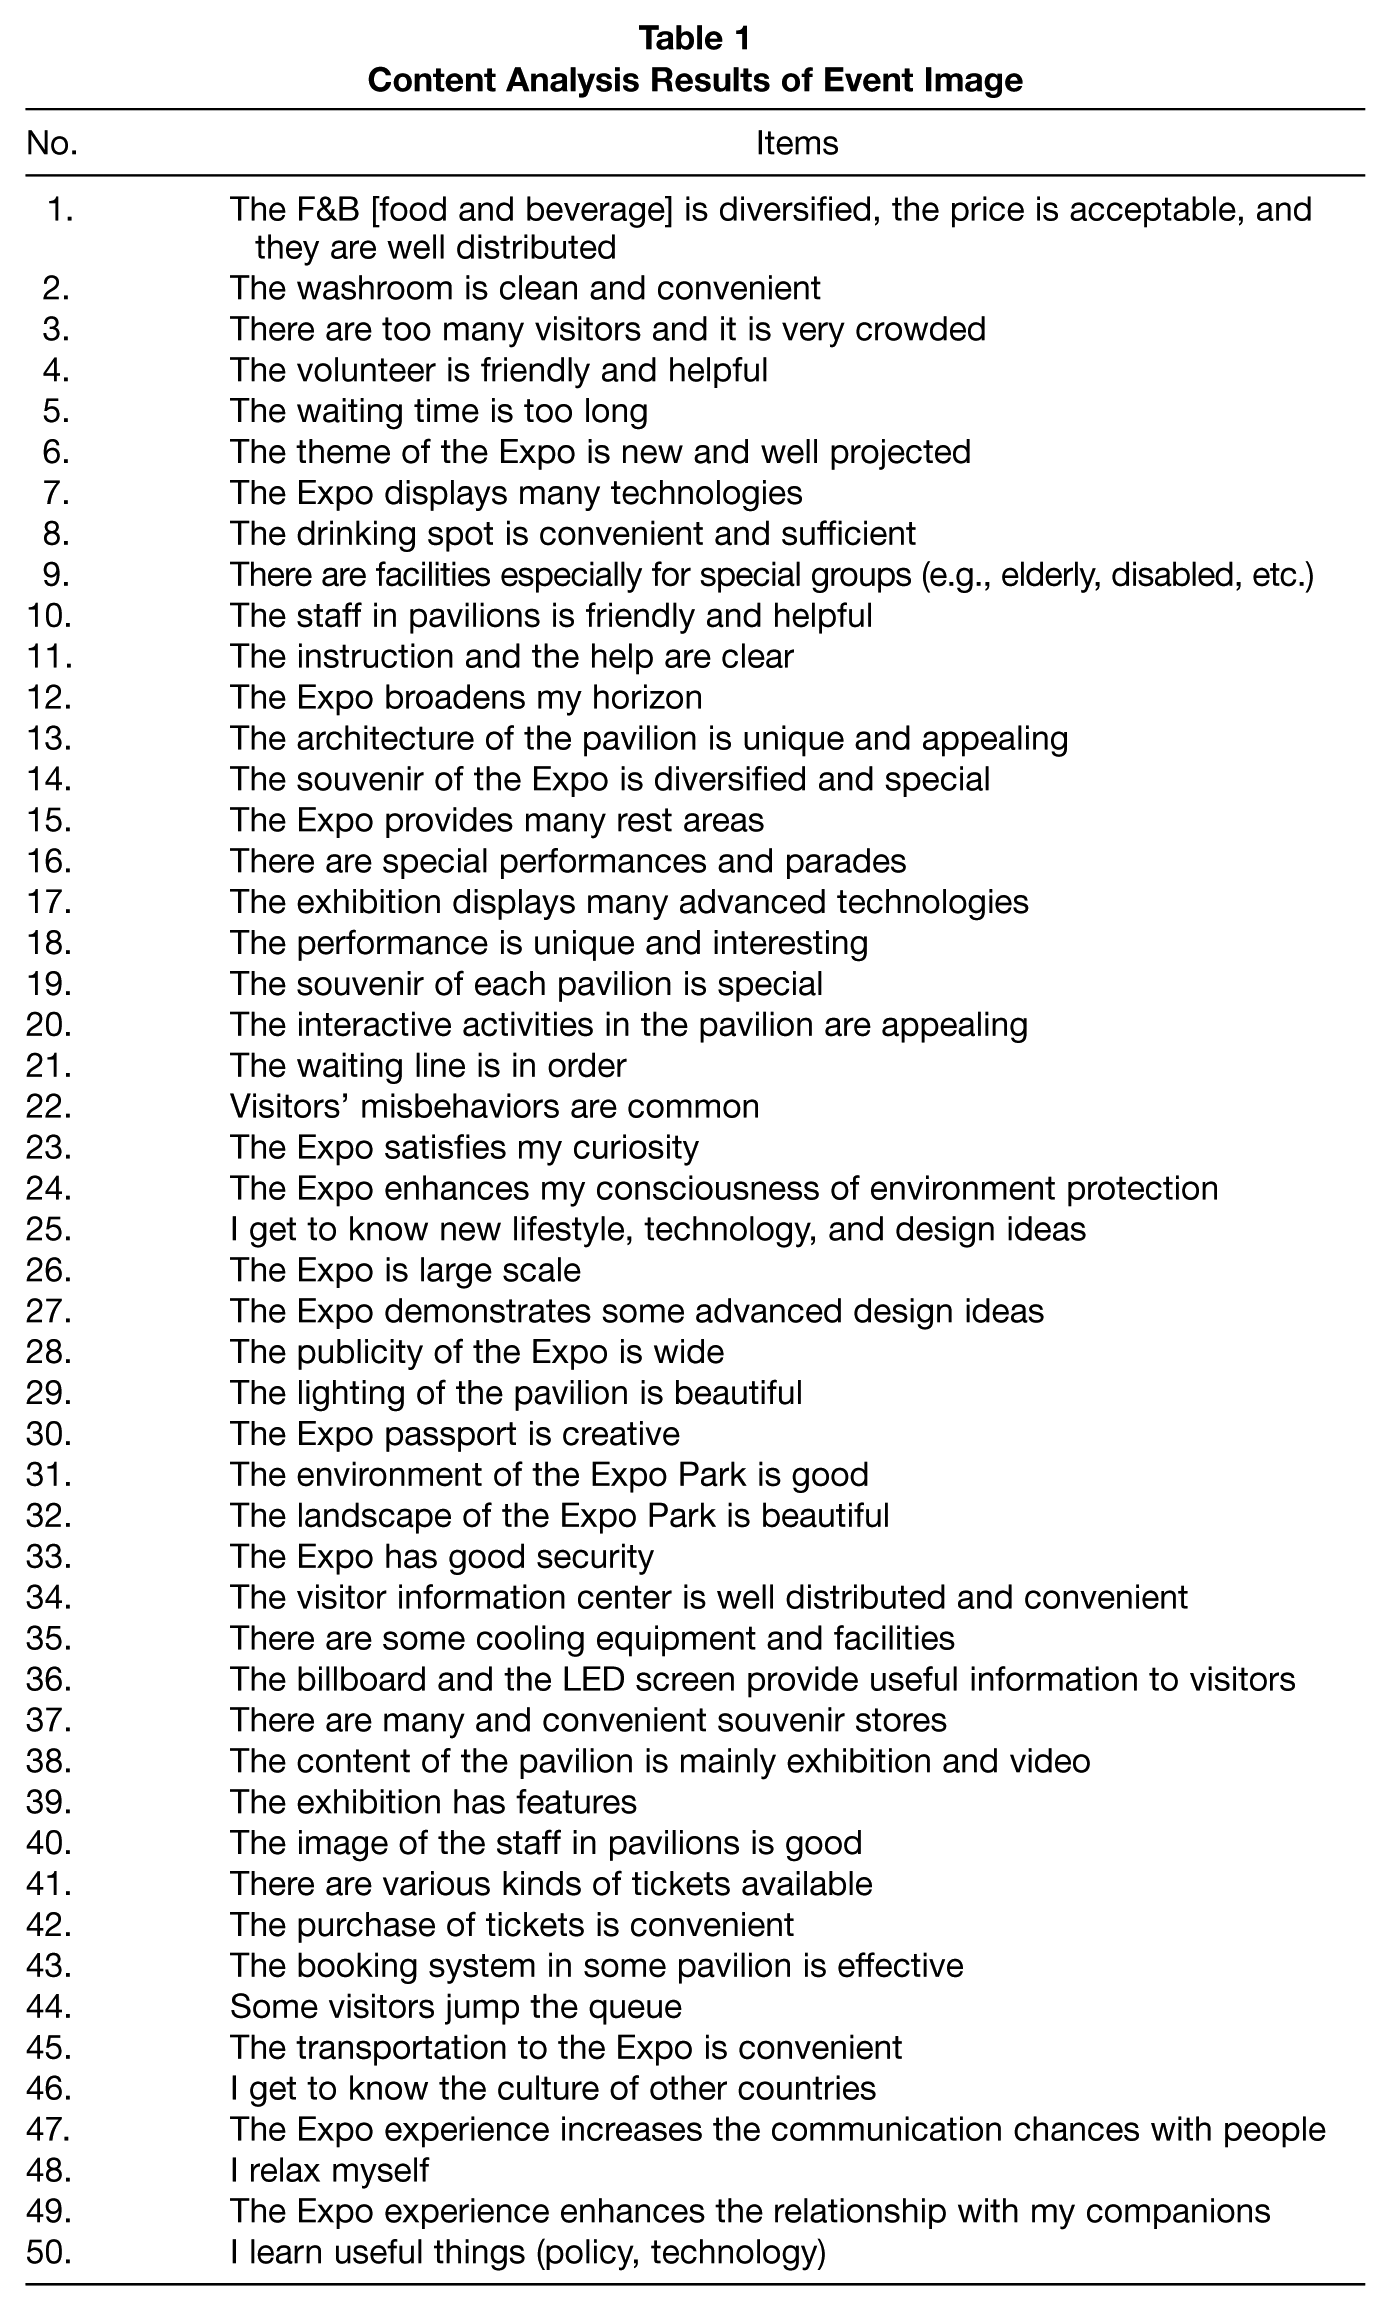
The purpose of the in-depth interview is to draw as many related items as possible for the research measurement scale, since previous studies offer little reference on the event-image measurement scale and very few studies focus on the World Expo. The in-depth interviews mainly followed the free association procedure. A total of 50 items were generated from the in-depth interview as shown in Table 1.
Content Analysis Results of Event Image
Expert opinion
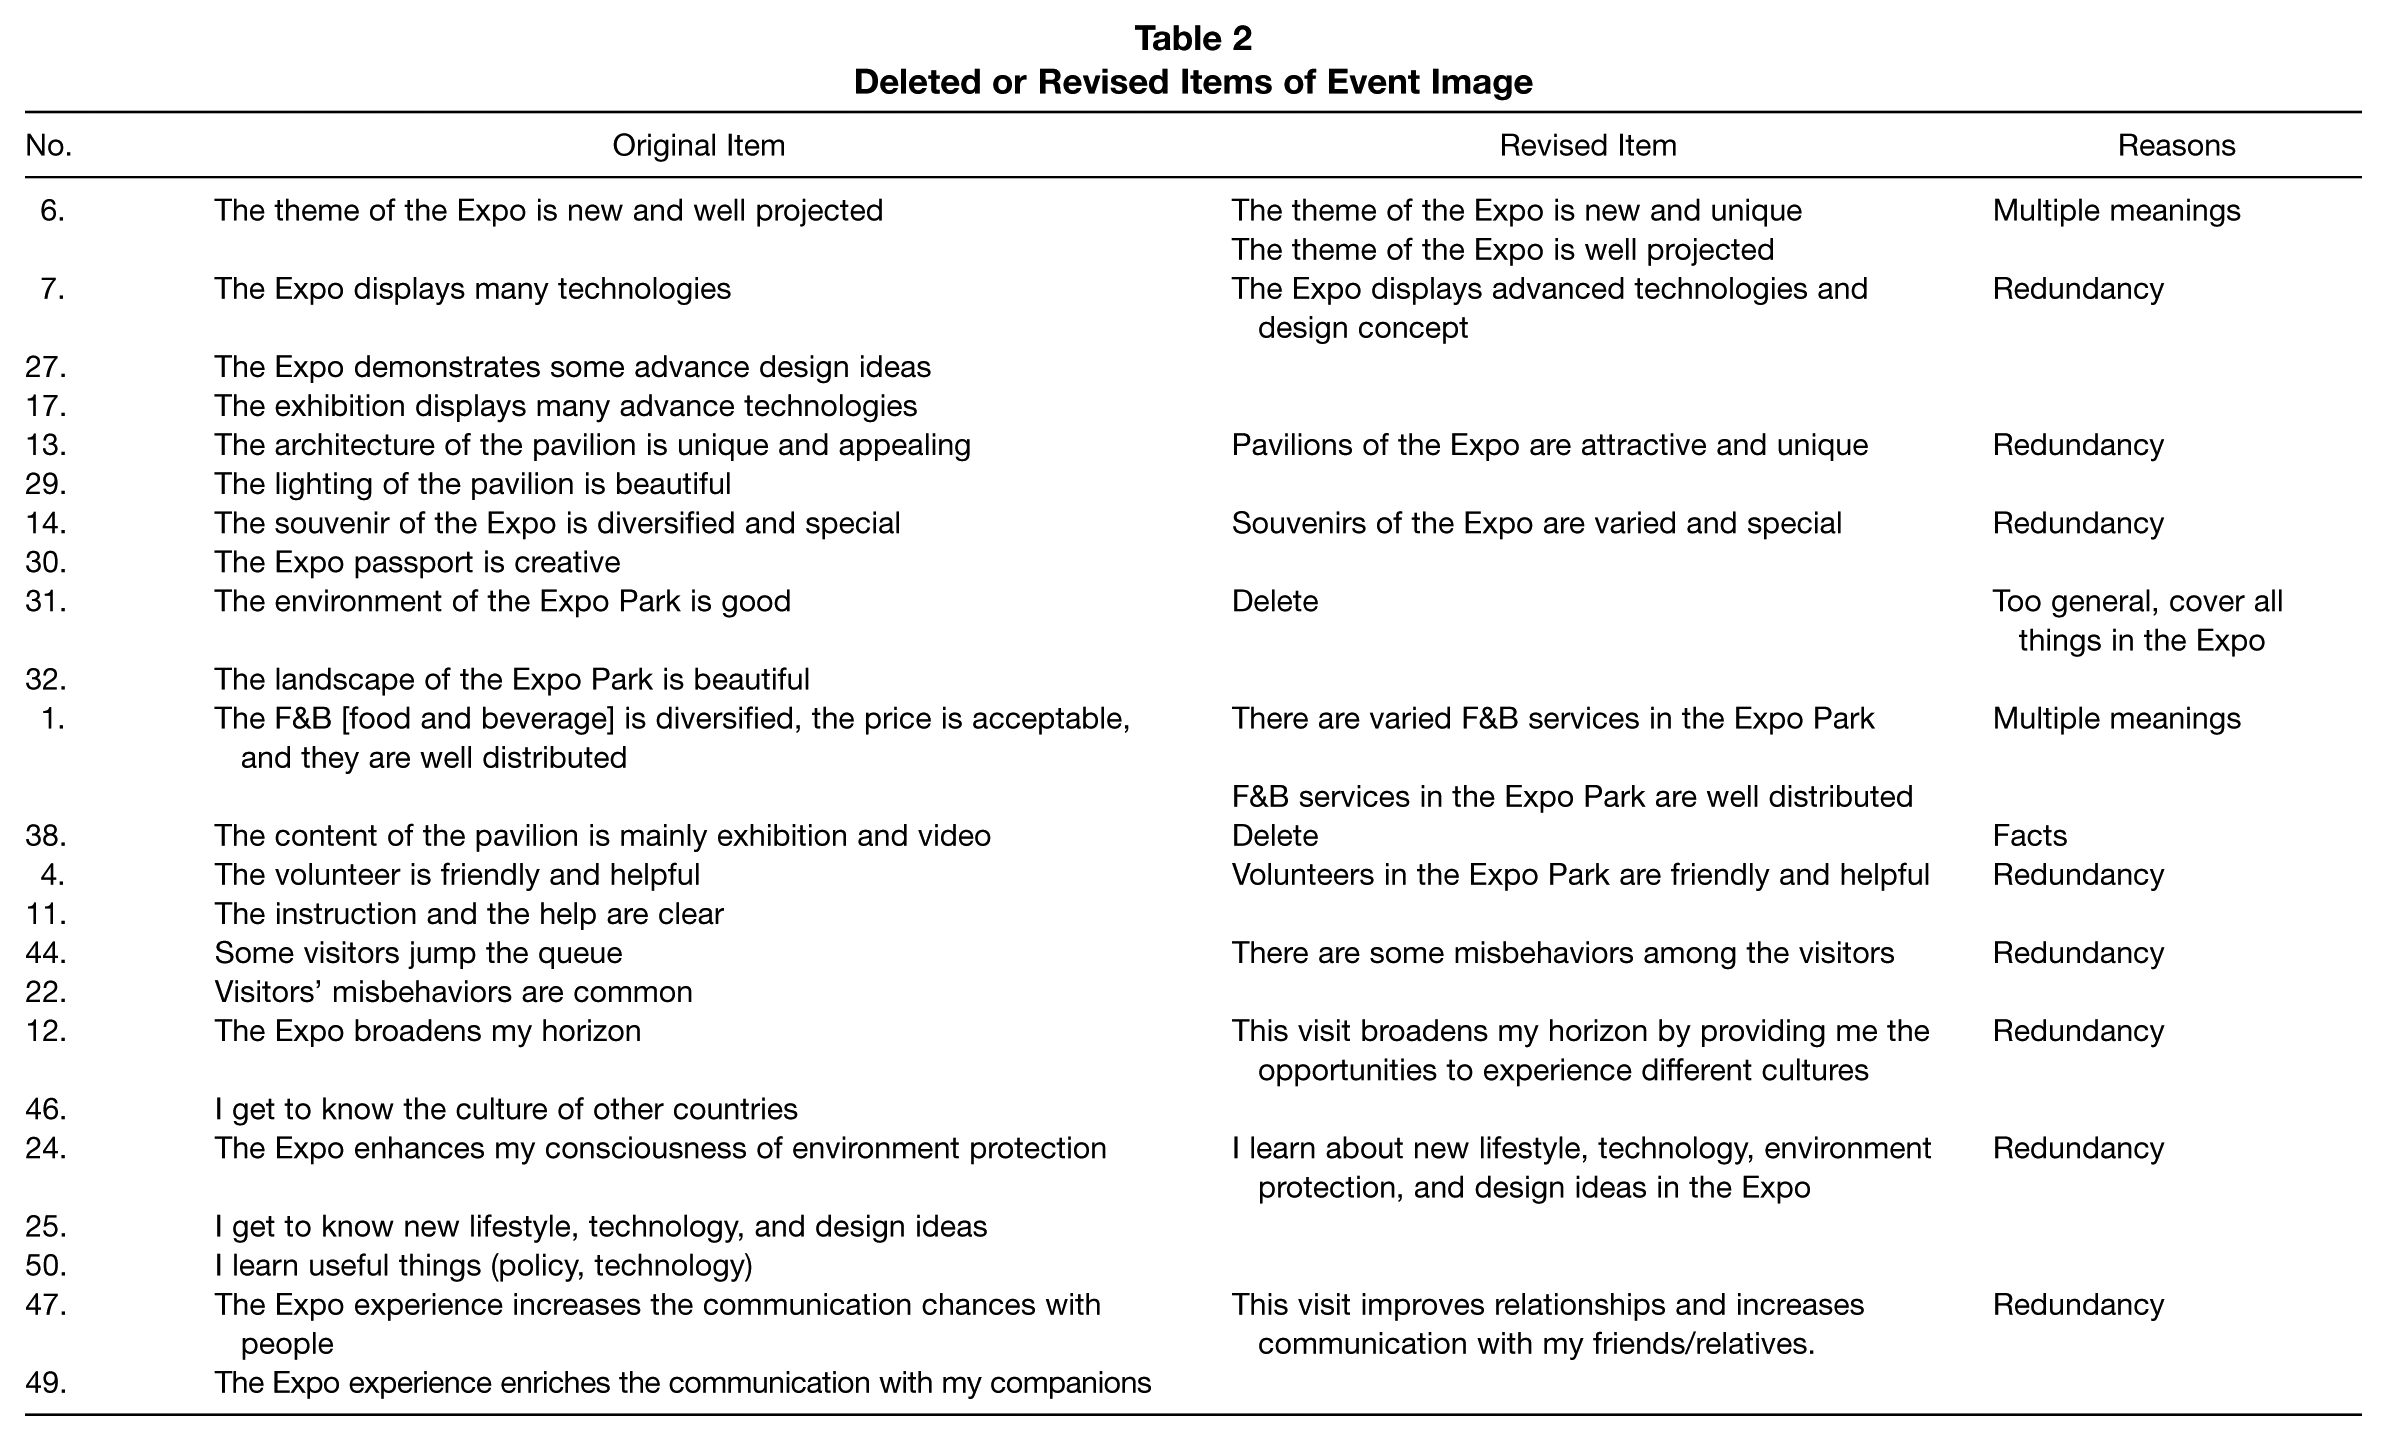
To further examine the face validity of the research instrument, these 50 items were sent to five experts for advice. According to their responses, several problems with the scale were identified (Table 2):
Redundancy: Many items have overlapping meanings. For example, “The architecture of the pavilion is unique and appealing” (Item 13), and “The lighting of the pavilion is beautiful” (Item 29) basically describe the exterior appearance of the pavilion, and the lighting (Item 29) is one component of the architecture of the pavilion (Item 13).
Multiple meaning: Some items describe more than one aspect of the Expo, which could lead to ambiguity or confusion for the respondents. Take “The theme of the Expo is new and well projected” (Item 6) as an example. This item covers two layers of meanings: the creativity of the theme and the projection of the theme.
Too general: “The environment of the Expo Park is good” (Item 31) and “The landscape of the Expo Park is beautiful” (Item 32) are too general and have overlapping meaning with many other items, so they were deleted as suggested.
Fact: Some items just reflect the pure facts about the Expo instead of tourists’ perception, such as “The content of the pavilion is mainly exhibition and video” (Item 38). All these revised items were then further edited by professional editors.
Deleted or Revised Items of Event Image
Pilot study
Previous literature (Gartner, 1993) has suggested the multidimensional nature of the image of general brand and tourism destination. EFA by using SPSS was conducted to explore the multidimensional structure of event image and further revise the research instrument.
After three rounds of analysis, six dimensions of event image have been extracted with eigenvalue greater than 1.0. Seven items were deleted because of lower factor loading or cross-loading problem. They are “Souvenirs of the Expo are varied and special,” “Broadcasts and electronic screens in the Expo Park are useful,” “The Expo provides facilities for special groups (e.g., the older, the disabled, etc.),” “Waiting time for the entry to pavilions is long,” “The Expo is too crowded to visit,” “There are some misbehavior among the visitors,” and “Transportation to the Expo Park is convenient.” The Kaiser–Meyer–Olkin (KMO) and Bartlett’s test results indicate the appropriateness of the factor analysis, with the measure of sampling adequacy 0.916 and chi-square of 13326.64. Table 3 demonstrates the results of the factor analysis. The extracted six factors account for 56.05% of the variance in total.
Exploratory Factor Analysis of Event Image for the Pilot Study (N = 296)

Step 2: Purifying the Measurement Scale
Profile of respondents
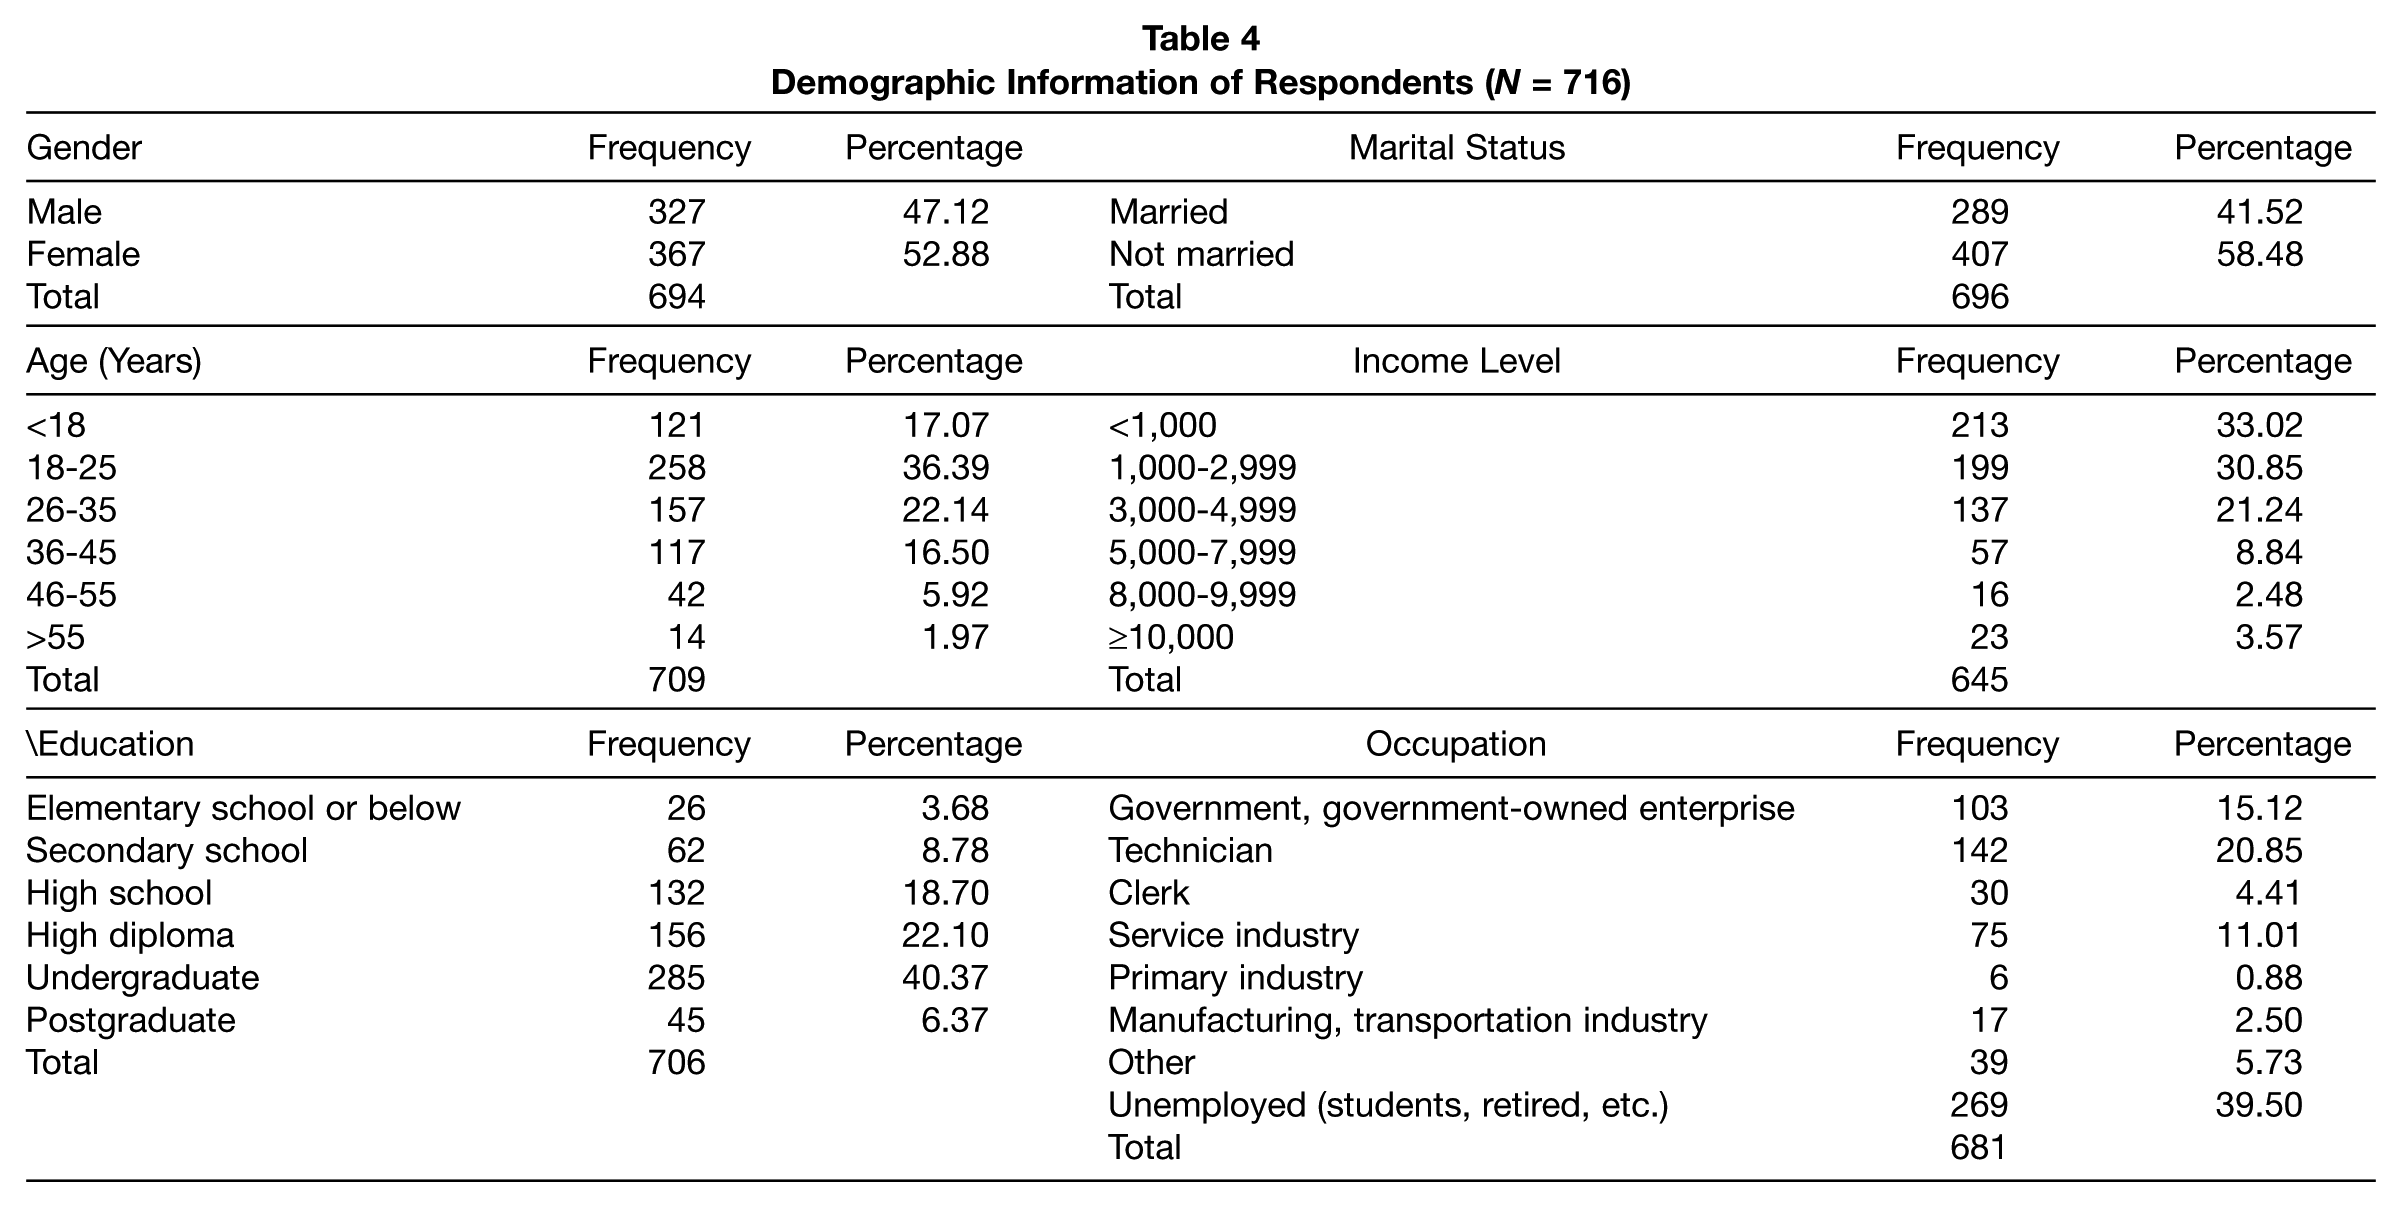
The demographic profile of the respondents is presented in Table 4. Female respondents (52.88%) slightly outnumber male visitors (47.12%) and there are more single visitors (58.48%). The age distribution demonstrates that more than 90% of visitors are 45 years old or younger, whereas visitors 46 years or older only account for 7.89% of the total sample. Among the majority group, the 18- to 25-year age-group is the largest one (36.39%) followed by the 26- to 35-year age-group (22.14%). The income level of most of the respondents is lower than 5,000 RMB. The largest group is those with less than 1,000 RMB (33.02%), which is probably because students and retired people belong to this group. Sixty-two percent of the respondents received higher education, with 40.37% of them reporting undergraduate degree and 22.10% of them reporting higher diploma. Except for the 39.50% unemployed visitors including students, retired people, and others, the occupations of the respondents are diversified: The largest group is technicians (20.85%), followed by employees in government or government-owned enterprises (15.12%); another group worth of noting is people in service industry, which constitutes 11.01%.
Demographic Information of Respondents (N = 716)
Data cleaning
The data collected from the main survey went through the data cleaning process to identify the cases with large number of missing data and outliers. Consequently, problematic cases were deleted from the original data set and the final sample size was reduced to 716. Expectation maximum imputation was adopted as the remedying strategy for missing data for following analysis. The normality test for the data shows that the data only follow the univariate normal distribution, and fail to achieve the multivariate normality. Although the multivariate normality is the theoretical prerequisite for the maximum likelihood estimation (MLE) method, some researchers (Hair et al., 2010; Olsson, Foss, Troye, & Howell, 2000; Savalei, 2008) through theoretical calculation and empirical tests, prove that the MLE is fairly robust to the violation of the normality assumption. Therefore, the MLE method was finally adopted to estimate the model in the structural equation modeling analysis. The valid 716 questionnaire collected from the main survey was then randomly split into two samples, 191 for EFA and 525 for CFA.
Exploratory factor analysis
Before EFA, data examination had been conducted to check and accommodate missing data, meet the underlying statistical assumptions, and identify outliers that might disproportionately affect the results (Hair et al., 2010). To examine whether the data are suitable for factor analysis, the Kaiser–Meyer–Olkin (KMO) and Bartlett’s test were conducted (Field, 2005). The KMO value is 0.865, which falls into the range of being great (values between 0.8 and 0.9 are great), so it is confident to conclude that factor analysis is appropriate. Bartlett’s test shows the value of 1765.608 with significance level of .00, which indicates that there is some relationship between the variables we hope to include in the analysis. In sum, the factor analysis is appropriate for the data set. Principal component factor analysis was used to extract factors with eigenvalues greater than 1, and varimax method was adopted to rotate the data for easy interpretation.
The results from EFA are shown in Table 5, with the reliability test for each factor. Four rounds of analysis were conducted to generate six factors with eigenvalues greater than 1. Nine items were deleted either due to cross-loading or factor loading lower than 0.4. The deleted items include “The Expo is large scale,” “The Expo displays advanced technologies and design concept,” “Pavilions of the Expo are attractive and unique,” “Souvenir stores in the Expo Park are conveniently located,” “Visitor information centers in the Expo Park are well distributed and convenient,” “There are varied F&B [food and beverage] services in the Expo Park,” “F&B services in the Expo Park are well distributed,” “The Expo sells varied kinds of tickets, which satisfy the needs of different people,” and “This visit makes me relaxed.” The total variance explained by these six extracted factors amounts for 67.055%.
Exploratory Factor Analysis of Event Image (N = 191)
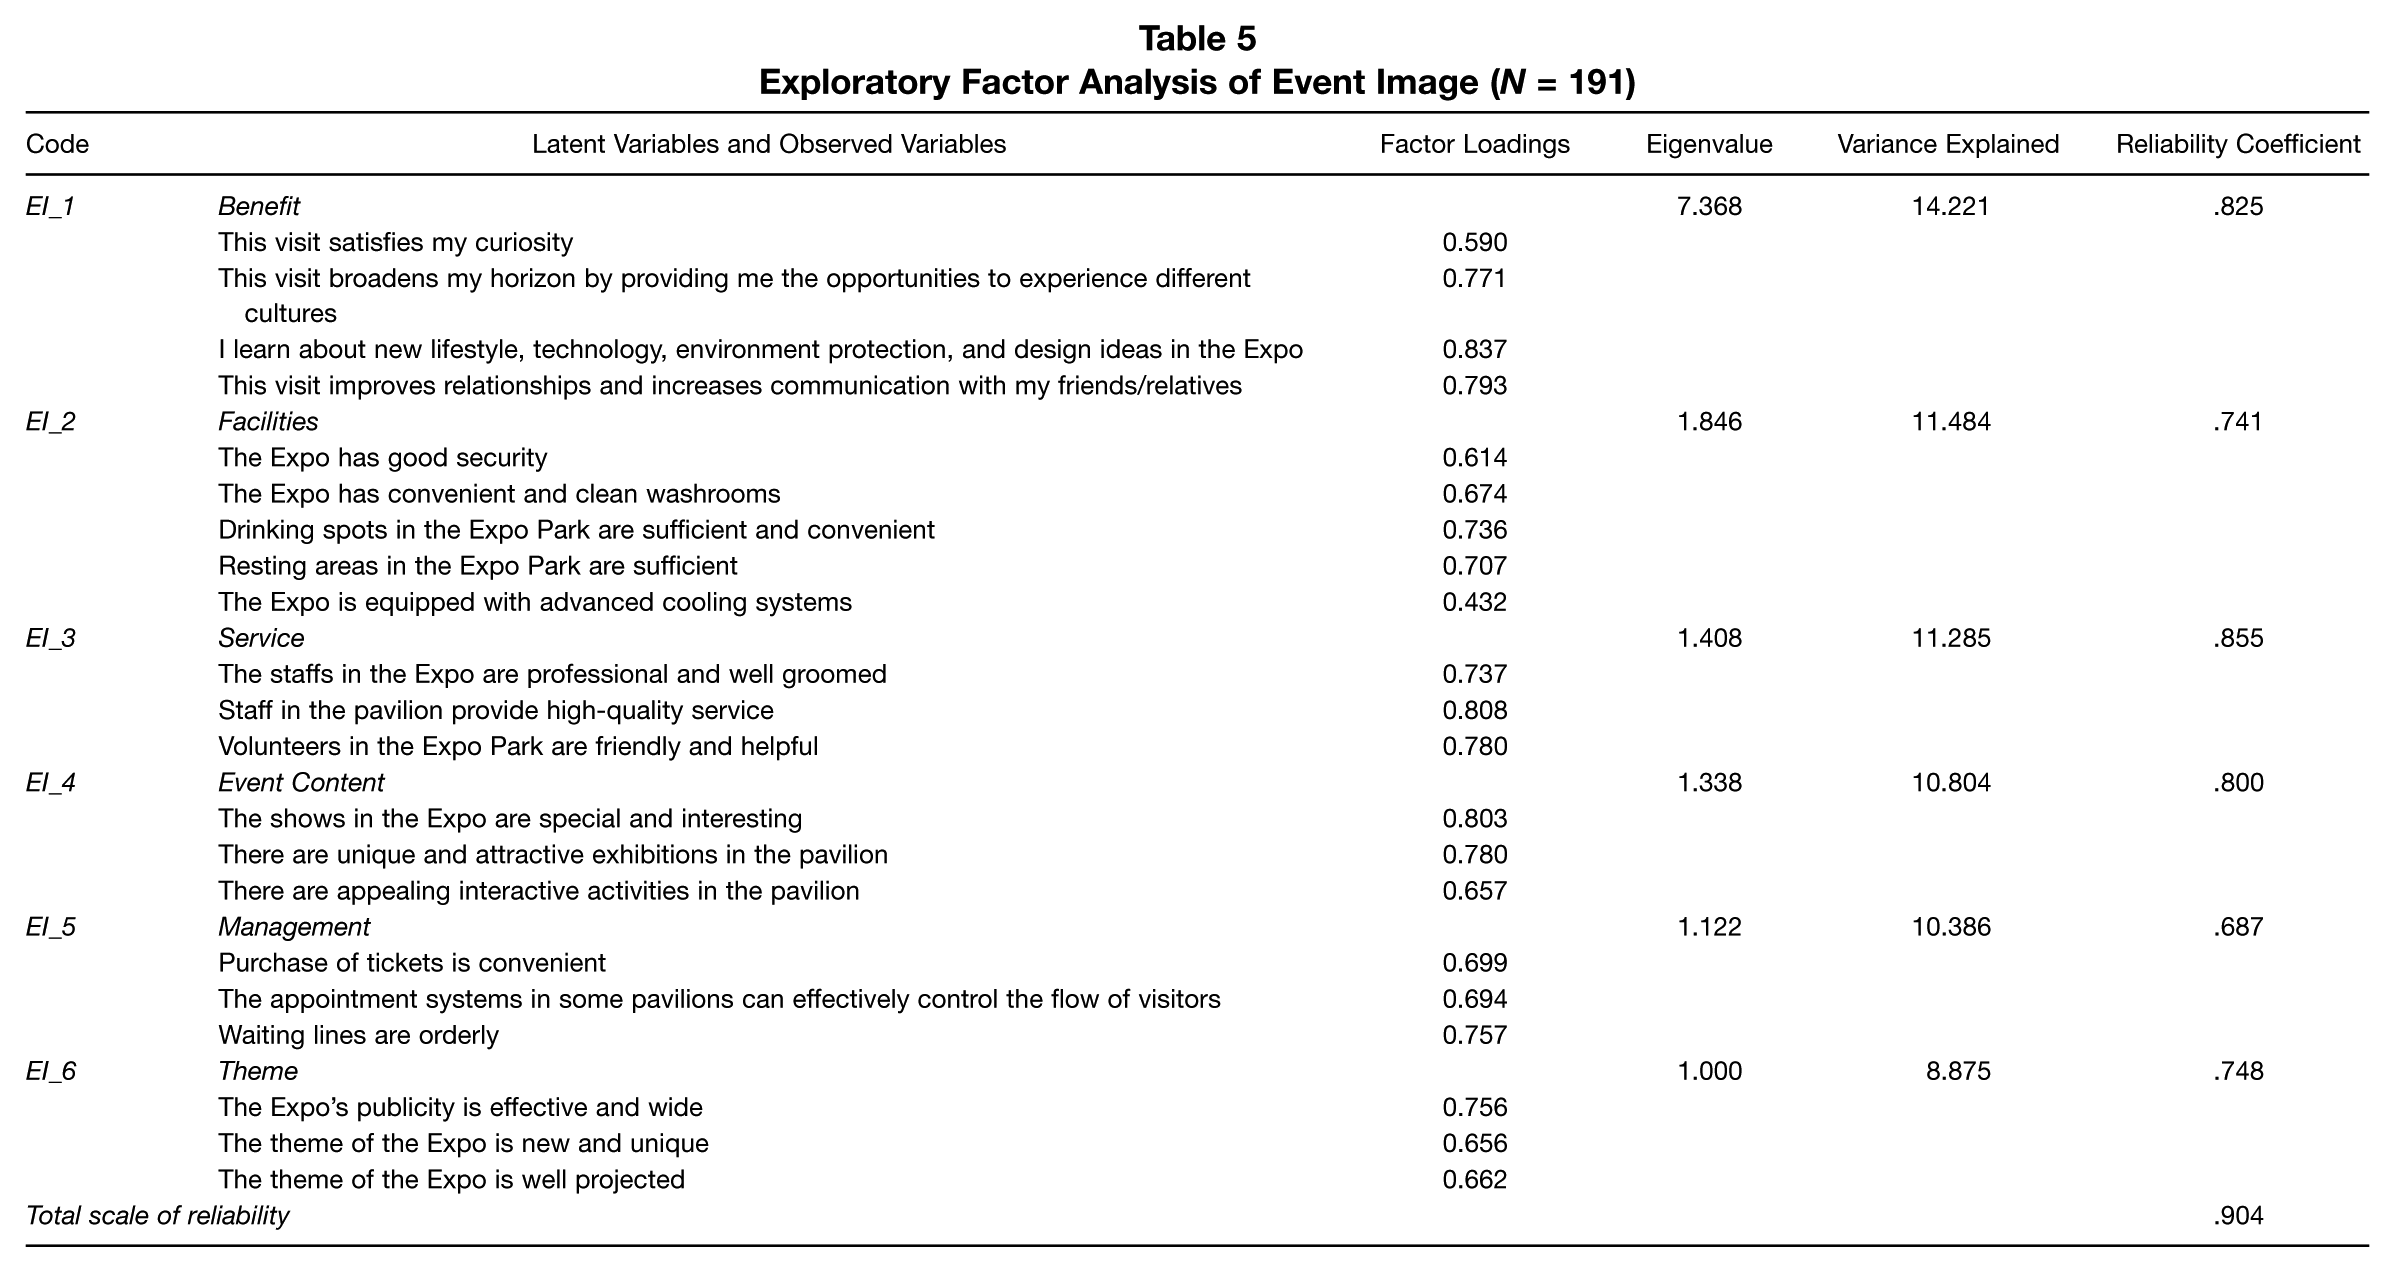
The first dimension consists of four items and explains 14.221% of the total variance for the event image construct. Since all the items under this dimension are concerned with various kinds of benefits gained by tourists by attending this event, this factor is named as Benefit.
There are five items loaded on the second dimension, and all the items represent tourists’ perception about different facilities in this event. Therefore, this factor is labeled as Facilities, and this dimension accounts for 11.484% of the total variance.
The third underlying dimension of the event image is called as Service, which contains three indicators: “The staffs in the Expo are professional and well groomed,” “Staff in the pavilion provide high-quality service,” and “Volunteers in the Expo Park are friendly and helpful.” This factor explained 11.285% of the total variance.
Three items, “The shows in the Expo are special and interesting,” “There are unique and attractive exhibitions in the pavilion,” and “There are appealing interactive activities in the pavilion” are included in the fourth dimension. These indicators are related to different activities, exhibitions, and performances in the event, so this dimension is named Event Content, which makes up 10.804% of the variance.
The next dimension is concerned with some management issues of this event, so it is termed as Management, covering ticket purchase, appointment system of some pavilions, and also the waiting line issues. The loaded items on this factor are “Purchase of tickets is convenient,” “The appointment systems in some pavilions can effectively control the flow of visitors,” and “Waiting lines are orderly.”
The last factor, which explains 8.875% of the total variance, includes three items: “The Expo’s publicity is effective and wide,” “The theme of the Expo is new and unique,” and “The theme of the Expo is well projected.” These items describe some general and overall impression or evaluation of this event, so it is named as Theme.
As with the reliability of this construct, Cronbach’s alpha tests were carried for each factor and also for the overall measurement. All the reliability coefficients of these six factors are greater than .6, which indicates relatively good internal consistence. The reliability of the overall measurement is very good, which is indicated by the Cronbach’s alpha value of .904.
Step 3: Finalizing the Measurement Scale
Confirmatory factor analysis
AMOS was used to perform CFA in order to finalize the measurement scale, and in total, three rounds of analysis were conducted. In the beginning, according to the results of CFA, the original measurement model was specified, which included 21 indicators. As shown in Table 6 (Model A), the overall fit of this measurement model is relatively satisfactory, because all the indices fall into the satisfactory region. However, after the model estimation and model assessment, the standardized factor loadings of two items: “The Expo’s publicity is effective and wide” and “Waiting lines are orderly,” were below the cutoff point, 0.5, and therefore were deleted.
Model Fit Indices of the Event Image Measurement Models
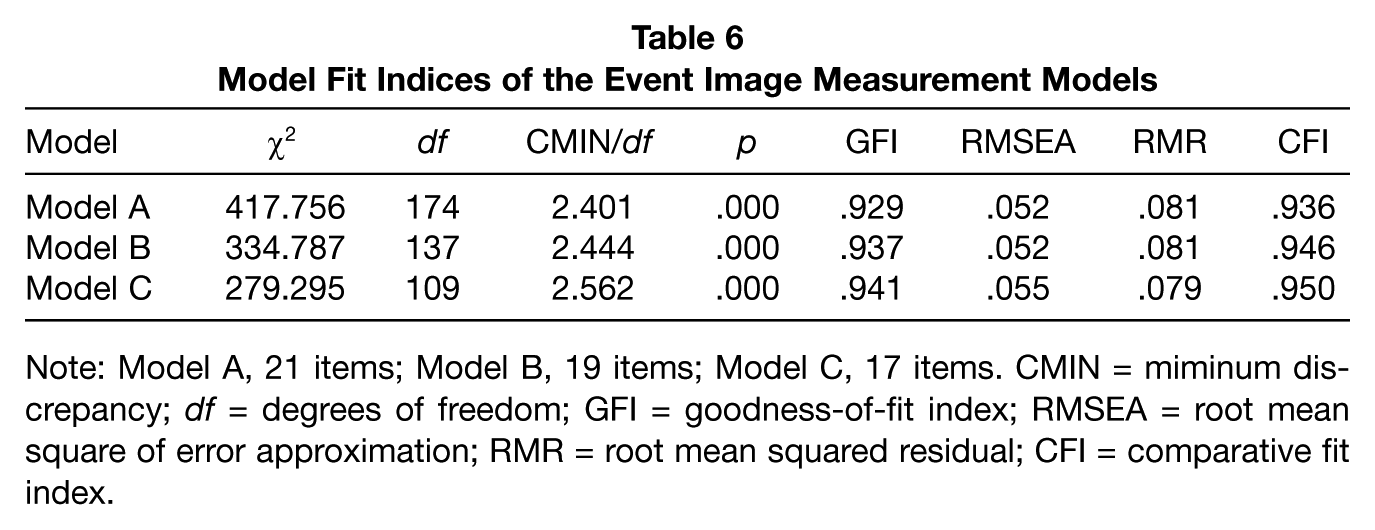
Note: Model A, 21 items; Model B, 19 items; Model C, 17 items. CMIN = miminum discrepancy; df = degrees of freedom; GFI = goodness-of-fit index; RMSEA = root mean square of error approximation; RMR = root mean squared residual; CFI = comparative fit index.
Next, another measurement model, which is named as Model B, was specified excluding items “Effective and wide publicity of the expo” and “Orderly waiting lines,” and estimated. Table 6 demonstrates the comparative results between the original model and the revised one, and it can be seen that the model fit improves a little, specifically, the goodness-of-fit index (GFI) and comparative fit index (CFI) show noticeable increase. However, during the model validity and reliability assessment, one factor, Management, has very poor construct reliability (CR) and convergent validity. Its CR value is .538, which is below the minimum requirement .6, and its average variance extracted (AVE) value is 37.72%, which is also far below the cutoff point of 50%. Therefore, the two items, “Purchase of tickets is convenient” and “The appointment systems in some pavilions can effectively control the flow of visitors,” in this factor were considered for deletion.
Last, a Model C, excluding previous mentioned two items, was specified after modification on the basis of Model B. According to the estimation results, the model fit of this model is comparatively better, which means that after the model modification, the theoretical model fits the data better. The GFI and CFI increase and reach close to the admirable level of .95.
After the model diagnosis and modification, Table 7 summarizes the estimation results of the final revised measurement model, including the standardized factor loadings, error variance, and probability level for each observed variable, and AVE value and CR value for each factor. Five latent factors, including 17 indicators, were named as Benefit, Facility, Service, Theme, and Event Content.
Confirmatory Factor Analysis of Event Image Measurement (N = 525)
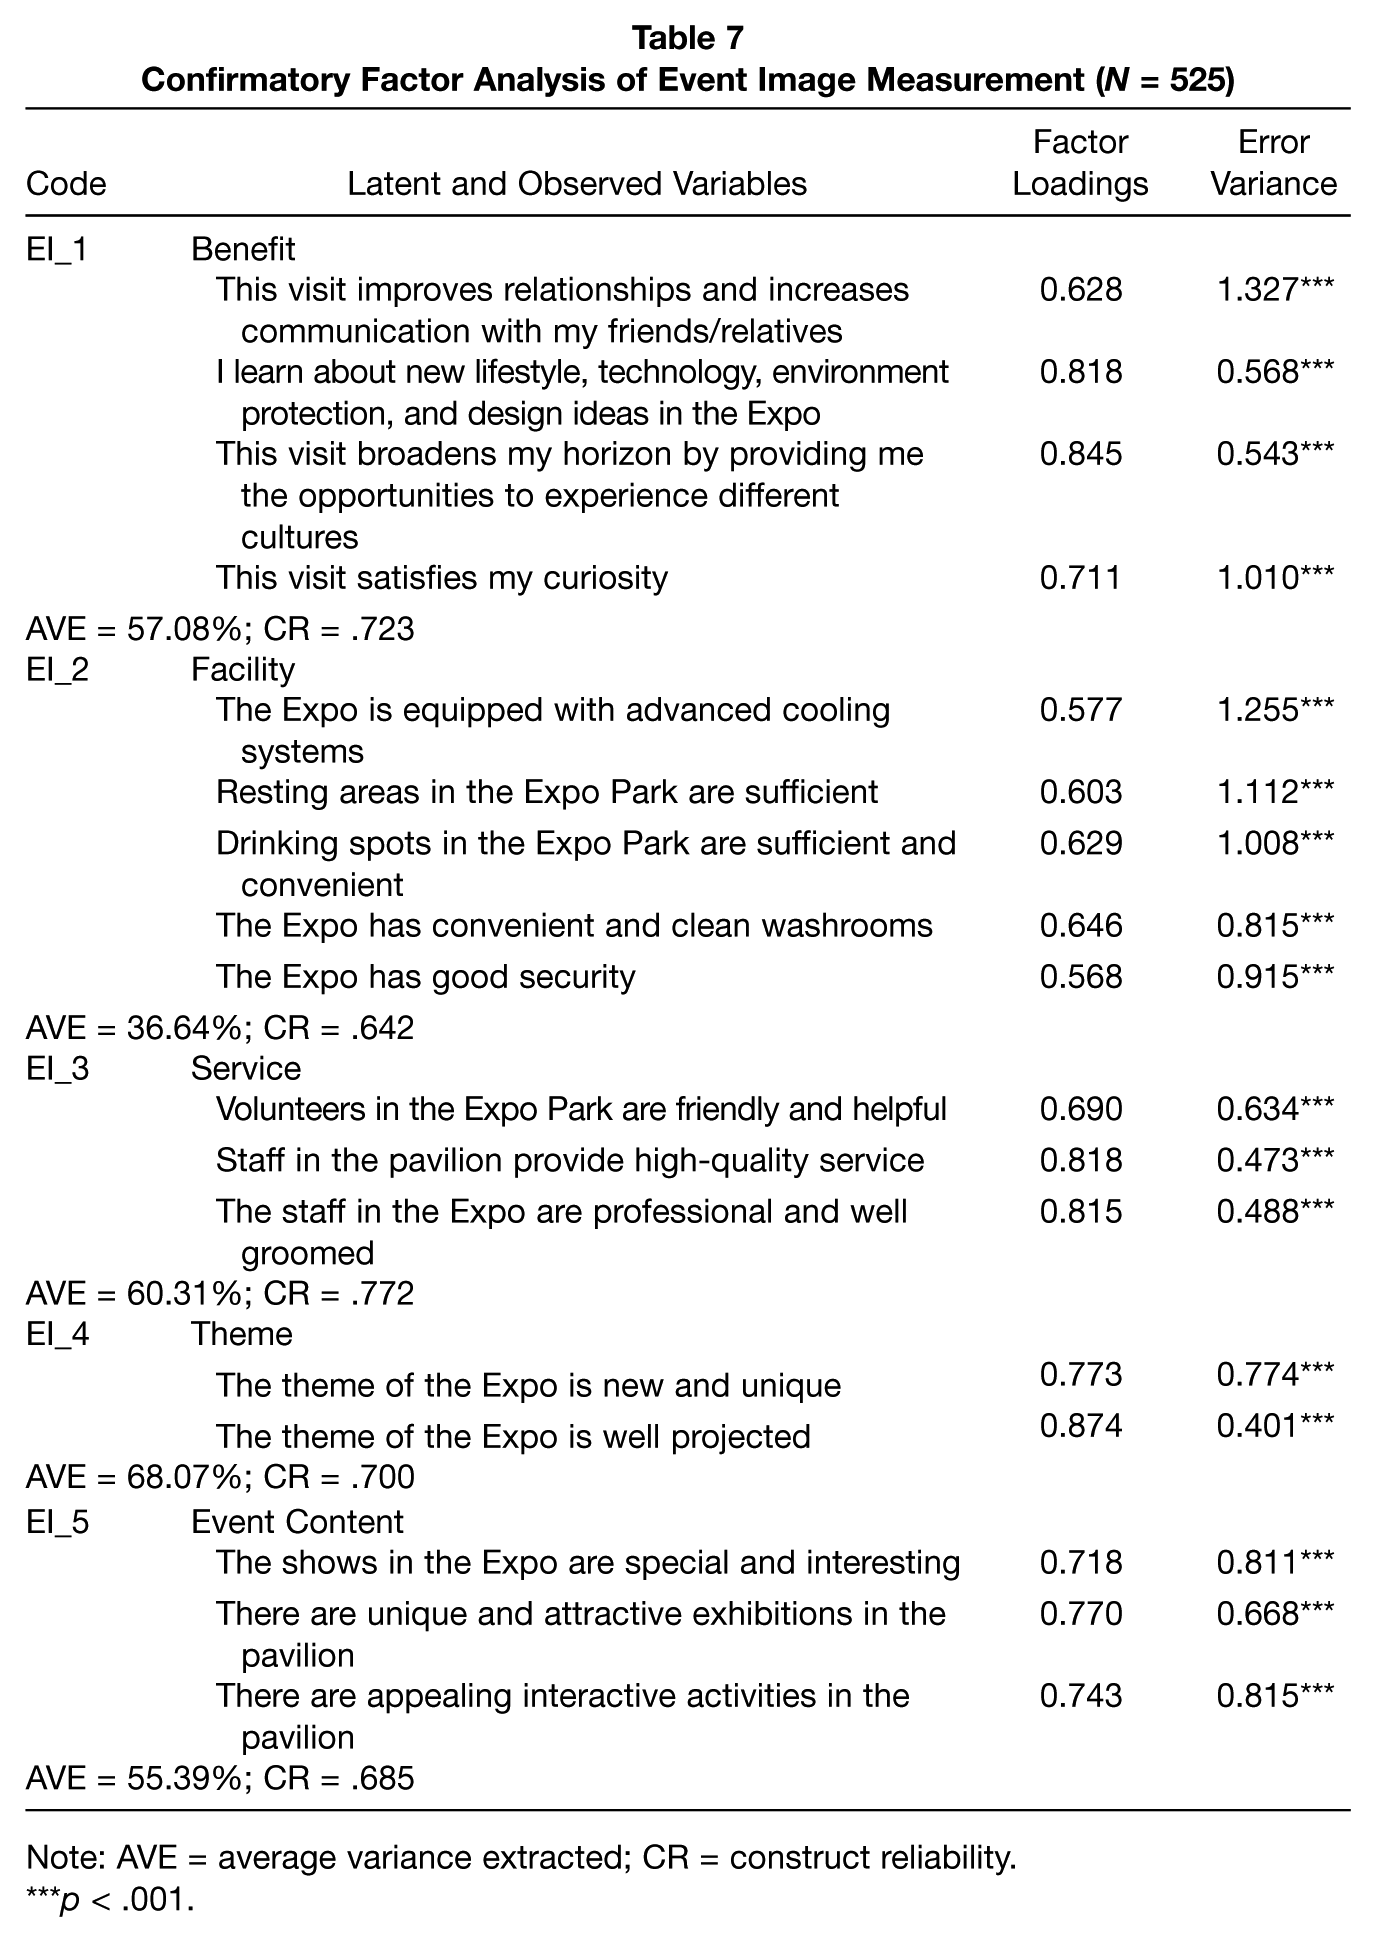
Note: AVE = average variance extracted; CR = construct reliability.
p < .001.
Construct reliability and validity
As with the reliability of factors in this model, all the CR values are greater than the critical value of .6, and three of them reach the ideal level of .7 (Hair et al., 2010). The results suggest that this measurement model of the event image has relatively strong composite reliability.
For the construct validity, two types of validity were examined: convergent validity and discriminant validity. First, convergent validity refers to “the extent to which indicators of a specific construct converge or share a high proportion of variance in common” (Hair et al., 2010, p. 689). A good rule of thumb is that the standardized factor loading estimates should be 0.5 or higher, and 0.7 ideally, and AVE values 0.5 or greater suggest adequate convergence. The analysis results show that all the factor loading estimates are all higher than 0.5 and at the same time statistically significant. The AVE values of all the constructs, except the Facility, are all greater than 0.5, which means that more than 50% of the total variance could be explained by the observed variables. The Facility construct’s AVE is only 0.3664, which is below the cutoff point 0.5, so this construct may be questionable because only 36.64% of total variance of this construct is explained by these indicators. After further investigation, it is found that statically, the low AVE value results from the low community among some of the items in the dimension. From theoretical perspective, the low community can be explained, because the facility of an event usually covers a very wide range of amenities. Furthermore in some previous image studies (e.g., Beerli & Martın, 2004b; Gallarza, Saura, & Garcia, 2002), there are even several dimensions representing the single Facility construct, such as visitor service facility, safety environment, and general infrastructure. Most important, this construct is regarded as a very basic and important dimension for the event image, so it is retained for further observation and investigation. Overall, the convergent validity of these five factors in this measurement model can be assumed.
Discriminant validity means “the extent to which a construct is truly distinct from other construct” (Hair et al., 2010, p. 689). The correlations among each construct will be examined and any correlation coefficient higher than .8 suggests potential problems among these two constructs. The discriminant validity is usually assessed by comparing the AVE values for any two constructs with the square of the correlation estimate between these two constructs, and the AVE values should be greater than the squared correlation estimate (Hair et al., 2010). As Table 8 displays, all the correlation coefficients fall into an acceptable range between 0.283 and 0.627. Then, the AVE values of any two of these five constructs were compared with the squared correlation estimate between these two constructs, and finally all the AVE values are greater than the squared correlation coefficients. Therefore, the discriminant validity of this measurement model is assessed as satisfactory.
Correlation Matrix of Event Image

Correlation coefficients.
Square of the correlation coefficients.
Conclusion and Discussion
Following the scale development procedure suggested by Hair et al. (2010) and Churchill (1979), this study developed and tested a measurement scale for event image with data collected in 2010 Shanghai World Expo. Adopting Keller’s (1993) framework of brand image as the conceptual base, the study first provided a working definition of event image. Then in-depth interviews using the free associations method were followed to identify an initial pool with 50 preliminary items. Experts were consulted to check the content validity and to further purify the research instrument. After a pilot study with 302 respondents, EFA was conducted with 296 valid data using the 37 items to explore the preliminary underlying structure of the event image and finalize the research instrument for the main survey. In the main survey, 716 valid questionnaires were collected and split into two samples for following analysis. Six factors with 21 items were generated from the EFA and those items were further validated by CFA. As a result, 17 items were retained and five dimensions were extracted. The analysis results also indicate satisfactory reliability and validity of this event image measurement scale.
Although every event varies because of a number of factors, the results of this study to some extent confirmed previous theoretical proposition and empirical studies. The current study adopted the definition of event image as “perceptions of an event as reflected by the associations in consumer’s memory” by following Keller’s (1993) theoretical framework of brand image. Through data analysis, five dimensions were identified including “Benefit,” “Facility,” “Service,” “Theme,” and “Event Content.”
Benefit dimension refers to the benefits gained from the visit experience from this event. Some of the benefits were derived from the fulfillment of the original motivations to the events, whereas some were unexpected gains. This benefit component was consistent with the benefit dimension of the brand image in Keller’s (1993) framework and the affective dimension of destination image studies (Baloglu & McCleary, 1999; Gartner, 1993). Among all these five dimensions, benefit was perceived as the most important aspect of the event image, probably because this factor is most related to visitors’ personal gains and losses. As an international and world-class educational event, the World Expo not only helped visitors improve themselves by satisfying their curiosity, broadening their horizons, and experiencing various new cultures and ideas but also provided them with a great social opportunity to improve their relationship with friends and relatives and to increase communication with others. By understanding the benefits of the event, the event organizer would, from another perspective, evaluate the success of this event, and have an insight of whether the projected purposes of this event for its target were attained.
All other dimensions of the event image were concerned with the cognitive evaluation of various aspects of this event, such as visitors’ facilities, service quality, event content, and event theme. Among the perceived attributes of the event image, event content, which, in the current study, stands for diversified exhibitions, activities, and performances in the event, is basically consistent with some empirical event image studies (Foxall, 1996; Mehrabian, 1980; Osgood et al., 1957), in which event activities are identified as an important dimension of the event. The event content identified in this study could suggest that the content of the event and the diversity of these contents are equally important for the success for an event.
The facilities in the event designed for the visitors was evaluated as the second important cognitive component of the event image, which covers a wide range of facilities and equipment. Actually, the planning and construction of the 2010 Shanghai World Expo, which lasted 5 years since 2005, was a huge project, covering landscape, pavilions, transportation, public facilities, and so on. The ancillary facilities in the Expo Park included restaurants, shopping facilities, telecommunication, rest rooms, and and so on (Expo 2010 Shanghai China, 2010c), and the investment in the facilities maintaining and management amounted to US$99 million (163 News, 2010). From the perception of visitors, the innovative technology adopted in the event first attracted their attention and also was highly appraised. Among the traditional facilities in the event, the resting areas, drinking spots, washrooms, and security were consistently paid attention to, possibly because these are the frequently used facilities by the visitors during their visit experience. This result can provide some insights for the event developer about some aspects considered important from the visitors’ perspective.
In addition to the tangible facilities, the intangible aspect, the service, was also regarded as a very critical aspect of the event image. The service is not only confined to the service provided by the working staff in various pavilions but also refers to the service offered by the volunteers. For any large-scale event, the volunteers play an essential role. In the case of the 2010 Shanghai World Expo, its organization committee recruited and trained more than 1.7 million volunteers from universities and society. The volunteer service is not only confined to the World Expo Park, which covered an area of 5.28 km2 and had almost 100 pavilions (Expo 2010 Shanghai China, 2010b) but also extends to the whole city. In such a large-scale event, the arrangement and distribution of these well-trained volunteers acted as a positive catalyst in the event image building and reinforcing process.
The theme of the event was identified as a noteworthy aspect of this event. The theme of this world expo is “better city, better life” and five subthemes: blending of diverse cultures in the city, economic prosperity in the city, innovation of science and technology in the city, remodeling of communities in the city, and rural–urban interaction (Expo 2010 Shanghai China, 2010a). The new and unique theme of the event attracted great attention, and the projection of this theme was also thought of as good and wide. For the event organizer and developer, this finding illustrates that the design of the event theme is equally important, and can act as a significant attraction for the event.
The study has both theoretical and practical contributions. Although the event has been widely recognized as a catalyst for tourism development and has been therefore studied by many scholars, previous studies suffer from the absence of theoretical foundation and the measurement scales either adopted a holistic approach or focused on limited dimensions only. Grounded in the ANMM, the study addresses this gap by providing a comprehensive understanding of the meaning and dimensionality of event image. Through rigorous and systematic qualitative and quantitative methodology triangulation of free association, this study developed a comprehensive, reliable, and valid measurement scale for the event image of the 2010 Shanghai World Expo. Five underlying dimensions of event image, which cover not only various cognitive attributes of the event but also event benefits dimension, were identified. Therefore, this study could contribute to event image literature by exploring its psychological formation mechanism, conceptualization ground, and dimensionality framework. In addition, the study is valuable in providing a starting point for future studies on event tourism.
At the same time, practical implications for practitioners in the event industry could be drawn as well. According to statistics released in the official website of the 2010 Shanghai World Expo, there were 73,084,400 visitors. By estimation, approximately 94% of the attendees were Chinese nationals (Expo 2010 Shanghai China, 2010a). However, because of the long duration and the large number of visitors, detailed statistics of the visitation was hard to attain. Although the current study adopted a nonrandom sampling method, whose focus was on domestic tourists, information collected from the present study could, to some extent, offer a close look at the Chinese domestic event tourism market. In the present study, attendees to the World Expo were quite diversified in terms of age, occupation, education level, and income level. As a world-class mega event, the 2010 Shanghai World Expo successfully attracted great attention and interest from the Chinese domestic market with different backgrounds, which suggests a huge potential for China’s event tourism market. Moreover, the event image identified for the 2010 Shanghai World Expo could provide useful implications for the organizers of the Shanghai World Expo and other mega events. The results of this study showed various specific aspects of the 2010 Shanghai World Expo, such as event facilities, service, theme selection and projection, and event content. Although in the scale development process, many items were removed, some of them are still worth of attention, because they represent some Chinese cultural or socioeconomic influences. For instance, since for many Chinese visitors, this was the first time to attend such a large and world-class event, satisfying the curiosity was a main benefit. Visitors’ perception of the F&B service also reflects the importance of cuisine for Chinese people’s travelling experience. Some qualitative results of the current study also revealed some problems in this event, such as the queue management issue and the regulative issue of visitors’ behaviors, which indicates in China, the education on appropriate travel and visit behavior is still limited. Other mega-event organizers could also learn from this study that besides traditional aspects of a mega-event, some other aspects, such as service and theme, play an equally significant role in attendees’ evaluation and responses for the event.
This study also bears some limitations. First, this study is exploratory in nature, so the underlying structure of event image should be verified by using multiple samples. Second, the data used in the current study were collected by the judgmental sampling method, which is a nonrandom sampling technique, so the generalizability of current studies’ findings might be restricted. Finally, this study is conducted in the context of one single mega event: 2010 Shanghai World Expo. Therefore, this construct needs to be validated in multiple contexts, which requires future research dedication and efforts.
Footnotes
Authors’ Note:
This study was supported by The Hong Kong Polytechnic University.