
Abstract
In the context of extensive smart developments in amusement parks, this study aimed to understand how different smart tourism technologies could be transferred into tourists’ expectations of smart tourism experiences. Drawing on the Quality Function Deployment (QFD) methodology, this study established a House of Quality (HoQ) for smart developments by analyzing data from 20 interviews (10 tourists and 10 service providers) and 300 survey responses (250 tourists and 50 service providers). The results identified 14 smart tourism technologies in amusement parks, and revealed that they correlated in different ways with the four smart tourism experience attributes (accessibility, informativeness, interactivity, and personalization), thus laying a theoretical foundation for more comprehensive discussions of smart tourism design, and providing practical implications for staging the smart tourism experience in a better way.
Keywords
Highlights
We identified 14 smart tourism technologies in amusement parks.
We found that interactive experience aligns with the hedonic characteristic of amusement parks.
We show that personalization is the least important experience attribute in amusement parks.
We propose a framework for guided smartness development in amusement parks.
Introduction
The adjective “smart” is used as prefix to describe all kinds of tangible and intangible objects that people subjectively judge to be smart. Despite the intuitive yet impalpable nature of the word “smart” (Gelter et al., 2021), it is widely recognized that technology holds a central position in many smart products; technological applications are recognized as a goal for the development of smartness (Buhalis, 2019). The tourism industry has not been an exception for smartness development since former United Nation World Tourism Organization Secretary-General Taleb Rifai coined the buzzword "smart tourism” in 2010 to suggest it as the future of tourism development (“UNWTO chief upbeat on prospects for new global tourism boom,” 2010), because technology has significantly affected the tourism industry in various ways (Huang et al., 2017), with GlobalData (2022) reporting that there have been over 15,000 technological patents filed and granted in the tourism industry for the last 3 years.
Technologies (e.g., virtual reality technologies and mobile technologies) in smart tourism are different from those technologies (e.g., global distribution systems and reservation systems) that emerged in the eTourism era mainly to help tourism businesses manage travel-related information, because they are more tourist-oriented to stage better travel experiences (Au & Tsang, 2022a). In this line of thinking, Alter (2020) even asserted that smartness in tourism does not exist until tourists recognize it. Despite the important role of tourists in smartness development, most existing literature was developed mainly from the tourism service provider’s perspective to support smartness development by merely encouraging extensive smart technological applications in a particular tourism site (Bastidas-Manzano et al., 2021), overlooking the tourist’s perspective in smartness development (Au & Tsang, 2022b).
However, the tourism industry has increasingly discovered that many smart technological applications do not satisfy tourists as expected, because the high-tech nature sometimes fails to align with tourists’ leisure and social needs in travel activities (Davari et al., 2022). For example, a smart queuing system was designed in Amsterdam to better manage visitor flows and enhance tourist experiences at tourism attractions, but the number of investors dropped rapidly, and this smart system was given up by the developer only 3 months after its establishment (Johnson et al., 2021). While it may seem assertive to claim that tourists are inherently anti-digitalism on vacations, many scholars have consistently discovered the “technological pause” phenomenon in tourism activities (e.g., Kelly et al., 2017; Leung et al., 2020), implying a large knowledge gap between tourists’ expectations and service providers’ understandings of tourists’ expectations in smartness development (Rosenbaum & Wong, 2015).
There are two main lines of research in the literature, narrowing this knowledge gap in smartness development (Mehraliyev et al., 2020). The first adopts behavioral theories (e.g., Technology Acceptance Model and the Theory of Planned Behavior) to focus on tourists’ perceived technology performance (e.g., perceived usefulness and perceived ease of use; Azis et al., 2020; Chung et al., 2015), whereas another research line follows the stimuli-organism-response paradigm to treat smart tourism technology as various experience attributes (e.g., innovativeness, efficiency, and personalization) that function as external stimuli to enhance overall tourism experience (Huang et al., 2017; Jeong & Shin, 2020; Lee et al., 2018). While these two research lines offer important insights into smartness development from a tourist’s perspective, Deng and colleagues (2010) asserted that merely investigating technology performance and experience nature presents a limited view of technical design practices and thus restrains the practical relevance of research findings. Since technical design is known to result in one of the most dissatisfying aspects in any consumption experience (Meuter et al., 2000), it is important to understand the typology of smart tourism technologies in smartness development and translate them into smart tourism experience attributes from a tourist’s perspective.
Given the aforementioned research gap, this study was conducted in the amusement park context to achieve three baseline research objectives: (1) to assess tourists’ preferences regarding the attributes of the smart tourism experience in a smart amusement park; (2) to assess service providers’ perceptions of the goals of these attributes in a smart amusement park; and (3) to translate tourists’ preferences into elements of relevant smart tourism technical design in amusement parks. The Quality Function Deployment (QFD) methodology was employed to identify proper technological design features (i.e., typology of smart tourism technologies) through translating tourists’ expectations on smart travel experience attributes into design targets (Akao, 1990). The QFD methodology has been widely proven to improve experience design in the tourism and hospitality setting (Han et al., 2019; Kayapinar & Erginel, 2019; Lehto & Lehto, 2019), because it helps understand how customers value the entire consumption process (Pullman & Gross, 2004) and further allows the unveiling of multifaceted interactions between technical design characteristics, tourist’s preferences, and service provider’s considerations (Park et al., 2021).
Literature Review
Smart Tourism Development at Amusement Parks
With the rapid pace of technological development, it is unsurprising that the word “smart" has been applied in tourism, as the industry has witnessed an ongoing trend to adopt various information and communication technologies (Benckendorff et al., 2019). Unlike eTourism, in which technologies were used to navigate one-way service provider-to-tourist communication, smart tourism facilitates interactions among tourists, service providers, and technologies in prompt, automatic, intuitive, and efficient ways (Buhalis & Leung, 2018). Smart tourism is “an [smart technology]-integrated tourism platform, which integrates tourism sources and smart technologies” (Wang et al., 2016, p. 310) to stage value-added customer experience (Gretzel et al., 2015). One of the major beneficiaries is the amusement park sector (Choe & Fesenmaier, 2017), because smartness development in amusement parks help systematize the service delivery process (Tsang et al., 2012), engage tourists with seamless cocreation activities (Prideaux et al., 2018), and facilitate effective crowd management (Brown et al., 2013; Heung et al., 2009).
While technology has been widely applied in the amusement park industry, investigations on its smartness development are seriously lagging behind (Zhang et al., 2021). As discovered by Bastidas-Manzano and colleagues (2021), approximately 40% of publications in smart tourism merely focused on technological applications in the tourism industry without connecting them to the concept of smartness. Specifically, investigations on technological adoptions in amusement parks have heavily relied on traditional behavioral theories (e.g., the Technology Acceptance Model and the Theory of Planned Behavior) to explore how virtual reality technology (e.g., Oh & Kong, 2022; Wei et al., 2019) and augmented reality technology (e.g., Hu et al., 2021; Jung et al., 2015) generate tourists’ desirable responses, such as their adoption, visiting, and recommendation behaviors (Azis et al., 2020; Wei et al., 2019).
While the scope of investigations has slowly been enlarged to focus on more diversified forms of technology, such as mobile technology (Tavitiyaman et al., 2021) and robotic technology (Milman & Tasci, 2022), how these technologies emerge into a smart travel experience in amusement parks remains largely unknown. Bastidas-Manzano and colleagues (2021) asserted that smartness is far more than merely technological adoptions—to contain a teleological perspective—that highlight the functional values of technological applications in the tourism industry (Au & Tsang, 2022a). Since smart tourism is the proliferation and integration of smart tourism technologies to generate agile solutions and values (Buhalis, 2019), research gaps have not only emerged from the limited investigations on many other forms of smart tourism technologies, but also from the under-explored integrations of technological applications to support smartness development in amusement parks. In other words, smart travel experience design can only be achieved by understanding how smart tourism technologies cooperate as an assembly to generate additional experience values (Au & Tsang, 2022b).
Smart Tourism Technology Design
Given the strong connection between smartness and technological applications, several tourism scholars have engaged with the field of smart city studies by identifying indicators for smart tourism development. Wang and colleagues (2016) proposed 38 indicators to assess the smartness level of a tourist attraction. Taking a general perspective, Chung and colleagues (2021) proposed a smart tourism index consisting of five sub-categories, 18 pillars, and 48 individual indicators to measure destination smartness. While these indicators provide a practical standard for developing smart amusement parks, most refer to technological penetration, emphasizing the quantity of technological applications (Au & Tsang, 2022b). This exclusive focus on technical indicators of smartness overlooks the possibility that some technologies may be economically inefficient, or provide limited improvements where people are overwhelmed with smart options in the absence of deep reflection on the part of providers about what these technologies are used for (Au & Tsang, 2022a).
This argument was also recognized by Huang and colleagues (2017), who focused on the quality of smart tourism technologies and proposed four smart tourism experience attributes: (1) accessibility, (2) informativeness, (3) interactivity, and (4) personalization. Accessibility represents the extent to which a tourist finds the information offered at the destination accessible using smart tourism technologies, informativeness represents the extent to which smart tourism technologies provide accurate and sincere information; interactivity represents the extent to which a tourist engages in reciprocal communication with other stakeholders via smart tourism technologies; and personalization represents the extent to which smart tourism technologies provide specific information to satisfy tourists’ personal trip planning needs.
While this four-dimensional conceptualization has provided a reliable standard for assessing the quality of smart tourism technologies, most studies have only focused on their outcomes, using them to reaffirm the benefits of smart tourism (e.g., Azis et al., 2020; Jeong & Shin, 2020; Lee et al., 2018). In other words, the typology of smart tourism technologies, and how each smart tourism technology contributes to overall quality, have largely been overlooked. This perspective is important not only because tourists’ adoption behaviors vary across different smart tourism technologies (Au & Tsang, 2022a), but also because not every smart tourism technology satisfies tourists in terms of the four attributes as expected (Mehraliyev et al., 2020). For example, Rosenbaum and Wong (2015) discovered that hotel guests only valued the “accessibility” and “informativeness” features of a smart technology kiosk, because some viewed themselves as being on a “technological pause” during trips. A technological pause phenomenon was also reaffirmed in the restaurant context, where diners were found to engage only with the informativeness features but not the interactivity of a smart ordering tablet (Leung et al., 2020). This technological pause phenomenon does not only challenge the overoptimistic discussion on smart tourism, but also implies a gap between smart tourism technology design and customers’ expectations (Xiang et al., 2021).
Applications of Quality Function Deployment (QFD)
Given the bias towards quantitative investigations of smart tourism (Mehraliyev et al., 2019), we expect the application of QFD to contribute to the literature from a methodological perspective, because it is a “systematic approach mapping the customer’s needs into definable and measurable product and process parameters, using matrices and other quantitative and qualitative techniques” (Bickness & Bicknell, 1995, p. 28). As a customer-driven product design tool introduced by Mitsubishi Heavy Industries Limited in 1972 (Chan & Wu, 2002), QFD adopts the structure of the House of Quality (HoQ) consisting of six sections: (1) customer expectations, (2) planning matrix, (3) design/technical characteristics, (4) relationship matrix, (5) correlation matrix, and (6) management matrix (Hauser & Clausing, 1988; Figure 1).
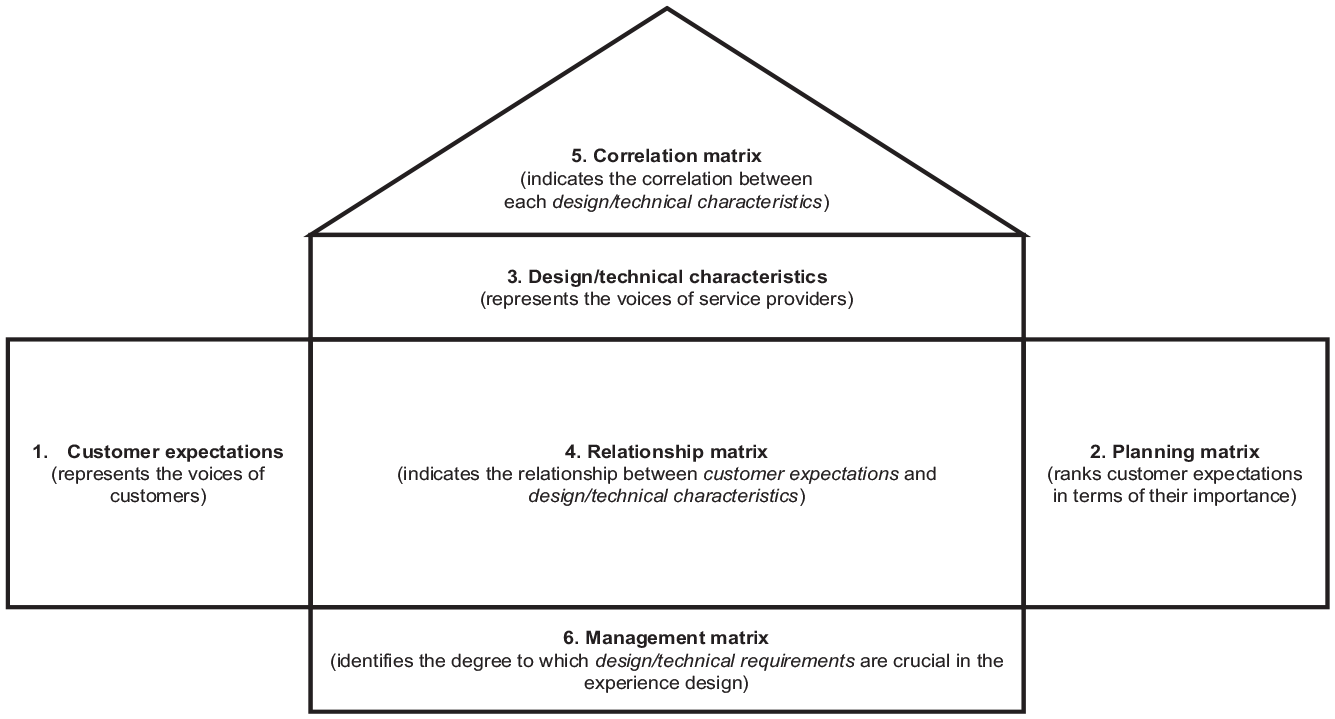
The Framework of HoQ.
Despite its origins in manufacturing studies, the QFD methodology has generated ongoing scholarly attention in the field of technology design, where it has been applied to the quality control charts developed prior to initial production and investment by technology developers and service providers (Chan & Wu, 2002). For example, Wang (2017) applied QFD to identify the key features of smartphones and examine their relationship with customers’ needs and expectations. The application of QFD is not limited to the design of a specific element, but also to the phenomenon of experiential consumption (Chan & Wu, 2002). Lin and colleagues (2019) also incorporated the QFD approach, with a service-dominant logic, to investigate how the dining experience in restaurants could be improved through service design. Han and colleagues (2019) also adopted a QFD approach to investigate how an AR-mediated travel experience should be designed to meet tourists’ expectations in urban heritage sites. Park and colleagues (2021) connected the 16 design/technical characteristics of a self-service technology kiosk at restaurants with six customer requirements using the QFD methodology.
Despite several QFD applications in the tourism and hospitality literature (Table 1), Park and colleagues (2021) asserted that QFD applications remain limited in terms of both quantity and research context. QFD applications have widely been proven a profitable tool for the service industry, because it helps determine an effective development target for the prioritized service characteristics to determine customers’ overall service attribution (Crick & Spencer, 2011; Paryani et al., 2010). In response to the call made by Mehraliyev and colleagues (2020) for greater methodological diversity in the smart tourism literature, this study applied QFD in a smart amusement park design to understand how tourists value smart tourism technology through exploring their relationship with its experience attributes.
Key Tourism and Hospitality Studies Applying the QFD Methodology.

Methodology
Study context
Hong Kong was selected as the study context for three main reasons. First, according to The Travel & Tourism Competitiveness Report 2019 (World Economic Forum, 2019), Hong Kong was ranked as the top destination in three out of eight information and communication technologies (ICT) pillars. As a pioneer in smart city development, Hong Kong has been developing smart tourism since 2017 and officially announced it as a future tourism development direction in 2019 (Ye et al., 2021), thus providing a good study context for understanding smart tourism development from the perspective of both tourists and service providers. Second, Hong Kong has two well-known and top-ranked amusement parks: Ocean Park Hong and Hong Kong Disneyland, that have invested heavily in smart tourism technologies—including mobile technology, virtual reality, and blockchain—to enhance the overall travel experience (“Hong Kong Disneyland Resort Bags Technology Excellence Awards,” 2019; “Ocean Park Raises Its Game,” 2018). Lastly, the investigation in Hong Kong will complement the current bias towards the Korean context in the understanding of smart tourism (Mehraliyev et al., 2019).
Research Design
A seven-step, mixed-method approach was used to develop an HoQ framework; this has been widely recognized as a reliable “road map” or “navigation chart” for translating customer requirements into technical design/product specifications (Hauser & Clausing, 1988; Figure 2).
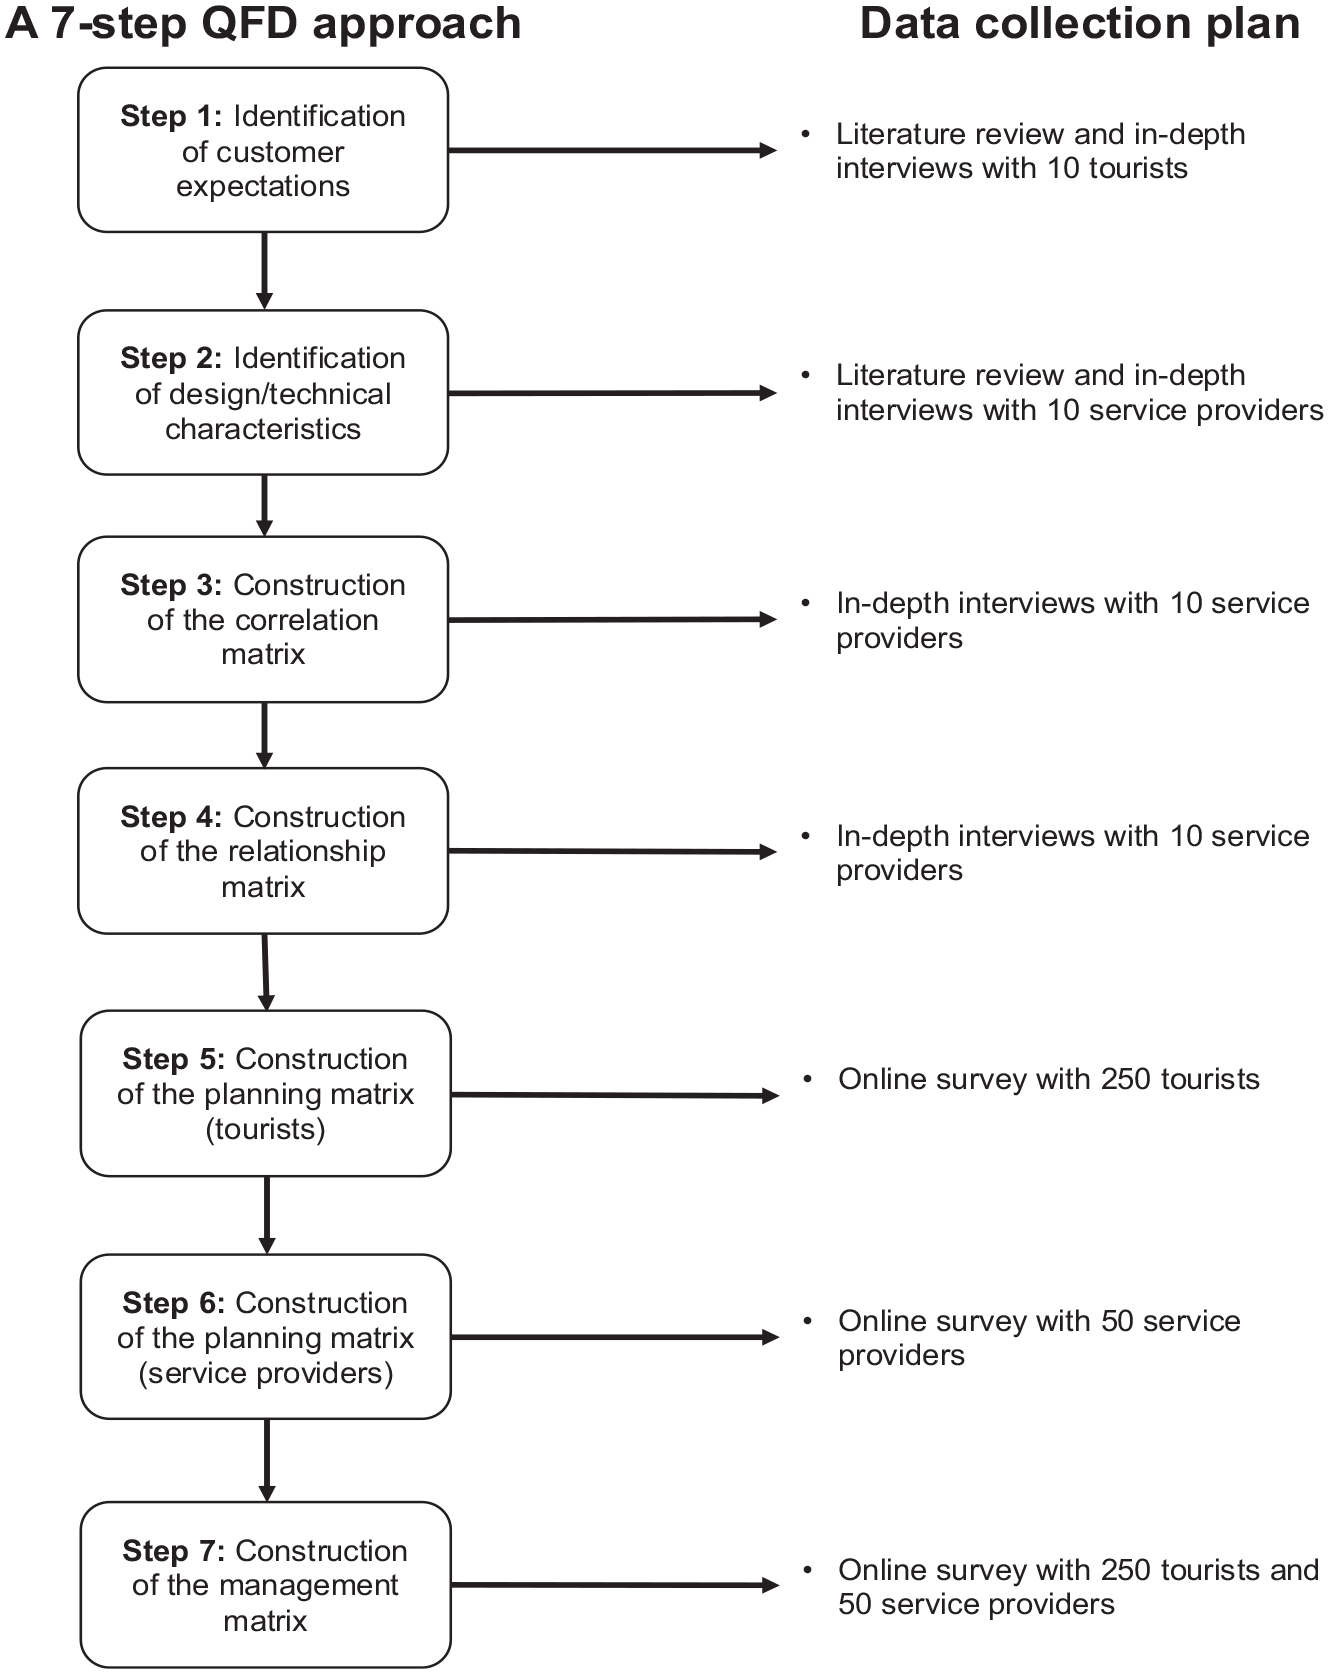
QFD Research Design.
As a customer-driven design tool, the first step in the QFD methodology was the identification of customer expectations and needs, to understand what they (i.e., tourists) expect from their service providers (i.e., a smart amusement park). While Park and colleagues (2021) suggested that scholars may consider using findings from existing literature to determine customer expectations and needs, a qualitative research approach was adopted to delineate variations of tourists’ expectations on smart tourism technologies at amusement parks.
Specifically, 10 in-depth interviews were conducted with tourists who had visited amusement parks in Hong Kong at least once in the last 12 months. Using a convenience sampling technique, the authors shared the interview invitation via social media platforms (i.e., Facebook, Instagram, Twitter, and WhatsApp), all the interviews were conducted in Cantonese online or on the phone (as opposed to face-to-face) to maintain social distance during the ongoing pandemic in Hong Kong. They lasted about 47 minutes on average and covered three sections. First, the interviewer prompted the interviewees to identify smart tourism technologies at the amusement park(s) they had visited in the last 12 months. Second, the interviewees were encouraged to elaborate on their overall experience of using each smart tourism technology (e.g., “What is the technology used for?” “How does the technology function?” “When and where did you use the technology?”). The last section asked the interviewees to discuss their overall satisfaction with (e.g., “Are you satisfied with the smart tourism technologies?”) and opinions towards (e.g., “What are the benefits/drawbacks of smart tourism technology?”) the smart tourism technologies at the amusement parks.
While the principle of inductive reasoning was adopted to impose no pre-defined categories on the data, a six-step thematic analysis approach proposed by Braun and Clarke (2006) supported Huang and colleagues (2017) four smart tourism experience attributes (accessibility, informativeness, interactivity, and personalization) to reflect their needs at a smart amusement park. Aligning with the core tenet of QFD methodology to focus on the technical specifications of smart tourism from the perspective of customers, this four-dimensional conceptualization has widely been adopted by technology adoption studies in the tourism study field, enhancing the practical relevance of the study findings by identifying technical characteristics as antecedents to support smart travel experience design (Um & Chung, 2021).
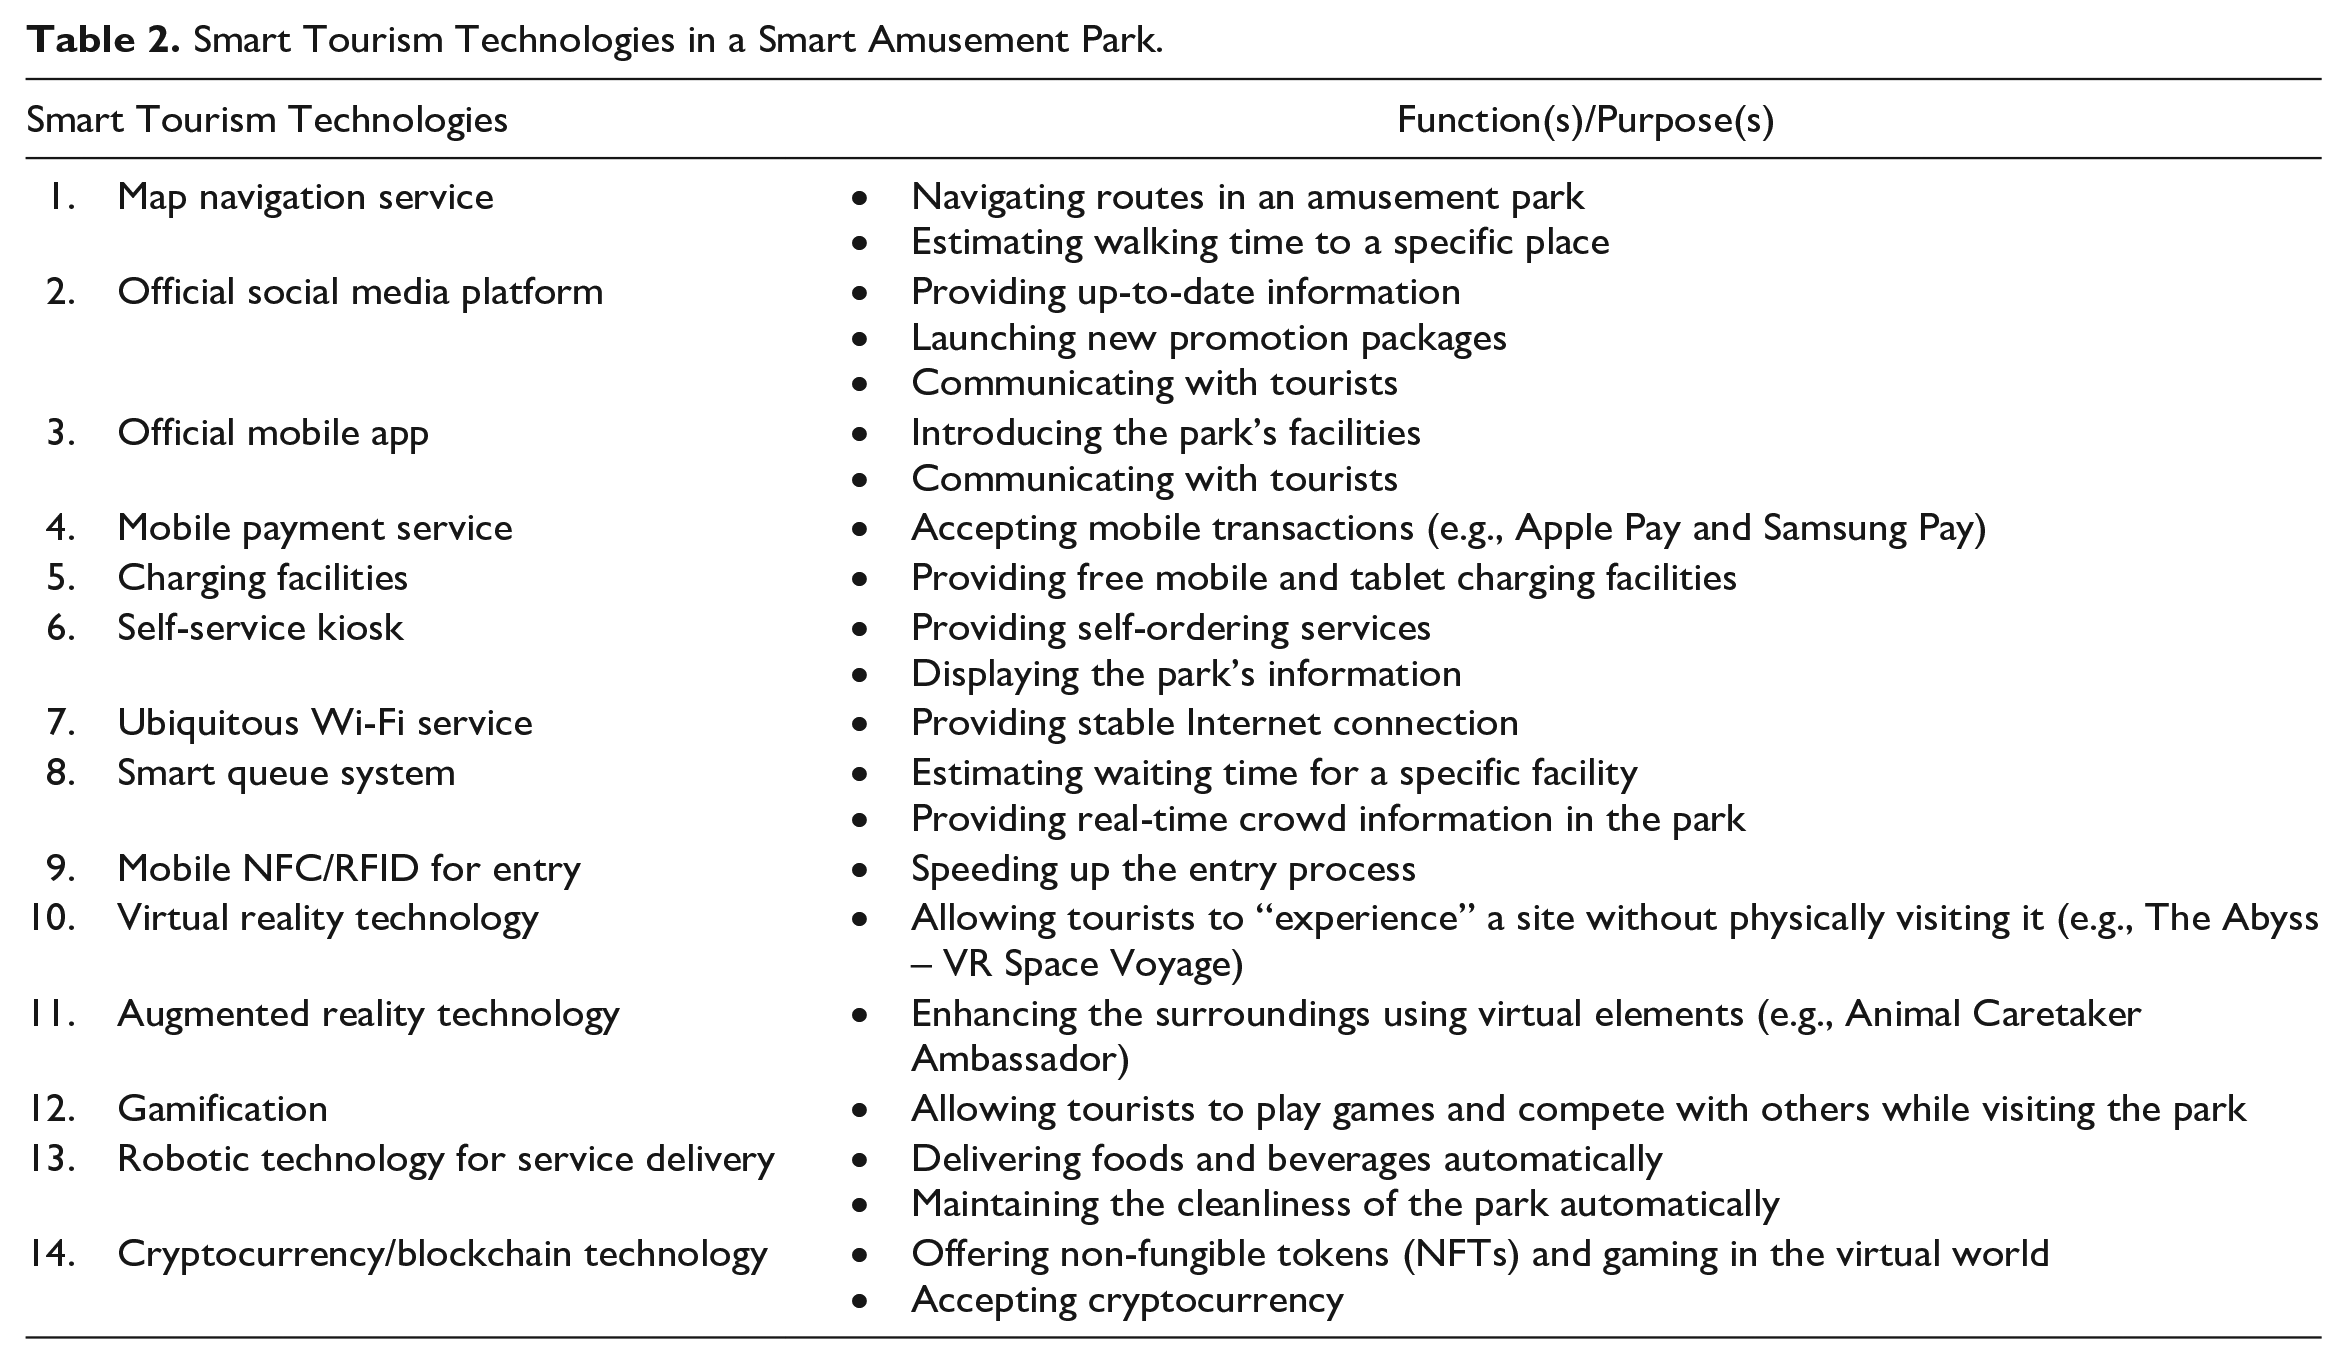
The second step was to identify the design and technical characteristics of a smart amusement park. In addition to reviewing the existing literature on the technical components of a smart travel attraction (Jeong & Shin, 2020; Wang et al., 2016) and analyzing the in-depth interview data with 10 tourists, another 10 in-depth interviews were conducted with participants who (1) were currently working at amusement parks in Hong Kong, (2) held a supervisory position at the time of the interview, and (3) had experience of operating or designing smart tourism technologies. Using a snowball sampling technique, the authors first reached three initial participants and encouraged them to share the interview invitation message with their coworkers. While this method may result in a sample sharing similar demographic characteristics, QFD requires a sample that provides insightful information to identify design/technical characteristics and construct the correlation matrix, rather than demanding heterogeneity and quantity (Park et al., 2021). All the in-depth interviews were conducted in Cantonese by telephone, because this eased the challenge of syncing a face-to-face interview time with respondents working shifts in the amusement parks. As a result, a total of 14 smart tourism technologies were identified to reflect the design and technical characteristics of a smart amusement park (Table 2). While existing studies usually refer to design/technical characteristics as technical functions or procedures, their study context are limited to one specific type of technology with limited purposes (e.g., self-service kiosks in restaurants; Park et al., 2021). However, since amusement parks adopted various technologies for diversified purposes as stated in Table 2, we took a boarder perspective to reflect the design and technical characteristics of a smart amusement park with the 14 smart tourism technologies that came straight to the interviewees’ minds as representing the fundamental designs of a smart experience in an amusement park.
Smart Tourism Technologies in a Smart Amusement Park.
The third step was to construct the “correlation matrix” that identifies the degree to which each design/technical characteristic is correlated with the others, following the suggestion of Fuchs and colleagues (2010) that there is usually a spill-over effect of technological readiness on technological intensity. Along with the rapid technological development, especially the development of the Internet of Things (IoT), a technological device or application is likely to contain multiple design/technical features and functions. For example, there is an ongoing trend for amusement parks to develop mobile apps with NFC/RFID, virtual reality, and augmented reality features. Hence, the correlation matrix is important to understand how different smart tourism technologies can be integrated to maximize their offerings. Since the main focus was on whether they can be integrated rather not on the strength of their correlations, the data from the 10 in-depth interviews with service providers were utilized to construct this matrix. Specifically, during the in-depth interviews, the interviewees were encouraged to construct the correlation matrix by determining the degree of the functional relationship between each pair of smart tourism technologies using a 3-point scale: “+” = positive relationship, “ ” = null relationship, and “−” = negative relationship (Jeong & Oh, 1998).
In the fourth step, interview data from the service providers were used to construct the “relationship matrix” that examines how each design/technical characteristic (i.e., smart tourism technological applications) could be used to satisfy customer requirements. Han and colleagues (2019) suggested that a customer requirement could be linked to a technical characteristic in a weak, medium, or strong relationship in most cases; the interviewees were therefore presented with the definition of the four smart tourism experience attributes (Huang et al., 2017) to determine the strength of the associations between customer requirements and design/technical characteristics, using a 3-point scale: Δ (weak relationship) = 1, ο (moderate relationship) = 3, and • (strong relationship) = 9, as suggested by Akao (1990).
The fifth step was to construct the “planning matrix” by collecting data from tourists who (1) were 18 or above and (2) had visited an amusement park in Hong Kong at least once in the last 12 months. A cross-sectional online survey was designed to collect the data, consisting of three sections and 34 questions. The first section included the 14 smart tourism technologies scored on a 7-point scale (1 = not at all important to 7 = extremely important) to measure their importance in supporting tourists’ visits to amusement parks. The second section included 12 items scored on a 7-point scale (1 = not at all important to 7 = extremely important) and a 7-point satisfaction scale (1 = extremely dissatisfied to 7 = extremely satisfied) to measure tourists’ perceptions of the importance (PI) and performance (PP) of the four smart tourism experience attributes (accessibility: three items; informativeness: three items; interactivity: three items; personalization: three items). The last section contained both open- and closed-ended questions to collect participants’ demographic (gender, age, nationality, educational level, and income level) and behavioral characteristics (travel party and travel frequency). The survey was developed in English and translated into Chinese by the first author, who is a native Chinese speaker and fluent in English. After pilot-testing the survey with 30 tourism undergraduates to address some wording and formatting problems, data collection took place over a 2-week period during which a hyperlink to the online survey was distributed via social media platforms (i.e., Facebook, Instagram, Twitter, and WhatsApp) using a convenience sampling technique.
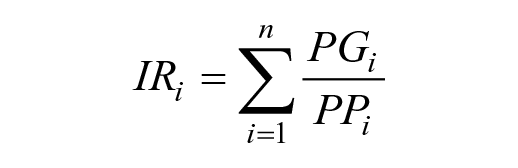
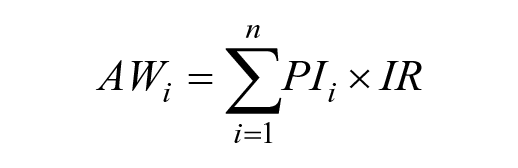
With the aim of incorporating the service provider’s perspective into the planning matrix, the sixth step was to collect a similar set of inputs from service providers. A further cross-sectional online survey was developed to ask the same 34 questions in three sections, along with two screening questions to ensure that all respondents (1) were currently working in amusement parks in Hong Kong and (2) had experience of operating or designing smart tourism technologies in travel experiences. While the questions were the same as those in the tourist survey, the satisfaction scale in the second section was removed to focus on the performance goals (PG) of the four smart tourism experience attributes in satisfying tourists. The dual-survey data collection approach (i.e., the fifth and sixth steps) was designed to take the perspectives of both tourists and service providers into account when constructing the HoQ framework. Following the completion of the QFD method, three indicators, namely, improvement ratio (IR), raw importance weight (AW), and relative weights (RW), were calculated to construct the planning matrix by visualizing the importance of customer needs and the current performance (Kurtulmuşoğlu & Pakdil, 2017). First, IR is a weighted value indicating the gap between the current performance as perceived by tourists and the performance expected by service providers, reflecting the scope for improvement potential for each attribute (Park et al., 2021):
Second, AW is the product of PI and IR for each smart tourism experience attribute. This indicator was used to rank customer requirements based on the combined assessment of customers’ needs and service providers’ willingness to improve a specific smart tourism experience attribute:
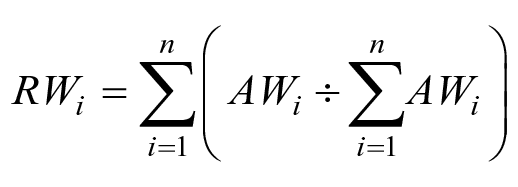
Third, RW are normalized values of AW to prioritize service design and management requirements to meet customers’ needs effectively (Jeong & Oh, 1998):
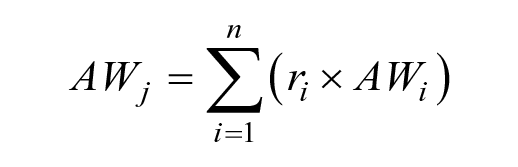
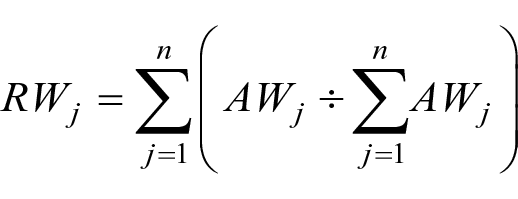
The last step was to construct the management matrix by calculating the target values to prioritize design/technical characteristics, which were determined by two indicators: raw importance weight (AW) and relative weights (RW). Specifically, the raw importance weight (AW) is the product of relationship strength in the relationship matrix and the relative weights of the smart tourism experience attributes, whereas relative weights are normalized values of the raw importance weight (AW; Jeong & Oh, 1998):
Results and Discussion
Sample Profile
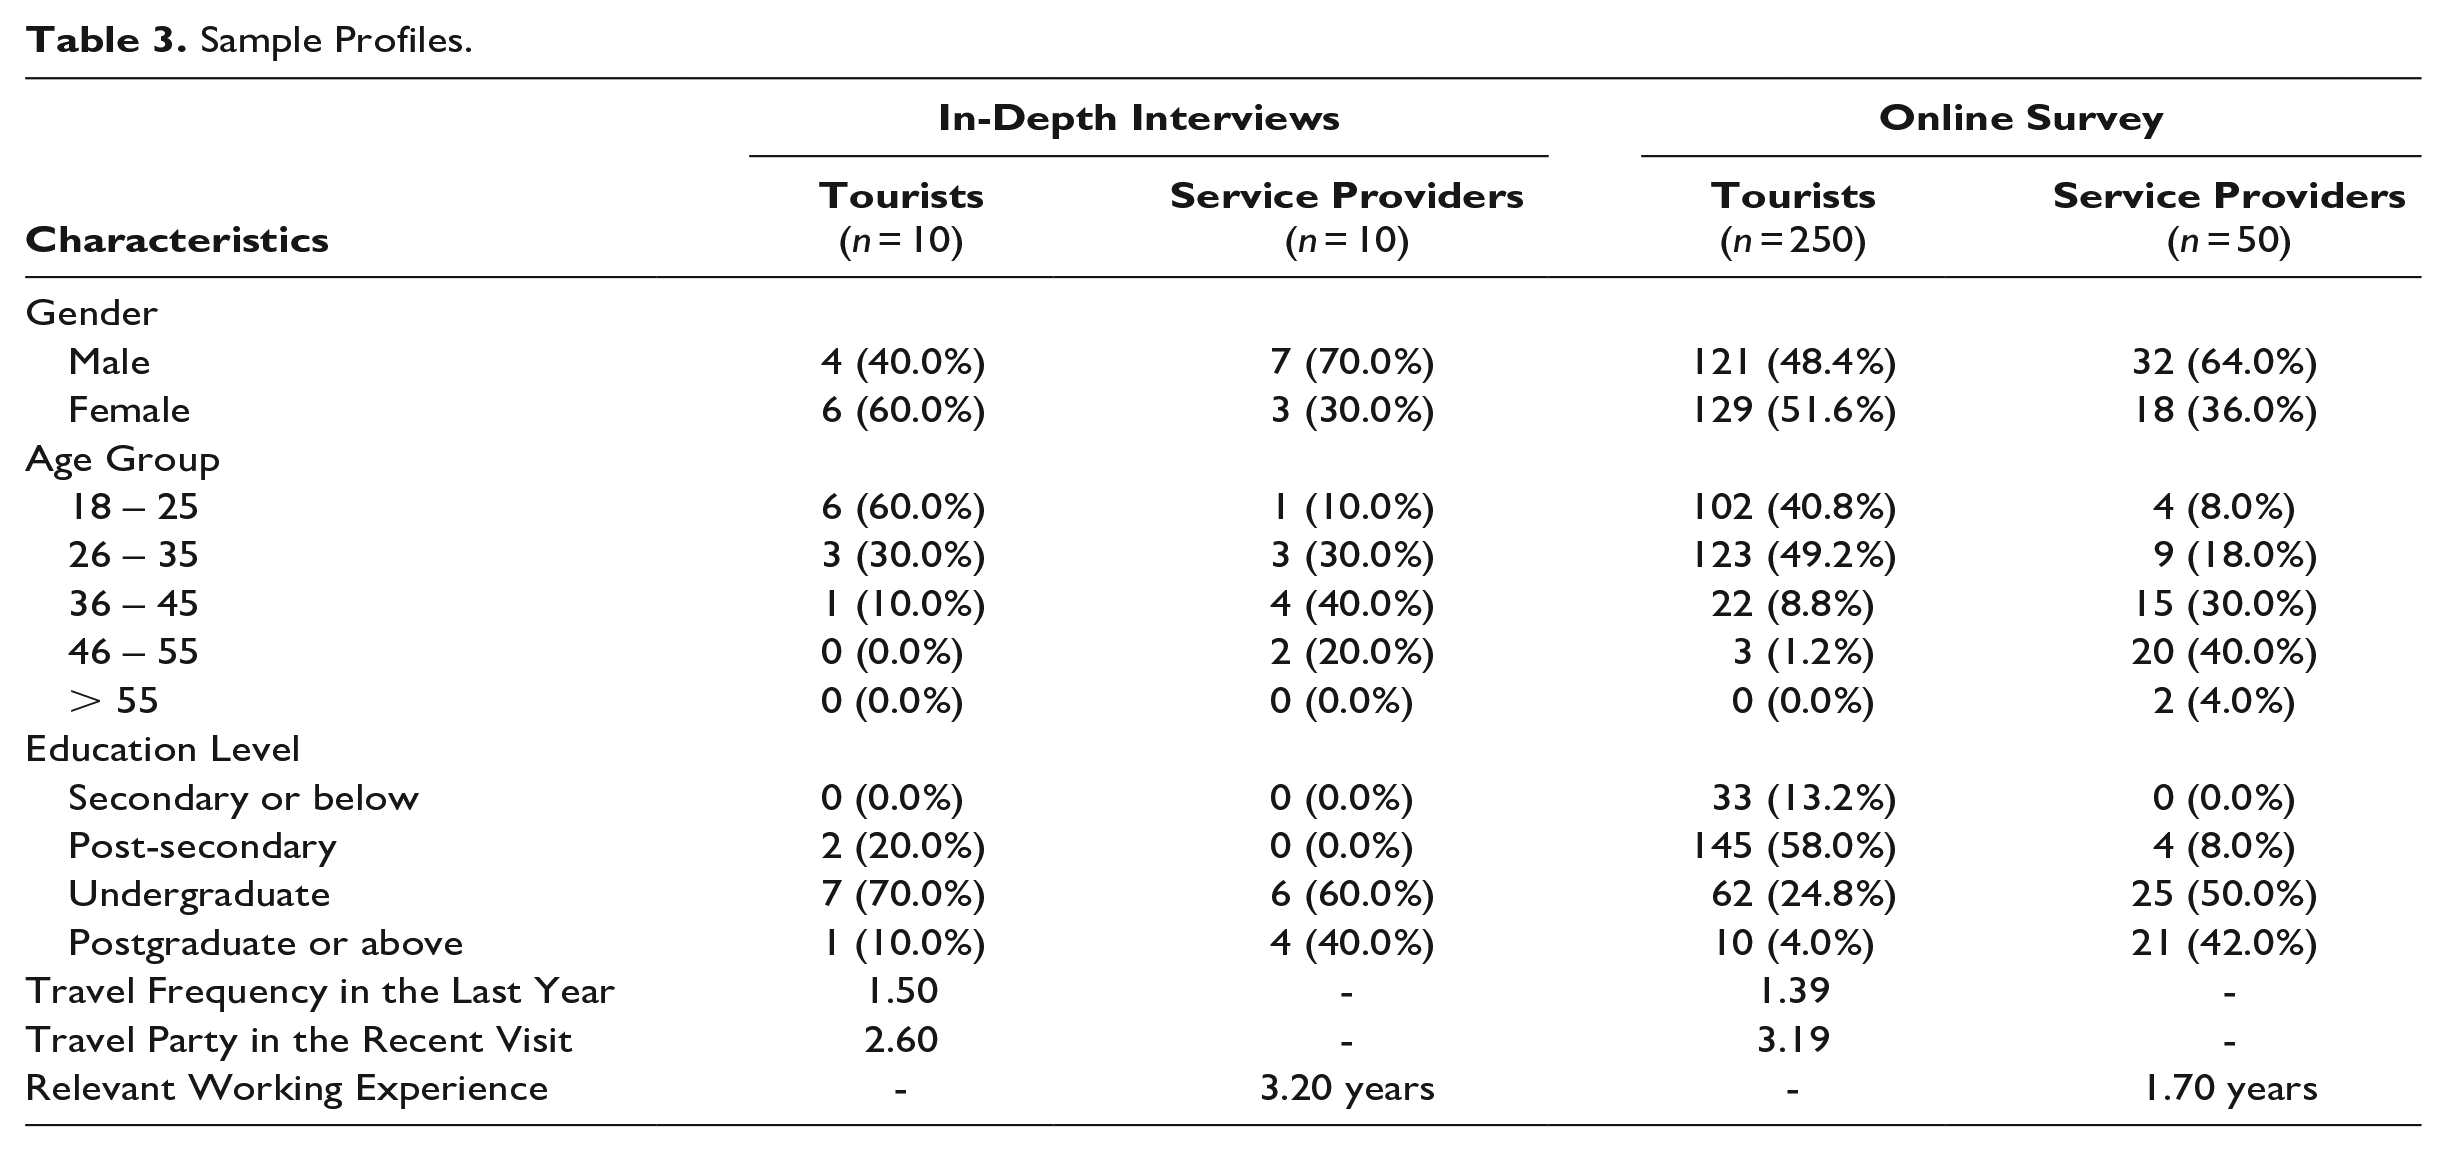
This study adopted four data collection tools: (1) in-depth interviews with tourists (n = 10), (2) in-depth interviews with service providers (n = 10), (3) an online survey with tourists (n = 250), and (4) an online survey with service providers (n = 50). Three criteria were adopted from Lin and colleagues (2020) to eliminate invalid online survey responses that (1) were completed in less than 2 minutes (tourists: n = 12; service providers: n = 4), (2) had a relatively low standard deviation (i.e., 0.25) across the item scoring (tourists: n = 3; service providers: n = 3), and (3) were tripped by an attention-check question (tourists: n = 7; service providers: n = 2). While the QFD method does not rely heavily on statistical evidence (Park et al., 2021), the sample sizes of the two online surveys were deemed appropriate for two main reasons. First, the sample size of 250 tourists allowed the application of a confirmatory factor analysis (CFA) to validate the four-dimension conceptualization of smart tourism experience attributes (Anderson & Gerbing, 1984). Second, the data reliability and validity of a QFD approach have been proven to be achieved at small sample sizes in other tourism contexts such as self-service technology (Park et al., 2021: 267 consumers and 42 service providers) and catering services (L. Z. Lin et al., 2015: 80 consumers and six service providers). Table 3 summarizes the demographic and behavioral characteristics of the four samples.
Sample Profiles.
Exploratory Factor Analysis and Confirmatory Factor Analysis
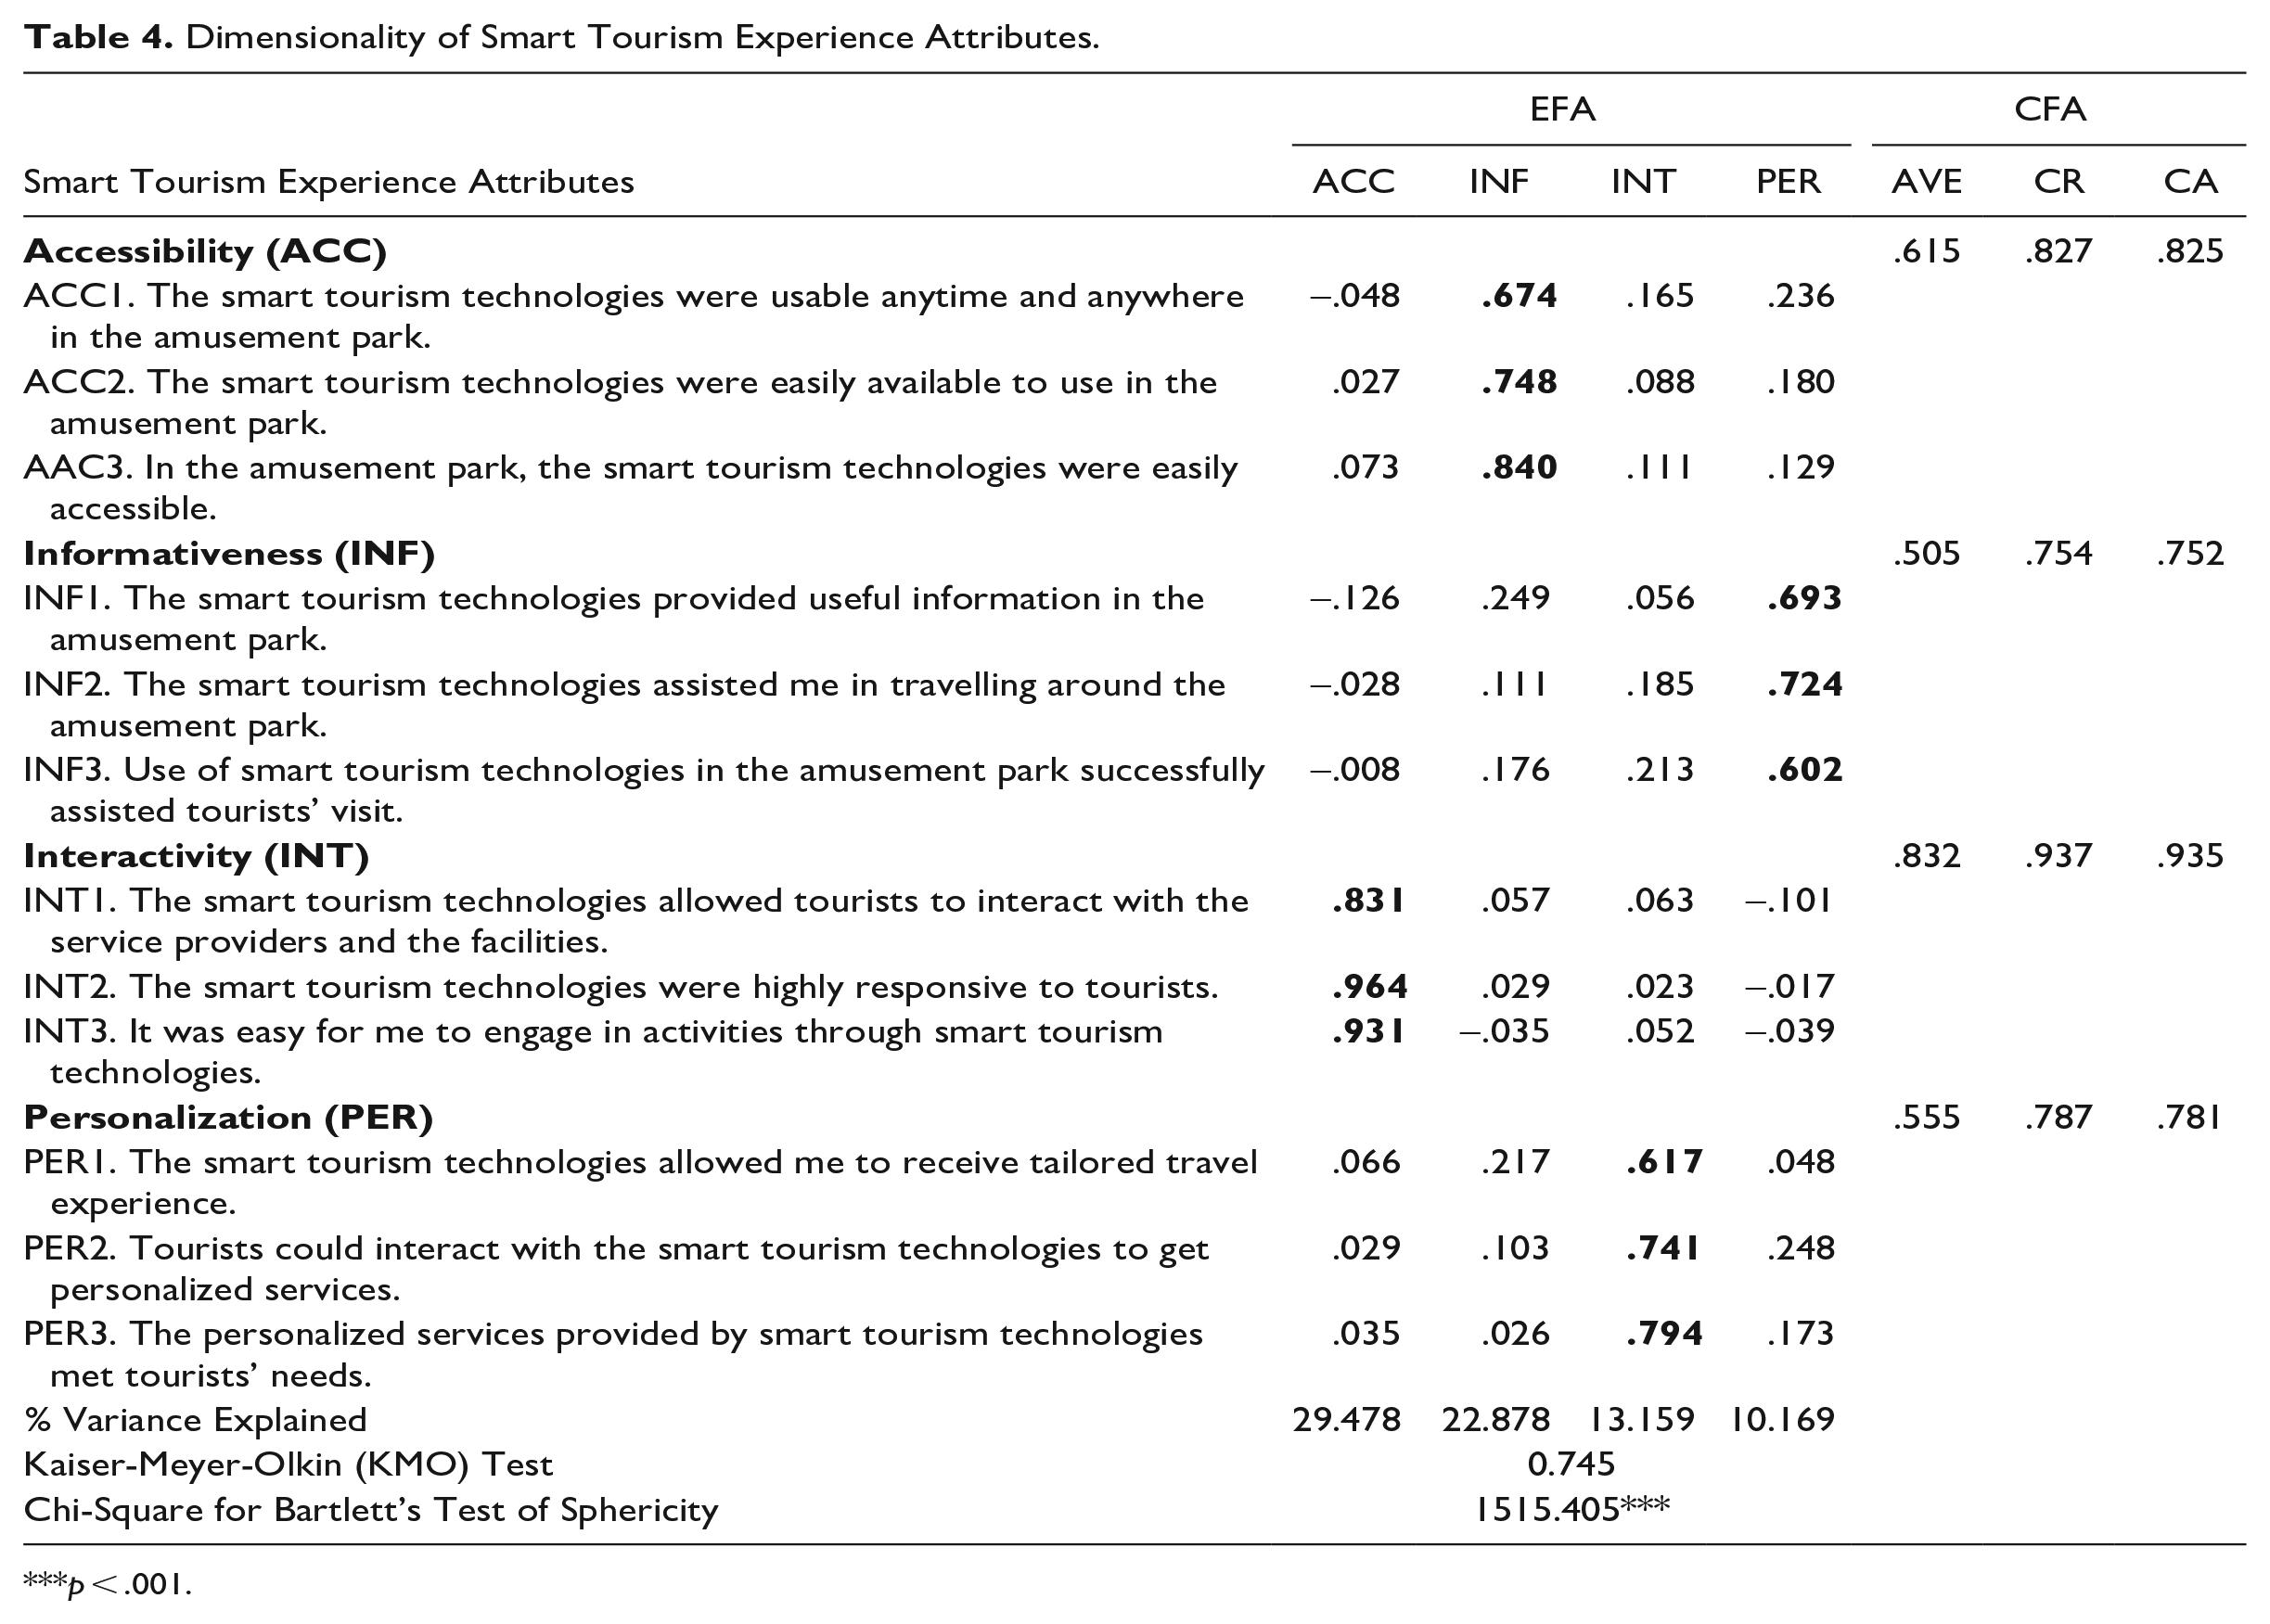
While factor analysis is not required in the QFD methodology (Park et al., 2021), it has been a common practice in the literature to validate the dimensionality of customer requirements (i.e., the four smart tourism experience attributes in this study; Han et al., 2019). Therefore, an exploratory factor analysis with varimax rotation in SSS (Version 26.0) and a confirmatory factor analysis were performed with tourists’ perceived importance (PI) to support the four-dimensional conceptualization of smart tourism experience attributes (Table 4). The convergent validity and discriminant validity were confirmed using the three criteria suggested by Fornell and Larcker (1981): (1) all factor loadings exceeded 0.6, (2) all composite reliability (CR) values were above 0.7, and (3) all average variance extracted (AVE) values were greater than 0.5. Furthermore, reliability coefficients ranged from 0.752 to 0.935, which were above 0.6, to reaffirm a satisfactory internal consistency for the constructs. The model fit indexes also suggested that the conceptualization fit the data reasonably well (χ2/df = 1545.403; CFI = 0.960; TLI = 0.945; GFI = 0.933; RMSEA = 0.071; SRMR = 0.049).
Dimensionality of Smart Tourism Experience Attributes.
p < .001.
Development of the House of Quality (HoQ) Framework
Building upon the two sets of in-depth interviews and the two sets of online surveys with tourists and service providers at amusement parks, an HoQ framework (Figure 3) was developed. Specifically, four matrices (i.e., correlation matrix, relationship matrix, planning matrix, and management matrix) were constructed to shed light on how smart tourism technologies can best meet customers’ needs at amusement parks.
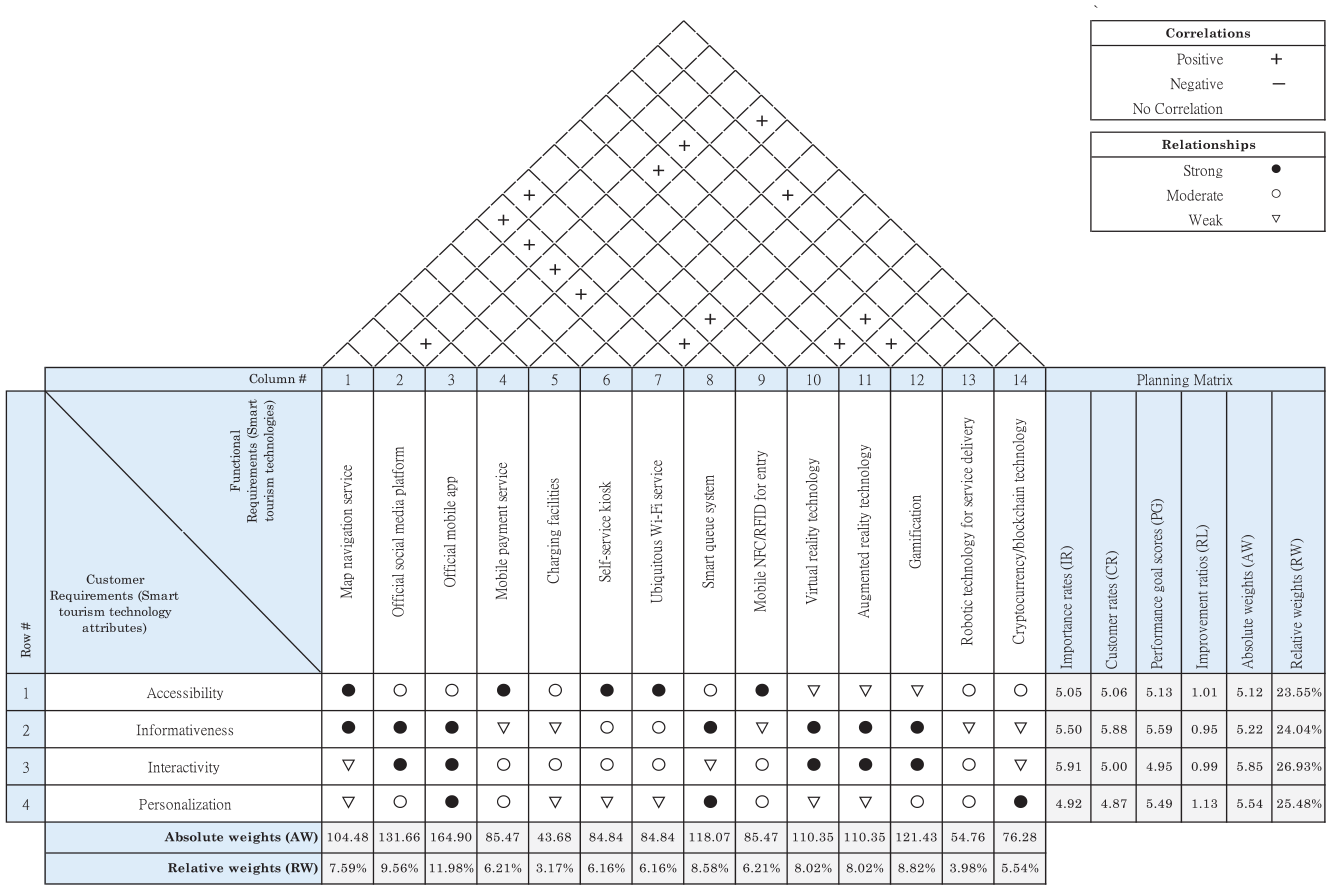
The HoQ Framework for a Smart Amusement Park.
Correlation matrix
Based on the interview data, a correlation matrix was constructed to identify 13 pairs of correlations between smart tourism technologies, which were supported by a bivariate correlation analysis (n = 50) with service providers’ perception of the importance of the 14 smart tourism technologies in meeting tourists’ needs. Specifically, six out of 13 pairs were made up from “ubiquitous Wi-Fi service,” suggesting that this technological application tends to improve (1) map navigation service (r = 0.485, p < .001), (2) official social media platform (r = 0.637, p < .001), (3) official mobile app (r = 0.648, p < .001), (4) mobile payment service (r = 0.446, p < .001), (5) smart queue system (r = 0.517, p < .001), and (6) mobile NFC/RFID for entry (r = 0.417, p < .001) in an amusement park. These correlations were exemplified by a service provider who asserted that “Wi-Fi service connects tourists with many technological applications and supports the connections between technological applications to stage travel experiences as a whole” (Informant #7, an IT specialist). This comment supports Au and Tsang (2022b), who identified swarm intelligence—the cooperation among technologies towards a common goal within a tourist attraction—as the most important smartness element.
Three pairs of correlations represented the immersive travel experience in amusement parks: (1) virtual reality techno-logy*augmented reality technology (r = 0.806, p < .001), (2) virtual reality technology*gamification (r = 0.381, p < .001), and (3) augmented reality technology*gamification (r = 0.368, p < .001; Fan et al., 2022). While virtual reality technology and augmented reality technology are two distinct concepts in terms of their technical specifications, many scholars have summarized them as an immersive technology that offers an entertaining experience (Lee et al., 2020). As forms of multi-sensory stimulation (Xu et al., 2017) that “help present information in an innovative way” (Informant #3, an aquarium manager), virtual reality technology and augmented reality technology are thought to support gamification by making technology-mediated travel experiences richer and more participatory (Neuhofer et al., 2012).
Planning matrix
Based on the two sets of survey data (i.e., tourists: n = 250; service providers: n = 50), a planning matrix was constructed to prioritize tourist requirements across the four smart tourism experience attributes in an amusement park (i.e., accessibility, informativeness, interactivity, and personalization). The planning matrix suggested there was still significant room for improvement in terms of smartness, because two out of the four attributes, interactivity (PI = 5.91; PP = 5.00) and personalization (PI = 4.92; PP = 4.87), were found to have negative disconfirmation between tourist expectation (PI) and actual experience (PP). Positive confirmations between PI and PP were found in accessibility (PI = 5.05; PP = 5.06) and informativeness (PI = 5.50; PP = 5.88), suggesting that service providers outperformed in these two aspects.
When taking the service providers’ expected performance goals (PG) into consideration, the results revealed two knowledge gaps: service providers were found to underestimate the importance of interactivity (PI = 5.91; PG = 5.59) to meeting tourists’ needs, but overestimate the importance of personalization (PI = 5.05; PG = 5.49). While interactivity, having the most important role, was consistent with many existing studies that found it had the strongest effect on overall travel experience (e.g., Jeong & Shin, 2020; Lee et al., 2018), the relatively unimportant role of personalization found in this study contrasts with previous work (e.g., Jung et al., 2015; Kirova & Thanh, 2019). Unlike other tourism contexts, such as shopping malls and historical sites, that were built for various market segments, amusement parks were mainly developed for family groups who have similar travel needs (Bakir & Baxter, 2011; Milman, 2001). Many studies on in-group psychology have suggested that individual preferences become less important when individuals can easily attach themselves psychologically to a particular social group (e.g., family travelers; Iyengar & Lepper, 1999; Markus & Kitayama, 1991), because they tend to value the collective preferences of the relevant in-groups (Kramer et al., 2007). This argument was also reflected in the words of a tourist interviewee: I know many tourism businesses rely on technologies to stage a personalized experience, but I don’t think it is the case in amusement parks. Personalization stems from a belief that there are irrelevant information or services in the environment for a particular tourist. However, an amusement park itself is a niche attraction [mainly serving family travelers]. Everything inside is designed for this market segment. I don’t think personalization is necessary because we [family travelers] need as much information as possible.. . . If a device incorrectly predicts my preferences, I may miss some relevant and important information for us to sightsee. (Informant #6, a 34-year-old male)
Following the completion of the QFD method, three indicators: (1) improvement ratio (IR), (2) absolute weight (AW), and (3) relative weight (RW), were calculated to visualize potential improvements to and the overall importance of the four smart tourism experience attributes. Regardless of the possible knowledge gap in “personalization,” it had the highest improvement ratio (IR = 1.13), suggesting it has the biggest potential for improvement in the future, followed by “accessibility” (IR = 1.01). Besides, as with tourists’ expectations (PI), “interactivity” was found to be the most important attribute (AW = 5.85; RW = 26.93%) from the perspectives of both tourists and service providers. While there was no major difference in terms of their importance, accessibility (AW = 5.12; RW = 23.55%) was the least important attribute, following informativeness (AW = 5.22; RW = 24.04%) and personalization (AW = 5.54; RW = 25.48%).
Relationship matrix and management matrix
Based on the interview data with service providers, a relationship matrix was constructed to identify the strength of relationships (i.e., strong, moderate, and weak) between each smart tourism technology and the four smart tourism experience attributes. The results were consistent with many existing studies on the functionality of each smart tourism technology. For example, as suggested by Wang et al. (2016) who identified the official social media platform and official mobile app as a smart information system, the interviewees demonstrated a strong relationship with informativeness; thus, if an amusement park establishes an official social media platform and official mobile app, its informativeness is likely to be enhanced. Furthermore, as forms of interactive technology (Stankov & Gretzel, 2020), virtual reality technology and augmented reality technology were shown to have strong relationships with interactivity.
Building upon the relationship matrix, two indicators: (1) absolute weight (AW) and (2) relative weight (RW), were calculated based on the indicators in the planning matrix to visualize management priorities in installing these smart tourism technologies to meet tourists’ needs. The results suggested that an official mobile app (AW = 164.90; RW = 11.98%) was the most important smart tourism technology, aligning with Kirova and Thanh (2019), who revealed intensive mobile usage in amusement parks for utilitarian, hedonic, and relational purposes. Since tourist movement has always been recognized as an important issue determining carrying capacity and travel experience in amusement parks (Milman et al., 2020), the smart queue system (AW = 118.07; RW = 8.58%) and map navigation service (AW = 104.48; RW = 7.59%), were also found to be important, highlighting the importance of guiding tourists to less-crowded areas (Brown et al., 2013).
However, despite the popularity of “self-service kiosk” (AW = 84.84; RW = 6.16%) and “robotic technologies” (AW = 54.76; RW = 3.98%) in other forms of service delivery, they were found to have low importance because they had relatively weak relationships with the four experience attributes. “Charging facilities” (AW = 43.68; RW = 3.17%) were found to have the weakest importance. This finding was reflected in the management matrix and is also echoed by Huang and Rust (2018), who asserted that mechanical intelligence is the lowest level of smartness and that it delivers limited additional value, with tourists tending to value instead technologies they can interact with rather than those used to perform repetitive or standardized tasks (Au & Tsang, 2022b).
Conclusion and Implications
Conclusion
Using the QFD method, this study established an HoQ framework for smart amusement parks. The analysis of both interview and survey data from tourists and service providers yielded a correlation matrix, a planning matrix, a relationship matrix, and a management matrix that allow amusement park developers to assess 14 smart tourism technologies (map navigation service, official social media platform, official mobile app, mobile payment service, changing facilities, self-service kiosk, ubiquitous Wi-Fi service, smart queue system, mobile NFC/RFID for entry, virtual reality technology, augmented reality technology, gamification, robotic technology, and cryptocurrency/blockchain technology) in relation to the four smart tourism experience attributes (accessibility, informativeness, interactivity, and personalization) in a measurable way.
Theoretical Implications
This study unearths four key contributions to the knowledge base around smartness and experience design in smart tourism. First, it is one of the first attempts to connect smart tourism technologies with smart tourism experience attributes. Despite the extensive scholarly attention paid to smart travel experience design, existing studies have tended to conceptualize smartness by focusing on either its technical properties (e.g., Wang et al., 2016; Yang et al., 2021) or on psychological aspects (e.g., Jeong & Shin, 2020). In the absence of investigations into their connections, the development of smartness in the tourism industry has relied exclusively on technological applications, overlooking how they are used to stage smart travel experiences (Au & Tsang, 2022a; Baggio et al., 2020). This study reveals that many popular smart tourism technologies, such as charging facilities, robotic technologies, and self-service kiosks, had relatively little importance in enhancing the four attributes, urging future scholars to rethink the connections between smartness development and technological applications tourism (Au & Tsang, 2022a; Gretzel & Koo, 2021).
Second, the study results have somewhat challenged our understanding of personalization in the development of smartness. In contrast to many existing studies (e.g., Huang et al., 2017; Jung et al., 2015), personalization was found to be the least important among the experience attributes in amusement parks, because tourists are mostly family groups who usually have similar needs and may thus value collective preferences (Kramer et al., 2007). As reflected by the high PG score of personalization from the service providers, personalization may have been overvalued in smartness design by niche tourism businesses, highlighting the possibility that previous studies have been misleading where they have studied smartness design without considering the confounding effects of different tourism contexts. In other words, this challenge provides another perspective for future scholars investigating smartness design in the tourism industry.
Third, while most smart tourism studies have focused on smart destinations (e.g., Femenia-Serra & Ivars-Baidal, 2021; Jeong & Shin, 2020) and smart hotels (e.g., Yang et al., 2021), this study expanded the study scope of smartness design to amusement parks, an underexplored setting in the smart tourism literature (Au & Tsang, 2022b). This perspective is important not only because the amusement park industry has always been a pioneer in using technological development to enrich their offerings and enhance the overall travel experience (Liang & Li, 2021), but also because amusement parks have a unique hedonic value proposition for which many technological applications (e.g., virtual reality technology, augmented reality technology, and gamification) should be developed (Dong & Siu, 2013). Since the smart tourism literature has been dominated by technology adoption studies that focused more on the utilitarian or functional values of smart technologies (Au & Tsang, 2022a; Mehraliyev et al., 2020), this study highlighted the hedonic characteristics of smartness development from a tourist’s perspective, complementing the utilitarian perspective of smartness development (Ham et al., 2019). Specifically, this hedonic value proposition was also reflected by tourists’ highest expectation (i.e., the highest value of IR) on the “interactivity” attribute of a smart travel experience at amusement parks.
The last contribution is methodological. In response to Mehraliyev and colleagues' (2020) call for new methodology approaches in the smart tourism literature, this study adopted the QFD methodology to examine smartness design in amusement parks. As a customer-focused approach in product or service design that transfers the voice of the customer into design characteristics, the QFD method has received relatively little scholarly attention in the tourism and hospitality literature. Existing QFD tourism studies have mostly relied on traditional practices to focus exclusively on customers’ input, overlooking the perspective of the providers who design the product or service (Park et al., 2021). This study therefore combined the tourist and service provider perspectives from the interview and survey data, before organizing them into an intuitive matrix form that clearly visualizes how each smart tourism technology contributes to the four smart tourism experience attributes (accessibility, informativeness, interactivity, and personalization). This approach does not only advance QFD methodology by taking service providers’ perspective into account, but also complements the one-sided discussions on tourists’ perspectives in the literature to shift the study focus to the feasibility of smartness development.
Practical Implications
Our findings are also of practical value to amusement park managers and tourism technology developers. First, connecting smart tourism technologies with the smart tourism experience attributes makes smartness development more tangible to amusement park managers. Since many existing studies have simply conceptualized smartness as technological applications, this study encourages managers to go through a deep review of what technological applications in their parks are used for, by connecting them with tourists’ needs. In contrast to merely, or somewhat blindly, investing in extensive technological applications, amusement park developers may find that the HoQ framework offers insights that can better position their park in terms of the different smartness attributes and levels, with the goal of generating favorable customer responses in today’s fiercely competitive market. For example, amusement park developers may take the HoQ framework as a fundamental framework to decide which technological applications are worth investment and match with the park’s strategic positioning.
Second, this study also provides valuable insights to those amusement park managers who intuitively know that smartness is desirable in attracting tourists yet lack knowledge about it and how it can be managed and developed. Specifically, this study highlighted “interactivity” and “informativeness” as the most important smartness attributes in amusement parks. By connecting these attributes with specific smart tourism technologies, managers are encouraged to install specific interactive or informative technologies—including official mobile app, official social media platform, gamification, smart queue system, virtual reality technology, and augmented reality technology—to enhance the overall experience and effectively meet tourists’ needs in amusement parks, because they are highly valued by tourists. However, given the relatively low importance in satisfying tourists’ needs, amusement park managers may need to rethink the deployment of charging facilities and robotic technologies. The QFD approach may also lend insights for managers for the ongoing monitoring of smart offerings in amusement parks.
Lastly, this study provides an assessment of the current state of smart tourism technology applications in the amusement park industry. Tourism technology developers may refer to the HoQ proposed in this study as baseline data for designing new technologies. Rather than relying on absolute or technical terms, such as the number of sensors in a service robot, technology developers are encouraged to judge the smartness level based on the four smart tourism experience attributes that refer to customers’ needs. Specifically, each ○ and \ in the relationship matrix refers to an opportunity for tourism technology developer to improve a specific smart tourism technology. For example, tourism technology developers may consider adding some features to "map navigation services” by integrating it with “gamifications” that have been widely recognized to enhance interactive travel experience at amusement parks.
Limitations and Future Research Directions
This study has several limitations that may offer insights for future research. First, despite the potential abilities of the QFD approach to transfer customers’ needs (i.e., smart tourism experience attributes) into technical properties (i.e., smart tourism technologies), the HoQ was based on subjective inputs from tourists and service providers. Since this subjectivity may cause biases in evaluating importance and scope for improvement, an on-site experimental research design is encouraged to evaluate the connections between smart tourism technologies and smart tourism experience attributes by capturing formal data. Second, given the specific sampling requirements both for tourists (i.e., at least one travel experience in amusement parks in the last 12 months) and service providers (i.e., experience of operating or designing smart tourism technologies in amusement parks), our study results are limited to a relatively small sample of 260 tourists and 60 service providers in Hong Kong. Since the meaning of smartness is subjective and evaluations may vary across personal (e.g., gender, age, and cultural background) and environmental factors (e.g., theme setting), future studies may take these variables into account before generalizing their findings to a broader context. Third, while this study advanced the traditional QFD approach by taking the perspective of service providers into consideration, smartness in tourism should also be viewed from the perspective of other stakeholders (e.g., tourism practitioners and technology developers). Lastly, the study findings are limited to the amusement park setting that contains a strong hedonic value proposition. Going beyond this study’s focus on amusement parks, future scholars may also consider the connection between smart tourism technologies and smart tourism experience attributes in other tourism contexts such as museums, hotels, and airports.
Footnotes
Declaration of Conflicting Interests
The authors declared no potential conflicts of interest with respect to the research, authorship, and/or publication of this article.
Funding
The authors received no financial support for the research, authorship, and/or publication of this article.