






Abstract
This study argues that happy people spend more on products that promote happiness, such as travel. A positive cyclical relationship is documented between happiness and tourism. This association is particularly significant for economies featuring low levels of happiness and tourism consumption. The identified trend is verified using two-part models based on a large database assembled from four rounds of the China Household Finance Survey. The replacement of the dependent variable, the instrumental variable method, and a grouping study, enhance the robustness of our conclusions. Further investigation shows that the level of one’s social network mediates the positive impact of happiness on tourism consumption.
Highlights
Happier people spend more on happiness- inducing products ( e. g., tourism).
Happiness and tourism have a positive, cyclical relationship.
Social networks mediate happiness and tourism consumption.
Introduction
The tourism industry enjoyed stable yet rapid development before the COVID-19 pandemic (United Nations World Tourism Organization [UNWTO], 2020). Its gross revenue in 2019 (including domestic and international visitor arrivals) reached US$5.8 trillion, accounting for 6.7% of global gross domestic product (GDP; World Tourism Cities Federation [WTCF], 2020). This sector is being revived as COVID-19 comes under control; however, the speed and degree of recovery remain uncertain (DeMicco et al., 2021; Gunter et al., 2022). Tourism has been widely acknowledged as important. For instance, traveling can increase people’s happiness (Holm et al., 2017; McCabe & Johnson, 2013). Tourism development can also boost destination employment, promote regional economic growth, and improve residents’ welfare (Brida et al., 2020; Liang et al., 2023). The question of how to best stimulate tourism consumption is thus pertinent for both tourism operators and destination governments.
This industry’s products and services must ultimately meet consumers’ needs. Investigation into the factors affecting tourism consumption is ongoing. Based on traditional economic theories (e.g., demand theory and consumption theory) and social theories (e.g., systems theory, interactionism theory, and behavioral theories), scholars have identified numerous factors that shape tourism consumption. Examples include individuals’ sociodemographics, source areas’ macroeconomic and cultural attributes, and trip- or destination-related aspects (Brida & Scuderi, 2013; Mehran & Olya, 2019). Psychological factors have started to attract interest as well (Agag & Eid, 2020; Paniagua et al., 2022). However, the mental characteristic of happiness has not received close attention.
Since Easterlin (1974) first studied the economics of happiness, this construct has transcended the fields of psychology and sociology to enter the economics domain. Happiness economics is now a key branch in this discipline. Happiness economics has addressed a spate of issues tied to the relationship between happiness and economic development (Clark et al., 2008; McGillivray, 2007). Meanwhile, the impact of happiness on consumption (including tourism consumption) has been somewhat ignored (Guven, 2012; Zhu et al., 2021). Scholars have contended that happiness can raise income (De Neve et al., 2013). Economically, consumption is a function of income, and a firm sense of happiness can boost consumption (Sameer et al., 2021; Zhu et al., 2021). However, other studies suggest that a strong sense of happiness does not lead to higher consumption in general, especially of material products (DeLeire & Kalil, 2010; Guven, 2012). How, then, does happiness mold consumption? The happiness paradox maintains that greater income cannot infinitely enhance people’s happiness because the demand for material products decreases marginally while income increases (Easterlin, 1974; Easterlin et al., 2010). As such, happiness may more heavily influence individuals’ consumption of products that meet certain psychological needs.
The tourism industry is rooted in happiness: consuming related products and services can enhance people’s happiness and will likely affect tourism consumption in turn. Yet, an open question remains: Do happy people prefer to travel and consume more, or do unhappy people prefer to travel and engage in compensatory consumption—attempting to reduce negative emotions through consumption (Rucker & Galinsky, 2008)? A definitive answer holds value for tourism practitioners, who may need to deploy distinct marketing and service strategies to target happy and unhappy visitors. In this paper, we investigate how happiness influences tourism consumption based on the theory of consumption function (e.g., absolute income theory, relative income theory, life cycle theory, and preventive savings theory) and an empirical analysis of a large-scale survey database in China. Because non-personal and family factors mostly influence business travel, our research concerns leisure tourism consumption rather than business travel consumption.
Literature Review
Theory of Consumption Function and Tourism Research
The factors influencing tourism consumption can be broadly classified into four categories: sociodemographic characteristics, the tourist source area’s macroeconomic and cultural factors, travel- and destination-related elements, and psychological attributes (Mehran & Olya, 2019; Wong et al., 2016). When examining individual tourism consumption over a given period at the micro level, most of the literature addresses sociodemographics. The theory of consumption function originates from consumer psychology, describing people’s micro-level choices related to consumption and savings, which further frames consumption as a function of income (i.e., absolute income theory; Friedman, 1957). Therefore, the theory of consumption function (including absolute income theory and the ensuing relative income theory, life cycle theory, preventive savings theory, and so on) is usually adopted to explain how sociodemographic and psychological factors (e.g., income, education, life cycle, mental expectations) influence individuals’ tourism consumption (Bernini & Cracolici, 2015; Lin et al., 2015, 2021; Siegel & Wang, 2019).
In accordance with the absolute income theory of consumption, researchers generally agree that income is the primary determinant of tourism consumption (Lin et al., 2021; Song et al., 2012). Relative income theory was the first major development in the theory of consumption function (Modigliani, 1949). This theory describes consumption as a social behavior with a strong demonstration effect and ratchet effect. Some scholars have observed a demonstration effect in families’ tourism consumption decisions; that is, a family’s tourism consumption reflects that of other families at the same income level, and this consumption involves imitation and comparability (Siegel & Wang, 2019; Smeral, 2012). Other researchers have discovered that the ratchet effect can influence tourism consumption: such consumption is informed by one’s previous high income and consumption levels. Income changes typically lead households to alter their savings to maintain stable tourism consumption (Zuo & Lai, 2020).
Empirical analyses have shown that both absolute income theory and relative income theory on consumption hold insufficient explanatory power. Life cycle theory has thus been introduced into the theory of consumption function. The life cycle theory of consumption suggests that people plan their living expenses over a long period to optimally allocate consumption throughout the life cycle (Modigliani, 1986). Drawing on this theory, authors have noted that tourism consumption expenditure and age (normally of the head of household) exhibit an inverted U-shaped relationship; middle-aged people or middle-aged-headed households travel more and spend more than others (Bernini & Cracolici, 2015; Lin et al., 2015). Older people are less willing to travel, but, on average, they spend more on tourism than young people (Bernini & Cracolici, 2015; Lin et al., 2021). Other criteria (e.g., number of children and/or elderly family members) have been used to divide the life cycle when studying family tourism consumption (Alegre & Pou, 2016; B. Zheng & Zhang, 2013).
Since mathematical methods became available to test uncertainty, income uncertainty and its induced preventive savings have come to represent common research pursuits (Carroll, 1994). According to the theory of preventive savings, when consumers expect to earn a stable income in the future, savings to prevent future risks will decrease. Future household income expectations are usually measured on the bases of indicators such as the head of household’s education level and employment status (Alegre et al., 2010). Empirical evidence shows that a high level of education reduces households’ motivation for preventive savings. These households take part in more tourism activities and consume more (Zhang & Feng, 2018; B. Zheng & Zhang, 2013). In addition, factors that can affect household income uncertainty (e.g., marriage, gender, attitudes towards risk, debt, and the presence of social and medical insurance) may influence tourism consumption (Bernini & Cracolici, 2015; B. Zheng & Zhang, 2013).
Happiness and Tourism
Happiness arises from positive emotions and life satisfaction (Argyle, 2013). Economic theories have held wealth or income as a prerequisite for happiness since Adam Smith’s work (Easterlin, 1974). Yet, empirical research involving happiness data has shown that, once the economy reaches a certain level of development, happiness reported by residents usually stabilizes. Economists refer to this phenomenon as the “happiness-income paradox” or the “Easterlin paradox” (Clark et al., 2008; Easterlin, 1974), from which the economics of happiness has arisen. Easterlin (1974) explained this paradox: Objective measures of happiness (often called “social indicators”; e.g., GDP per capita) cannot fully explain the notion itself. Different from objective measures, reported happiness is a personal assessment of one’s happiness, reflecting perceived life quality (Diener et al., 2004; Holm et al., 2017; Uysal et al., 2016). Surveys that cover reported happiness often feature questions such as “Did you feel happy [e.g., during the past 3 months])?” because respondents must consider their lives as a whole in order to respond (Perez-Truglia, 2020; Uysal et al., 2016; J. Zheng et al., 2022). These items serve as indicators of happiness and enable quantitative research on the concept. We followed the literature and defined happiness in this case as respondents’ subjective evaluations of their sense of happiness.
The role of tourism on travelers’ happiness has long been a popular topic. Some studies have suggested that people use tourism to escape the mundanity of daily life, enjoy pleasant experiences, and realize self-growth; therefore, associated activities serve hedonic and eudaimonic functions (De Bloom et al., 2010; McCabe & Johnson, 2013). According to bottom-up spillover theory, the happiness derived from travel can permeate other areas of life and elevate one’s assessment of their overall happiness (Sirgy et al., 2011; Uysal et al., 2016). Even one trip can produce happiness, although this feeling appears short-lived (De Bloom et al., 2010; Kwon & Lee, 2020). Maintaining tourism density over a given period has been shown to sustain or improve one’s happiness (J. Zheng et al., 2022).
Happiness is also of multidimensional economic and social importance (McGillivray, 2007). It represents a state in which people can achieve their full potential, be sociable, build supportive relationships, work productively, and contribute to the community (Bubić & Erceg, 2018; Walsh et al., 2018). Happiness guides behavior as well: happier people are more motivated than others to engage in certain activities (Diener et al., 2018; Oswald et al., 2015).
It remains to be seen whether happiness affects tourism activities. Scholars have recently aimed to quantify tourists’ psychological attributes and the effects of these elements on tourism consumption. Agag and Eid (2020) took tourist satisfaction as an influencing factor. Chen and Li (2018) assessed the impact of destinations’ national well-being. Others have explored how individuals’ personality traits, values, and travel motivations inform tourism consumption (Gómez-Déniz et al., 2020; Woosnam et al., 2015). The impact of happiness on tourism consumption has rarely been deliberated, despite being an important psychological factor.
Hypothesis Development
We believe that people’s sense of happiness may affect tourism consumption from positive and negative perspectives. Happiness can promote tourism consumption through direct and indirect mechanisms. Happier people are more optimistic and sociable than others (De Neve et al., 2013), which may directly lead to more sociable consumption (e.g., tourism consumption). Moreover, people with a strong sense of happiness are thought to be more productive: they often enjoy ample job opportunities, better employment expectations, and stronger financing abilities (De Neve et al., 2013; Diener et al., 2018). These benefits can increase a family’s current and expected income. Tourism consumption should therefore increase based on absolute income theory and relative income theory. Meanwhile, these effects of happiness can weaken preventive savings and liquidity constraints while indirectly promoting consumption of all kinds—especially social consumption such as travel (DeLeire & Kalil, 2010; Veenhoven et al., 2021; Zhu et al., 2021).
The negative perspective suggests that a strong sense of happiness can compromise overall consumption. Happier people normally have higher self-control and engage in less impulsive or irrational consumption (Fernández-Villaverde & Krueger, 2011; Guven, 2012). Additionally, per the life cycle theory of consumption, happier people attach more importance to health and have a longer life expectancy. They consume relatively steadily over various life stages, which may reduce present consumption—particularly of non-necessities and luxuries (Costley et al., 2007; Zhu et al., 2021). To date, related work has mainly concentrated on advanced economies (Guven, 2012; Veenhoven et al., 2021).
Under these two opposing forces, the question of whether happiness can promote tourism consumption requires scrutiny by evaluating research samples’ characteristics. China is a developing country with low levels of income and tourism consumption. Tourism was long regarded as a luxury but has become more mainstream since the 21st century (Airey & Chong, 2010; Zeng & Ryan, 2012). Even so, compared with developed countries, Chinese people’s tourism consumption remains low. Lower tourism consumption will result in a relatively higher marginal propensity for tourism consumption among these people (J. Zheng et al., 2022). A strong sense of happiness should increase tourism activities involving intense interaction, while a high marginal propensity to travel should lead Chinese people to display relatively greater tourism consumption. The following hypotheses are put forth accordingly:
H1: A positive relationship exists between happiness and tourism preference.
H2: A positive relationship exists between happiness and tourism expenditure.
The positive impact of happiness on tourism consumption may be partially attributable to social networks. A social network is a relatively stable system of contacts grounded in mutual interaction (Freeman, 2004; Wasserman & Faust, 1994). Happier people normally have dense social networks for three reasons. First, these individuals often express positive emotions, smile more, and are welcomed in interpersonal interactions (Cohn et al., 2009; Mauss et al., 2011). They can thus easily establish a wide range of social connections. Second, happier individuals typically exhibit more prosocial behaviors (e.g., generosity, cooperation, altruism, mutual assistance, and a sense of teamwork) than unhappy individuals (Aknin et al., 2018; Dunn et al., 2014). Others are usually willing to interact with these people, thereby expanding their social networks. Third, the happier a person is, the greater their awareness of laws and rules; they are also apt to help others, actively give back through goodwill, and demonstrate strong interpersonal trust (Jasielska, 2020; Lu et al., 2020). These actions facilitate enduring social network connections. Overall, the happier a person feels, the richer their social network tends to be (Arampatzi et al., 2018; Fowler & Christakis, 2008).
Happiness can positively affect tourism consumption through social networks via three primary mechanisms. First, the social network effect of happiness can directly increase travel and social spending. The density of people’s social networks naturally encourages such spending through social consumption. Leisure tourism typically centers on trips with relatives or even other families. These activities maintain existing relationships but can also build new connections in novel consumption environments. The relative income theory of consumption demonstrably affects tourism consumption as well. Individuals may begin to consider others around them while traveling, in addition to generating tourism demand. Social network impacts thus directly increase residents’ and families’ tourism consumption expenditure. Second, the social network effect arising from happiness fosters residents’ employment and reemployment. Locals can then earn a more stable and higher income. Coupled with positive emotional impacts, residents hold more optimistic income expectations (Diener et al., 2018; Walsh et al., 2018). According to the theory of absolute income, income is the cornerstone of tourism consumption: A rise in current and anticipated income will enhance households’ tourism propensity and level of tourism consumption. Third, the social network effect manifesting from greater happiness can enhance trust and friendliness between residents and families, promoting informal financing behavior between them. This type of private financing is especially prevalent in developing countries with immature financial systems, such as China. This behavior reduces individuals’ or households’ total preventive savings for the future, thus lowering family liquidity constraints and stimulating tourism consumption (DeLeire & Kalil, 2010; Zhu et al., 2021). Hypothesis 3 is therefore proposed:
H3: One’s social network level mediates the influencing mechanism of happiness on one’s level of tourism consumption.
Methodology
Models and Variables
Because many families in our dataset did not demonstrate tourism expenditure (Belotti et al., 2015; Mullahy, 1998), we constructed the following two-part models to facilitate analysis:
Equation 1 is the first part, and Equation 2 is the second. i refers to the family and t represents the year.
Data Sources
Data for this study were drawn from multiple rounds of the China Household Finance Survey (CHFS). The survey is conducted by the Survey and Research Center for China Household Finance at the Southwestern University of Finance and Economics. Four survey rounds were respectively performed in China in 2011, 2013, 2015, and 2017. We organized these data according to household codes when assembling our panel dataset. To ensure the validity and representativeness of the sample, data from households with negative total household income, zero total household consumption, and households headed by a person older than 80 or younger than 18 years were excluded. Heads of households were asked a main question, “Overall, do you feel happy now?”, as part of the CHFS survey; response options were 1 = very unhappy, 2 = unhappy, 3 = neutral, 4 = happy, and 5 = very happy, reflecting the original data for happiness. When scholars use ordinal explanatory variables for regression analysis, they usually convert these variables into a set of either dummy variables or latent variables to prevent wrong answers due to nonlinearity (Kukuk, 2002; Terza, 1987). We therefore set two regression variables for happiness: Happiness_latent and Happiness _dummy. Happiness _latent is the latent variable of happiness, which we transformed from its initial ordinal form using Terza’s (1987) approach; the transformation method is shown in Appendix 1 (see the Supplemental file in the online supplemental material). Happiness _dummy is a dummy variable of happiness calculated from the original data.
In addition to addressing respondents’ current happiness, items related to economic variables (e.g., tourism consumption, total household income) are based on respondents’ information from the prior year. We used current economic data in our empirical analysis and matched data on the happiness of follow-up families in the last round of the survey, to avoid the endogeneity problem of reverse causality between happiness and consumption variables.
Results and Analysis
Variable Definitions and Descriptive Statistics
Table 1 presents the definitions and descriptive statistics for all variables. The first dependent variable, travel or not (tourism), has a mean value of 0.243, which means that only 24.3% of the observed sample travelled. The mean value of the dependent variable (Tourism_con) was $228 annually with a standard deviation of 719; that is, Chinese individuals’ average family travel consumption was quite low, and the difference in tourism consumption was significant. The mean value of Happiness_dummy was 0.591, indicating that respondents’ self-rated happiness was fairly high. The statistics for control variables reflected actual conditions in China. Our sample was therefore sufficiently representative.
Definitions and Descriptive Statistics of Variables.
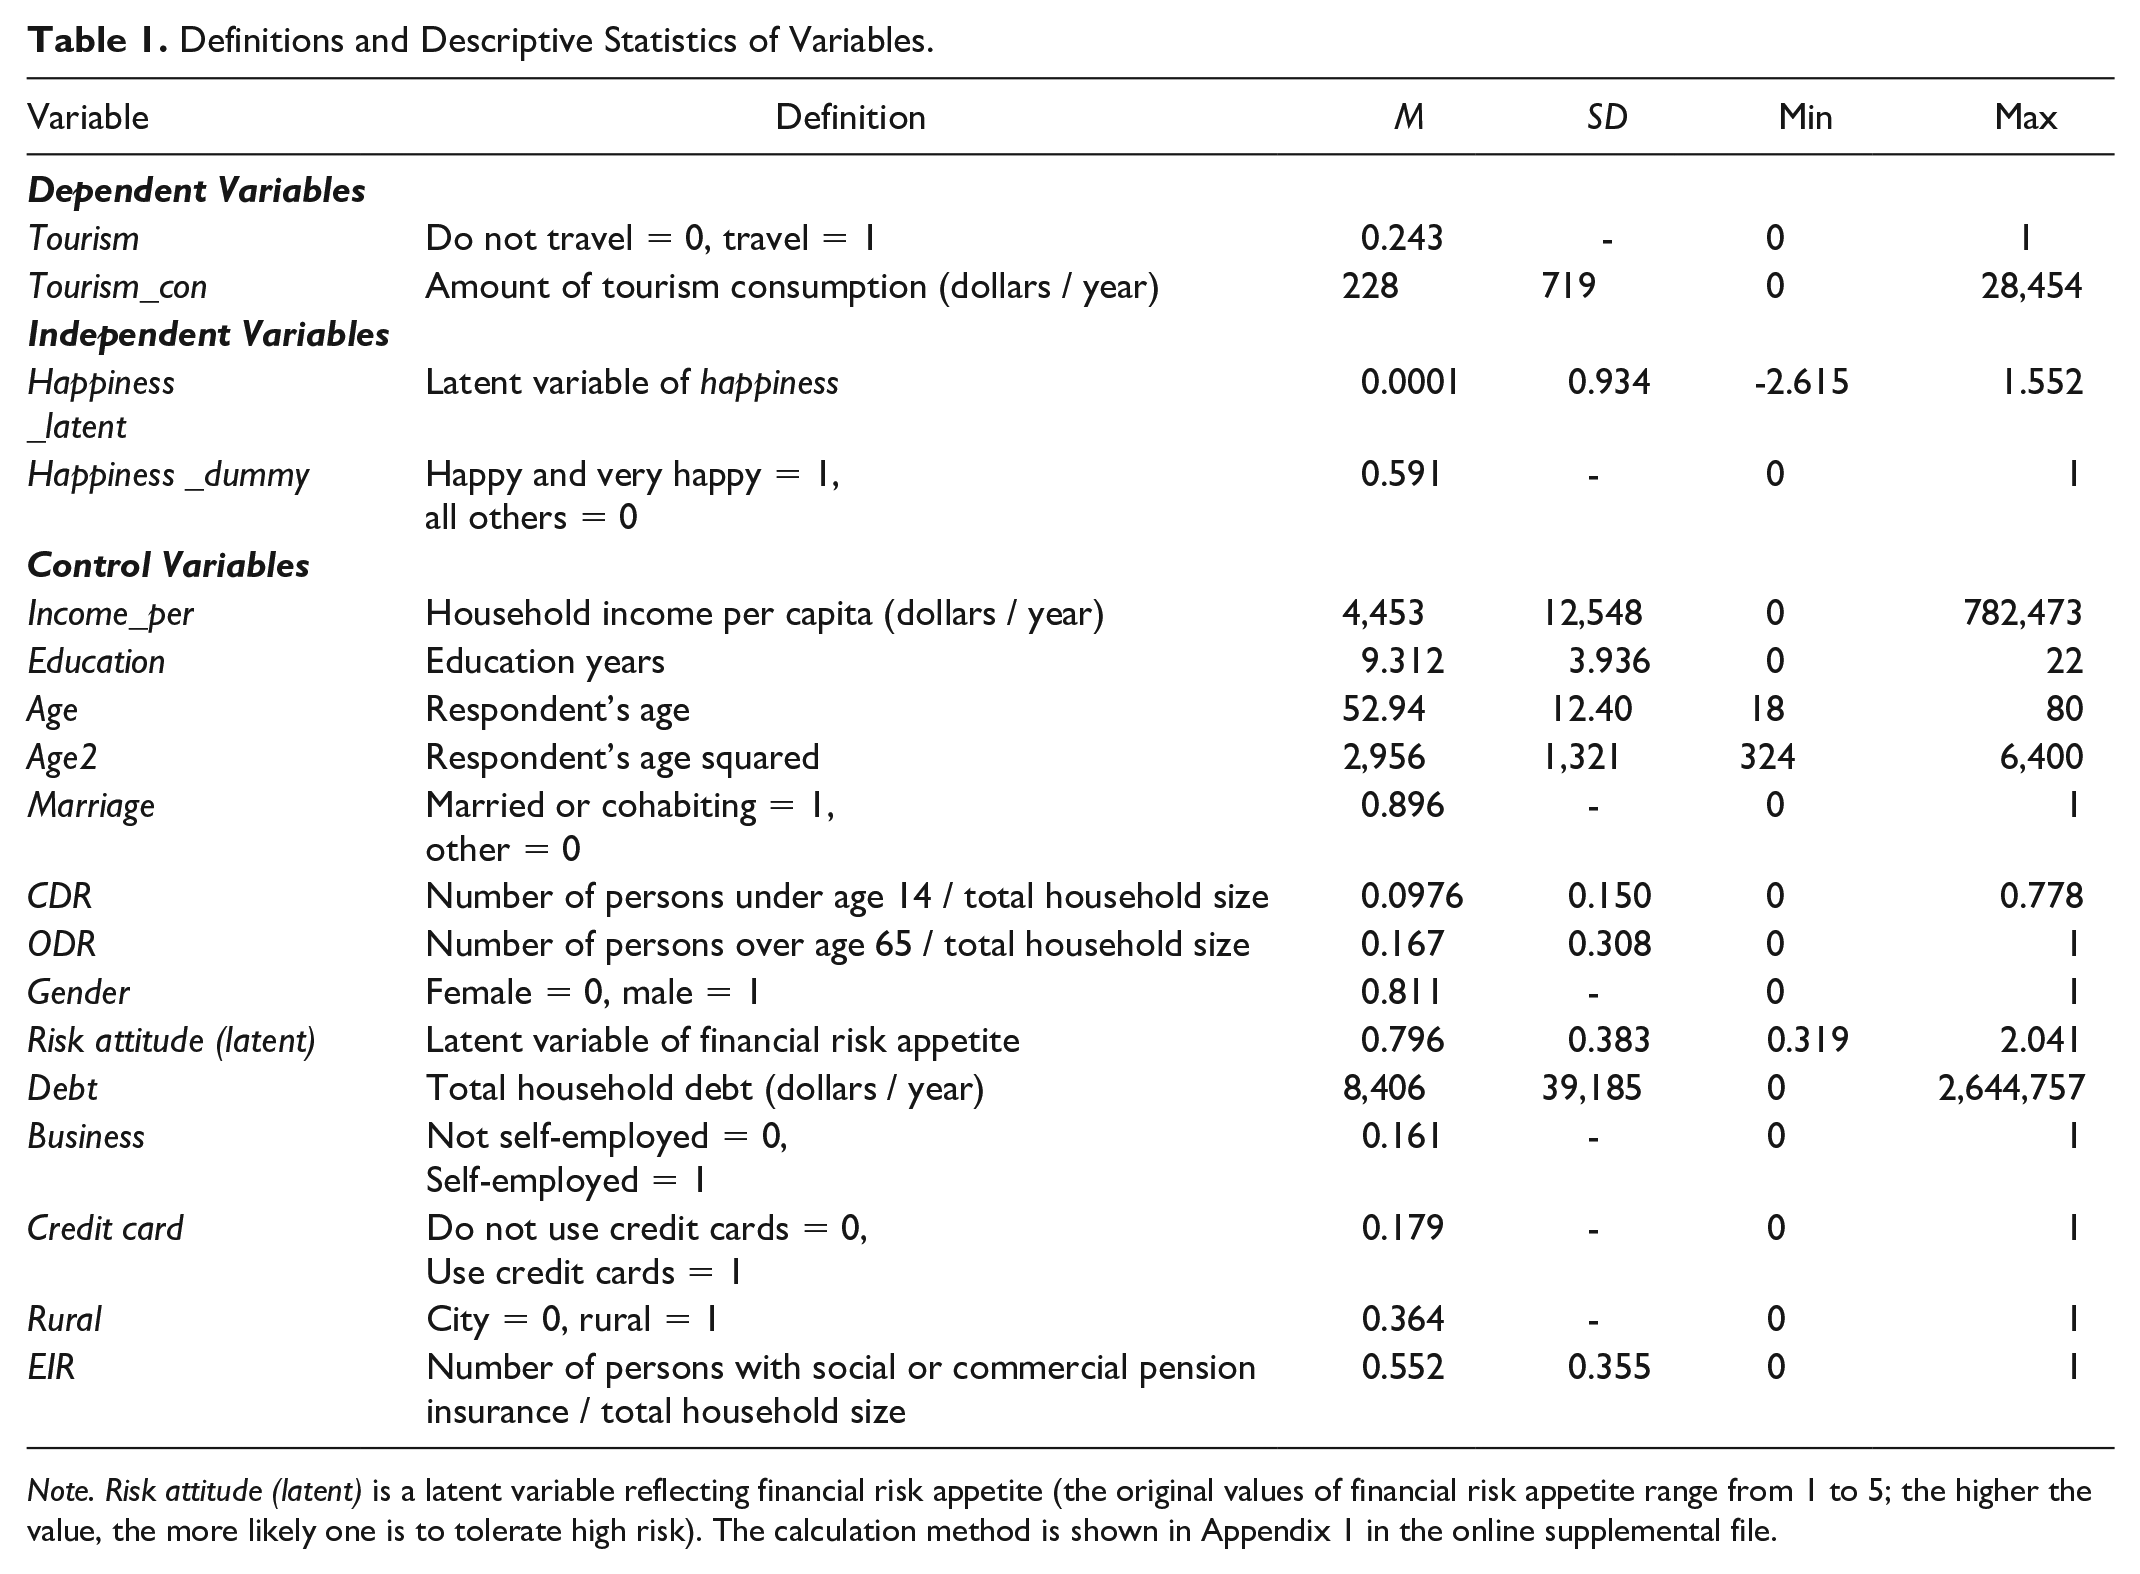
Note. Risk attitude (latent) is a latent variable reflecting financial risk appetite (the original values of financial risk appetite range from 1 to 5; the higher the value, the more likely one is to tolerate high risk). The calculation method is shown in Appendix 1 in the online supplemental file.
Two-Part Model Regression
Table 2 outlines results of the benchmark regression for the full sample. Models 1 and 2 showed results for the first part (panel probit regression): The dependent variable was Tourism (do not travel = 0, travel = 1); the independent variables were Happiness_latent and Happiness_dummy, respectively. The results indicated a significant positive correlation between happiness and tourism preference (p < .01). Higher levels of happiness made respondents more likely to participate in tourism activities, lending support to H1. Models 3 and 4 conveyed the results for the second part (panel family and year double fixed-effect regression): The dependent variable was the logarithmic form of tourism consumption (logTourism_con) for families with tourism expenditure (Tourism = 1). As with Models 1 and 2, the independent variables were Happiness_latent and Happiness_dummy, respectively. A significant positive correlation was observed between the amount of tourism consumption and happiness (p < .01), revealing that happier people spend more on tourism; as such, H2 was supported.
Two-Part Model Regression.
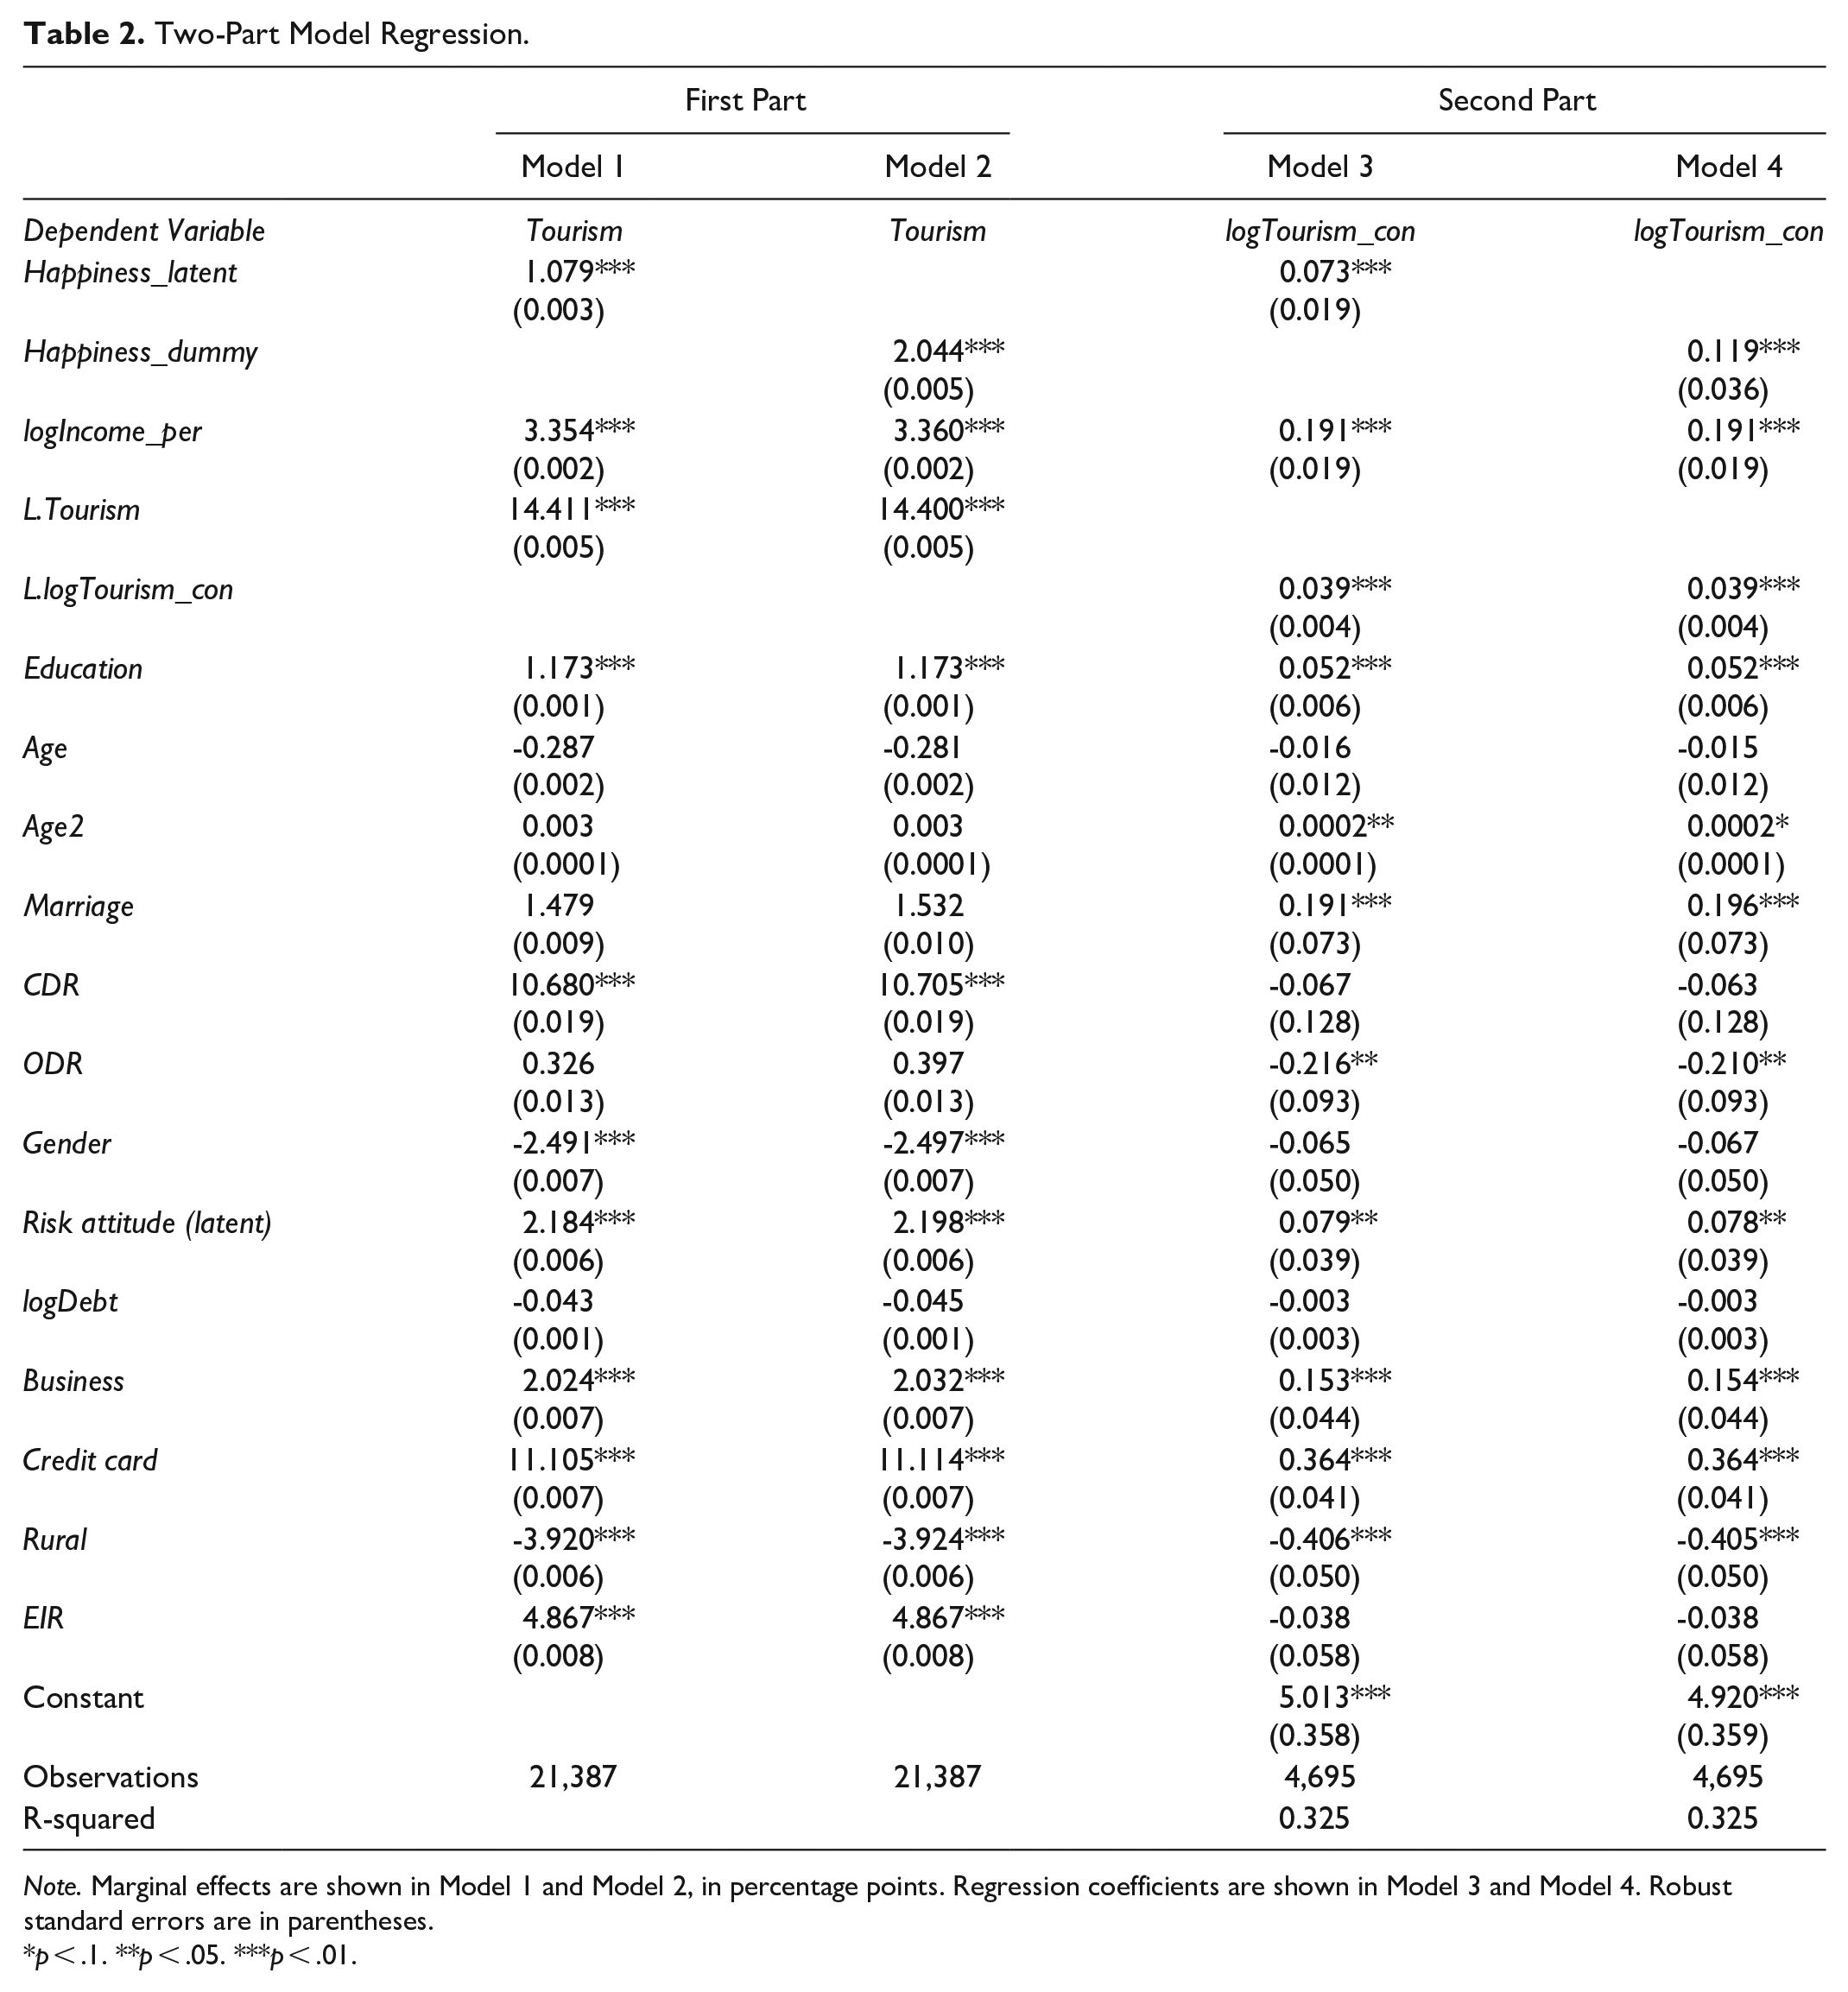
Note. Marginal effects are shown in Model 1 and Model 2, in percentage points. Regression coefficients are shown in Model 3 and Model 4. Robust standard errors are in parentheses.
p < .1. **p < .05. ***p < .01.
The benchmark regression results in Table 2 show that, after controlling for some variables that affect individual and family tourism consumption, happiness can still have significant positive impacts on tourism propensity and consumption: In the first part, for every 1-unit increase (0.934) in the standard deviation for Happiness_latent, a person’s tendency to travel rose by 1 percentage point (0.934*1.08; 1.08 was marginal effect in Model 1). Meanwhile, households’ tourism consumption in the second part rose by 6.8% (0.934*7.3%; 7.3% was the coefficient of Happiness_ latent in Model 3). The tendencies to travel and engage in tourism consumption among happier people were respectively 2.04 percentage points (the marginal effect in Model 2) and 11.9% (the Happiness_dummy coefficient in Model 4 of the second part) higher than among relatively less happy people. Greater happiness made people more likely to travel and to spend more doing so. A consensus remains elusive on how happiness affects general consumption (Guven, 2012; Zhu et al., 2021). However, in our sample, happiness positively influenced tourism consumption—a type of consumption which can induce happiness.
The findings for control variables echoed previous studies and Chinese characteristics. Household per capita income was positively associated with families’ propensity to travel and with their travel consumption. This outcome validated the absolute income theory of tourism consumption in that households with higher incomes consume more (Lin et al., 2021; Song et al., 2012). The lags in tourism and tourism consumption were significant, verifying the ratchet effect of tourism consumption. In other words, people tended to maintain their original tourism consumption patterns and levels. Education level was positively related to people’s tourism tendencies and tourism consumption. This finding supported the preventive savings theory of tourism consumption, such that this consumption depended on current and expected income (Zhang & Feng, 2018; B. Zheng & Zhang, 2013). Age2 was positively correlated with tourism consumption as well: Middle-aged people appeared more inclined than others to engage in tourism, as noted elsewhere (Alegre & Pou, 2016; Bernini & Cracolici, 2015). No significant differences in travel tendencies were observed between married and unmarried households. Even so, married households engaged in significantly more tourism consumption than unmarried households. Households with a high proportion of children were more likely to travel. These results did not perfectly mirror earlier work but aligned with Chinese attributes. The country adhered to a one-child policy for more than 30 years. Families have thus invested heavily in their children’s learning and growth. This policy has changed over the past decade, with some families beginning to have two or more children. This pattern could evolve and ultimately be similar to samples in other countries. Meanwhile, families with a high proportion of elderly people spent less on tourism. This result was inconsistent with previous research on developed economies. Culture again offers an explanation: many elderly people in China, especially in rural areas, do not have a high pension to support a tourism habit. Families’ travel tendencies were higher when a woman headed the household. The remaining control variables influenced income, expected income, and savings motivation. Findings for these aspects lent further support to the absolute income theory, relative income theory, life cycle theory, and preventive savings theory of tourism consumption.
Regression Analysis When Introducing an Instrumental Variable
Frequent tourists are generally happier than people who engage in tourism less often (J. Zheng et al., 2022). To address potential endogeneity due to reverse causality, we took residents’ satisfaction with community public services as the instrumental variable for further analysis (Public Service; values ranged from 1 to 5, with higher values indicating greater satisfaction). Residents’ satisfaction with these services should affect their happiness but not their travel tendencies or tourism consumption. Referring to Terza (1987), we also transformed the ordinal variable Public Service into the latent variable Public Service (latent). A correlation test showed that Tourism and logTourism_con were not significantly correlated with Public Service (latent). Taking Models 1 and 3 as benchmarks, we used the two-stage instrumental variable method of panel data for a two-part regression; the results are shown in Table 3. The instrumental variable passed the Durbin–Wu–Hausman test for endogeneity and the weak instruments test.
Regression Results for the Instrumental Variable Method.
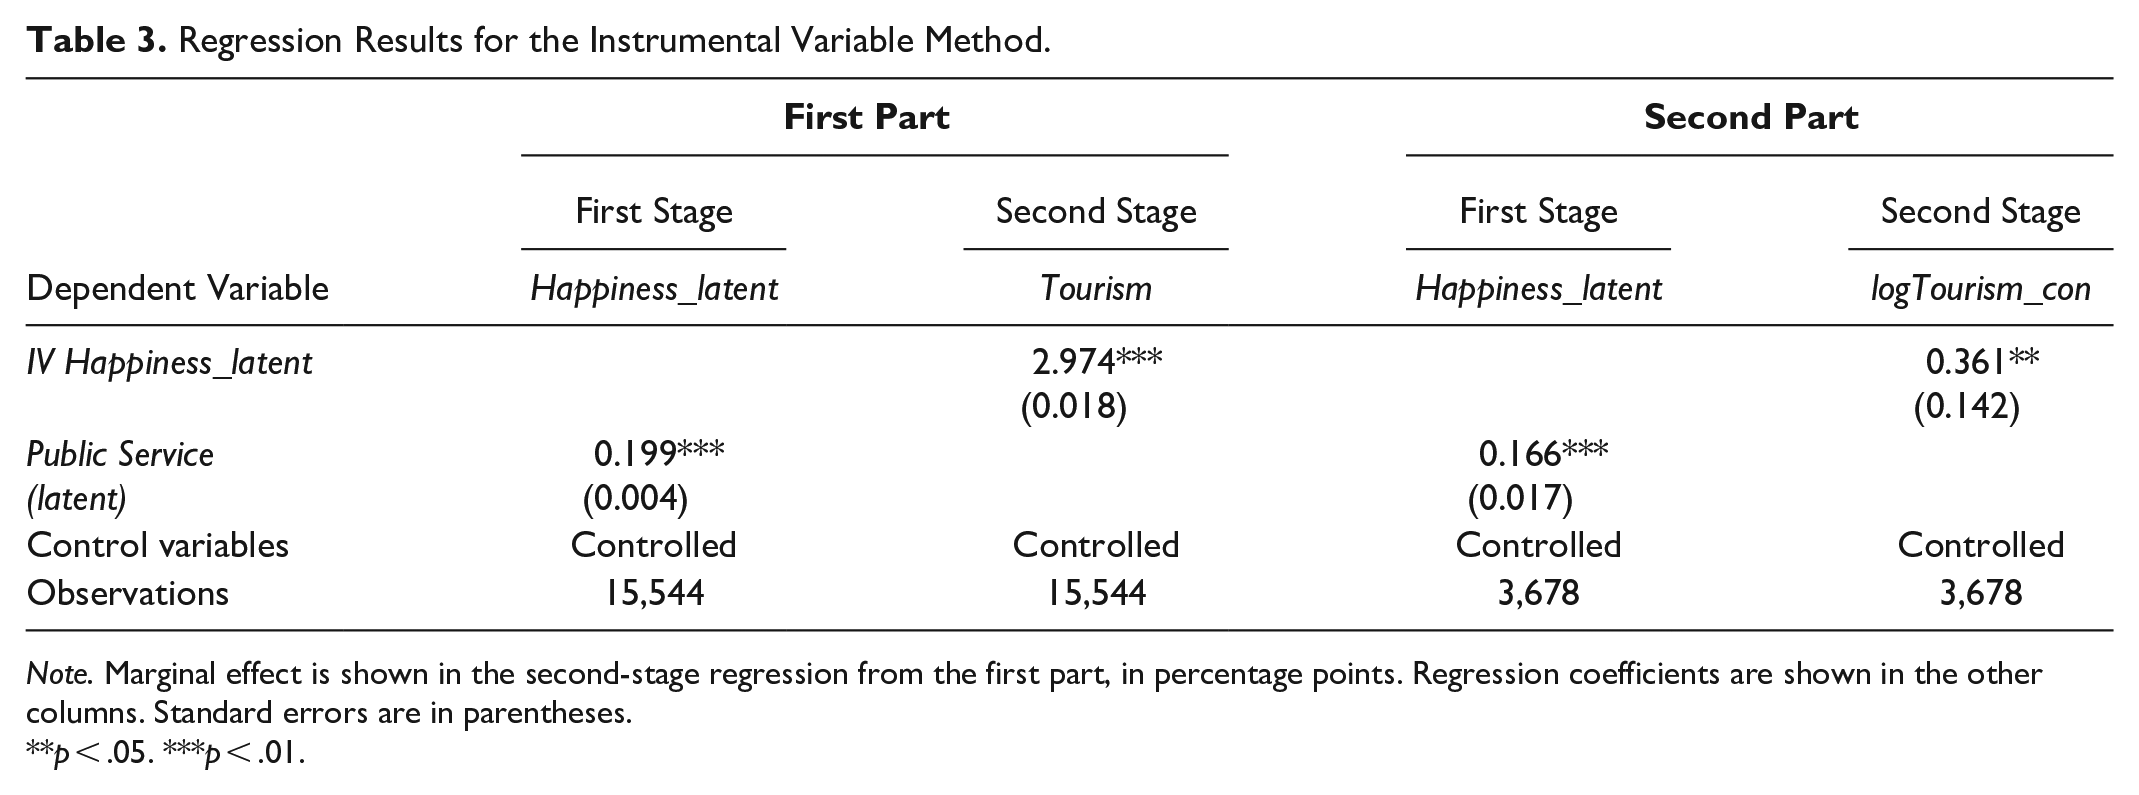
Note. Marginal effect is shown in the second-stage regression from the first part, in percentage points. Regression coefficients are shown in the other columns. Standard errors are in parentheses.
p < .05. ***p < .01.
Regression coefficients for these two models were significant, indicating that our findings were robust and valid. Essentially, once the instrumental variable estimation excluded some endogeneity, the promotional effect of happiness on tourism propensity and tourism consumption remained significantly positive. H1 and H2 were again supported. The first-stage regression results from the first part (the dependent variable was Tourism: do not travel = 0, travel = 1) were significantly positive, indicating that Public Service (latent) possessed sound explanatory power in relation to happiness when taken as the instrumental variable in the total sample. Marginal effects revealed that adding one unit of Public Service (latent) increased Happiness_ latent by 19.9%. The second-stage regression in the first part also yielded significantly positive findings. Further calculation of marginal effects indicated that, with every 1-unit increase (0.934) in the standard deviation for residents’ happiness (latent) as measured with an instrumental variable (i.e., Public Service [latent]), residents’ participation in tourism activities rose by 2.8 percentage points (0.934*2.97; 2.97 was the marginal effect in the second-stage regression from the first part). Similar to the results of the first-stage regression from the first part, the first-stage regression from the second part (the dependent variable was the logarithmic form of tourism consumption [logTourism_con] for families with tourism expenditure [Tourism = 1]) was significantly positive. That is, the instrumental variable Public Service (latent) had good explanatory power on happiness: adding one unit of Public Service (latent) increased Happiness_ latent by 16.6% in the sample of families with tourism expenditure. The second-stage regression from the second part was significantly positive as well: Marginal effects demonstrated that, with every 1-unit increase (0.934) in the standard deviation for residents’ happiness (latent) as measured with an instrumental variable, the tourism consumption of families with tourism expenditure increased by 33.8% (0.934*36.1%; 36.1% was the IV Happiness_ latent coefficient of the second-stage regression from the second part). We additionally computed the total marginal effects of the first and second parts: With every 1-unit increase in residents’ happiness (latent) as measured with an instrumental variable, the mean value of tourism consumption for the total sample increased by US$7.1.
Research based on micro-level data may exaggerate the regression coefficient due to the local average treatment effect when using instrumental variable estimation (Angrist & Pischke, 2009; Jiang, 2017). In this case, compared with the benchmark regression, the marginal effect obtained via instrumental variable estimation increased significantly. Respondents’ sense of happiness was therefore negatively correlated with the error term in Equations 1 and 2. This term encompassed other factors affecting tourism tendency and consumption which the control variables did not fully control (e.g., tourist source areas’ macroeconomic and cultural factors; travel- and destination-related factors). The benchmark estimates thus understated the promotional effect of happiness on tourism consumption.
Grouping Regression Analysis
To further determine the robustness of our benchmark regression and to guide tourism government departments’ and tourism product and service providers’ decision making, we carried out a more detailed grouping study of the full sample. Subgroups were based on eight variables: Age, with reference to the United Nations’ age classification standards when dividing our sample into young (under age 45), middle-aged (45–60), and elderly (over age 60) respondents; Gender; Education (above the median = higher education; lower education otherwise); Marriage (whether married or cohabiting); income level (above the median = high income; low income otherwise); Rural (place of residence); whether the household contained children; and whether the household contained elders. Table 4 lists the results of grouping regressions. A significant rising impact of happiness on tourism preference and consumption manifested for most subgroups. These findings reinforced the robustness of our benchmark regression.
Grouping Estimation.
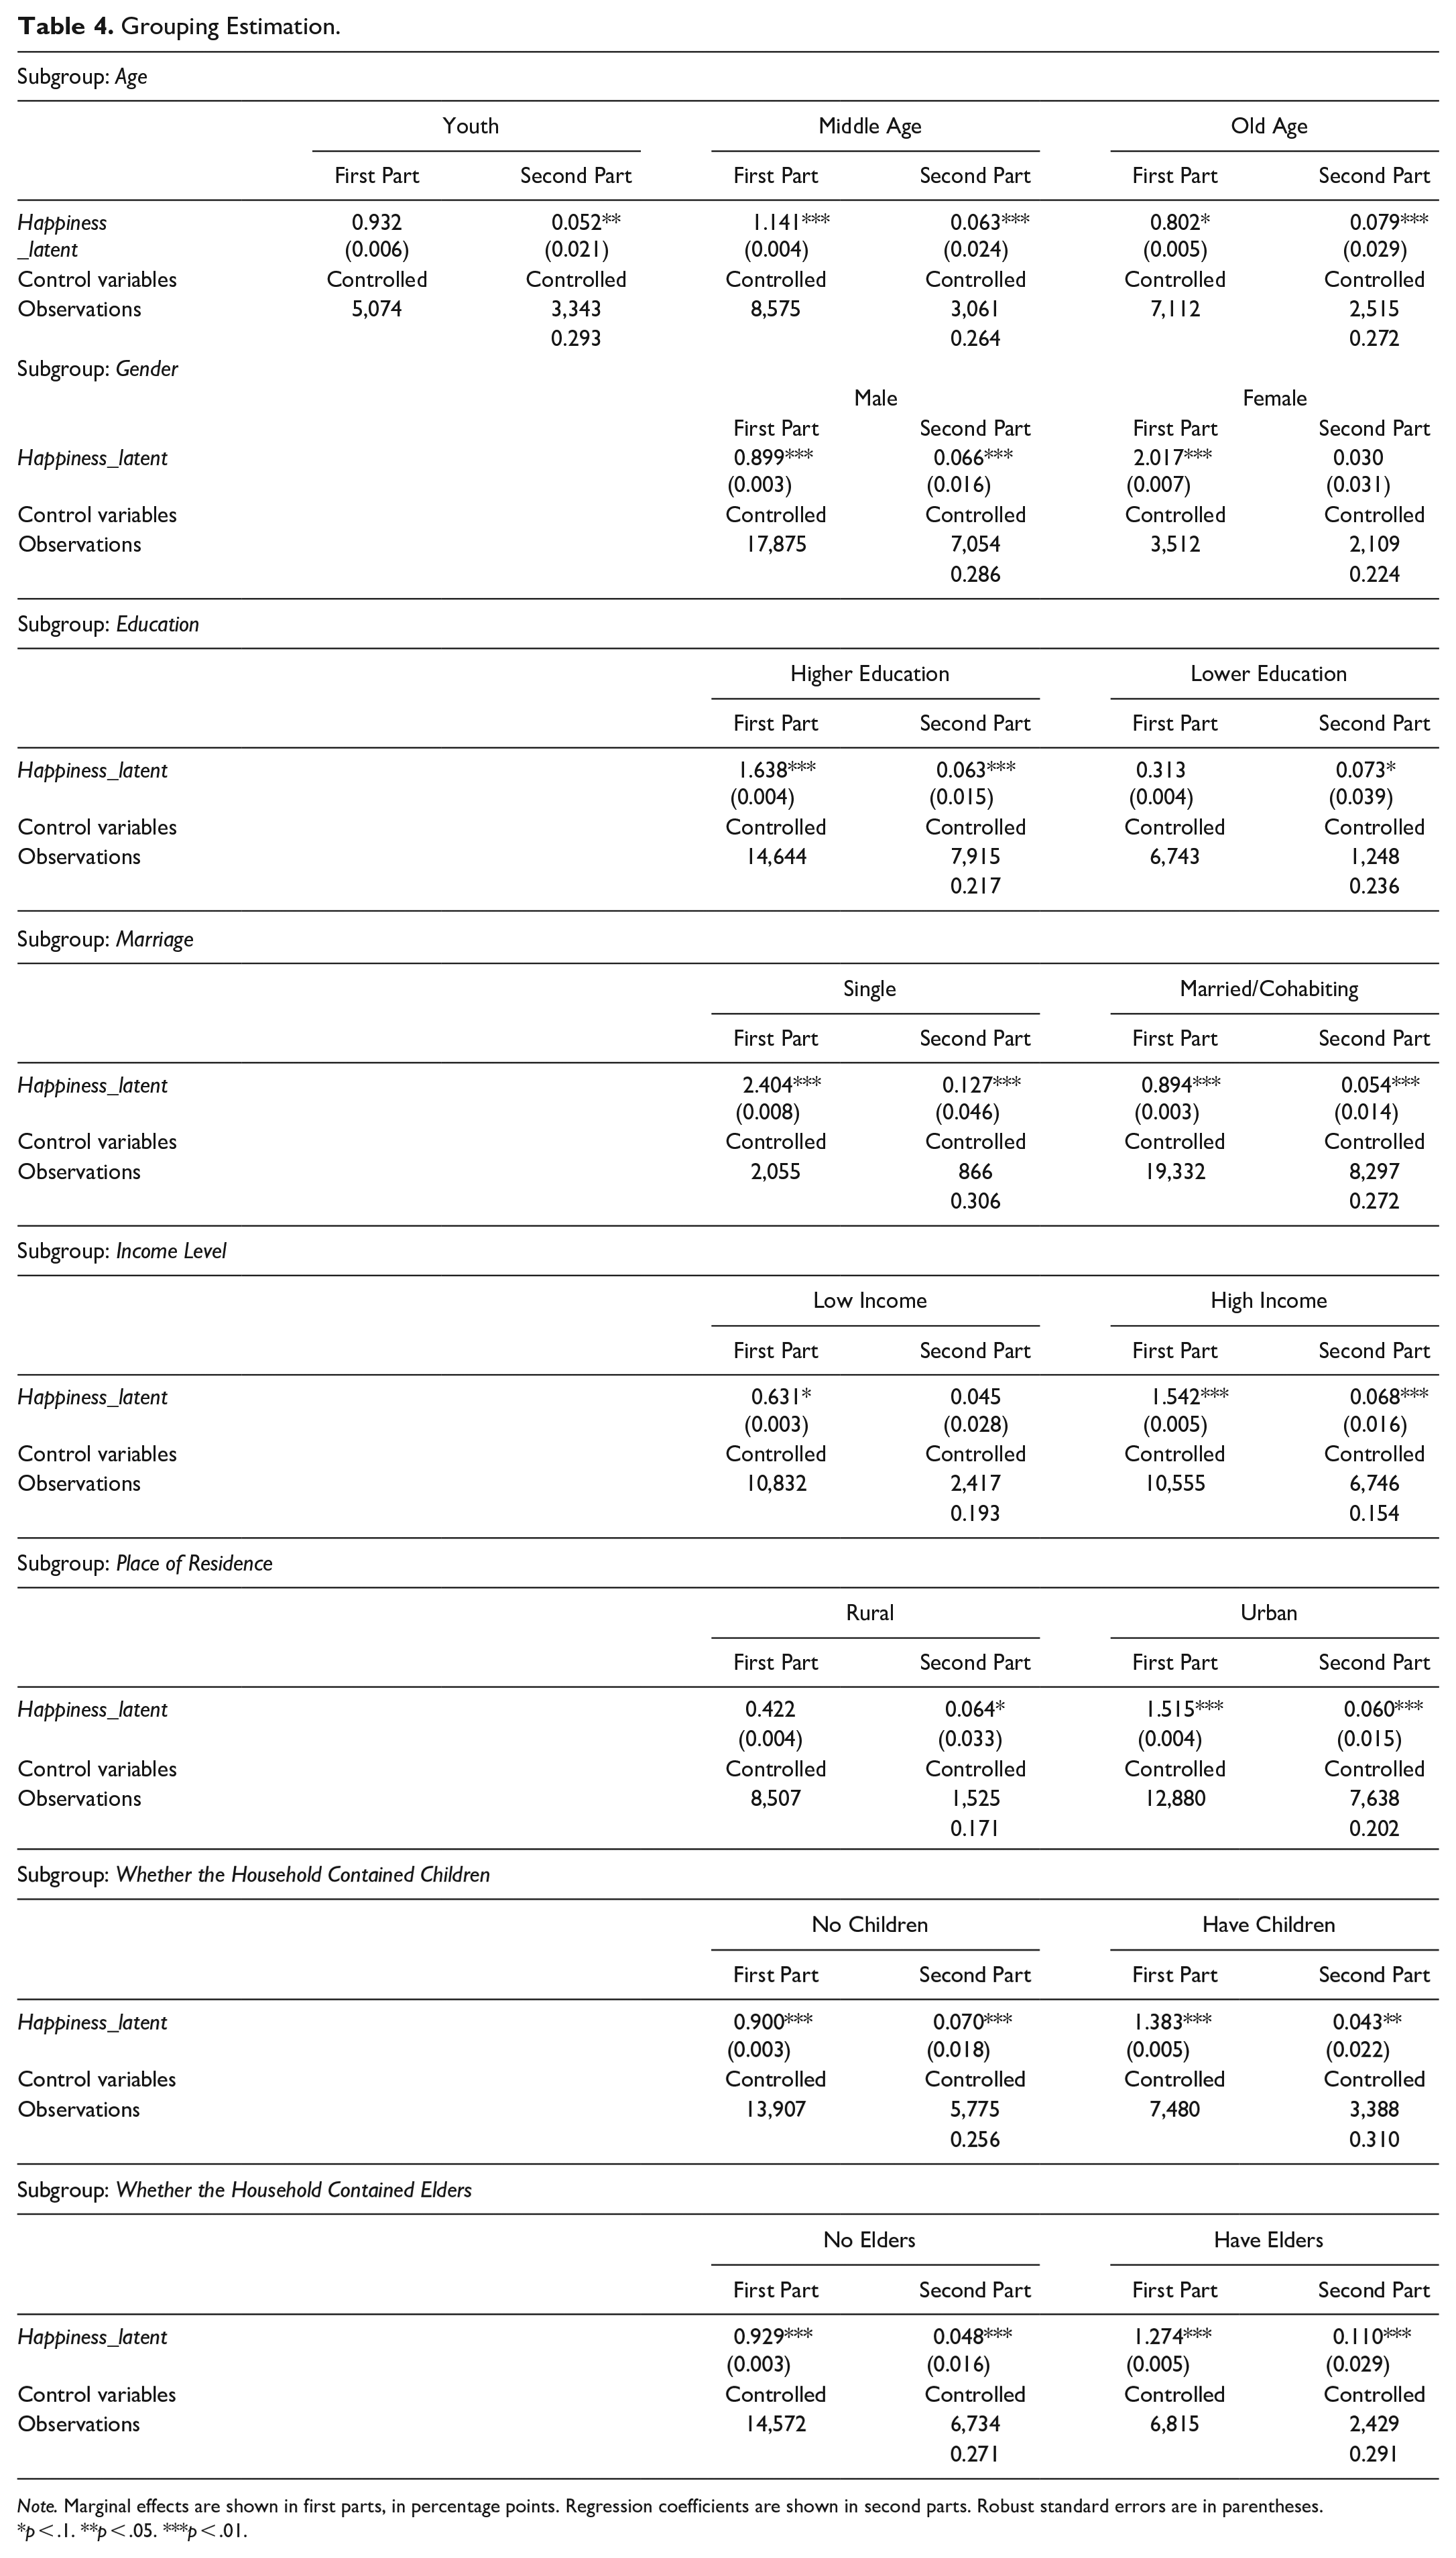
Note. Marginal effects are shown in first parts, in percentage points. Regression coefficients are shown in second parts. Robust standard errors are in parentheses.
p < .1. **p < .05. ***p < .01.
When grouped by Age, for the first part, happiness had no significant impact on young families’ increase in tourism tendency. Significant positive impacts were found for middle-aged and elderly families, with the effect being especially pronounced for middle-aged people. For the second part, all subgroups showed significantly positive outcomes: Results were highest for the elderly group, followed by the middle-aged group and finally the young group. The happiness of both female and male heads of household could enhance tourism preference, but the promotional effect on female headed households was more obvious; only the happiness of male heads of household could significantly raise families’ tourism consumption. The happiness of household heads with higher education levels was significantly positively correlated with tourism preference; lower education levels did not play a significant role. However, in the second part, the happiness of subgroups with higher and lower education levels had a significantly positive relationship with tourism consumption. The subgroup with lower education demonstrated a stronger effect. Tourism preference and consumption among single and married families rose with greater happiness; however, single households scored significantly higher. Low-income and high-income subgroups both displayed a promotional effect of happiness on tourism preference. Whereas happiness had no significant effect on tourism consumption in low-income families, a positively significant impact emerged for high-income families. Happiness only significantly influenced urban residents’ tourism preference. It significantly affected both urban and rural residents’ tourism consumption, with the impact being slightly greater among rural residents. Regardless of whether families had children, happiness had significant positive impacts on tourism preference and consumption. Comparatively, happiness had a greater effect on the tourism preference of families with children and a stronger impact on the tourism consumption of families without children. In families without or with elderly members, happiness played a significant positive role in tourism preference and consumption. This impact was more pronounced for households with elders.
Mediating Effect of Social Network Level
The above analyses confirmed that people with a strong sense of happiness had higher tourism tendencies and greater tourism consumption. To further verify the positive impact of Chinese residents’ happiness on tourism, we analyzed a key mediating variable: social networks. Happy people typically possess wider and higher-quality social networks than others. They also have more work and financial opportunities, less savings, and greater consumption—principally in social settings (DeLeire & Kalil, 2010; Zhu et al., 2021). China is a collectivist culture; many Chinese devote substantial time and money to maintaining high-quality social connections. Chinese individuals often travel based on a herd mentality and to seek new experiences. These activities can enhance social contact with friends and relatives (Keating & Kriz, 2008; Leung et al., 2014). Chinese people usually decide to travel because their relatives and friends are planning to do so. They then purchase gifts for loved ones during trips, raising their travel expenses. Finally, they share information about their trips through various channels upon returning home to spark others’ desire to travel.
To analyze the mechanism of the increasing impact of happiness on tourism consumption, we integrated the variable of household social network level and used a step-by-step method to construct a mediating effect model. The first part can be written as follows:
where
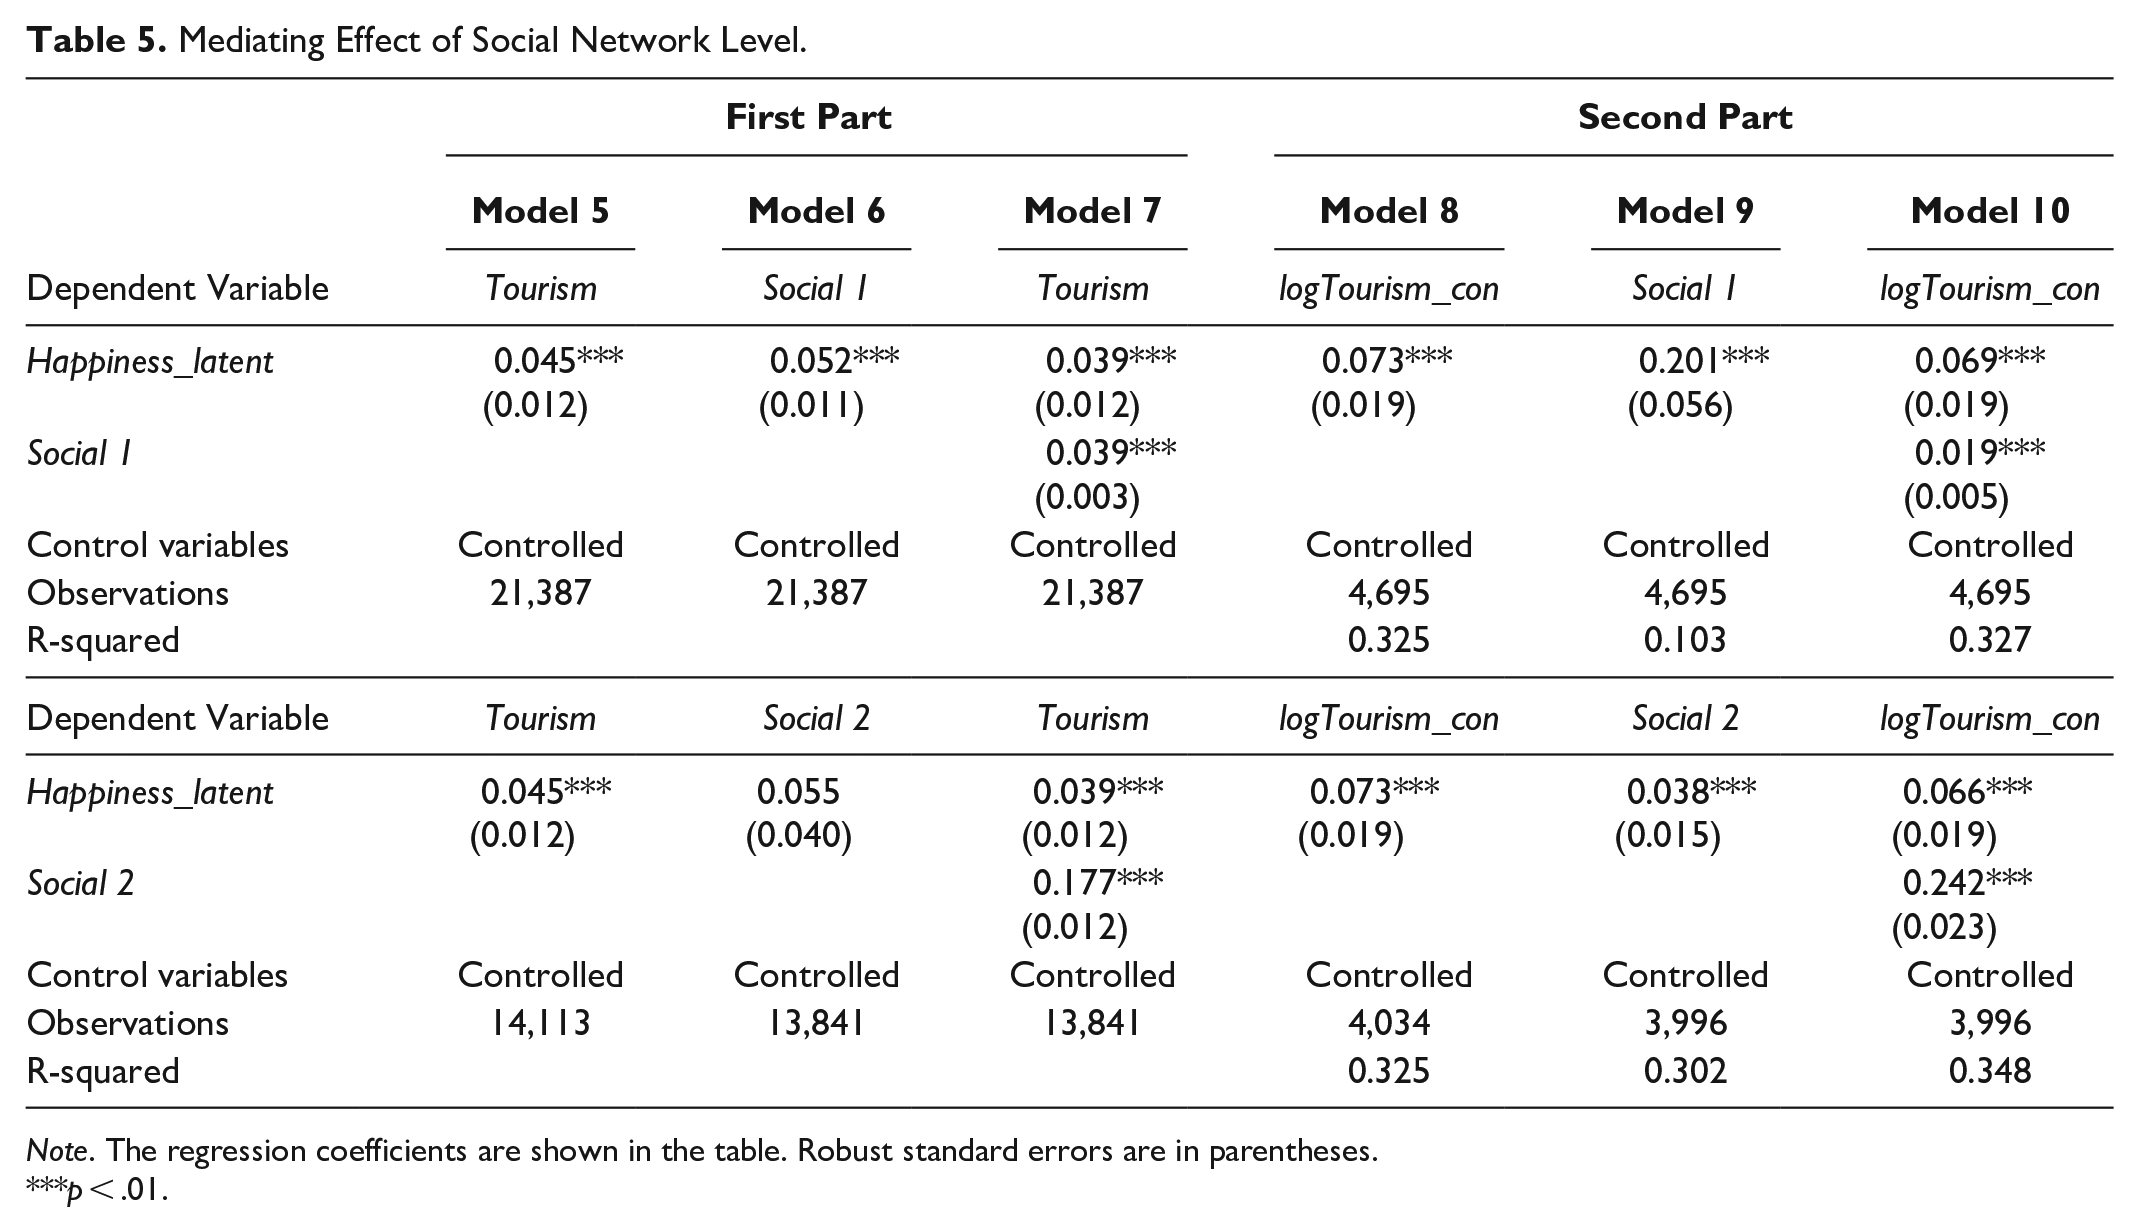
We first took gift-giving expenditure (Social 1) as a proxy for households’ social network level. Social 1 measured the social network level represented by the household’s personal gift payments (natural logarithm) to non-family members. These payments included “Spring Festival, Mid-Autumn Festival, and other holiday expenses,” “wear red or white expenses and birthday expenses” (“red or white” refers to Chinese weddings and funerals, as red is typically worn at Chinese weddings while white is worn at funerals), and other reasons. These regression results are shown in Table 5. Models 5 to 7 showed results for the first part of the regression, and Models 8–10 showed findings for the second. Model 6 demonstrated a significant positive impact of happiness on social network level. Model 7 indicated that, when using the dependent variables for tourism preference in the same model, the coefficients of happiness and social network level were each positive and significant at the 1% level. Compared with the benchmark regression coefficient (0.045) before adding social network level, the coefficient of happiness (0.039) decreased in Model 7. Social network level as measured by gift-giving expenditure thus mediated the impact of happiness on tourism preference. The second part of the regression captured a similar trend in that social networks mediated happiness and tourism consumption. Regression bias may have followed from household heads’ endogenous sense of happiness. To address this possibility, we used community public service (Public Service [latent]) as an instrumental variable to conduct estimation. Supplement Table 1 (please refer to the supplemental file in the online supplemental material) lists these findings. Similar to the above results, the IV happiness coefficient declined after joining a social network (Social 1). Social networks hence mediated the relationship between household heads’ happiness and tourism preference. These networks also mediated the relationship between happiness and household tourism consumption.
Mediating Effect of Social Network Level.
Note. The regression coefficients are shown in the table. Robust standard errors are in parentheses.
p < .01.
To further verify the robustness of this mediating effect, we changed Social 1 to the logarithmic form of households’ annual communication expenditure (Social 2). The results (in Table 5) show that the family social network represented by households’ annual communication expenditure (Social 2) also mediated the impact of happiness on tourism preference and tourism consumption. Supplemental Table 1 (in the online supplemental material) shows the results of instrumental variable estimation, mirroring those in Table 5.
In all, we used two variables as proxies for families’ social networks and then employed instrumental variable estimation. All findings revealed social networks to mediate happiness in tourism consumption, supporting H3.
Conclusion and Discussion
Conclusion
Based on the theory of consumption function and research in happiness economics, our study has described how happiness influences tourism consumption. We used large-scale CHFS data and two-part models to test our hypotheses. To avoid bias in the regression results caused by nonlinear variables, we adopted Terza’s (1987) method to transform all ordinal explanatory variables (including happiness) into latent variables. The benchmark regression demonstrated that happy people were inclined to travel more and to spend more on tourism. We verified our findings’ robustness via several methods. First, we replaced the independent variable (Happiness_latent) with a dummy variable (Happiness_dummy), and the results were consistent with our benchmark regression. Second, to address reverse causality, we took residents’ satisfaction with community public service as an instrumental variable. The two-stage instrumental variable method for dealing with panel data in the two-part regression indicated that, after eliminating endogeneity, happiness still positively and significantly influenced tourism preference and tourism consumption. Third, we further confirmed the robustness of our benchmark regression by assembling eight grouping regressions. Happiness significantly boosted tourism consumption among nearly every group. Finally, particularly happy people have been found to spend more time and money maintaining social relationships (DeLeire & Kalil, 2010; Veenhoven et al., 2021; Zhu et al., 2021). Tourism consumption enhances interaction (Keating & Kriz, 2008; Leung et al., 2014). We identified a mediating effect of social network level between happiness and tourism consumption.
Theoretical Implications
This study makes three main theoretical contributions. First, the findings enrich knowledge of happiness economics: Individuals’ happiness can promote the consumption of happiness-inducing products. Scholars have primarily examined how happiness informs one’s overall consumption, but different theories have yielded inconsistent results. Some researchers have concluded that happiness can enhance consumption based on absolute income theory and relative income theory (Zhu et al., 2021), whereas others have argued that happiness has inhibitory effects, because life cycle theory posits that happy people engage in rational consumption and show relatively restrained spending on non-necessities and luxury goods (Costley et al., 2007; Guven, 2012). Our study revealed that, when considering how happiness influences consumption, consumption types should be distinguished based on whether or not they are happiness-oriented. Tourism consumption involves happiness-inducing offerings and can lead highly happy people to gain pronounced utility (i.e., satisfaction and pleasure) from such products. For these individuals, happiness-oriented consumption can transcend the scope of non-essential goods to represent a life need.
Second, our research expands the impact factors of tourism consumption. Scholars have conventionally attended to sociodemographics, tourist source areas’ macroeconomic and cultural conditions, and trip- or destination-related attributes. Studies on psychological influencing factors typically overlook an important mental aspect: consumers’ happiness. We introduced the classic theory of consumption function in economics and described how one’s perceived happiness affects tourism consumption.
Third, it remains challenging to study how psychological factors influence such consumption because the transmission mechanism from abstract psychology to real consumption can be ambiguous. We believe that attention should be paid to related transmission mechanisms. Our in-depth exploration helps to bridge psychology and the actual economy, rendering this analysis more realistic. To further clarify how happiness translates into tourism consumption, we took social networks as a moderator to increase our findings’ reliability. Happier people tend to have wider and higher-quality social networks, which can directly elevate their social consumption (e.g., tourism consumption). High-quality social networks can boost household income and expected income as well. The theory of absolute income and relative income asserts that a rise in income will encourage tourism consumption. Meanwhile, a high-quality social network attributable to one’s happiness can reduce uncertainty and preventive savings. Happy people can therefore maintain a dedicated travel budget and consume more.
Managerial Implications
Our findings also make meaningful practical contributions. First, we suggest that the government should attach importance to industries that enhance people’s happiness, as we found that the improvement of happiness has economic benefits, that is, happiness can increase people’s consumption of happiness products, which helps to form an upward spiral relationship between economic development and happiness. For example, because tourism has been found to increase happiness, local governments should take specific steps. They can support the local tourism industry’s development by offering tax reductions for small tourism companies and issuing tourism consumption vouchers for newly built tourism projects. Government transfer payments will facilitate higher incomes for all residents, which would benefit local non-tourism practitioners as well. Governments should also encourage residents’ tourism spending. Cross-regional tourism cooperation can be promoted via tourism vouchers. Meanwhile, for workers, their number of days off could be more flexible. For instance, the current 5-day workweek could be modified to switch between a 6-day and 4-day workweek every other week. Employees would then have more chances to travel, and traffic congestion would decline. Governments should additionally subsidize social tourism projects to enable people who cannot travel (e.g., for economic or other reasons) to experience the joy of tourism and realize greater happiness.
Second, detailed grouping estimations confirmed that the rising effect of happiness on tourism preference and tourism consumption varied across subgroups. These findings indicate subtle yet thought-provoking differences. Travel service providers can refer to these outcomes to tailor marketing programs to certain family characteristics. Happy people may then continue to travel more, while individuals who are less happy will gain more fulfillment from tourism.
Limitations and Suggestions for Future Research
This research has several limitations that present avenues for exploration. First, happiness was shown to positively affect tourism consumption. Our work can be expanded to other happiness industries to identify universal consumption patterns from a wider perspective. Second, we contended that happiness positively influences tourism consumption for economies with low levels of happiness and such consumption (i.e., residents are more inclined to partake in tourism). This relationship merits investigation in developed economies demonstrating a strong sense of happiness and generous tourism consumption. Third, our study only captured social networks as a mediating factor in the impact of happiness on tourism consumption. Other potential mediators, such as individual expectations, should be scrutinized as well.
Supplemental Material
sj-docx-1-jht-10.1177_10963480241229236 – Supplemental material for Do Happier People Like Traveling More?
Supplemental material, sj-docx-1-jht-10.1177_10963480241229236 for Do Happier People Like Traveling More? by Jing Ma, Xinjing Wang and Lihui Tian in Journal of Hospitality & Tourism Research
Footnotes
Declaration of Conflicting Interests
The authors declared no potential conflicts of interest with respect to the research, authorship, and/or publication of this article.
Funding
The authors disclosed receipt of the following financial support for the research, authorship, and/or publication of this article: This research is supported by Major Program of National Fund of Philosophy and Social Science of China Grant numbers: (17ZDA071).

Supplemental Material
Supplemental material for this article is available online.
Author Biographies
References
Supplementary Material
Please find the following supplemental material available below.
For Open Access articles published under a Creative Commons License, all supplemental material carries the same license as the article it is associated with.
For non-Open Access articles published, all supplemental material carries a non-exclusive license, and permission requests for re-use of supplemental material or any part of supplemental material shall be sent directly to the copyright owner as specified in the copyright notice associated with the article.
