
Abstract
Dietary restriction of high-protein foods is the primary treatment strategy for phenylketonuria, a disease considered an inborn error of metabolism associated with phenylalanine. The diet of these patients is monotonous, consisting mainly of certain types of fruits and vegetables, and is often supplemented with the use of phenylalanine-free formulas. Considering that Brazil is one of the countries with the most incredible biodiversity in the world, Non-Conventional Food Plants (NCPPs) become food options that can be regularly introduced into the diet of phenylketonuric patients. In the present study, a method for quantifying phenylalanine in NCPPs was validated using high-performance liquid chromatography with an ultraviolet detector. The phenylalanine content was determined in 15 NCPPs samples from the Brazilian Cerrado. The validated method demonstrated selectivity for the amino acid phenylalanine, with linearity in the range of 1–10 nmol/mL, indicating no matrix effect, and provided proven recovery, repeatability, and precision. The detection and quantification limits were 0.0011 mg/100 g and 0.0035 mg/100 g, respectively. The phenylalanine content ranged from 20.28 to 235.58 mg/100 g. It was observed that leafy vegetables had a higher phenylalanine content than the taro stem (20.28 mg/100 g), the chayote fruit (32.67 mg/100 g), the sepal of the sorrel plant (38.21 mg/100 g), and the nasturtium flower (116.24 mg/100 g). These data suggest that these vegetables can be incorporated into the diet of phenylketonuric patients, thereby contributing to dietary diversity and making it less monotonous and more palatable.
INTRODUCTION
Dietary restriction of the essential amino acid phenylalanine (Phe) is one of the primary treatment strategies for phenylketonuria (PKU), a rare disease with a global incidence of approximately 1 in every 23,930 births.1–3 PKU is caused by an autosomal recessive inborn error of Phe amino acid metabolism, caused by variants in the gene encoding Phe hydroxylase,3,4 which is typically responsible for converting Phe to tyrosine.5,6 The deficiency of this enzyme leads to the accumulation of Phe in the blood and brain, promoting severe and irreversible neurological damage. 7
PKU is diagnosed at birth with the almost universal adoption of newborn screening.3,8 In Brazil, it is conducted through the “heel prick test,” which is offered free of charge by the Unified Health System and must be performed throughout the national territory. 9
When diagnosing the disease, treatment should be started immediately. Moreover, in addition to the dietary restriction of foods with high protein content, such as milk, meat, eggs, nuts, cereals, and gelatin, the use of Phe-free food formulas is associated with the treatment, which makes the diet restricted, monotonous, and unpalatable.5,10
To expand the supply of fresh and industrialized food products with low protein content suitable for patients with PKU and to serve as a reference guide for health professionals, the National Health Surveillance Agency (ANVISA) developed an online panel with Phe levels (mg/100 g).
Regarding fresh foods, for the development of the panel, foods belonging to the classes of fruits and vegetables with protein levels equal to or less than 5% were considered, totaling only 74 fresh foods. The method used to prepare the table was the estimation method, where it was considered that 4% of the total protein content present in the vegetable corresponds to the Phe content. 11
Given the limited number of fresh foods with Phe content quantified by ANVISA and considering that Brazil is one of the most biodiverse countries in the world, the importance of studies that explore this potential is emphasized, with the indication of new options for plant foods, such as Unconventional Food Plants (UFP), which can be regularly introduced into the diet of individuals with PKU. UFP are plants that have one or more edible parts but are not available in the global commercialization circuit. 12 Studies indicate that in some cases, these vegetables may have similar or even superior nutritional potential to some conventional ones,12–15 enhancing the use of these plants, in order to diversify the diet of phenylketonurics.
However, for these plants to become part of the diet of phenylketonurics, reliable information on the Phe content must be readily accessible. For this, it is necessary to use analytical techniques capable of determining the Phe content with precision and accuracy. 16 One way to ensure these parameters is the use and application of validated methods.17,18
Several analytical methods have been developed for amino acid determination in recent decades;19,20 however, the high-performance liquid chromatography (HPLC) technique coupled to different detectors such as ultraviolet (UV), fluorescence, photodiode, and mass spectrometry is the most implemented technique.19,21,22
In this context, the objective of this work was to validate a chromatographic method for quantification of Phe in a plant matrix, using HPLC with a UV detector (HPLC/UV), for subsequent quantification of Phe in 15 UFP samples, enabling the verification of plant alternatives for implementation in diets for individuals with PKU.
MATERIAL AND METHODS
Chemicals and reagents
Phe standard (≥99%, Sigma-Aldrich, USA) was used for calibration. Acetonitrile and methanol (HPLC grade, J.T. Baker, USA) were employed as solvents. Glacial acetic acid, anhydrous disodium hydrogen phosphate (Na2HPO4), and phenol were purchased from Merck. The disodium ethylenediamine tetraacetic acid of Modern Chemistry. Vetec’s sodium hydroxide and Biograde’s sodium acetate trihydrate. Triethylamine was purchased from Exodus Científica, and hydrochloric acid (37%) was obtained from Neon. The ultrapure water was obtained from the Milli-Q water purifier, model Milli-Q Academic.
Obtaining and preparing samples
The samples collection proceeded from the Non-Conventional Vegetable Bank of the Santa Rita Experimental Field of the Agricultural Research Company of Minas Gerais (EPAMIG) (Latitude 19°27′15.80′′ S and Longitude 44° 9′24.37′′ W), in Prudente Morais, Minas Gerais, Brazil, and was collected from November 2020 to October 2021.
The samples were herbarized, and the exsicata of each sample was recorded and deposited in the PAMG Herbarium of EPAMIG. The present research was also registered in the National System for the Management of Genetic Heritage and Associated Traditional Knowledge (SisGen) under the number AC4BDD3.
The collected samples were dried in an oven with forced air circulation (Biopar S480AD) at 35°C for 48 h, then crushed in a blender (ARNO, Model L.S.) until a fine and homogeneous powder (mesh 35) was obtained. The powder was stored in a dark location until the time of analysis.
Classification of samples
Based on the data of proximate composition, the samples were grouped according to an organizational system of the food matrix, divided into nine sectors, as proposed by the Association of Official Analytical Chemists 23 based on protein, fat, and carbohydrate contents. According to the premises of this system, an analytical method validated for one or two samples from the same sector must provide accurate results for all foods belonging to the same sector. 23 Table 1 shows the grouping of the samples.
Grouping of Samples of Non-Conventional Food Plants, According to the AOAC Food Composition Triangle
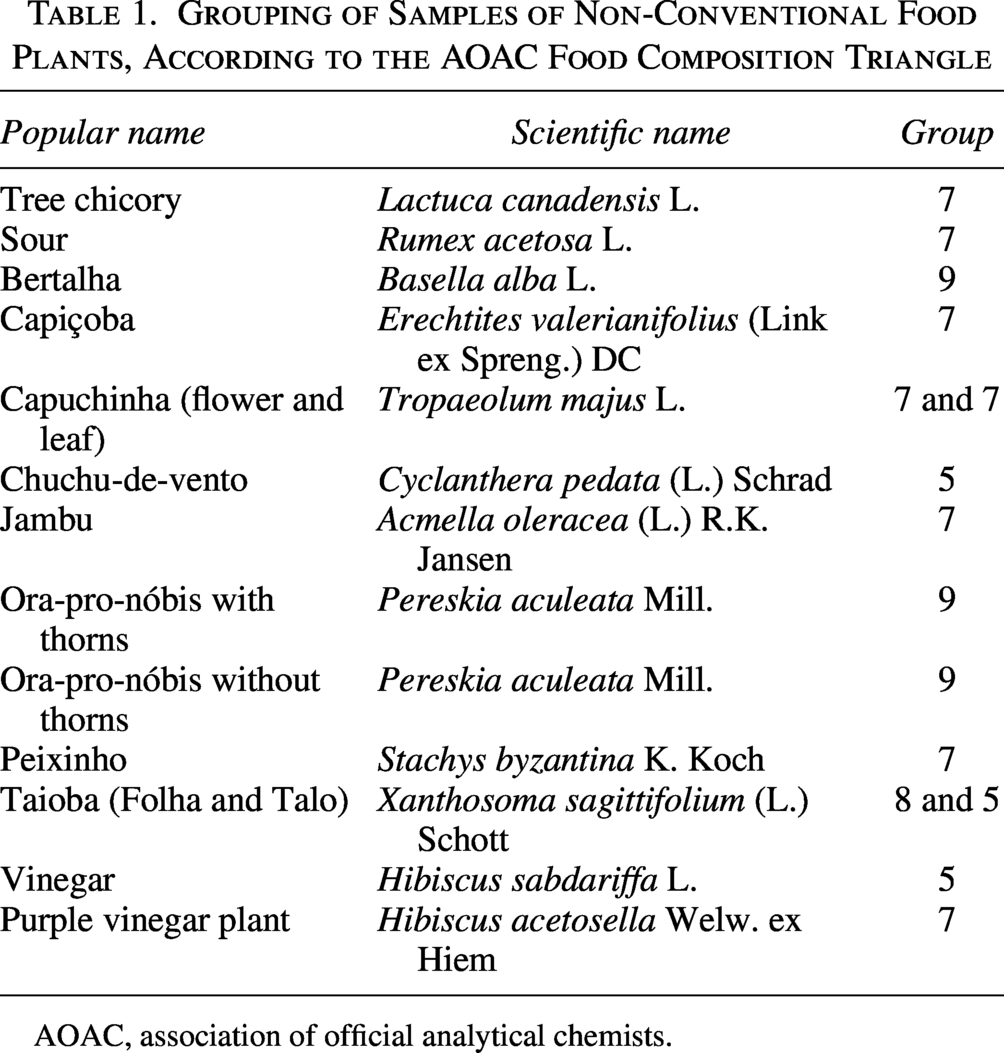
AOAC, association of official analytical chemists.
Hydrolysis of samples
The samples were weighed precisely on parchment paper (4 × 4 cm) and transferred directly to the hydrolysis tube. The weight of each sample varied as a function of its protein content; the higher the protein content, the lower the sample weight, and vice versa. In this manner, the weight of the samples was determined using Equations 1 and 2.
24


After weighing the samples, 9 mL of the 6 M HCl solution with ice-cold phenol was added to the hydrolysis tube, followed by subsequent vacuuming (10 min). Subsequently, the tubes were directed to the digester block (Quimis, model Q327-A242) for hydrolysis at 110 ± 5°C for 22 h. 25 After this period, the hydrolysate was quantitatively transferred to a 25 mL volumetric flask, which was swelled with ultrapure water. Subsequently, vigorous homogenization was carried out, and approximately 10 mL of the hydrolyzed samples were filtered on a 0.45 μM membrane and stored in a freezer at −30°C until the moment of derivatization.
Derivatization protocol for amino acid solutions and samples
To perform the derivatization, the samples and solutions of amino acid standards were diluted according to each evaluated parameter. After dilutions, 50 μL of the aliquot was added to a glass test tube and dried in a rotary vacuum evaporator (Jouan, model RC1010) for 25 min at 60°C. Then, 22 μL of resecting solution was added to the test tube, which was stirred for 30 sec in a tube shaker (IKA, model MS2), followed by subsequent drying (20 min at 60°C). After drying, 22 μL of the derivatizing solution containing PITC was added, stirred for 30 sec, and left to rest for 20 min. The sample was then dried under the same temperature conditions mentioned above. Subsequently, the dry material in the tube was diluted in 500 μL of diluent solution, leaving it on ultrasound for 10 min, for subsequent stirring (15 sec) and centrifugation (Thermo Fisher Scientific, model X4R Pro-MD) at 3739 g for 5 min. It is noteworthy that in this step, the sample and/or the standard solution are diluted 10 times. The diluted material was then transferred to the injection vial using a glass Pasteur pipette and sent for chromatographic analysis (Fig. 1).
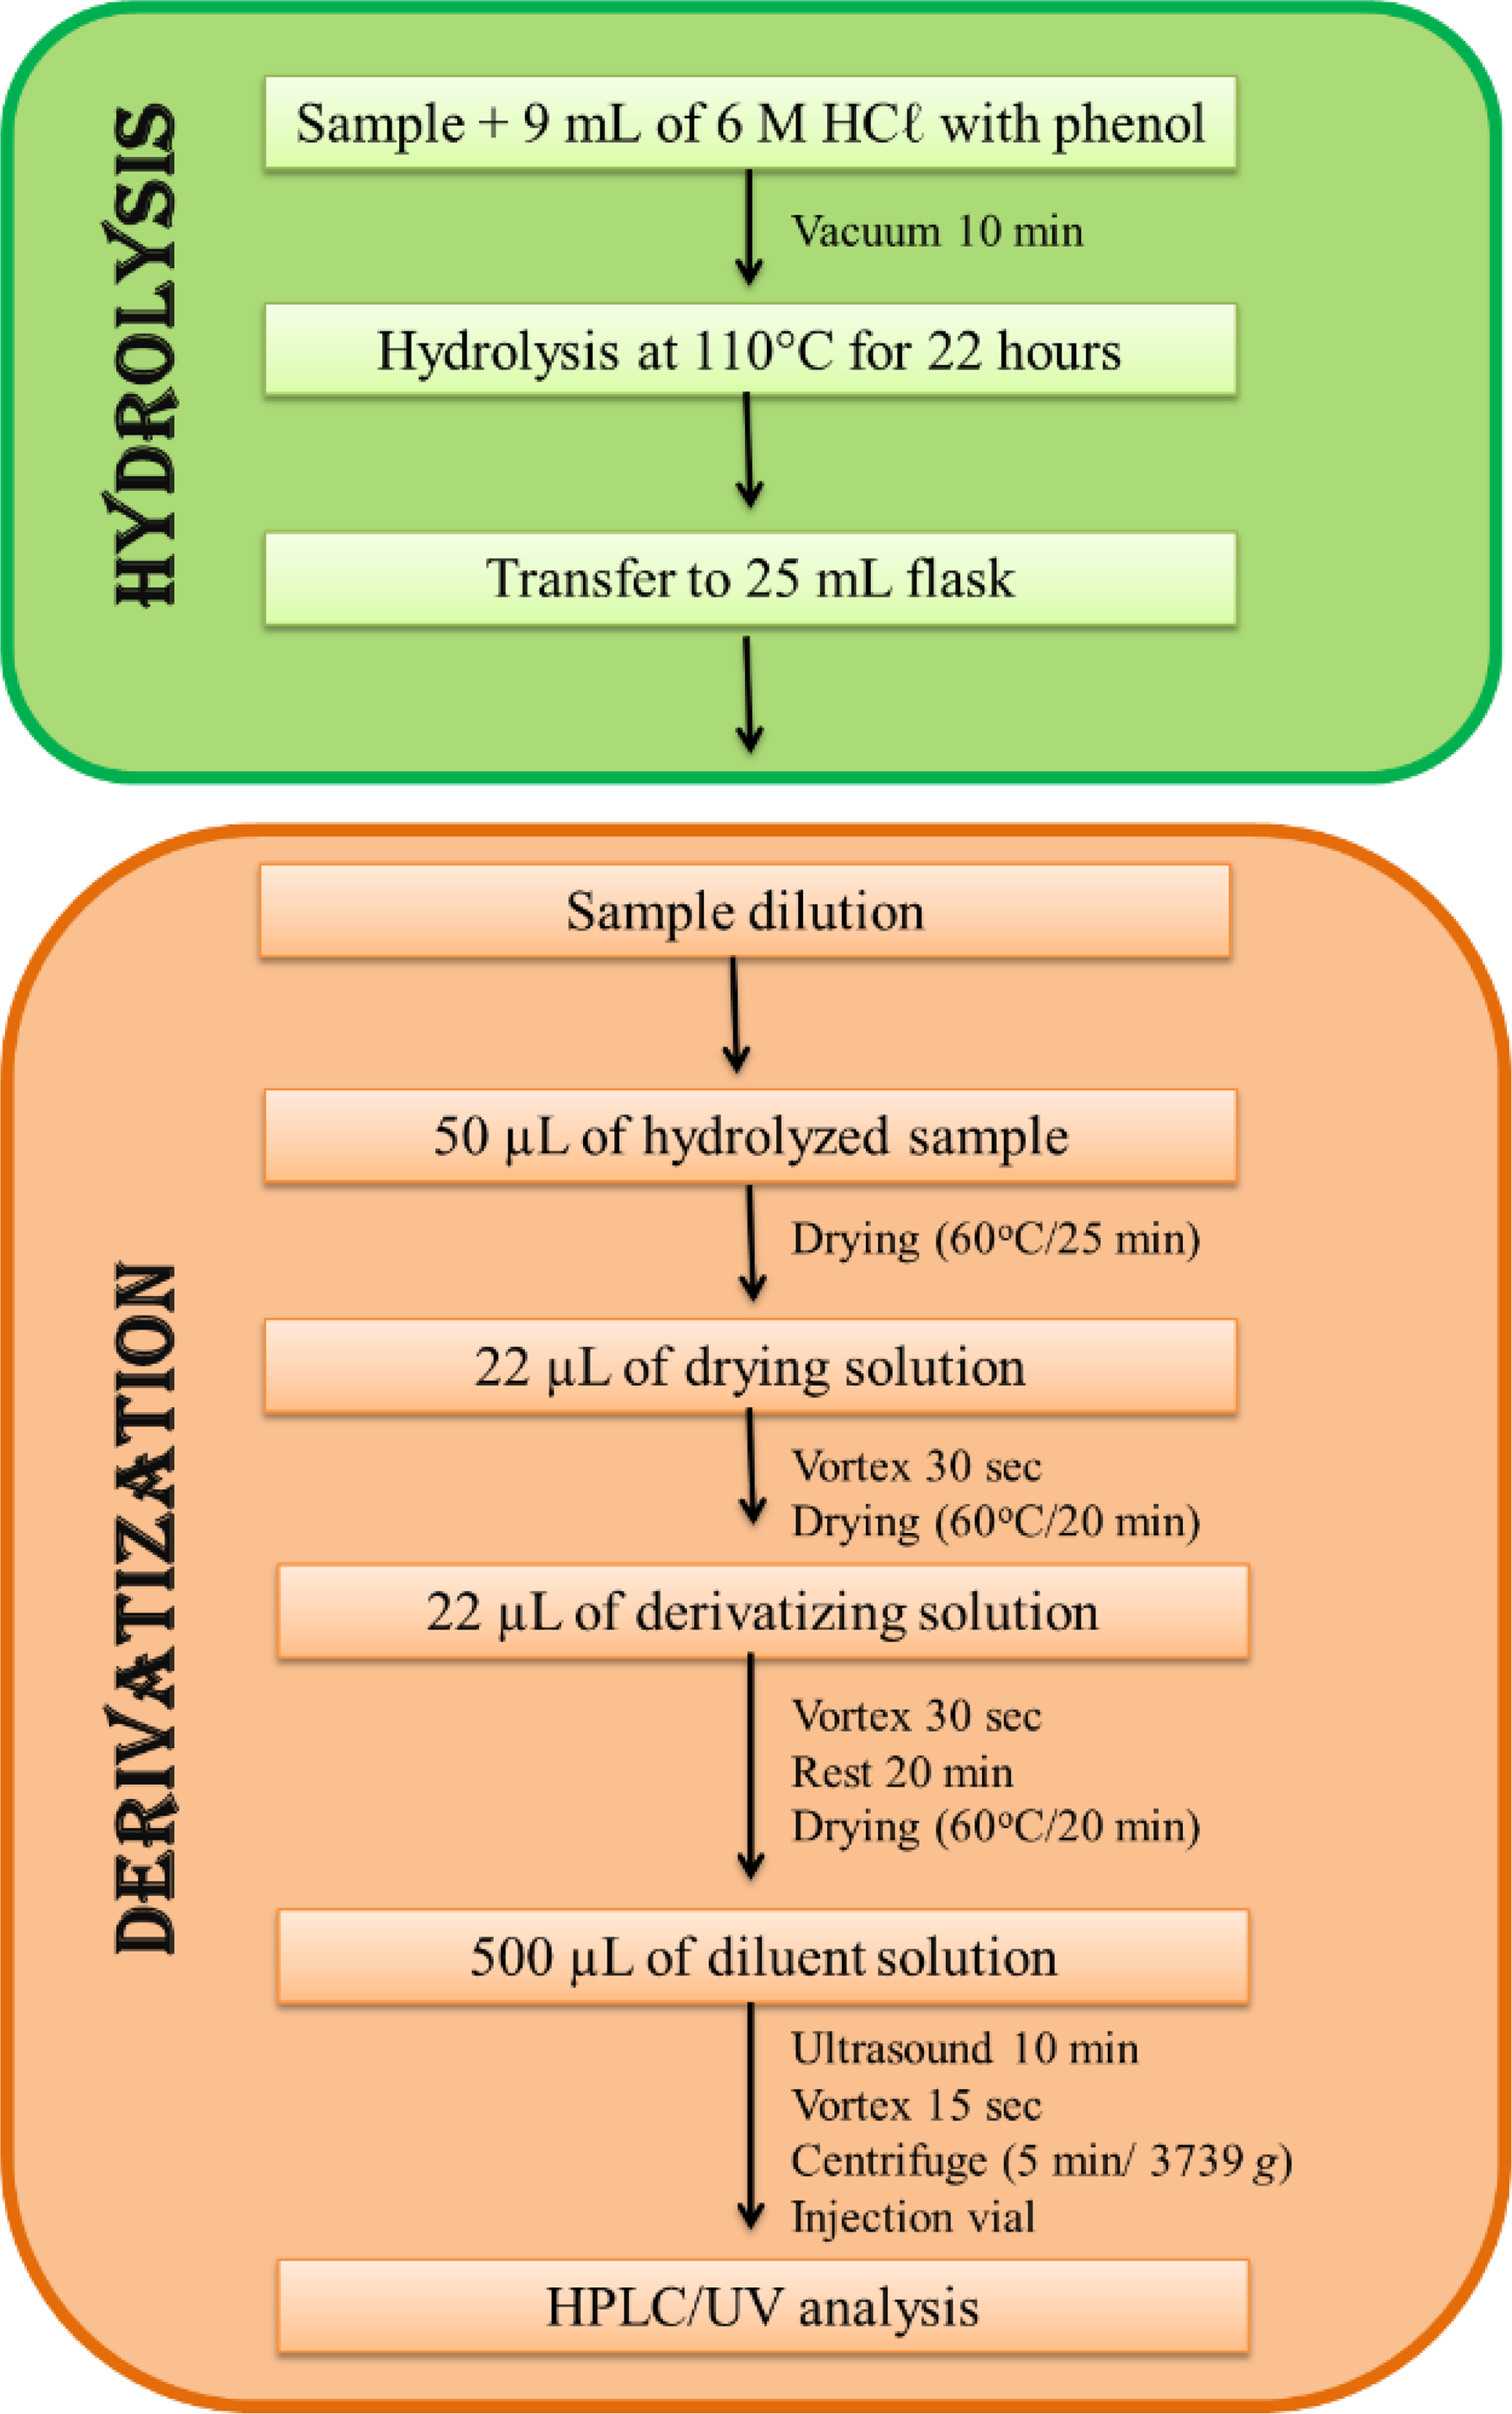
Hydrolysis and derivatization scheme of the samples.
Chromatographic conditions (HPLC/UV)
The chromatographic apparatus used consists of a Shimadzu CLAE system (Shimadzu Corporation, Tokyo, Japan), featuring two LC-10ADvp pumps, a DGU-midnight degasser, a SIL-20A injector, a CTO-20AC column furnace, an SPD-20A UV detector, and an SCL-10Avp controller system, which interfaces with the LC Solution software. The sample injection volume was 50 μL, and chromatographic separation was performed at 50°C in a C18 reversed-phase column, AccQ.Tag (3.9 × 150 mm; particle size: 4 μm) from Waters, with a C18 stationary phase Merck pre-column (4 × 4 mm; particle size: 5 μm).
The mobile phase consisted of sodium acetate buffer trihydrate (pH 6.60; eluent A) and acetonitrile (eluent B), with a flow rate of 1 mL/min and a total runtime of 40 min. A gradient with the following proportions (v/v) of solvent B was applied: 0.1–1 min at 0%; 1.2–5.2 min at 5%; 5.6–8 min at 10%; 14.3–15 min at 14%; 18–19 min at 35%; 28 min at 45%, and 35–40 min at 0% (break-even time). The detection of the derivatized samples was conducted at 254 nm in a UV detection system.
Validation parameters
The procedures for validating the method for quantification of the amino acid Phe in plant samples were carried out at the Microcomponent Analysis Laboratory of the Ezequiel Dias Foundation (FUNED). This laboratory is part of the Specialized Chemistry Service, which is affiliated with the Sanitary and Environmental Surveillance Division and located within the Octávio Magalhães Institute. This institute is the Central Laboratory of Public Health of Minas Gerais, responsible for carrying out activities related to Sanitary and Epidemiological Surveillance in the State.
To perform the validation tests, two samples from group seven were selected, as shown in Table 1. Thus, the validation was carried out with the samples of chicory and nasturtium leaves, which have the lowest and highest protein content, respectively, within group seven.
The analytical method was validated in terms of selectivity, linearity, matrix effect, recovery, repeatability, intermediate precision (RSDR), limit of detection (LOD), and limit of quantification (LOQ) according to the guidelines on validation of analytical methods of the National Institute of Metrology, Quality and Technology. 26 All statistical analyses were performed using Microsoft Excel 2007 software.
Selectivity
First, 300 μL of individual amino acid stock solution (item 2.4.13) was piped into a 5 mL volumetric flask, completing the volume with 0.1 M HCl. Subsequently, the solutions of the 17 amino acid patterns (Asp, Glu, Ala, Arg, Cys, Phe, Gly, His, Ile, Leu, Lys, Met, Pro, Ser, Tyr, Thr, Val) were individually analyzed, together with the reagent blank (derivatized 0.1 M HCl). The selectivity of Phe was evaluated by comparing its retention time with that of the other 16 amino acids. The chromatogram of the reagent white was also evaluated for the presence of interfering peaks in the region where Phe eluted. The entire procedure was performed in triplicate.
Linearity
From the intermediate solution of the Amino Acid Standard H (item 2.4.13), a calibration curve was developed, with equally spaced points at 10 concentrations (1–10 nmol/mL). The curve was prepared in independent triplicates and analyzed randomly. The randomization of the points was performed in Excel 2007 using the “random” function and sorting from lowest to highest. The reagent blank was prepared for internal quality control.
To evaluate the results, the corresponding areas of each point were assessed as proposed by Souza and Junqueira 27 and Souza. 28 The regression parameters were estimated using the ordinary least squares method (OLS), and subsequently, regression residual plots were constructed, with outliers identified by the Jackknife standardized residual test. To evaluate the assumptions related to the regression analysis, the normality of the data was assessed using the Ryan–Joiner test, homoscedasticity was evaluated with the modified Levene test, the independence of the regression residuals was examined with the Durbin–Watson test, and the significance of the regression and adequacy of the fit to the linear model were assessed using analysis of variance (ANOVA). To analyze the fit to the linear model, F-tests were applied by verifying the significance of the regression and the deviation from linearity.
Matrix effect
To verify the matrix effect, the samples of nasturtium and nasturtium leaf, as well as the reagent blank, were first hydrolyzed according to the procedure described in topic 2.5. Subsequently, the hydrolyzed extracts of the samples were diluted 10 times. For this, 1000 μL of extract was pipetted into their respective 10 mL volumetric flasks, and the volume was completed with 0.1 M HCl solution. Then, the matrix curve (10 points) was prepared by adding the intermediate solution of Amino Acid Standard H to the diluted hydrolyzed extract of the respective samples. The curve was prepared in independent triplicates and analyzed randomly.
To evaluate the results, the corresponding areas of each point were analyzed in the same manner as described for linearity.28,29 To evaluate the interference of the matrix, the slope of the solvent-prepared curve (linearity) and the matrix curve were compared by the t-test.28–30
Retrieval, repeatability, and intermediate accuracy
To evaluate the parameters of recovery, repeatability, and accuracy, three solutions were prepared and injected from the intermediate standard solution of the Amino Acid Standard H at the following concentrations: Low point (3 nmol/mL), midpoint (6 nmol/mL), and high point (9 nmol/mL). For each concentration point, eight independent replicates were made. The reagent blank was also prepared. To simulate intermediate-precision conditions, a second analyst repeated the entire procedure.28,31
Regarding the recovery results, these were analyzed for the presence of outliers using the Grubbs test. For each level of recovery studied, Grubbs’ statistics were calculated simultaneously for one outlier (G1), two side outliers (G2), and two polar outliers (G3).27–29,32
When identifying at least one outlier using the statistics cited, the Grubbs test was applied again until no new outliers were identified or until the maximum level of exclusion was reached, that is, 22% of the original data. 33
To evaluate the inaccuracy, the mean recovery presented by the replicates of each point studied (low, medium, and high) after diagnosis of outliers was used. The acceptance criterion used was between 80% and 110%. 26
To determine the accuracy under conditions of repeatability and RSDR, the data underwent tests of the assumptions for ANOVA, evaluating the normality of the residuals using the Ryan–Joiner test and the homoscedasticity of the residuals using the modified Levene test. To later evaluate the estimate of the relative standard deviation.28,29,34
LOD and LOQ
To determine the LOD and LOQ of the proposed method, the equipment’s limits were first estimated by applying Equations 3 and 4 to the analytical curve. Subsequently, using the sample preparation procedure, considering the injected sample mass (Equations 5 and 6).


Quantification of Phe in the samples
The quantification of the Phe content in the UFP samples was performed after the validation procedure was completed. The samples were weighed in triplicate and then hydrolyzed with a solution of 6 M HCl and phenol at 110°C for 22 h. Before starting the derivatization process, the hydrolyzed samples were diluted four times. For this, 250 μL of the hydrolyzed sample and 750 μL of 0.1 M HCl were pipetted in a microtube. Subsequently, the samples were homogenized, derivatized (see item 2.6), and sent for chromatographic analysis. As a form of control, three points of the calibration curve were prepared at the following concentrations: 1 nmol/mL, 5 nmol/mL, and 10 nmol/mL, and analyzed.
The data were plotted in Excel 2007, and the Phe content was determined using the equation of the line obtained from the calibration curve. The results were expressed as mg/100 g on a dry and wet basis and were presented as mean ± standard deviation. The results were analyzed using ANOVA and Tukey’s test at a 5% significance level, as determined by the statistical software Minitab 21.
RESULTS AND DISCUSSION
Method validation
Selectivity
Satisfactory chromatographic resolution of the 17 amino acids was achieved using the elution gradient proposed in this study. The selectivity of the method was ensured by comparing the retention time of Phe with that of other amino acids, as evaluated in the presence of possible interferences from the reagent blank (Fig. 2). The retention time of Phe was 20.368 min, and no other amino acid or peak interferent was observed. In this way, the proposed method enables the selective identification of the amino acid Phe.
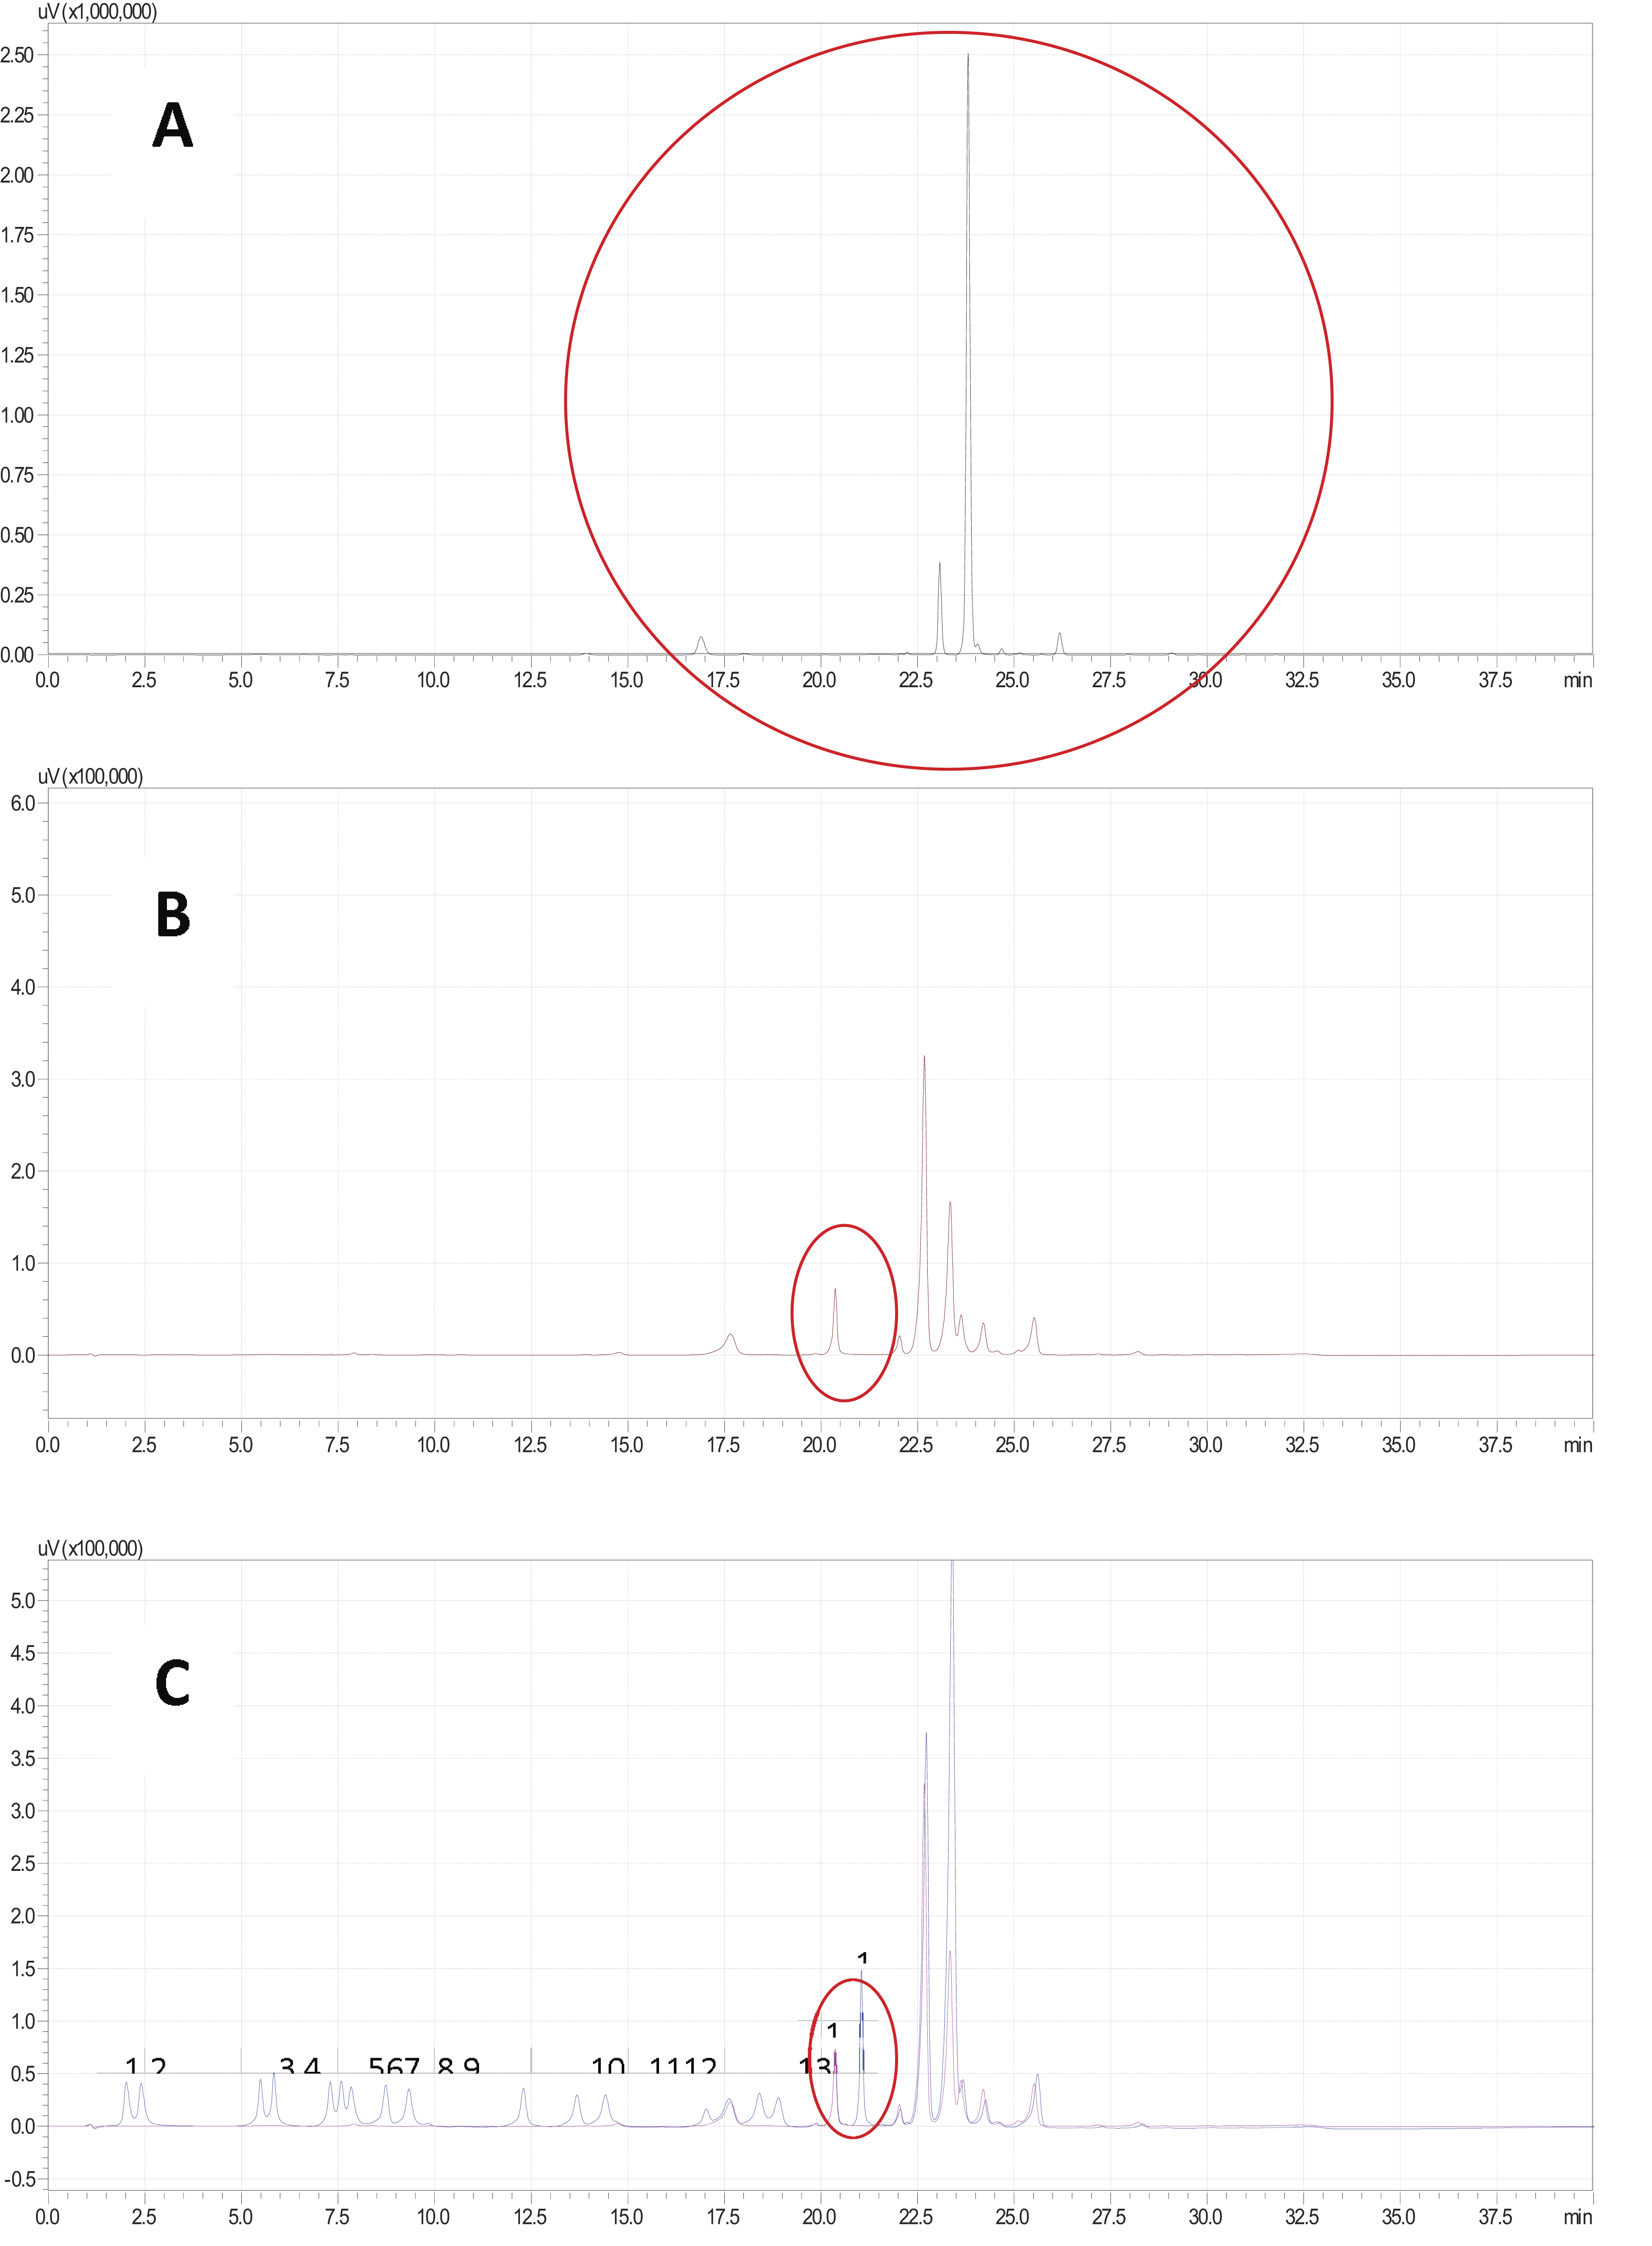
Amino acid separation chromatograms using HPLC/UV.
Linearity
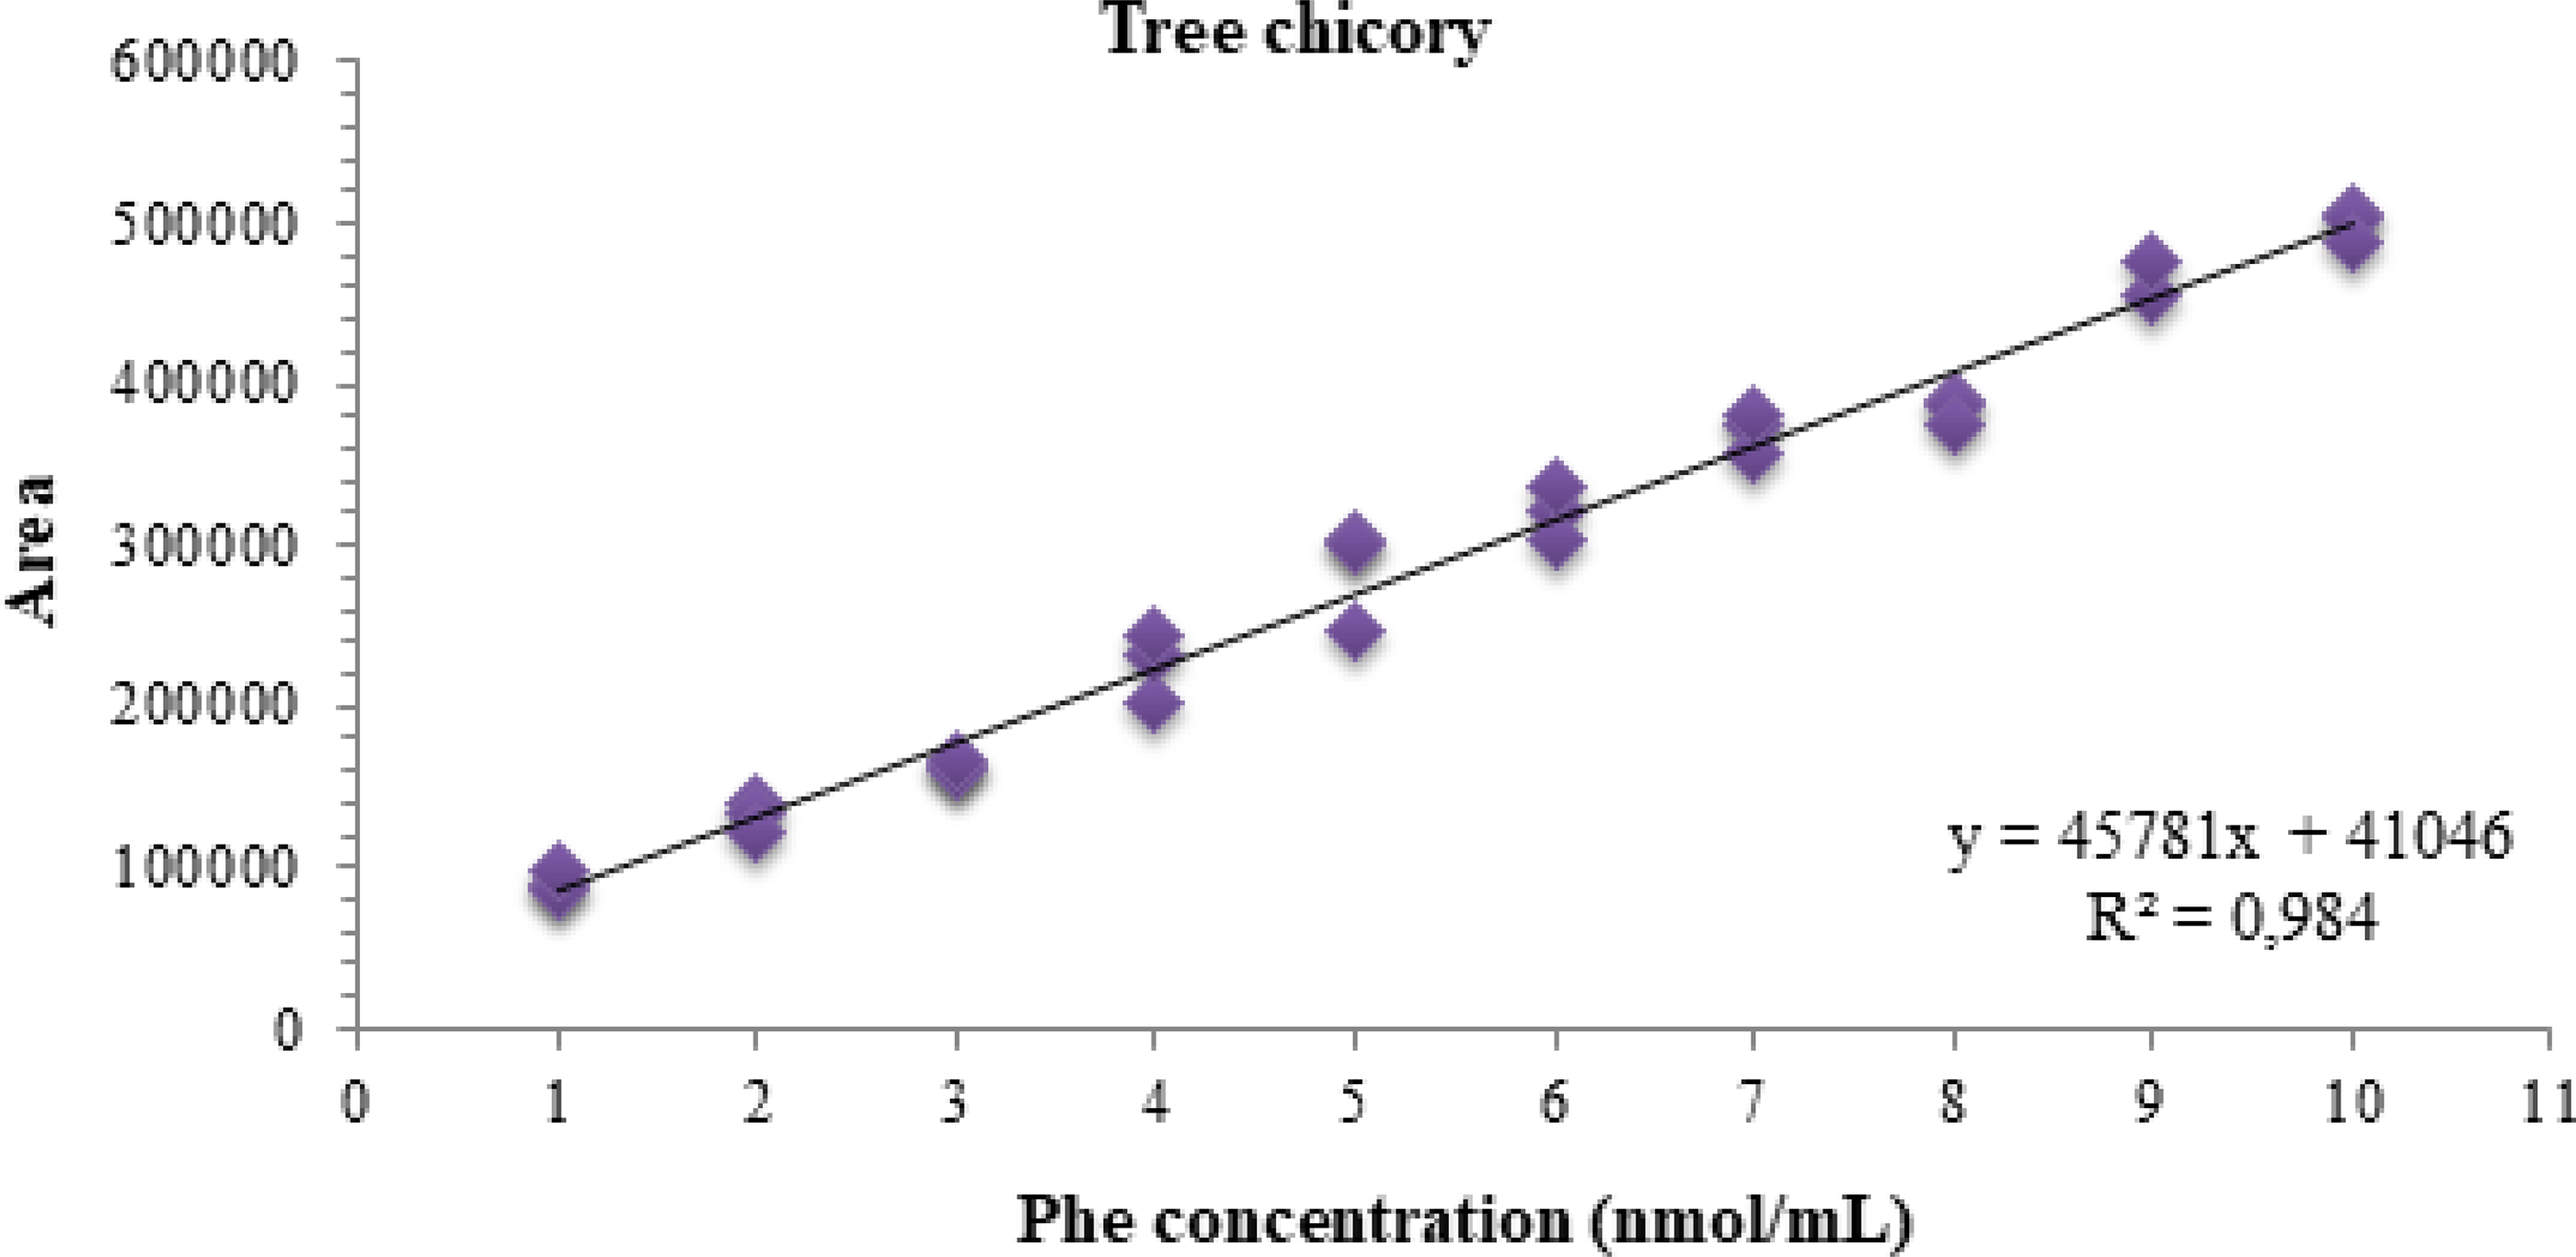
In this study, linearity was evaluated using the calibration curve prepared with solutions of the Amino Acid Standard H. The calibration curve was constructed using the ratio between the peak areas and the analyte concentration. Linearity was observed in the range of 1–10 nmol/mL.
The regression model was constructed using the method of OLS, and the assumptions were evaluated, indicating the presence of two outliers, confirmed by the Jackknife test, which indicated one at the level of 9 nmol/mL and the other at 10 nmol/mL (Jei > Jcrítico).
After treating the outliers, the normality of the residuals was evaluated using the Ryan–Joiner test. As the correlation coefficient obtained (0.9838) was higher than the critical R coefficient (0.9690), it is concluded that the residuals follow a normal distribution (P > .10).
The calculated Durbin–Watson statistic was 2.217 (P > .10), indicating that the model residuals are not autocorrelated. In addition, the independence of the residues was observed. The modified Levene test showed that the regression residuals are homoscedastic, with an estimated value of 0.190 (P > .05).
After verifying the ordinary least squares method (OLSM) premises, it was found that the regression was significant (P < .001), with an F of 1660.63 higher than the Fcritical (4.33 × 1025) while the linearity deviation was not significant (F = 0.945; Fcritical = 5.05 × 101; P > .05), indicating linearity in the studied range from 1 to 10 nmol/mL. Figure 3 shows the calibration curve graph, along with its corresponding equation and coefficient of determination.

Graph of the phenylalanine calibration curve in the range of 1–10 nmol/mL. Phe = phenylalanine; R2 = coefficient of determination; y = area; x = concentration.
Matrix effect
To evaluate the presence of matrix effect in the linear range (1–10 nmol/mL), the matrix curves (chicory and nasturtium leaf) went through all the statistical tests performed for the calibration curve. Thus, by the Jackknife standardized residue test, an outlier was diagnosed at the 9 nmol/mL level of the chicory curve. In the matrix curve of nasturtium leaves, three outliers were identified, at levels 8, 9, and 10 nmol/mL, respectively. After treatment of the outliers, all assumptions related to the ODM were confirmed for the two curves (Table 2). The matrix curves, along with their respective equations of the line and coefficient of determination obtained from the matrix effect analysis, are presented in Figures 4 and 5.
Graph of the calibration curve of phenylalanine in a matrix (chicory) in the range of 1–10 nmol/mL.
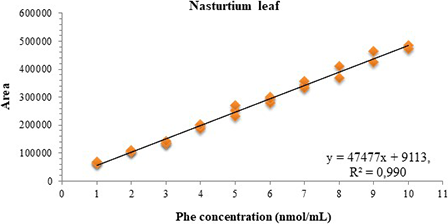
Graph of the calibration curve of phenylalanine in matrix (nasturtium leaf) in the range of 1–10 nmol/mL.
Evaluation of the Linearity of the Matrix Curves in the Range from 1 to 10 Nmol/mL
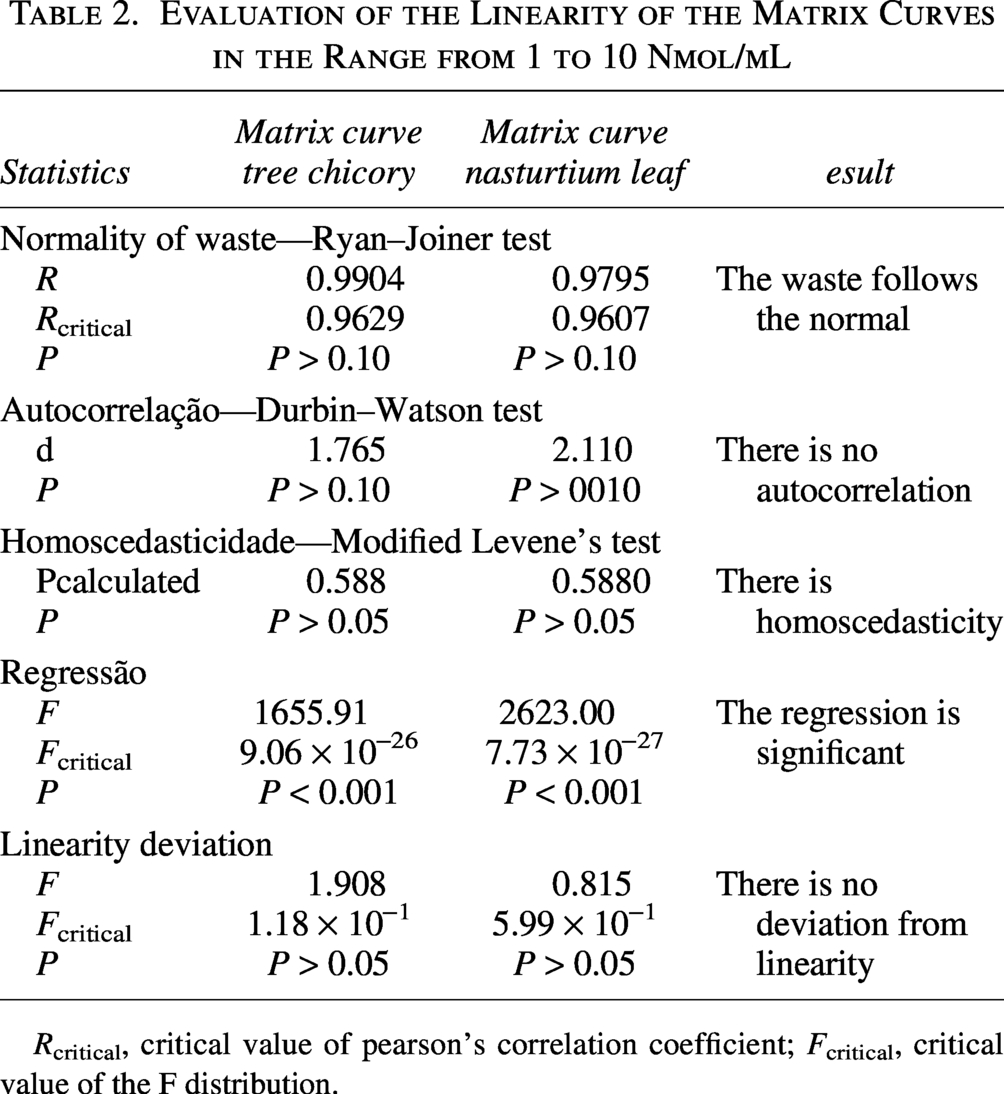
Rcritical, critical value of pearson’s correlation coefficient; Fcritical, critical value of the F distribution.
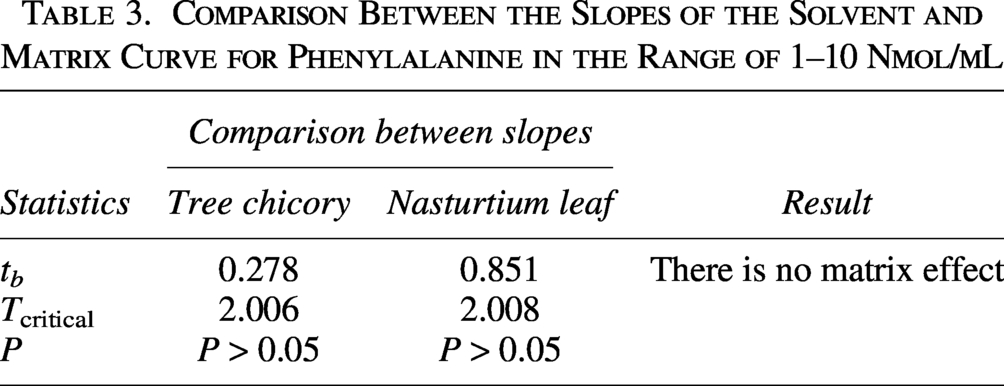
The results presented in Table 2 allowed the comparison of the slopes of the analytical curves (solvent and matrix) by the t-test to evaluate the matrix effect in the two samples.
The F test indicated the homoscedasticity of the variances of the residues of the solvent and matrix curves, with Fcalculated and Fcritical values of 1.086 and 1.921, respectively, for the chicory matrix curve and 1.555 (Fcalculated) and 1.947 (Fcritical) for the nasturtium leaf matrix curve (P = .001).
The t-test with combined variances to evaluate matrix effects showed no significant difference (P > .05) when the slopes of the solvent and matrix curves were compared, both for the chicory sample and for the nasturtium leaf, indicating that there is no matrix effect (Table 3). 26 This can also be observed graphically by the approximate parallelism of the two curves (solvent and matrix) presented in Figures 6 and 7.
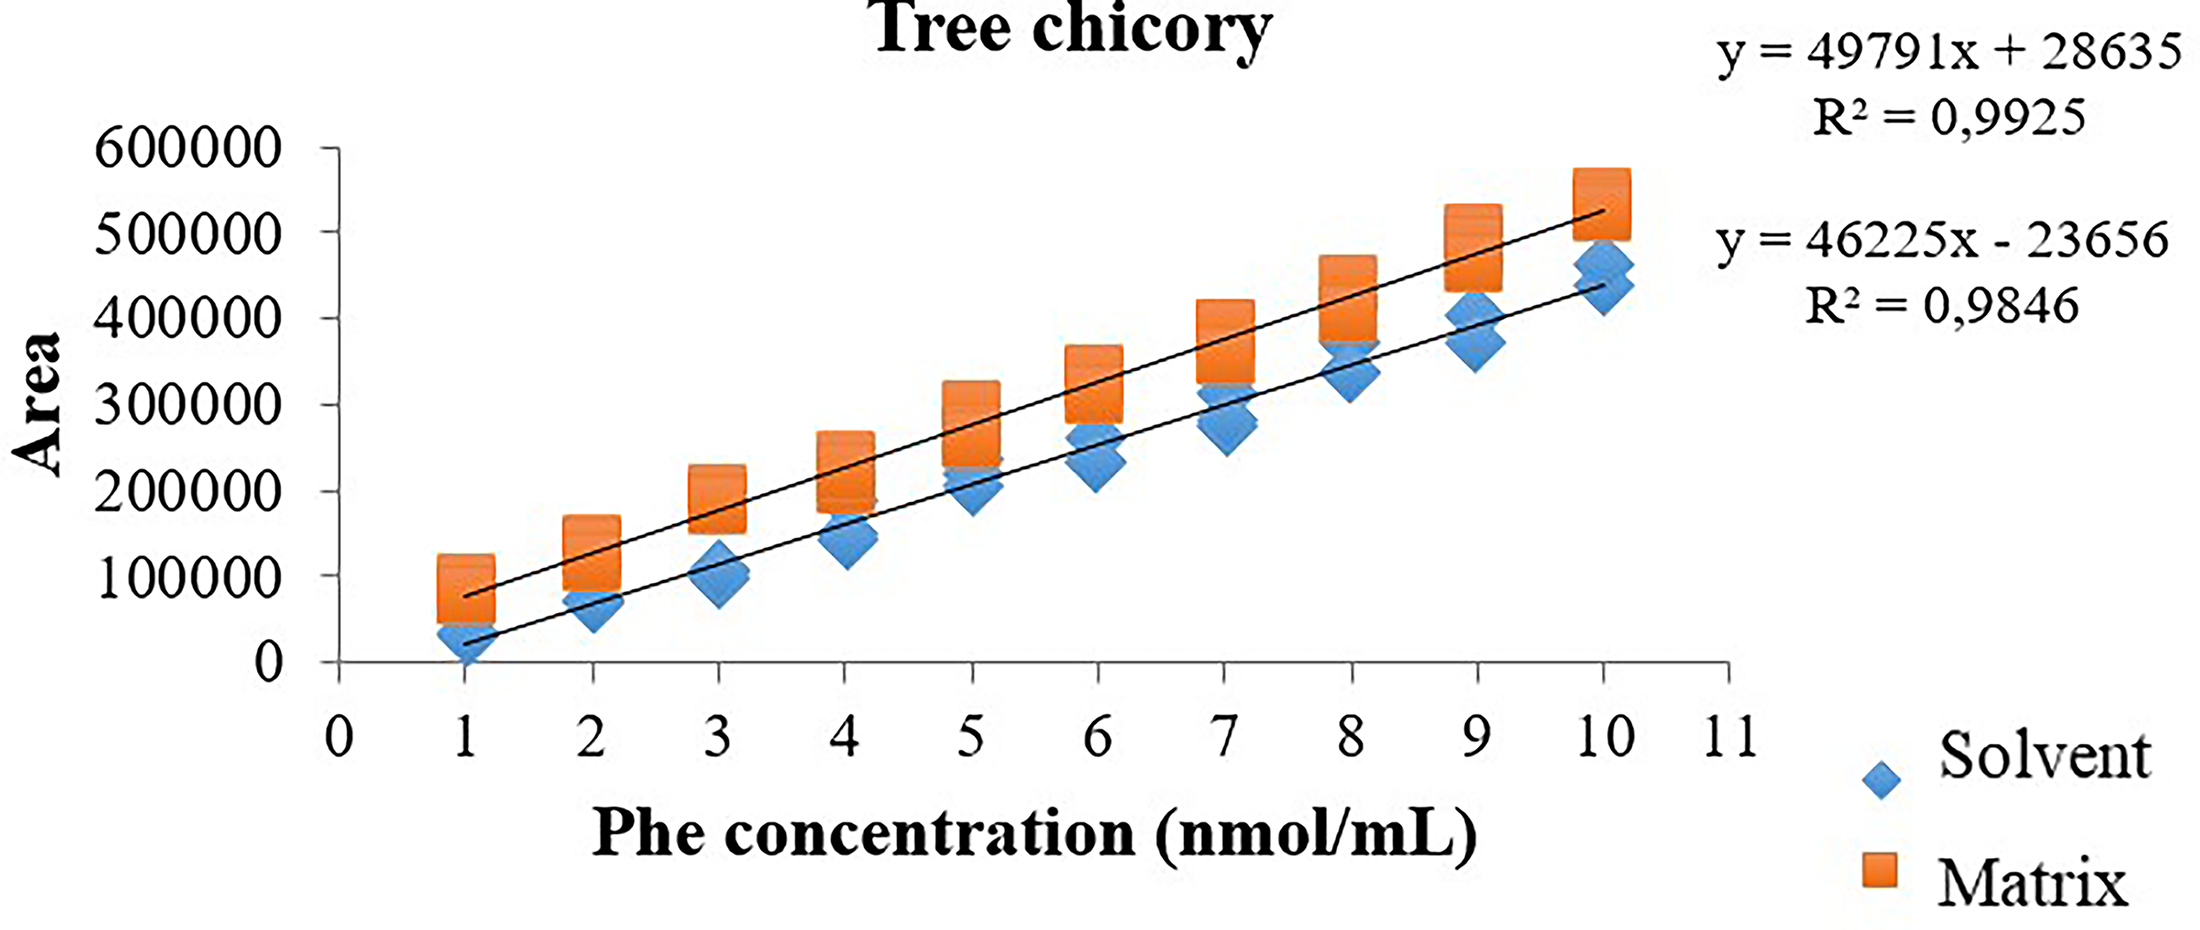
Comparison graph between the slopes of the solvent and matrix curve (chicory) for phenylalanine in the range of 1–10 nmol/mL.
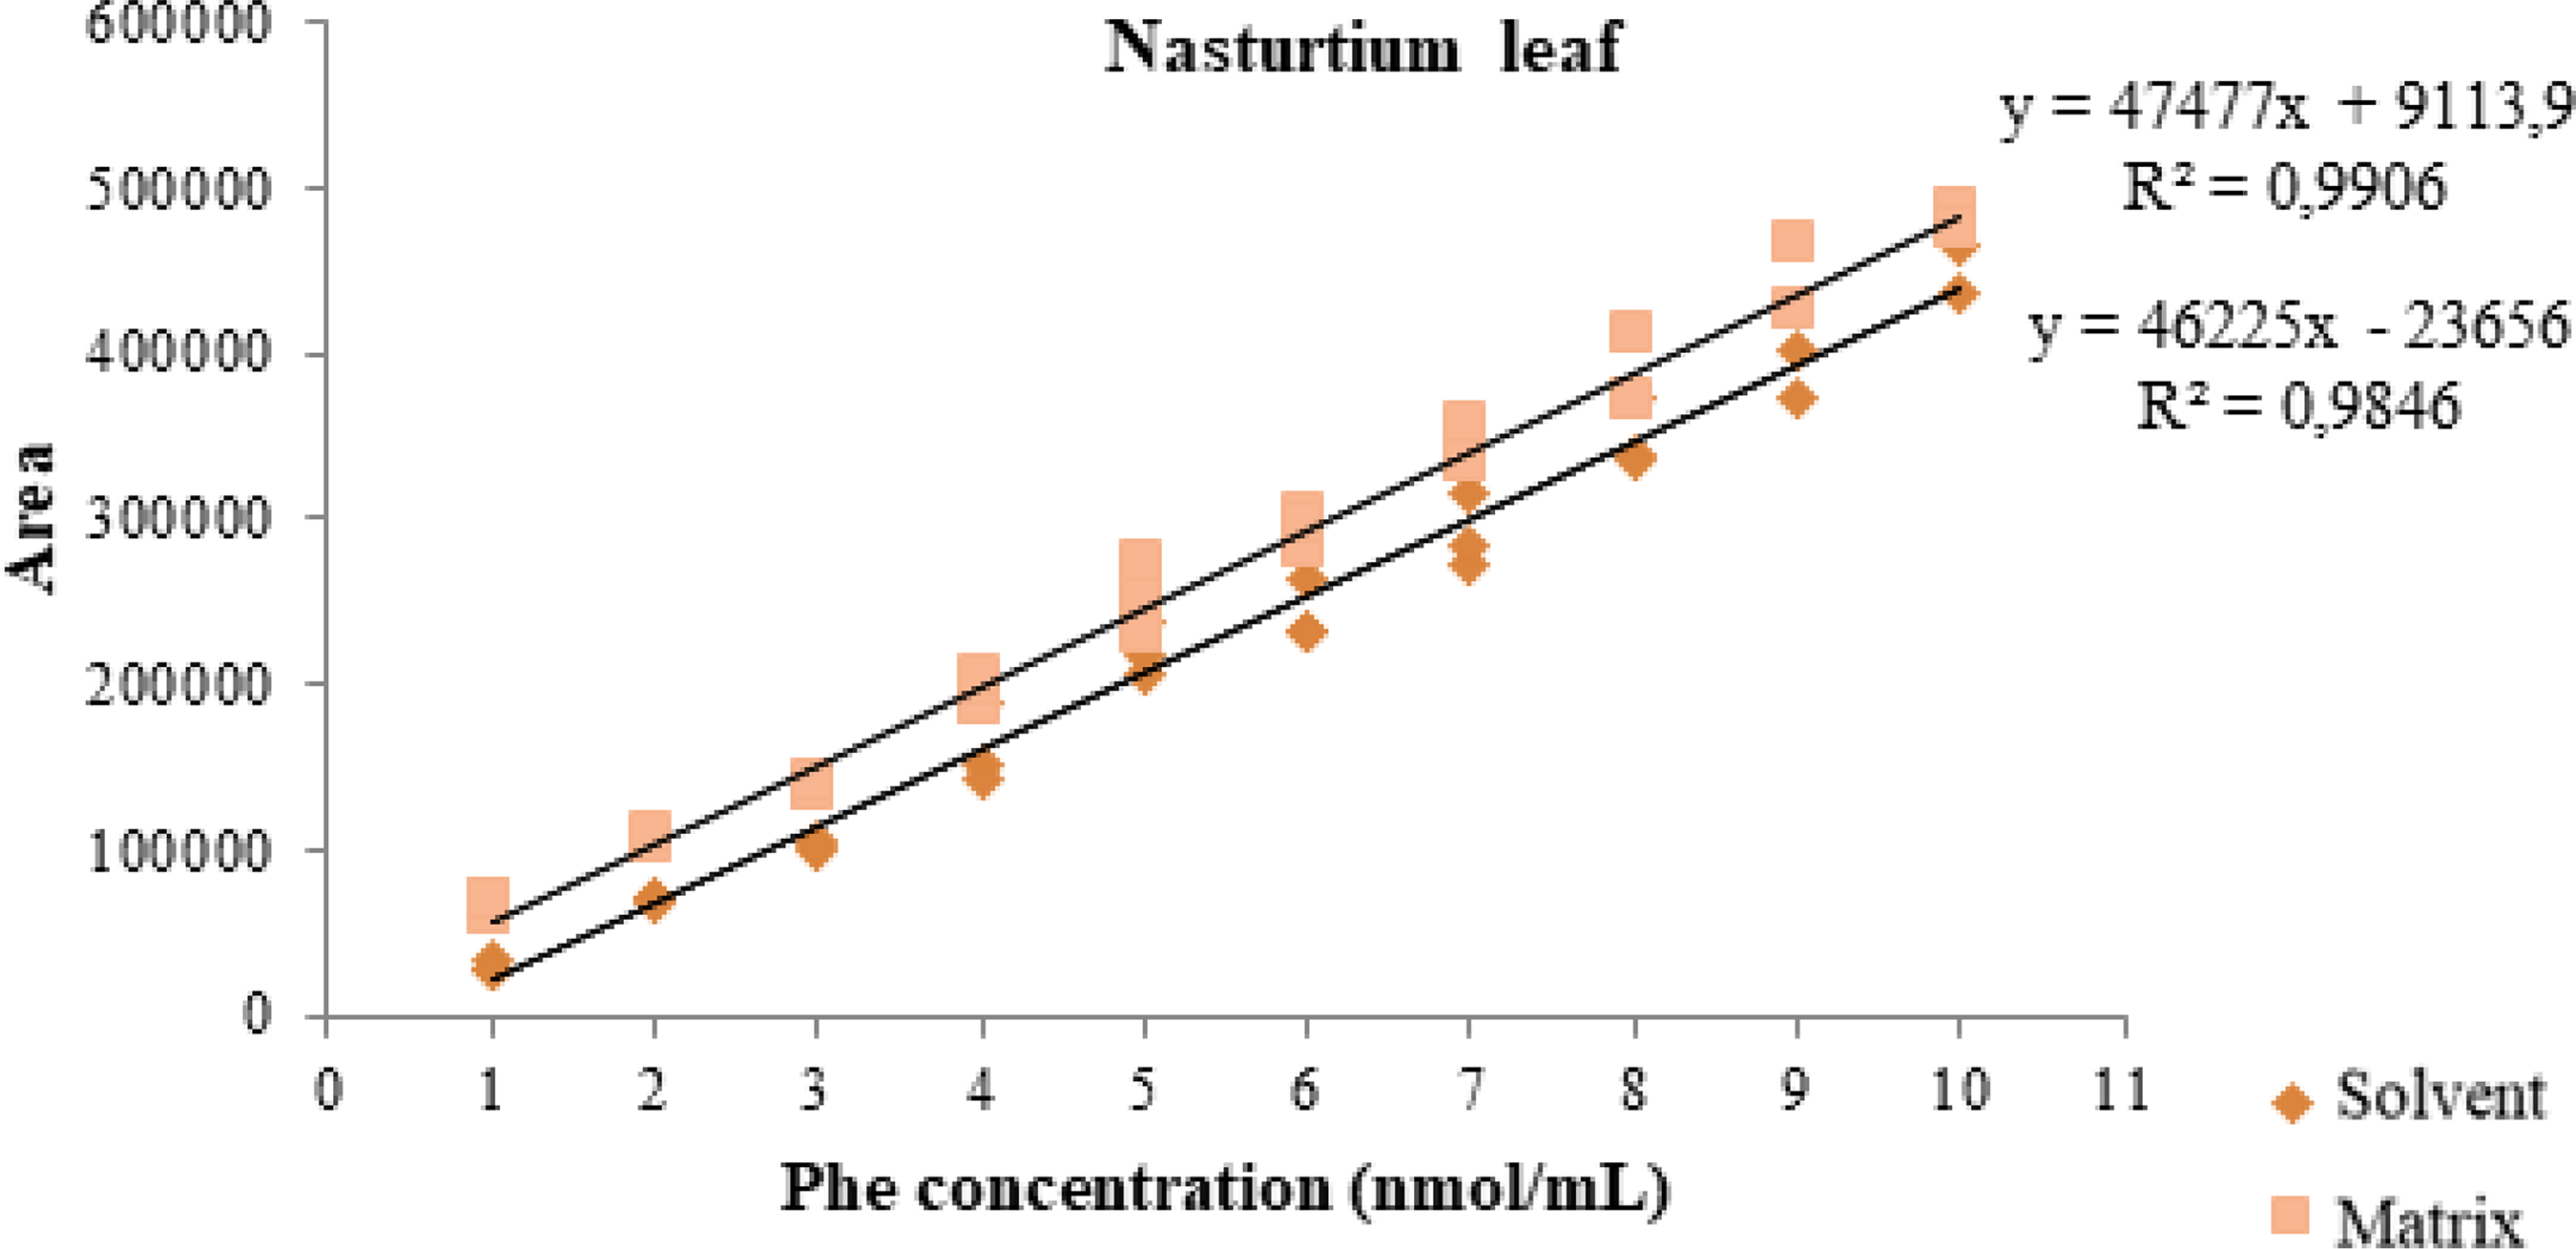
Comparison graph between the slopes of the solvent and matrix curve (nasturtium leaf) for phenylalanine in the range of 1–10 nmol/mL.
Comparison Between the Slopes of the Solvent and Matrix Curve for Phenylalanine in the Range of 1–10 Nmol/mL
As no significant matrix effect was observed for Phe in either of the two matrices tested, it can be concluded that the sample preparation procedure had a positive impact on eliminating interferences from the matrix, indicating that the sample preparation method can be applied to several plant matrices. As also observed by Ford et al., 35 who used the same sample preparation method to analyze 73 plant foods, including leafy greens and fruits.
Given the above and the lack of indication of the matrix effect, the Phe content of the UFP samples belonging to the other groups, according to the Association of Official Analytical Chemists (AOAC) grouping 23 (Table 1), was also determined.
Retrieval, repeatability, and intermediate accuracy
The Grubbs test did not indicate the presence of outliers (P > .05) among the recovery results obtained in the 16 replicates analyzed at the three concentration levels evaluated for chicory. For the nasturtium leaf, the Grubb test identified one outlier at the 3 nmol/mL level and one at the 9 nmol/mL level (P > .05). The values of G1, G2, and G3 for each level analyzed are presented in Table 4.
G1, G2, and G3 Values for the Levels of 3, 6, and 9 Nmol/mL of Phenylalanine, Studied in Recovery and Precision
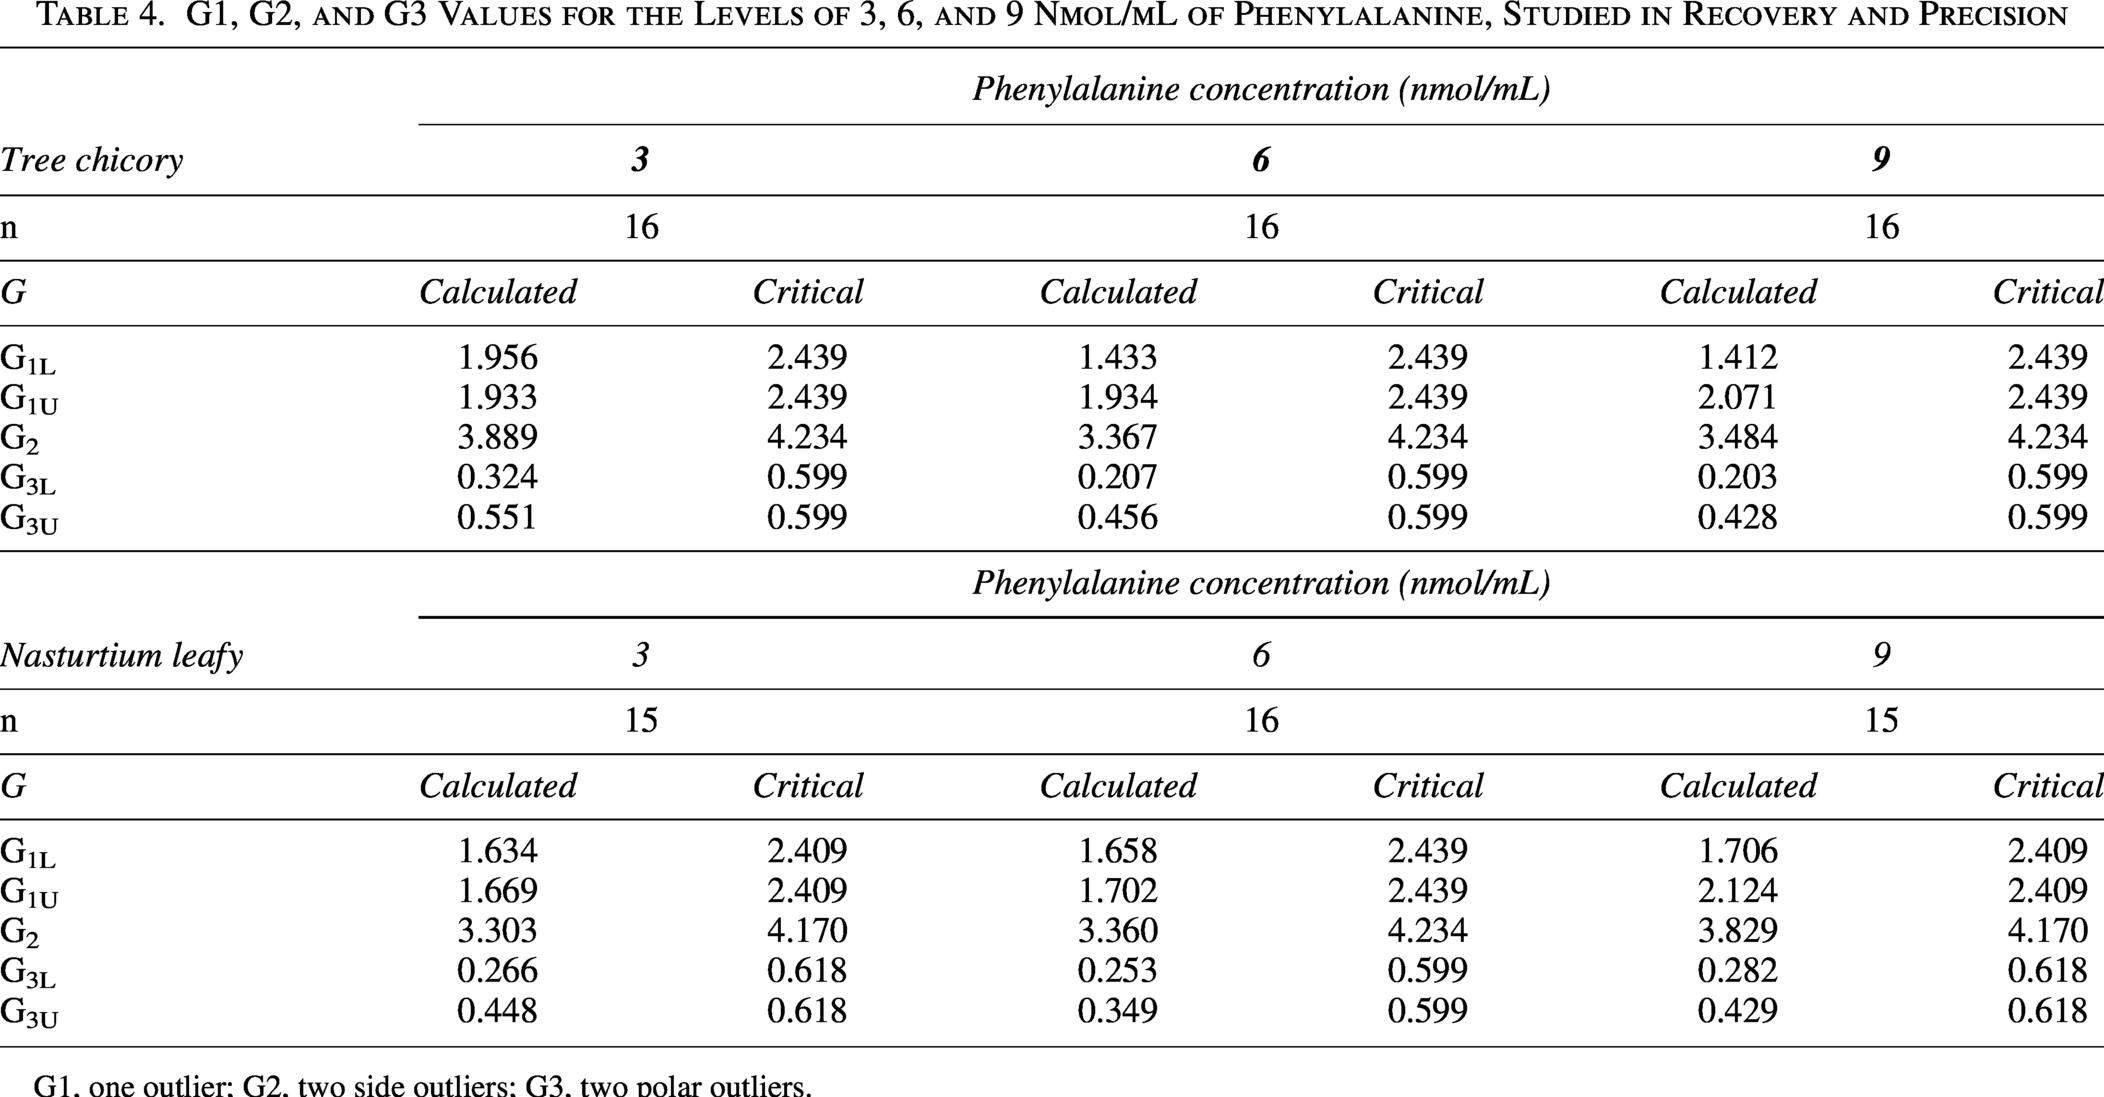
G1, one outlier; G2, two side outliers; G3, two polar outliers.
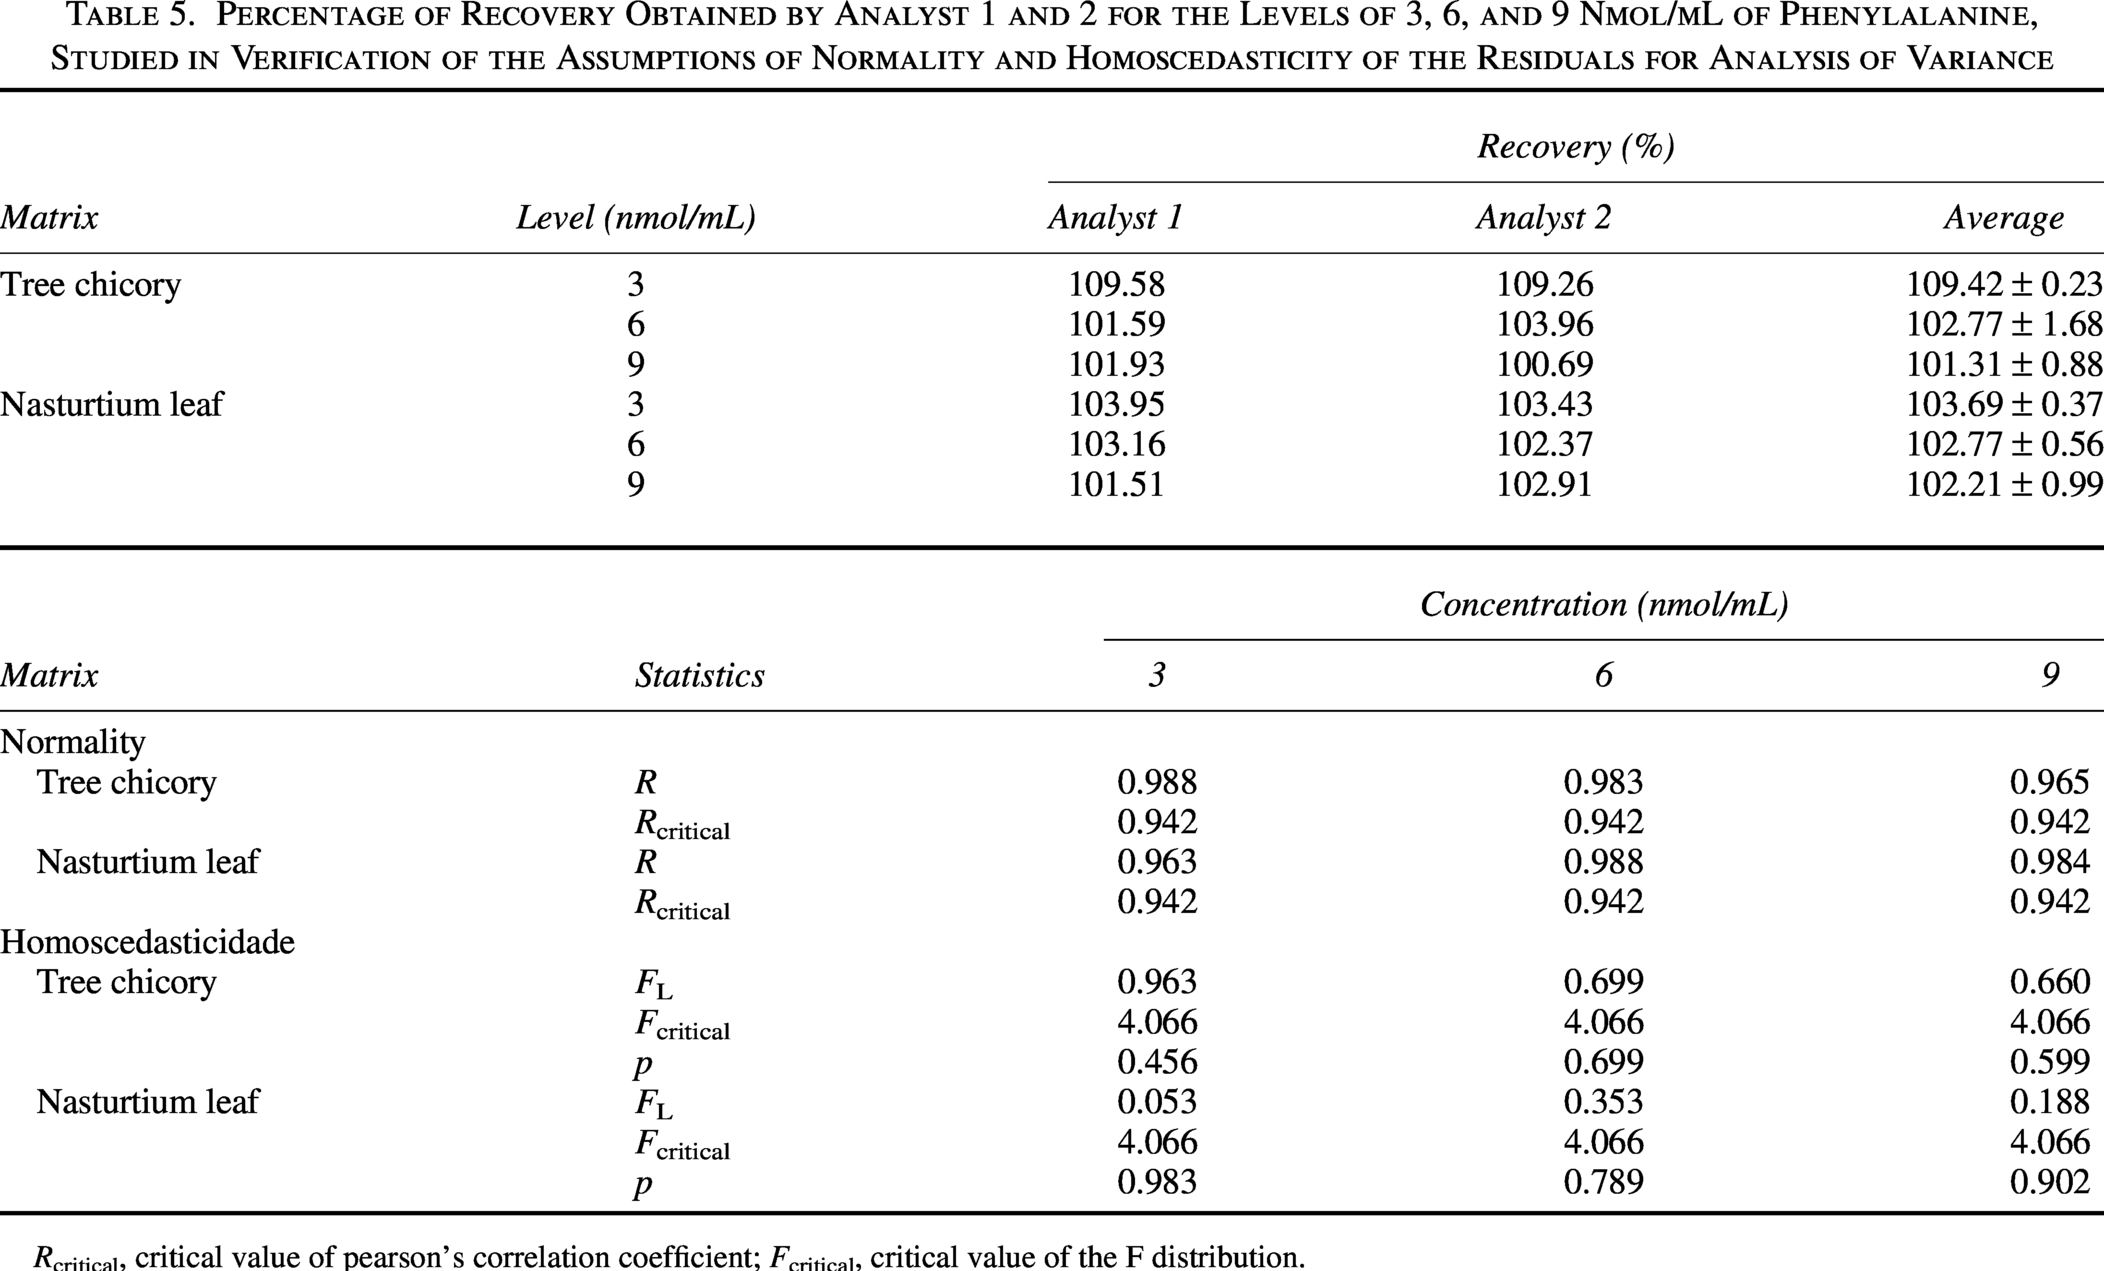
By observing the mean recovery presented in Table 5 for the three levels of study (low, medium, and high), it is evident that the method is not inaccurate at the levels studied, as all levels meet the criterion of 80–110% recovery. 26
Percentage of Recovery Obtained by Analyst 1 and 2 for the Levels of 3, 6, and 9 Nmol/mL of Phenylalanine, Studied in Verification of the Assumptions of Normality and Homoscedasticity of the Residuals for Analysis of Variance
Rcritical, critical value of pearson’s correlation coefficient; Fcritical, critical value of the F distribution.
The normality and homoscedasticity of the recovery residues were evaluated, respectively, by the Ryan–Joiner and modified Levene tests. The residuals showed a normal distribution (P > .10) at all levels of the study, being homoscedastic (P > .05), which allowed for the estimation of the relative standard deviations of repetitiveness (RSDr) and RSDR by analysis of variance (Table 5).
The RSDr values estimated by analysis of variance were 22.22%, 11.11%, and 7.41% for the levels of 3, 6, and 9 nmol/mL, respectively. Moreover, the RSDR was 33.33%, 16.67%, and 11.11%, respectively, signaling that the method is accurate at all levels studied.
LOD and LOQ
The estimated detection limit was 0.0011 mg/100 g, while the quantification limit was 0.0035 mg/100 g.
Phe content in the samples
Knowing the Phe content of foods is essential for managing the diet of patients with PKU. Thus, the Phe content of the 15 UFP samples was determined by the chromatographic method validated in this study and is presented in Table 6. These results could lead to the inclusion of these vegetables in the phenylketonuric diet, improving dietary diversity, nutrient intake, and satiety in patients.
Phenylalanine Content in Non-Conventional Food Plants
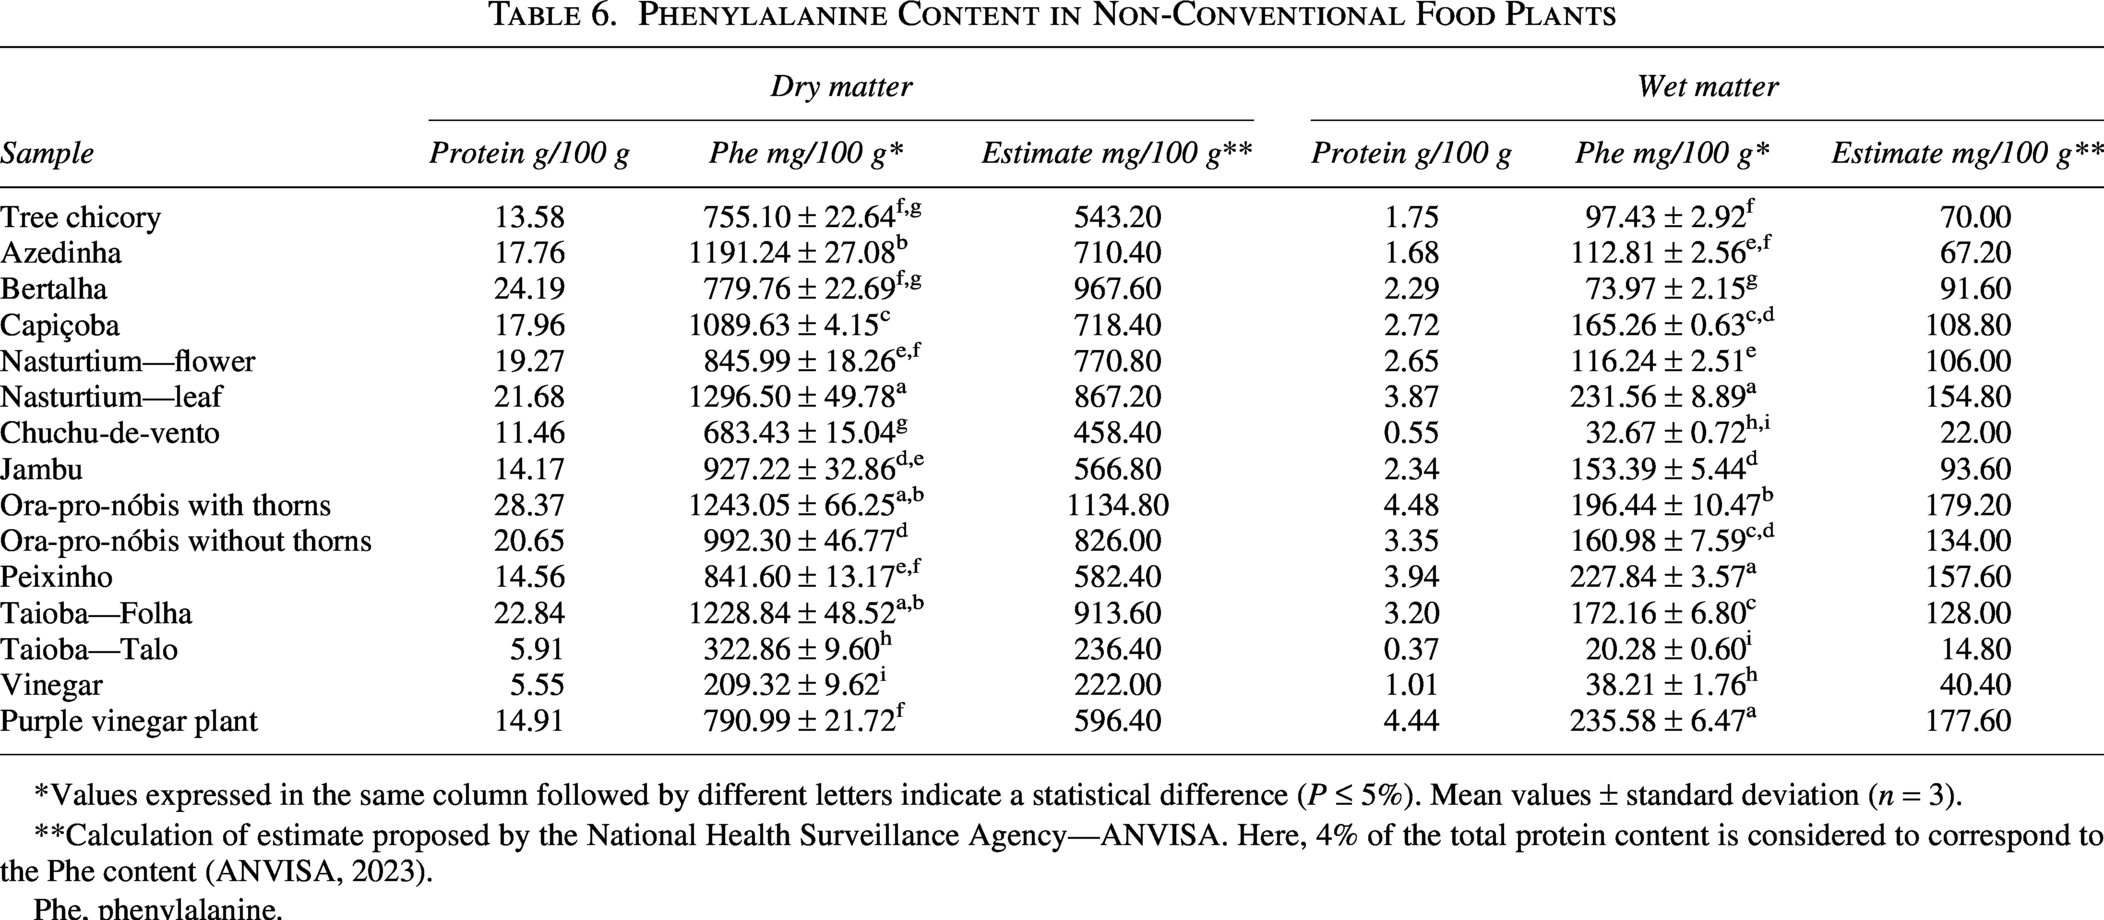
*Values expressed in the same column followed by different letters indicate a statistical difference (P ≤ 5%). Mean values ± standard deviation (n = 3).
**Calculation of estimate proposed by the National Health Surveillance Agency—ANVISA. Here, 4% of the total protein content is considered to correspond to the Phe content (ANVISA, 2023).
Phe, phenylalanine.
The Phe data will be discussed considering the wet base, as the national table and international tables of food composition that present the Phe content provide these data on a wet basis. However, for comparison, the data on a dry basis are also presented in Table 6.
The Phe content ranged from 20.28 to 235.58 mg/100 g for the taioba stalk and purple vinegar samples, respectively. In general, leafy vegetables showed higher Phe content when compared to taioba stalk, chayote fruit (32.67 mg/100 g), vinegar sepal (38.21 mg/100 g), and nasturtium flower (116.24 mg/100 g), corroborating Weetch, MacDonald, 36 and Ford et al.’s 35 findings.
Considering that the consumption of fruits and vegetables with Phe content below 100 mg/100 g does not affect plasma Phe levels in patients with PKU, 37 33.33% (n = 5) of the samples in the present study can be consumed without restriction. These samples are chicory, bertalha, chayote, taioba stalk, and vinaigrette sepal (Table 6). However, the consumption of the other UFP samples (66.67%, n = 10) will depend on the tolerated amount of Phe among individuals, which varies depending on the severity of PKU in each person, as well as the dosage and adherence to treatment. In any case, the inclusion of these vegetables will make the diet less monotonous and more palatable.
It is possible to observe that the Phe levels of the UFP in the present study are similar to some conventional vegetables, which are usually included in the diet of phenylketonurics, such as chicory (21.60 mg/100 g), cabbage (26.70 mg/100 g), lettuce (40.90 mg/100 g), cauliflower (90.70 mg/100 g), 36 chayote (18.00 mg/100 g), Swiss chard (52.00 mg/100 g), broccoli (129 mg/100 g), kale (150.00 mg/100 g) and spinach (193.00 mg/100 g). 35 These results indicate that the insertion of these UFP can be safe, as long as it is performed under the specific conditions of each patient.
Another important point is that data on the Phe content of foods are scarce and sometimes vary between food composition tables. 38 In practice, the most common method for calculating Phe content in vegetables is through estimation, assuming that 3–4% of the total protein content corresponds to Phe. Following this premise, Brazil has created its table of Phe levels in fruits and vegetables, as previously reported. 11
Although some studies have shown positive correlations and that the estimation system produces correct and reliable estimates,38,39 when calculating the Phe content of UFP samples, assuming that 4% of the total protein corresponds to Phe (Table 6), it is verified that these levels are underestimated, since the levels quantified by HPLC/UV are higher in all samples than those estimated.
Except the Bertalha sample, in which the estimated content (91.60 mg/100 g) was higher than the quantified (73.97 mg/100 g). This result is similar to that observed by Ford et al., 35 who also found variations in the quantified and estimated content in plant samples, verifying an amino acid/protein ratio of 2–% for fruits and 1–9% for other vegetables.
For these authors, the estimation method is imprecise, because the contribution of amino acids to the total protein content is inconsistent among plants, even among similar plants, since the pattern of free amino acids and the composition of the protein itself vary as a function of the stage of development, degree of maturation, genetic variability, environmental conditions, and even processing. 35 These data reaffirm the importance of studying, developing, and validating analytical methods that can accurately quantify the Phe content of plant foods.
The present study provided important data for greater dissemination and use of UFP by phenylketonurics. In addition, it is noteworthy that the sample preparation and chromatographic method used in the present study are considered reliable for Phe analysis in plant matrices. This method can be applied to other plants to expand the supply of phenylketonuric products further.
CONCLUSION
The chromatographic method developed and validated in this study proved to be suitable for the intended analysis, demonstrating linearity in the range of 1–10 nmol/mL, as well as satisfactory selectivity, recovery, repeatability, precision, and limits of detection and quantification. The study also assessed the Phe content in UFPs, indicating that these plant sources can be safely incorporated into the diets of patients with PKU, provided that individual nutritional requirements are taken into account. The availability of accurate data on Phe content enables more precise dietary calculations and contributes to a more diverse and palatable diet. However, it is recommended that the application of this method be expanded to a broader range of plant species in order to enhance national food composition databases and support nutrition professionals and patients in managing the disorder.
Authors’ Contributions
E.C.M.: Conceptualization, investigation, writing—original draft, writing—review and editing. M.R.R.d.C.: Writing—original draft, visualization. K.C.: Methodology, formal analysis, writing. A.L.S.V.: Resources, review and editing, marinalva woods pedrosa: resources, review and editing. M.d.F.G.: Methodology, formal analysis. L.T.S.D.: Methodology, formal analysis, writing. R.A.L.: Validation, writing—review and editing, project administration. R.L.B.d.A.: Validation, writing—review and editing, visualization, project administration, supervision.
Footnotes
ACKNOWLEDGMENTS
The authors would like to thank FUNED, the Minas Gerais Agricultural Research Corporation (EPAMIG), the Coordination for the Improvement of Higher Education Personnel—CAPES, and the Minas Gerais State Research Support Foundation (FAPEMIG) for their financial support.
DATA AVAILABILITY STATEMENT
Data sharing does not apply to this article, as no new data were created or analyzed in this study.
CONFLICTS OF INTEREST AND DECLARATIONS
Identification type: “Call for proposals 001/2023—Universal Demand” Process number: apq-01614-23 Project: “Quantification of amino acids and phenolic compounds in unconventional food plants for dietary control in the treatment of aminoacidopathies.””
AUTHOR DISCLOSURE STATEMENT
The authors declare that they have no known competing financial interests or personal relationships that could have appeared to influence the work reported in this article.