
Abstract
Purpose:
Inpatient clinicians may experience distress when providing complex care for the millions of Americans with serious illness hospitalized yearly. Understanding the types and clinical impact of clinician distress when caring for seriously ill inpatients can inform supportive interventions to minimize burnout symptoms. This study aims to identify distinct distress trajectories among clinicians caring for seriously ill inpatients over time using mobile ecological momentary assessments (mEMAs).
Methods:
We performed latent class cluster analysis of clinicians’ prospective serial mEMAs to identify unique distress trajectories and estimated univariate ordinal logistic regression models using generated estimating equations methods to explore the relationship between distress type and patient and clinician characteristics.
Results:
We identified four distinct clinician distress trajectories from clinician responses (n = 142): low distress (23.2%), moderate distress (33.1%), high distress (23.9%), and variable distress (19.7%). The majority of patients had a primary malignancy (77.9%). Clinicians self-reported multiple symptoms: fatigue (59.3%), stress (57.4%), worry (47.2%), insomnia (33.3%), anger (13.9%), sadness (9.3%), and pain (4.6%). Clinicians’ discipline (advanced practice provider [APP] vs. physician; χ2 = 9.11, p = 0.0025) and emotions (χ2 = 11.29, p = 0.0008) were significantly associated with the distress trajectory. Clinicians who had an increase in reported emotions were likely to be in a higher distress trajectory (odds ratio [OR] 1.90, p = 0.001), as were APPs compared with physicians (OR 6.16, p = 0.003).
Conclusion:
Clinicians experience distinct trajectories of distress while caring for seriously ill inpatients. While all groups experienced degrees of distress, identifying clinicians with high distress may enable health systems to target supportive interventions and resources in a timely manner to mitigate potential burnout and other emotional states.
Key Message
Real-time assessment revealed four distinct distress trajectories among clinicians caring for seriously ill hospitalized patients, with nearly half experiencing high or variable distress. Advanced practice providers and those reporting multiple emotions faced greater distress. Identifying at-risk clinicians enables health care systems to deliver timely interventions preventing burnout.
Introduction and Background
Clinicians care for over 33 million Americans hospitalized with serious illness every year. 1 Many inpatients have chronic, serious illness and multimorbidity requiring complex and intensive care.2,3 The individual clinician providing care meaningfully influences patient outcomes, including quality of life and mortality.4,5 Clinicians supporting these patients must manage dynamic and multifaceted care needs and treatment plans while simultaneously navigating interpersonal and interprofessional relationships with patients, families, and other clinicians in a fast-paced hospital environment. This role can generate physical and emotional distress—whether acute or cumulative—over the course of a clinician’s service. Yet, there is a critical gap in recognizing and measuring the full scope of clinician distress, its trajectories over time, and its implications for the care of patients with serious illness and their families.
For the purpose of this study, a definition of distress has been adapted from the National Comprehensive Cancer Network. 6 Clinician distress is operationally defined as a complex, unpleasant experience of psychological, emotional, social, spiritual, and/or physical nature that impacts one’s life and daily tasks. Recognizing the importance of distress, the National Academy of Medicine (NAM) created a task force in response to the staggering rate of burnout reported among clinicians. 7 There is now widespread recognition that clinicians need and deserve individual and systems-level interventions to support their overall well-being,7,8 yet little is known about the variability of individual clinician distress.
Furthermore, there is a scarcity of research on how clinician distress manifests in real time, hinders care, or the likely unique trajectories that occur from the initial distress. Prior studies reporting clinician distress have used a cross-sectional measurement approach, which fails to acknowledge that emotions are fluid and change throughout the day.9,10 This fluidity of emotions is important to understanding clinicians’ experience and therefore developing support systems. The purpose of this study is to provide the basis for future research to ameliorate clinician distress by increasing our understanding of how to recognize and measure clinician distress and distress trajectories over time.
The primary aim of this prospective study was to identify distinct types of clinician distress trajectories over time as clinicians care for seriously ill hospitalized patients. This study is based on the principles of longitudinal research, where multiple observations were gathered over a period of time. We hypothesized that discrete distress trajectories would emerge reflecting high, medium, and low levels of distress trajectories across the clinicians’ workday. A secondary aim was to examine associations between clinician distress trajectory type and baseline patient and clinician characteristics, including clinician emotional experience.
Methods
Study design and setting
We conducted a prospective longitudinal study among clinicians working on the medical ward at three urban academic hospitals within the University of Pennsylvania Health System from June 26, 2023 through September 14, 2023. We used mobile ecological momentary assessment (mEMA) technology to collect real-time data from clinicians. Previously, mEMA has been used in patient pain and symptom assessment research11–15 and clinician–participant research.16–18 This study was approved by the University of Pennsylvania Institutional Review Board (#852340), with electronic informed consent and waiver of Health Insurance Portability and Accountability Act (HIPAA) authorizations granted.
Sampling and recruitment
We defined eligible clinicians as the attending and resident physicians and advanced practice providers (APPs; nurse practitioners and physician assistants) primarily responsible for patients’ medical decision making and treatment plans. Prescribing clinicians, including advanced practice nurses, have similar work patterns, clinical responsibilities, and patient assignments. Although we recognize that other clinicians, including bedside nurses, experience distress, this study focused on clinicians with similar day-to-day relationships with patients and families and professional and institutional constraints. Eligible clinicians included those with at least one adult patient on their daily census with a predicted six-month mortality risk of ≥50% as determined by an algorithm developed and validated within the study hospitals.19,20 Clinicians were invited to participate via a secure message sent in the electronic health record that briefly described the study’s purpose. If clinicians expressed interest in participating, they were instructed to (1) read and complete the electronic informed consent document, (2) download the free mEMA smartphone application (app; “mEMA-Sense”) 21 compatible with all smartphone platforms to their personal or health system-issued smartphone and to reach out to the study team to troubleshoot, (3) enter their unique access code, (4) and complete six study surveys over each of the next 2 days, as well as additional surveys on the second day. Survey timing was based on an algorithm (mortality score calculated on hospital day two) and average length of stay (three to five days on general medicine units) (see Fig. 1 for timing of data collection from clinicians). Two consecutive days were chosen based on patient length of stay, provider scheduling (accounting for the variability of both physician and APP schedules), and an aim to capture real-time distress. Notably, each eligible clinician has a health-system-issued smartphone. Patient data were exclusively chart-extracted.
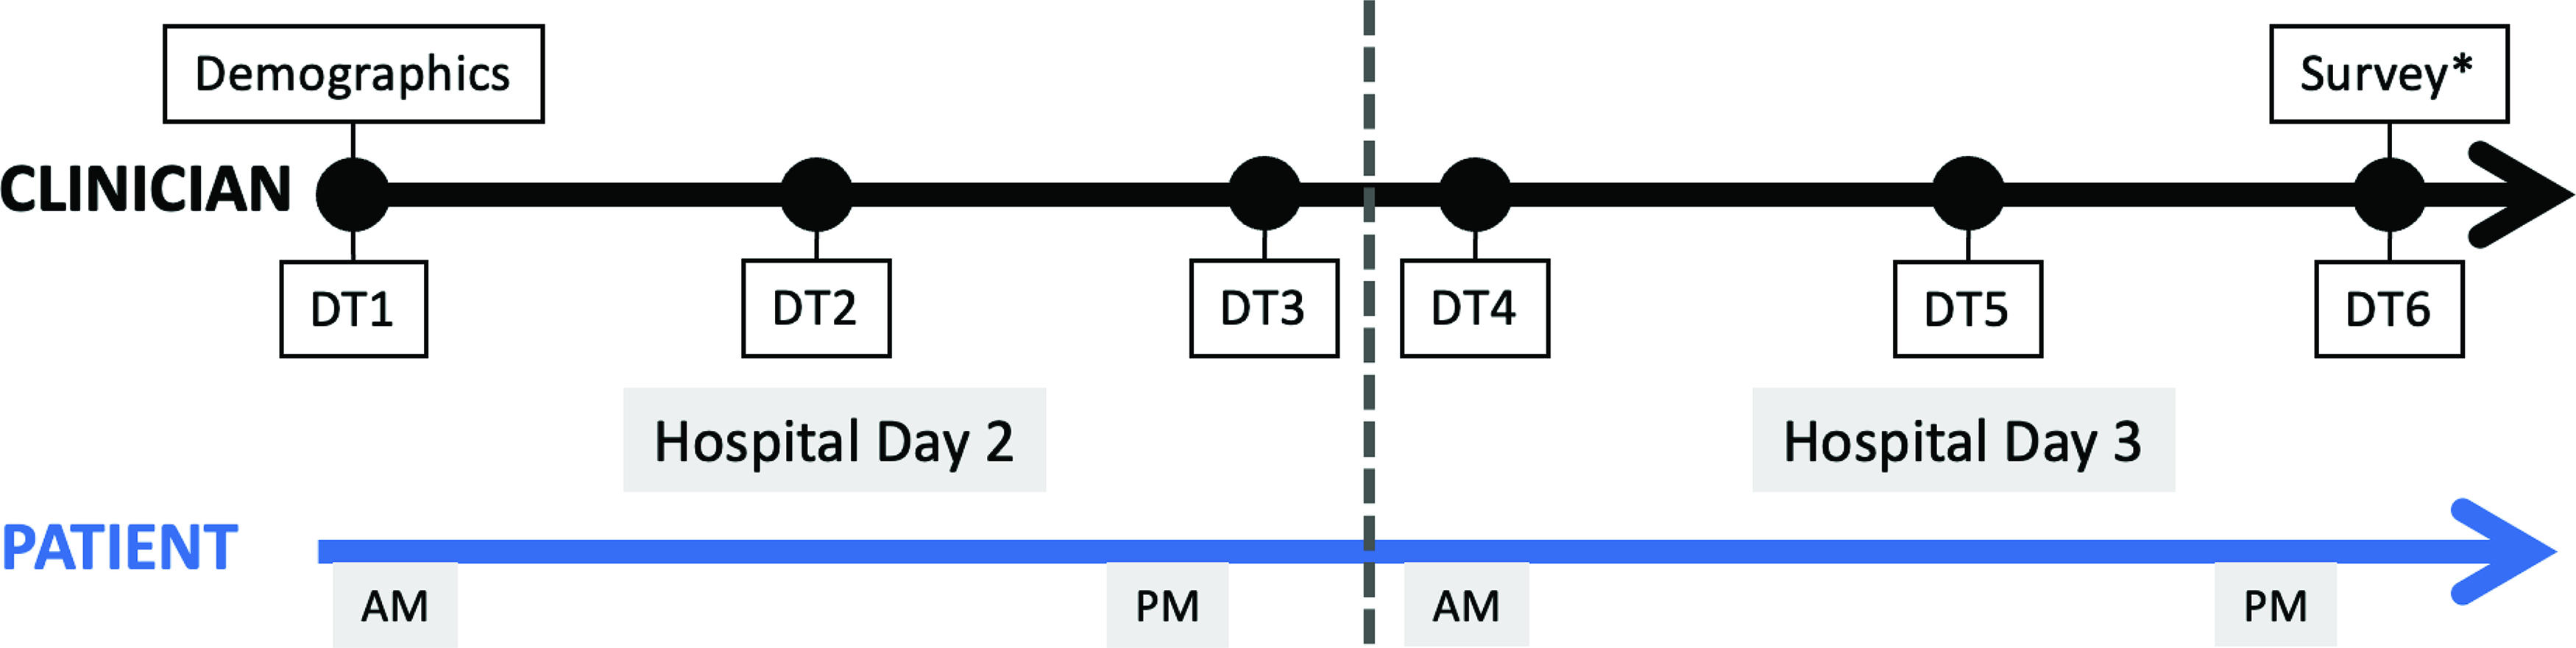
Timing of data collection. Patient is identified on hospital day two, then the clinician is invited to participate. First, clinicians completed a demographic survey upon enrollment. Then, clinicians completed six unique distress thermometer (DT) scale over two days. Finally, at the end of hospital day three, the clinician completed other survey* including emotional experience index, job strain, and perception of support. Patient data is chart-extracted demographics (age, race, sex), admission diagnosis, primary serious illness, Charlson Comorbidity Index, documentation of goals of care, presence of palliative care consult referral, hospital length of stay, and intensive care use.
Data collection
We pilot tested the feasibility of the surveys and mEMA-Sense 21 with noneligible clinicians (n = 25) in May 2023. We incorporated feedback on format, user guidance, and timing of survey (i.e., demand vs. scheduled).
Measures
Patient measures
Patient demographic data were chart-extracted and included age, sex, race/ethnicity, diagnoses, severity of illness (six-month predicted mortality score described above), and Charlson comorbidity index.
Clinician demographics
Clinicians completed a demographic survey via mEMA at enrollment that included their age, sex, race/ethnicity, credentials, and years of experience.
Clinician distress
The distress thermometer (DT) is an 11-point visual analog scale (VAS) employed and validated in numerous studies22–28 to screen for distress across different populations. The VAS ranges from 0 (no distress) to 10 (extreme distress) and was asked at the start of the shift, mid-shift, and end of the shift. DT has demonstrated convergent validity with other commonly used and psychometrically validated tools such as the Hospital Anxiety and Depression Scale,6,24,25,29 Depression Anxiety Stress Scale-21,6,22 and the Perceived Stress Scale. 30 Furthermore, VAS provides better data for analysis with parametric statistics 31 and thus an efficient measure of distress levels for busy clinicians. In this study, participants were asked to respond to the DT in terms of general distress (“Please rate on this 0–10 scale your current level of distress,” where 0 is no distress and 10 is extreme distress).
Emotional experience
The Gallup negative experience index 32 is a self-report measure that captures respondents’ real-time symptoms. 16 Participants were asked to recall any negative emotions from their previous workday by responding to seven psychological and emotional symptom dichotomous (yes/no) questions. For instance, the survey assessed insomnia with the question “Did you have trouble sleeping last night?” and sadness with “Did you feel sad a lot of the day yesterday?” where participants self-reported “yes” or “no.” Multiple “yes” answers indicate a high level of symptoms in the last 24 hours.
Systems-level measures
Additional system-level measures of environmental factors (i.e., job strain, workload, perception of climate, perceived support on continuous 11-point VAS) were collected one-time after all mEMA data were collected.
Sample size and power analysis
Sample size estimation was conducted using a one-way repeated measures estimation in PASS 2021 v21.0.2. A recent study 33 was used to obtain descriptive estimates for use of the DT with a mean score of 5.4 (standard deviation (SD) = 2.91). Our assumptions were that six time points would yield meaningful data (six mEMA prompts) that the same subject’s data would yield an autoregressive correlation [AR(1)] of 0.50 for repeated measures. To obtain 80% power with a type I error of 5% for a 15% change in distress score over time (5.4 vs. 4.59) using a multivariate Hotelling–Lawley Trace Test, we needed 134 participants. Assuming a 5% attrition at the end of the study, we needed 141 clinician responses.
Statistical analyses
The primary measure for this study, “clinician distress,” was recorded longitudinally for each clinician and clustered into distress trajectories, using a novel approach, “KmlShape,” specifically proposed to cluster longitudinal data.34,35 This approach allows for data partitioning into clusters based on trajectories. Longitudinal cluster analysis was conducted in R software 36 using K-means clustering for longitudinal time-series data.34,35 Multiple cluster analyses were run to determine the best fit based on several statistical tests (Akaike information criterion [AIC], AIC-corrected [AICc], Bayesian information criterion [BIC], and Calinski-Harabasz Index [CHI]). Typically, smaller fit statistics are a better fit; however, for time series clustering fit statistics, the size of each cluster and the trajectories themselves can be included in the rationale. Differences by clusters were analyzed using the Kruskal–Wallis rank sum test for continuous variables and Pearson’s chi-squared test or Fisher’s exact test, as appropriate, for categorical variables.
The exploratory secondary analysis used chart-abstracted data to examine patient and clinician demographic characteristics associated with the primary outcome—clusters derived from trajectory patterns. Univariate ordinal logistic regression models were estimated using generalized estimating equation (GEE) to account for the possibility that each clinician contributed multiple trajectories. That is, clinicians could be caring for more than one patient identified; similarly, each patient typically had two covering providers, including an attending physician and either APP or resident physician. Then, GEE models, with both three and four clusters as the dependent variable, were performed to explore the relationship between clinician distress trajectory clusters and clinician and patient variables. Clinician demographics (credentials, years of clinical experience, age, race, gender) were included as independent variables. The KmlShape procedure addressed missing data through linear interpolation and then introduced variation to ensure each trajectory conformed to the overall “shape” of the mean trajectories.
Results
We identified 558 eligible patients and 1120 eligible clinicians to participate. Of those, 509 (45.4%) accepted the initial invitation (see Fig. 2 for attrition over time). Clinicians responded to at least one mEMA 184 times; 105 clinicians completed all six DT time points. Final clusters were based on clinicians with at least four DT responses (n = 142); therefore, the study was sufficiently powered. Taking into consideration that clinicians could be taking care of more than one identified patient, a total of 184 clinician responses included a clinician (n = 68) matched with a seriously ill hospitalized patient (n = 151) (Fig. 3 depicts the number of missing surveys at points during enrollment).
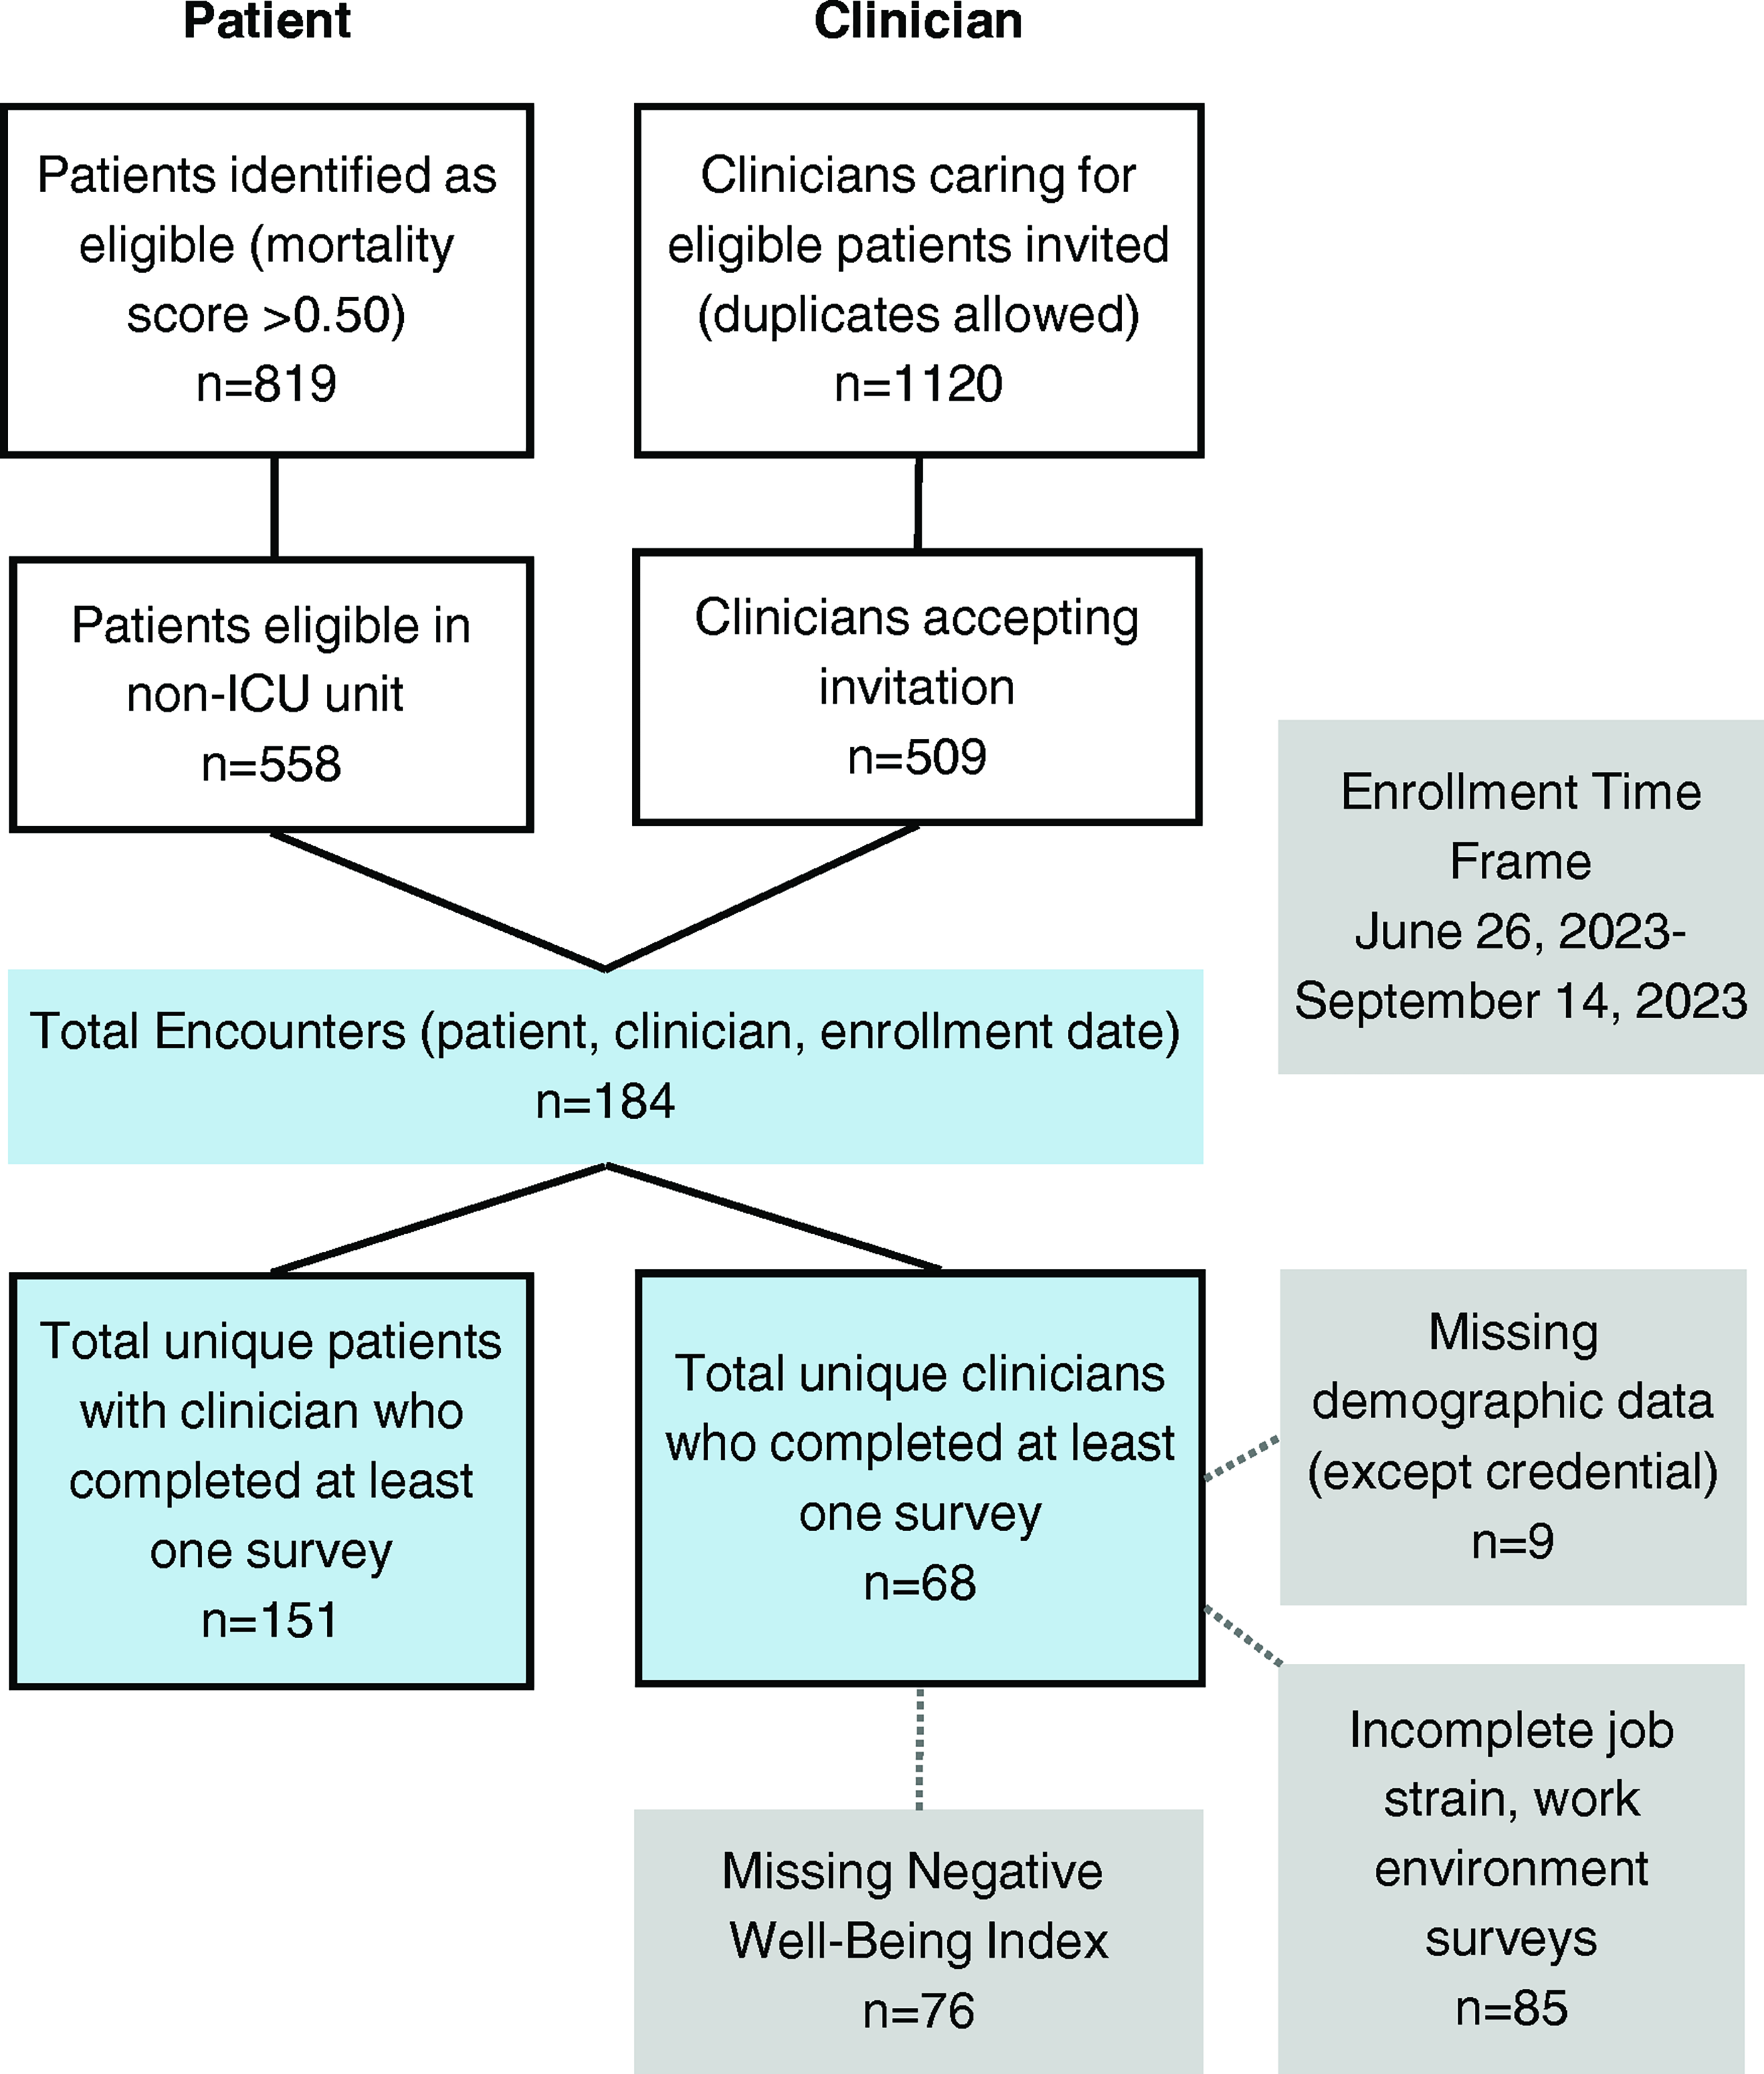
Recruitment and data framing. Study recruitment with attrition over time.
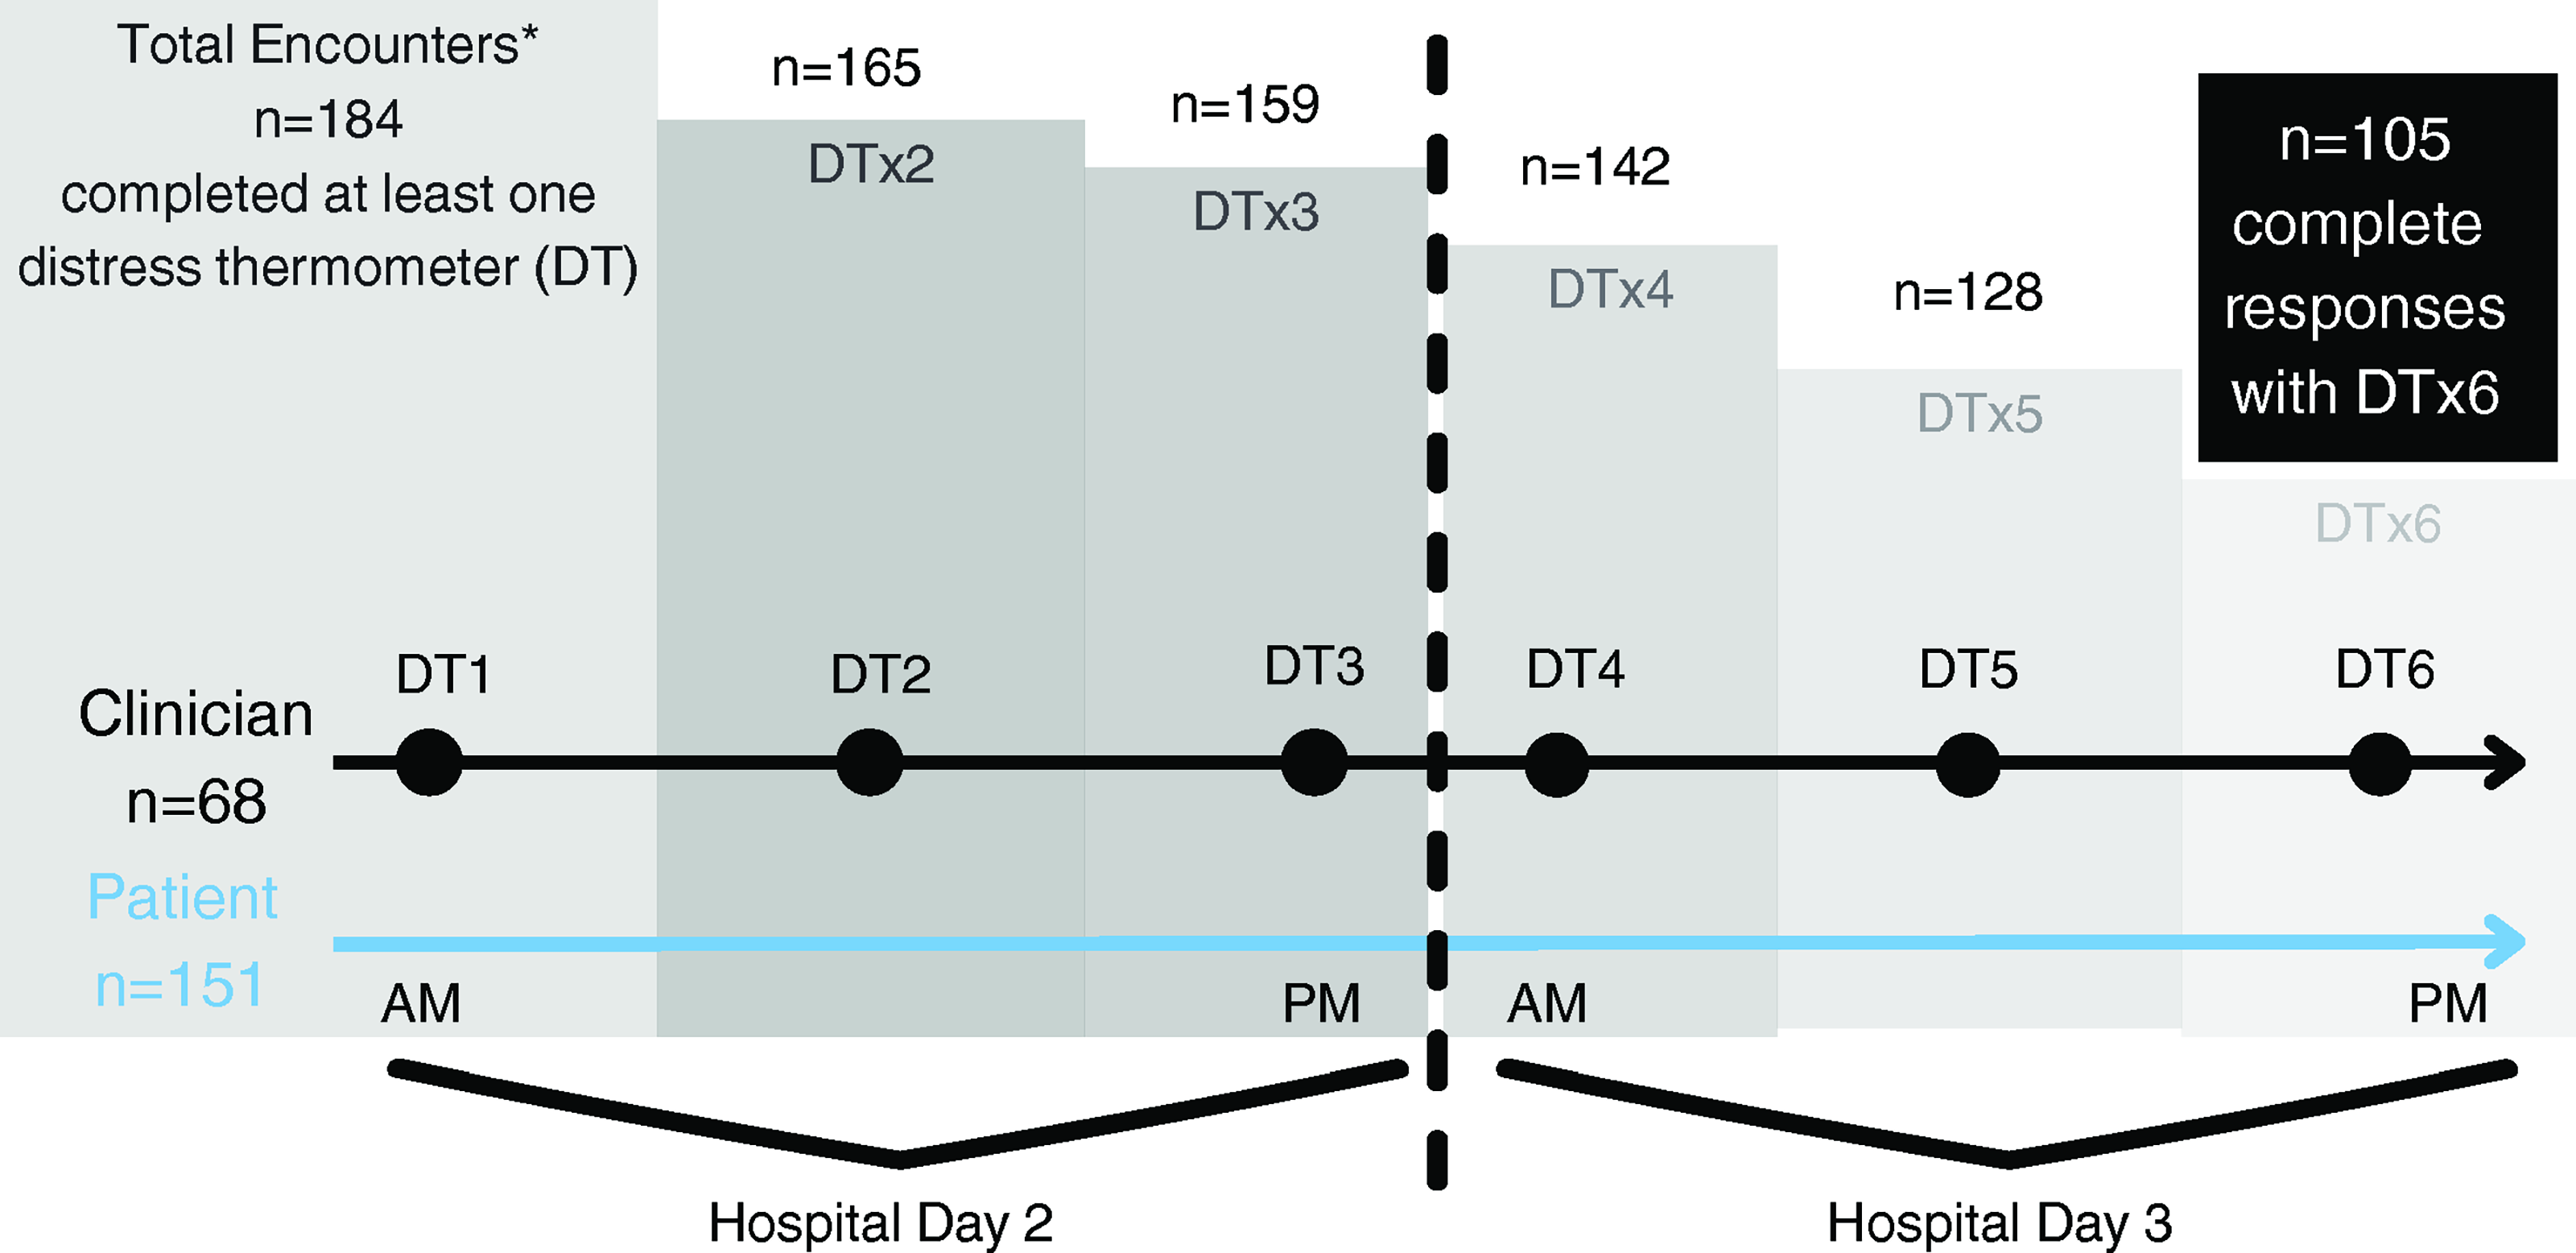
Longitudinal sampling. This figure depicts the total number of clinician responses over time. Each unique encounter* has these three elements: (1) clinician, (2) patient, and (3) enrollment date. Patients and clinicians could be reenrolled, which constituted a separate encounter.
Clinician demographic data
The average age of clinicians was 37.9 years (SD = 9.33) ranging from 27 to 67 years old, primarily female (59.3%), and White (78%) (Table 1). The sample included more physicians (60.3%) than APPs (39.7%) and clinicians had an average of 8.4 years’ experience (range 0–31 years). The largest group of enrolled (40.7%) clinicians were early career (0–5 years’ experience; 10.2% of whom were novice clinicians with less than one year experience), then mid-career (6–10 years’ experience; 32.2%), followed by late career (≥11 years’ experience; 27.1%).
Clinician and Patient Demographics
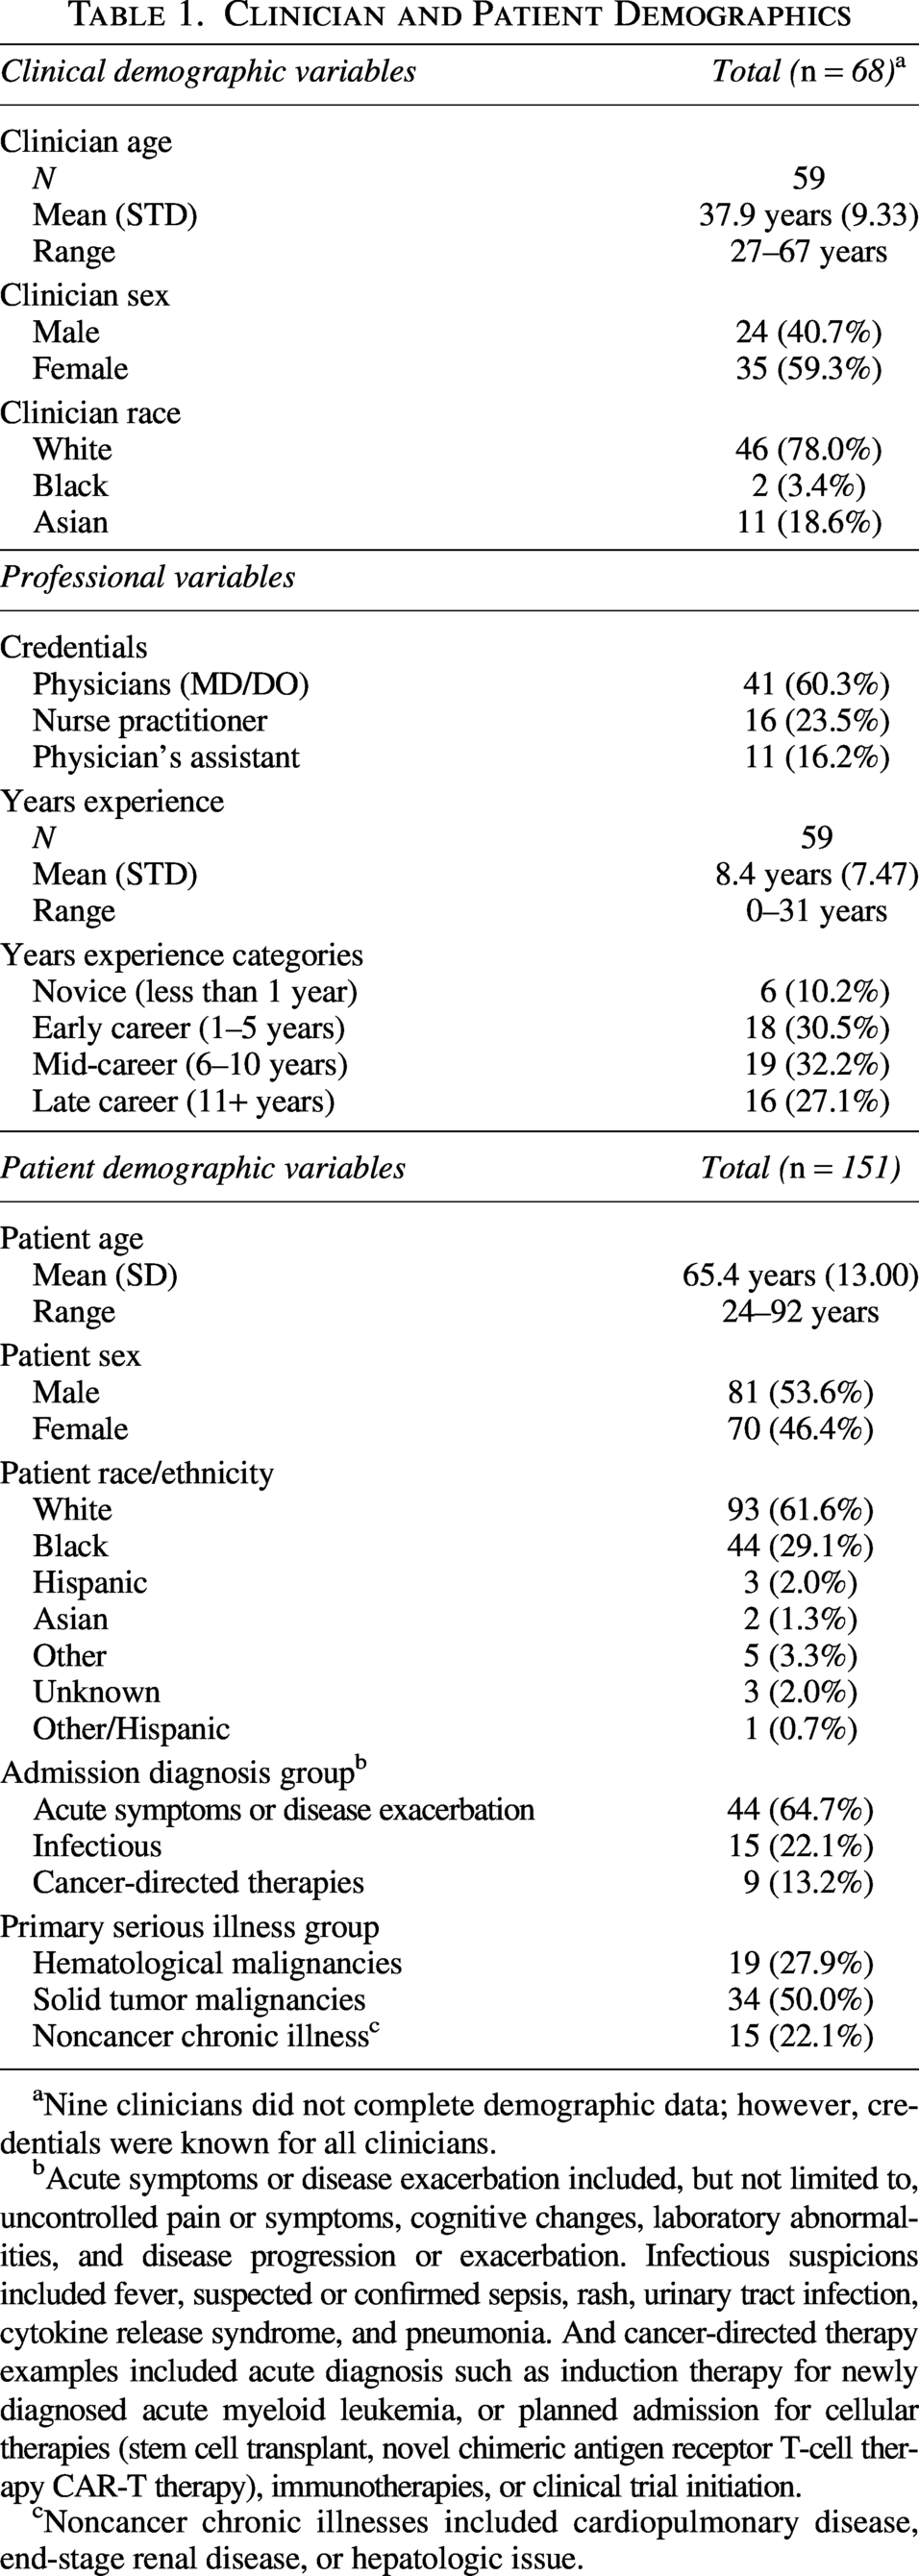
Nine clinicians did not complete demographic data; however, credentials were known for all clinicians.
Acute symptoms or disease exacerbation included, but not limited to, uncontrolled pain or symptoms, cognitive changes, laboratory abnormalities, and disease progression or exacerbation. Infectious suspicions included fever, suspected or confirmed sepsis, rash, urinary tract infection, cytokine release syndrome, and pneumonia. And cancer-directed therapy examples included acute diagnosis such as induction therapy for newly diagnosed acute myeloid leukemia, or planned admission for cellular therapies (stem cell transplant, novel chimeric antigen receptor T-cell therapy CAR-T therapy), immunotherapies, or clinical trial initiation.
Noncancer chronic illnesses included cardiopulmonary disease, end-stage renal disease, or hepatologic issue.
Patient demographic data
Patients’ average age was 65.4 years, primarily male (53.6%) and White (61.6%) (Table 1). Primary reasons for hospital admission were acute symptoms or disease exacerbation (64.7%). Patients had a primary serious illness of a solid tumor malignancy (50%), followed by hematological malignancy (27.9%) or noncancer chronic illness (22.1%).
Primary outcome: clinician distress trajectory
Figure 4A presents the trajectories based on complete clinician responses for six DTs. Among clinicians, 29.6% fell into the low distress trajectory, 43.4% were in the moderate distress trajectory, and 27.0% were in the high distress trajectory (AIC = −3333.0, AICc = −3338.5, BIC = −3391.3, CHI = 127.9). Figure 4B shows the trajectories when at least four clinician DT responses were captured, where DT5 and DT6 were imputed when missing. By using four DT responses, an additional trajectory emerged: low distress trajectory (23.2%), moderate distress trajectory (33.1%), high distress trajectory (23.9%), and variable distress trajectory (19.7%) (AIC = −3113.9, AICc = −3125.1, BIC = −3187.8, CHI = 96.3).
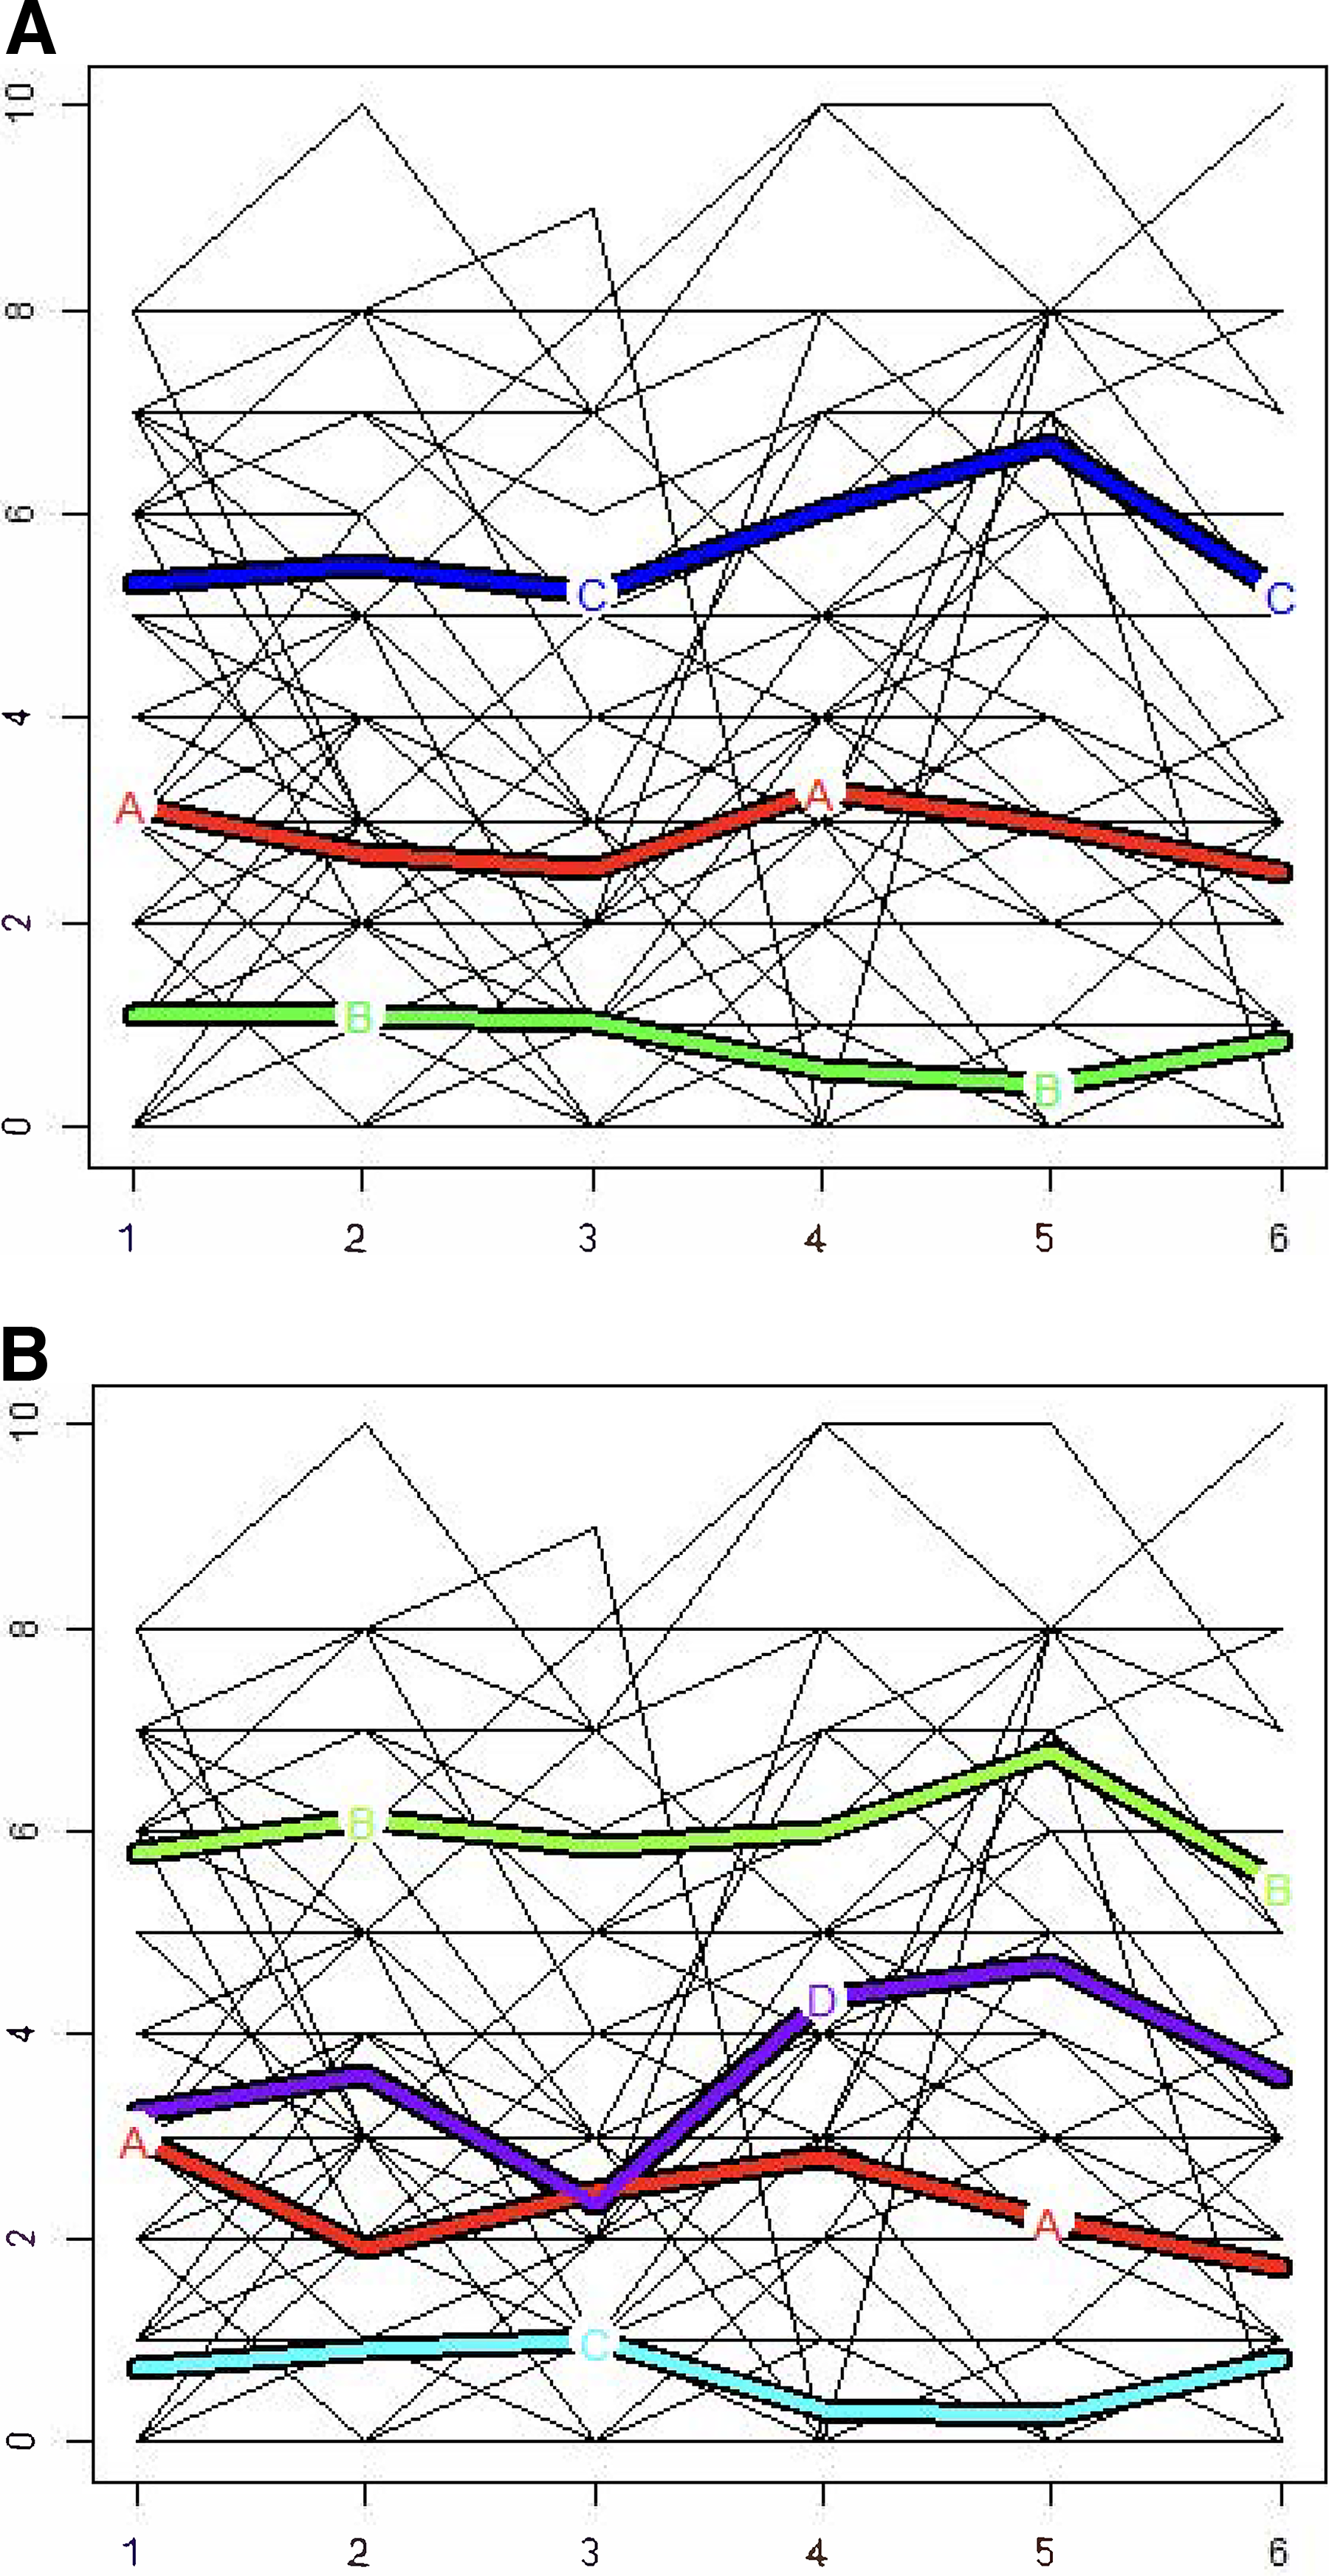
Cluster analysis.
Trajectories were analyzed for differences by clusters (Table 2). By trajectory, all clinician individual variables were significant: sex (p = 0.014), age (p = 0.007), race (p < 0.001), credentials (p = 0.006), and years of experience (p = 0.006). Clinicians’ physical and emotional symptoms including insomnia, worry, sadness, stress, and fatigue were all significant by cluster. Clinicians’ perceptions of work environment (p = 0.005), perception of work climate (p = 0.007), and perception of support (p = 0.007) were all significant by trajectory. Patient variables were not significant by trajectory.
Descriptive Differences Between Clusters
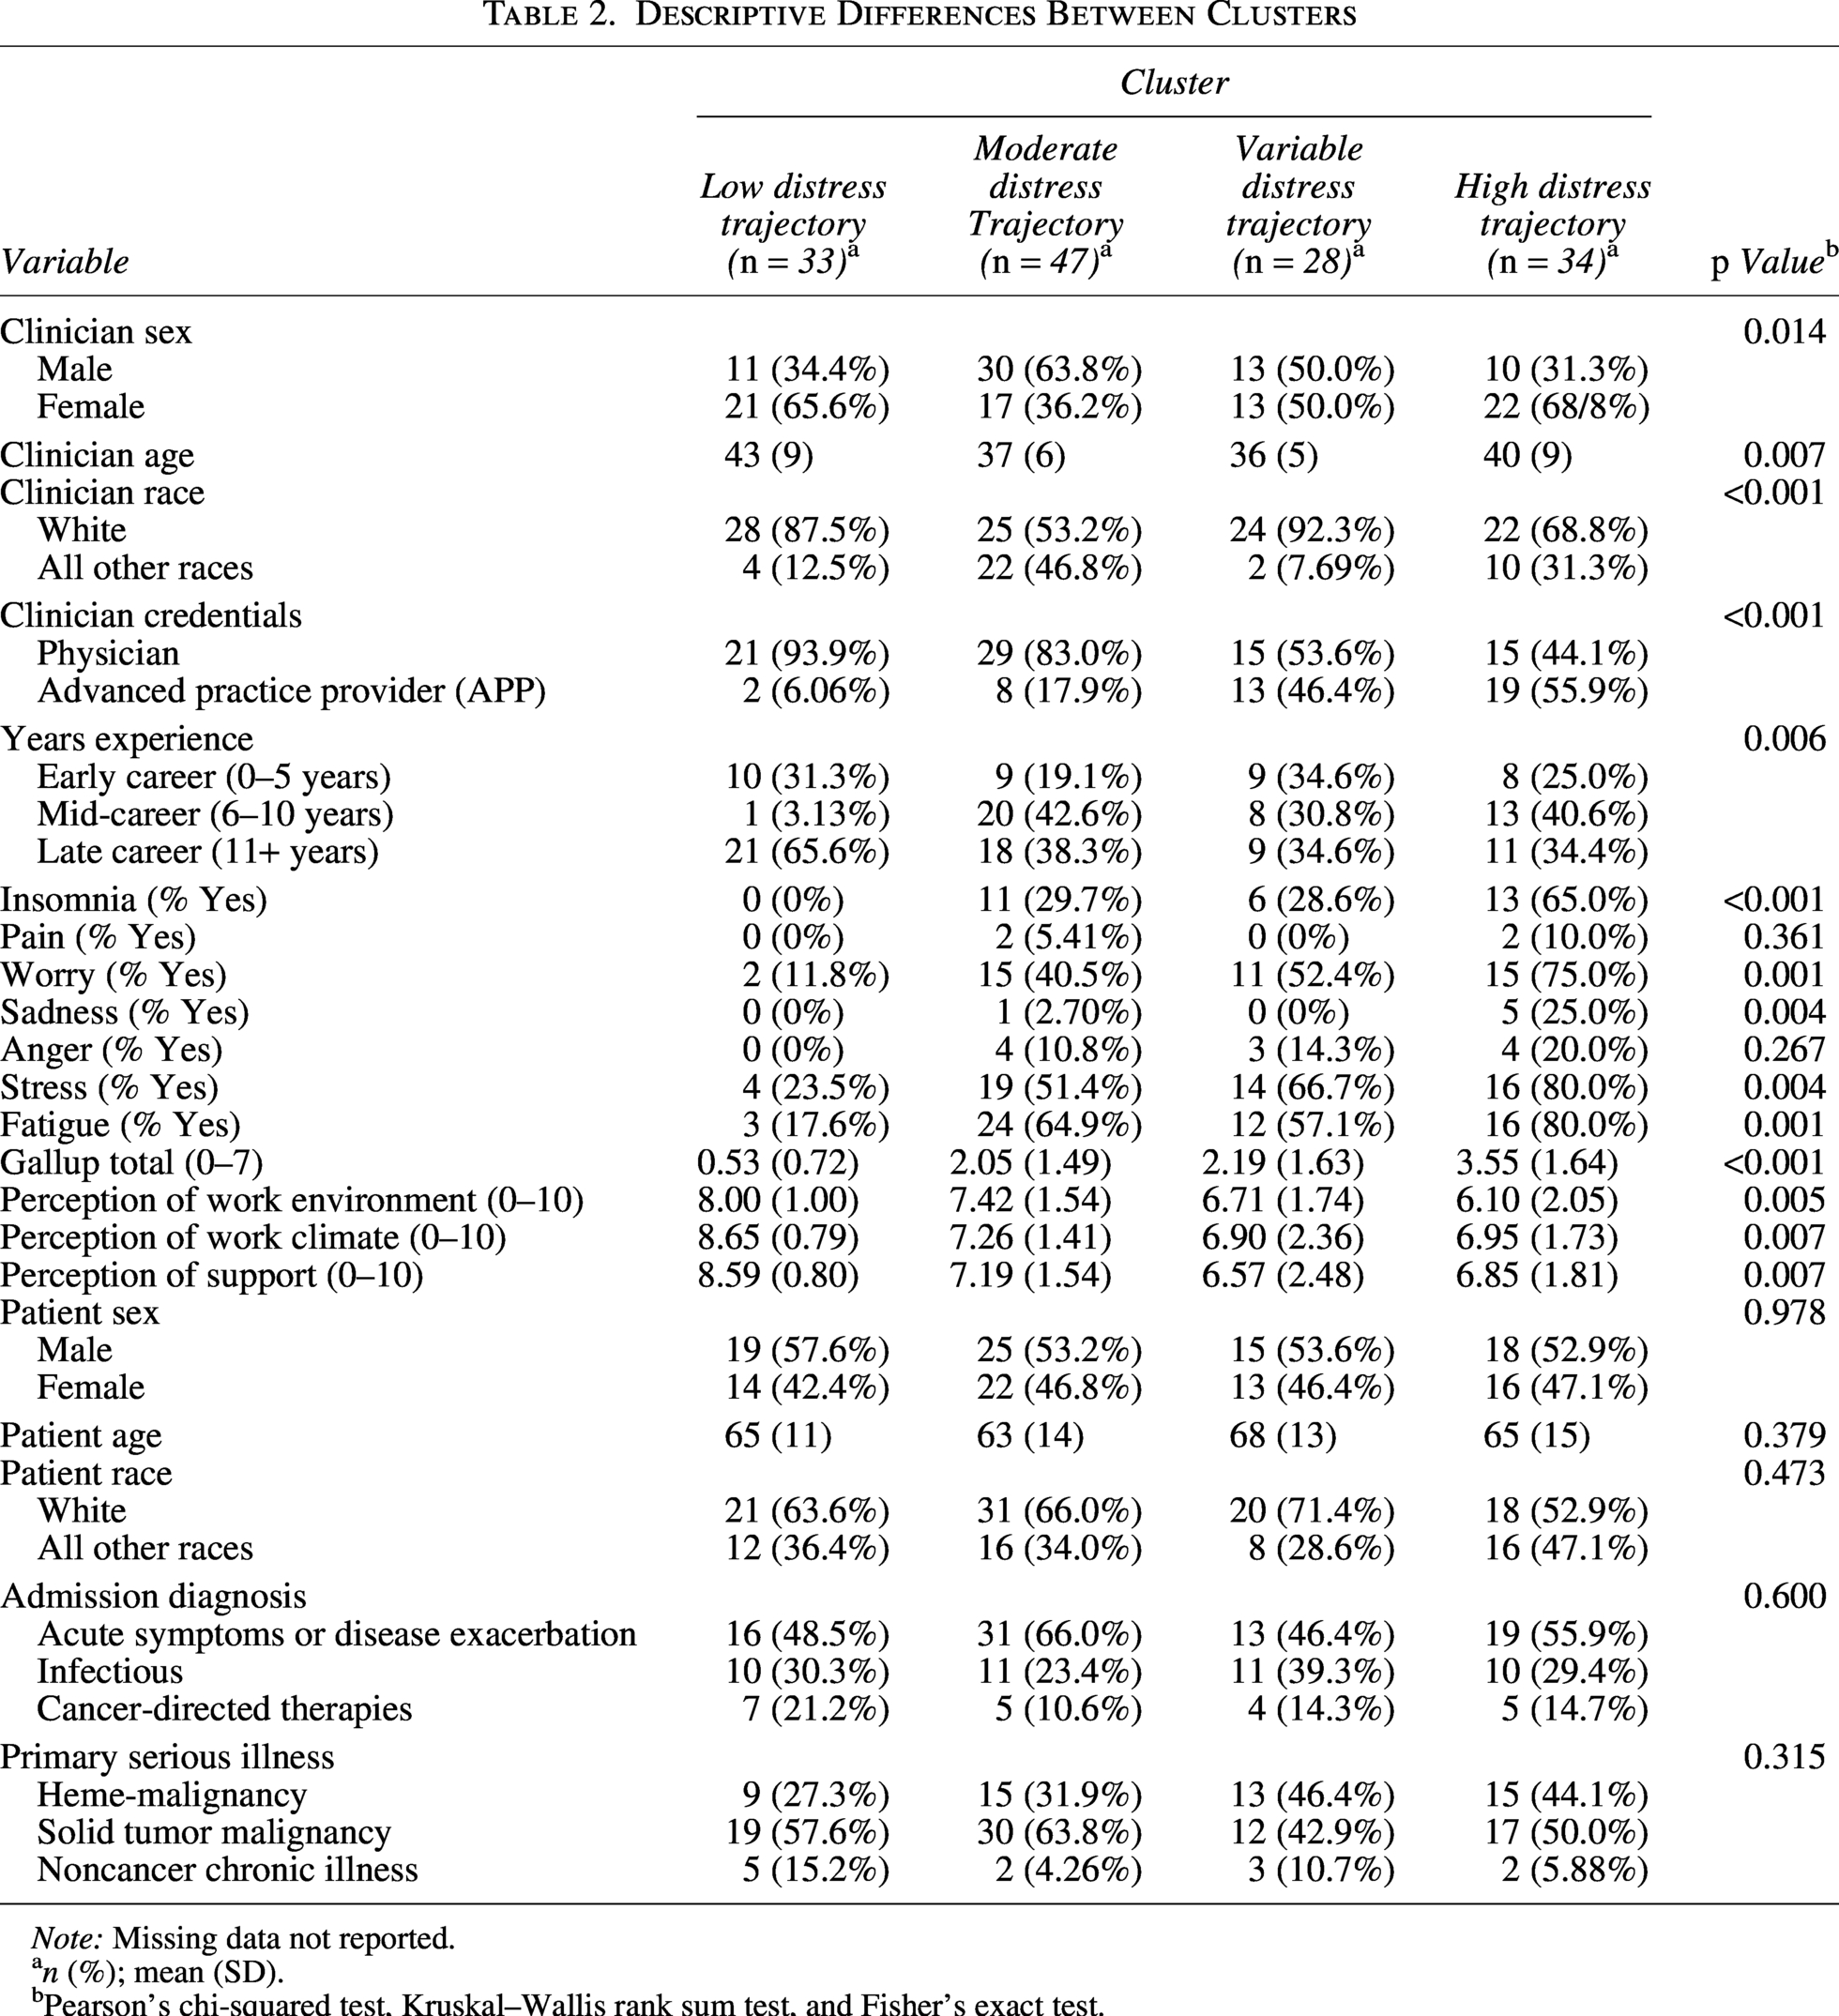
Note: Missing data not reported.
n (%); mean (SD).
Pearson’s chi-squared test, Kruskal–Wallis rank sum test, and Fisher’s exact test.
Clinician emotional experience
Clinicians’ symptoms in order of frequency were fatigue (59.3%), stress (57.4%), worry (52.8%), insomnia (33.3%), anger (13.9%), sadness (9.3%), and physical pain (4.6%) (Table 3).
Clinician Emotional Experience
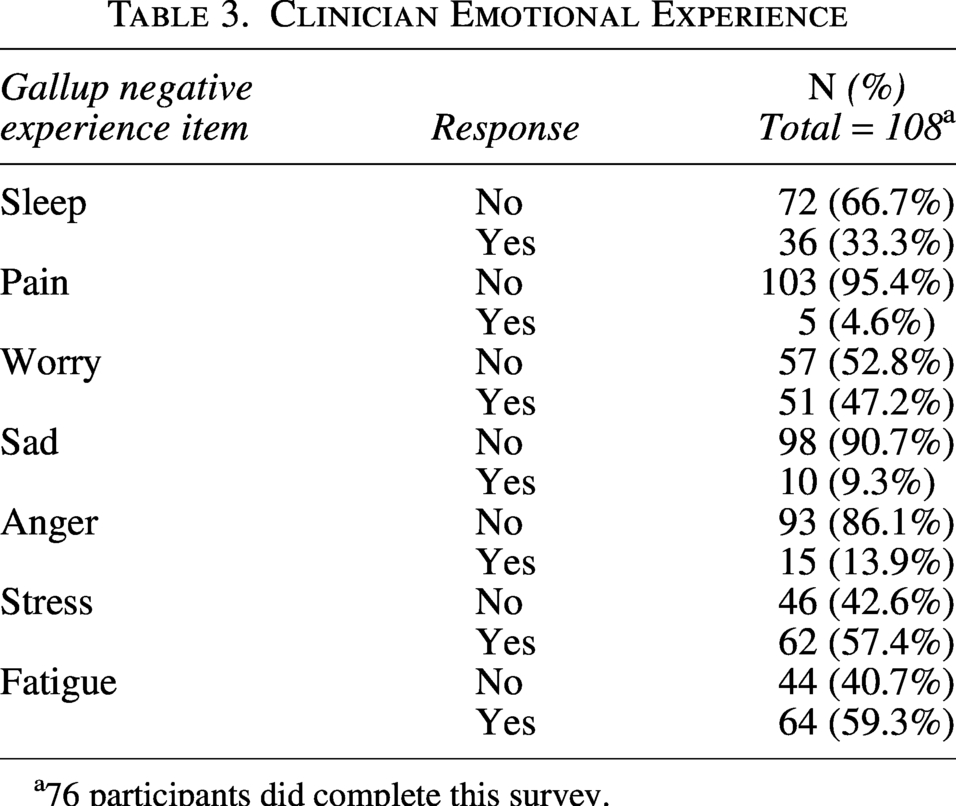
76 participants did complete this survey.
Exploratory analysis by clusters
The three- and four-cluster models did not differ greatly from a statistical standpoint (Table 4). For instance, an APP was more likely to have a higher distress trajectory than physicians (odds ratio [OR] = 6.16 with four trajectories and OR = 3.75 with three trajectories). Therefore, an APP was six times more likely to be in a higher distress trajectory than a physician in this study. The increase in the number of emotions (“Total Gallup Score”) increased the likelihood of being on a higher distress trajectory (OR = 1.8993 with four trajectories and OR = 1.9522 with three trajectories). However, the confidence intervals are wide for certain variables, indicating that the ORs have lower precision. If a clinician had an additional negative experience item (that is answered “yes” to any of the symptoms measured on the Gallup), their odds of moving to higher trajectories increased by a factor of 1.8993.
Generalized Estimating Equations Univariate Ordinal Logistic Regression
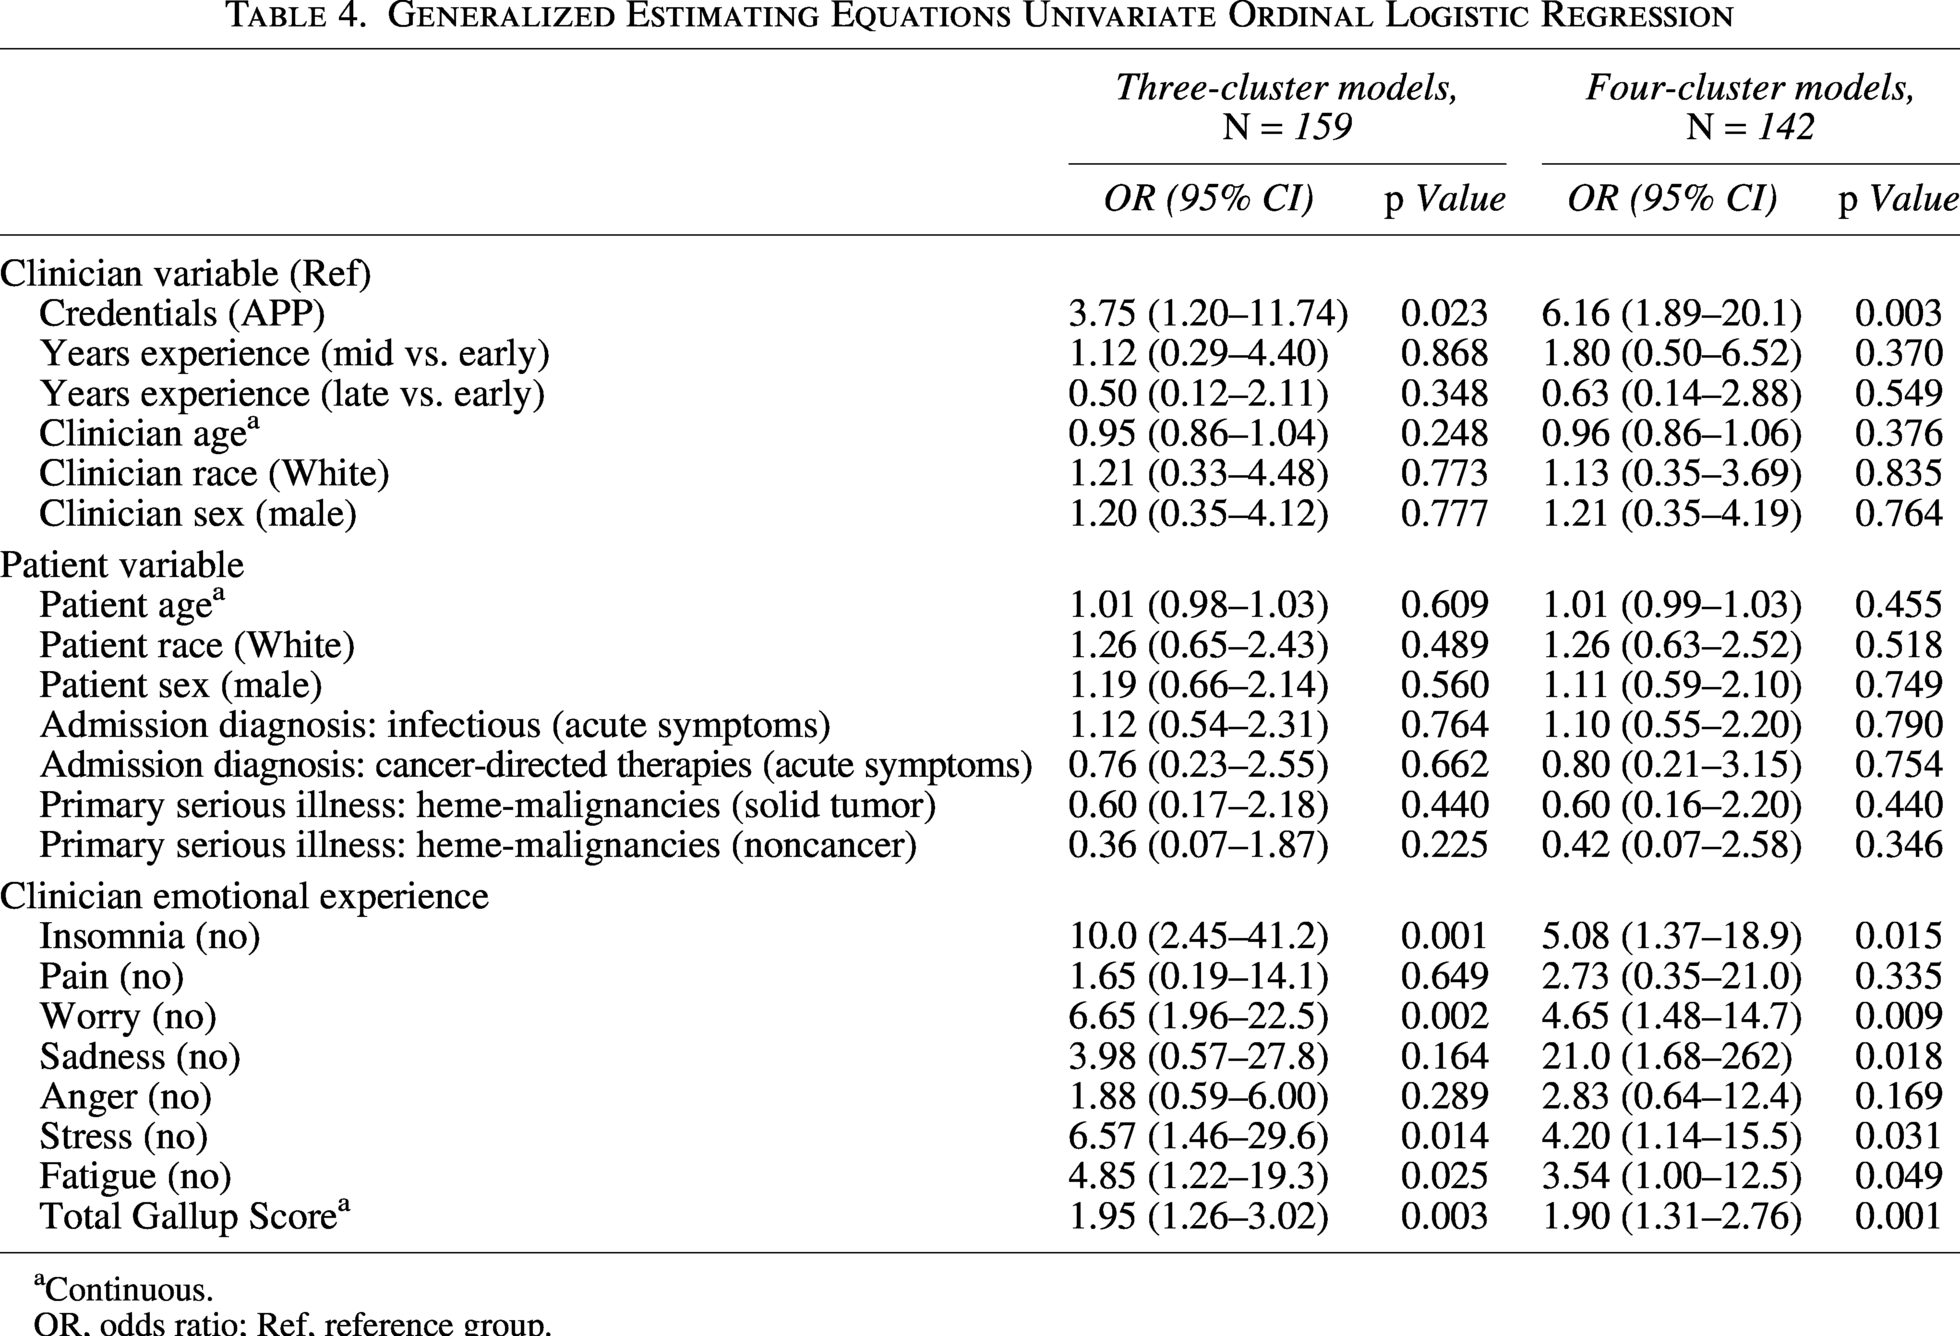
Continuous.
OR, odds ratio; Ref, reference group.
Although clinician years of experience was not statistically significant, importantly for clinicians in the mid-career group, they were more likely to be in a higher trajectory (OR = 1.8) than those in their early career in the four-cluster model. And clinicians in the late-career group were less likely to be in a higher trajectory (OR = 0.6) than those in the early-career group.
Discussion
Clinicians face distressing patient- and family-related situations in clinical care every day, but little is known about how to systematically describe those situations, particularly when caring for patients with serious illness and complex care needs. Thus, this study examined psychological distress trajectories of hospital clinicians with several important findings. First, APPs were more highly distressed than their physician counterparts. Second, all clinicians in the higher distress group reported more emotional symptoms. Finally, an unexpected cluster surfaced in those experiencing variable distress during the day. There are important practice and policy implications related to these findings.
There are several possible explanations for why APPs report more distress than physicians. Although APPs are considered autonomous providers, they still have responsibilities to their physician counterparts and the organizations in which they work. APPs may have higher distress due to workload, patient acuity, job responsibilities, and working within hierarchical systems. The APP role in the hospital is primarily clinical with little allocated time for other responsibilities such as administrative work and professional development. Moreover, technology-related stressors and the growing rise in incivility within the workplace add to the pressures and distress of clinicians. Emotional distress in APPs has not previously been studied for comparisons with our findings. And while moral distress has been studied among clinicians, most studies combine APPs with physicians37,38 or nurses 39 or they are entirely excluded. 40 It is important to recognize the unique roles that APPs have within hospital systems and understand the potential implications of emotional distress that they experience.
Clinicians in higher distress trajectories had more emotional—and physical—symptoms; in fact, each additional symptom increased the likelihood of being in a higher distress trajectory by nearly a factor of two. Psychological distress in seriously ill patients is associated with higher emotional burden in patients41–44 and physicians who report emotional exhaustion after a patient’s death, for example, may be more likely to experience burnout and other physical and emotional harms. 45 Moral distress can trigger negative emotions; however, there is little research on the physical symptoms associated with clinician distress.46–49 During the COVID-19 pandemic, there was increased awareness of the emotional and physical symptoms that clinicians experienced due to the extraordinary circumstances in which they found themselves.16,50–53 The frequency of symptoms we found is similar to a large study (n = 14,600 clinicians from the HERO Registry) during the first phase of the COVID-19 pandemic, with two notable differences: Here, clinicians in our study were more worried as compared with those in HERO and reported less physical pain in this sample when compared with the HERO sample. 16 More research is needed to understand the breadth of symptoms and patient- and family-related problems clinicians experience and the resources available to support them. In addition, there was a notable difference in years of experience, where mid-career clinicians were more likely to be in a higher distress trajectory than the early- and late-career groups. Although not statistically significant, this finding may have practical or clinical implications. Future work should examine the types of issues that lead to distress in this group and the reasons for their distress.
The variable distress cluster was a new and unexpected trajectory, as we hypothesized that typical trajectories may be low, medium, and high. Previous research on moral distress is primarily cross-sectional37,38,54–58; which overlooks nuance in a clinician’s day, especially for hospital-based clinicians working in a fast-paced, ever-changing environment and variable distress has not previously been described. Hospital clinicians must be ready for minute-to-minute and hour-to-hour changes in their patient’s status that can also affect their own decision-making and emotional responses to varying situations. Symptom science for patients and families encourages clinicians to assess distressing and depressive symptoms over time to provide more tailored interventions.59–63 This concept should also be applied to clinician distress research. We do not know whether the daily flux of emotions contributes to a sense of depletion, burnout, and loss of qualified clinicians. Future research should examine these issues.
Implications
There are important implications from this study for clinician well-being. From an individual perspective, clinicians, researchers, and administrative and policy leaders need to change how they think about clinicians’ well-being and distress. Currently, there is no universal prevention for clinician distress, nor is there a universal way to promote clinician well-being as evidenced by the variety of distress trajectories demonstrated in this study. However, the data give us a clue as to who needs the most support in dealing with high distress.
From an institutional perspective, it is essential to recognize that clinician distress is not necessarily related to caring for a particular seriously ill patient, although it might be. At times, the system is inefficient and creates barriers to quality care including shortages of staff, documentation burden, and communication gaps. At a system level, there is an opportunity to target interventions based on clinicians’ distress trajectory. Our findings suggest that work environment and perception of support may influence distress; yet, this requires more contextual understanding through qualitative inquiry. Moreover, based on the findings, APPs may require tailored support for their clinician distress. More research is needed to understand the sources of distress, to develop targeted interventions, and to replicate this work in broader populations.
Finally, reviewing and reevaluating APP staffing ratios and other issues related to their practice could help mitigate some of the distress this particular group was experiencing. Staffing remains a constant problem nationwide, and previous work establishing nursing staff ratios has reported higher levels of moral distress and burnout when nurses are overworked.64–66 Professional organizations should lobby for policies to address clinician distress and prevent downstream effects like burnout and turnover or other consequences (e.g., suicide). NAM 7 recognizes that clinician well-being is a priority and developed a national plan 67 that recognized seven priority areas for a healthy workforce (e.g., investment in research at the system level, creating a positive workplace climate, engaging in technology tools, and recognizing the value of well-being within organizational systems). NAM and other organizations must continue supporting policies that address clinician distress including psychological care and in-house resources, such as training, professional development, encouraging self-care activities, mentorship, supervision, and other system-level activities that promote workplace satisfaction.
Strengths and Limitations
This study has several strengths. Specifically, this brief longitudinal prospective study captures change in distress over time during a real clinical day with an adequate sample size spread across trajectories. We used a novel approach to examine emotional and physical symptoms in real time. By expanding the definition of distress that encompasses a multifactorial perspective, this study adds to the knowledge of psychological, spiritual, social, and physical distress that clinicians experience. An unexpected cluster surfacing from this study is the variable distress trajectory, which does not follow an expected course throughout clinicians’ work-life day.
This study should be interpreted in the context of certain limitations. First, this study was conducted within a single health care system without a comparison or control group and thus may not be generalizable. Other health care professionals, including nurses and social workers, experience distress, and clinicians in other geographical areas may have different experiences of distress or institutional resources. Future research could replicate the study in settings outside of the hospital, such as ambulatory care, long-term care, and hospice. Second, some participants did not complete all survey items; yet, we achieved an adequate sample size on clinician responses based on our preliminary power analysis. Third, we anticipated that clinicians may be reenrolled and may be caring for multiple seriously ill patients. While we welcomed clinicians to reenroll, this limited the analysis of specific patient-clinician dyads. Fourth, we recognize that this study has a short data collection period (over two consecutive days) which was chosen based on the average length of stay of patients (three to five days) on these general medicine units as well as typical shifts of physicians (week-long) and APPs (two to three consecutive 12-hour shifts). Fifth, this is a study measuring real-time distress and did not capture burnout, although we hypothesize a connection between distress and burnout. Future research should examine the relationship between clusters identified in this study and clinician-related outcomes such as job satisfaction, burnout, depression, and intent to leave one’s job.
Conclusions
Hospital clinicians are distressed and experience multiple emotional and physical symptoms. By understanding the unique trajectories of clinician distress, hospital leadership and researchers alike can partner to create short- and long-term interventions based on expected distress trajectories, and future research should start to examine these strategies. One in two clinicians is tired, stressed, and worried most of the time. Focusing on those more likely to be in a higher distress trajectory—APPs and mid-career clinicians—practical and scalable support and resources may help decrease distress, promote clinician well-being, and mitigate burnout, ultimately benefiting clinicians themselves, the patients and families for whom they care, and the institutions where they work.
Authors' Contributions
A.M.F.: Conceptualization, data collection, data analysis, writing—original draft, review & editing. S.H.M.: Conceptualization, writing—review & editing supervision. C.M.U.: Conceptualization, writing—review & editing, supervision. K.R.C.: Conceptualization, writing—review & editing, supervision. L.H.: Study data analysis, writing—methods and findings, review & editing. J.R.: Study data analysis, writing—review & editing. J.A.D.: Writing—review and editing. K.B.H.: writing—review and editing.
Footnotes
Acknowledgments
Author Disclosure Statement
No competing financial interests exist.
Funding Information
Research reported in this publication was conceptualized while AMF was supported by the National Institute of Nursing Research of the National Institutes of Health under Award Number T32NR009356. The content is solely the responsibility of the authors and does not necessarily represent the official views of the National Institutes of Health. Additional research funding from the University of Pennsylvania School of Nursing Office of Nursing Research. These authors report no conflicts of interests.