
Abstract
Objective:
Recent growth in hospice has raised concerns about variability in access and quality. This study examines U.S. county-level presence of hospice providers.
Methods:
Quality was assessed using 2023 Centers for Medicare & Medicaid Services Consumer Assessment of Healthcare Providers and Systems Hospice Survey Star Ratings. County-level sociodemographic characteristics were obtained from the U.S. Census Bureau’s American Community Survey 2023 five-year sample.
Results:
Of 7024 hospice providers, 29.2% had publicly available ratings, of which 55.3% were high quality (>3 stars). Of 3222 counties, at least one hospice provider was located in 41.4%, and a high-quality provider was present in 23.6%. Counties with high-quality providers tend to be urban and have higher income, larger populations, higher education, and lower poverty and uninsurance rates.
Conclusions:
Many U.S. counties have no hospice providers. The presence of high-quality care is markedly lower in rural and poor counties. Missing star ratings limit the utility of public quality data for patient and family decision-making.
Introduction
Hospice care aims to offer holistic support—physical, spiritual, and emotional—for individuals with terminal illnesses. Research has consistently demonstrated that hospice enrollment is associated with improved quality of life for patients near the end of life and their caregivers. Families of patients in hospice report greater adherence to end-of-life wishes, reduced psychological distress, and lower rates of prolonged grief compared to those that do not use hospice.1–4
Over the past two decades, hospice care in the United States has experienced significant growth, with the number of providers tripling from 2080 in 1998 to 7024 in 2023. 5 While the number of hospice providers available to serve the 1.72 million Medicare beneficiaries who enroll in hospice annually has increased, so too have concerns regarding financial pressures leading to poorer quality care and variability in care quality across different providers and populations.6–14
To enhance transparency and aid patients, families, and clinicians in making informed decisions about hospice, the Centers for Medicare & Medicaid Services (CMS) introduced the Consumer Assessment of Healthcare Providers and Systems (CAHPS) Hospice Survey Star Ratings System.15–18 These star ratings provide a standardized assessment of family caregivers’ experiences with hospice care. Public reporting of star ratings began in August 2022, offering consumers a way to compare hospice providers through the Care Compare website.19–21
Research on other areas of health care delivery and older research on hospice access have documented substantial geographic variation in provider availability at the county and community levels.22–27 Since prior national studies of hospice access, the market has changed substantially, with the introduction of publicly reported CMS quality measures and rapid growth in for-profit hospices. Understanding how publicly reported star ratings map onto the geographic distribution of hospice providers is critical for patients and families making end-of-life decisions and policymakers seeking to ensure equitable access to high-quality hospice care. To date, no study has used national hospice provider data with newly introduced CAHPS star ratings to assess the geographic location of hospice providers, including high-quality providers. This study (1) provides a county-level analysis of hospice provider presence and (2) examines associations between county-level sociodemographic characteristics and the location of highly rated hospices.
Methods
Study overview
We conduct a cross-sectional study to assess geographic and sociodemographic disparities in the presence of high-quality hospice care across U.S. counties. We define high-quality care based on publicly reported CAHPS Hospice Survey Star Ratings and link provider-level quality data to county-level demographic and geographic characteristics. Our approach maps the distribution of hospice provider sites, calculates populations with limited county-level high-quality provider access, and compares sociodemographic characteristics across counties.
Data sources
This study combines hospice provider and area-level demographic data. First, we use the CMS Hospice Care Archived Data Snapshots, which provide hospice location and characteristics from 2023. 28 The Archived Data Snapshot reports registered hospice provider locations as listed with CMS, with each entry reflecting a reported hospice site rather than an inferred service area. Counties without a reported hospice site may be served by a hospice located in another county, but for this study, we are only able to measure the presence or absence of at least one registered hospice site in a given county. To assess quality, we use CAHPS Hospice Survey Star Ratings, based on the 47-item Hospice Survey evaluating caregiver experiences across eight measures.9,11,28 Each measure receives a 1–5-star score, producing an overall weighted star rating. 17 Hospices must have at least 75 completed surveys over the 8 previous quarters to receive a rating.17,18 Thus, some hospices may be too small or too newly established to have met the threshold data requirement. We classify hospices with a star rating greater than 3 as high-quality.
Second, we analyze county-level demographic data from the U.S. Census Bureau’s American Community Survey (ACS) 2023 five-year sample. 29 We assess rurality based on the U.S. Department of Agriculture’s Rural Urban Continuum Codes. 30 After conducting a conceptual review of hospice and palliative care disparities based on Nelson et al. (2021), we selected key sociodemographic factors, including age, race, education, socioeconomic and insurance status, and rurality. 31
Statistical analysis
We first map the reported locations of hospice providers across counties. Specifically, we generate maps showing (1) counties with at least one hospice provider site and (2) counties with at least one high-quality hospice provider site (defined as a star rating greater than 3). Next, we describe the distribution of star ratings among all hospice providers nationally, including those without a reported rating. We also classify each county by the highest available hospice star rating.
To assess sociodemographic differences, we compare counties with at least one provider site rated high quality to counties without a high-quality hospice provider site reported in the CMS data. Two-sample t-tests are used to compare population size, income, education, insurance coverage, poverty, racial/ethnic composition, and rurality across these groups.
Results
In the February 2025 CMS Hospice Care Data Snapshot release, 7024 hospice providers were identified, but only 2049 (29.2%; Fig. 1) had an available quality rating. Among those rated, 1134 providers (55.3%) met the high-quality threshold. A total of 3222 counties were included in the geographic analysis (Fig. 1). In total, 1335 counties (41.4%) had at least one hospice provider site, while 1887 (58.6%) counties had none at all. Among the counties with hospice provider sites, hospices with a high-quality rating were located in only 762 (57.1%; Fig. 1B). An additional 183 (13.7%) counties contained only hospice providers with a quality rating below three stars, and 400 (29.2%) counties had only providers without reported CAHPS star ratings, reflecting limitations in quality data availability.
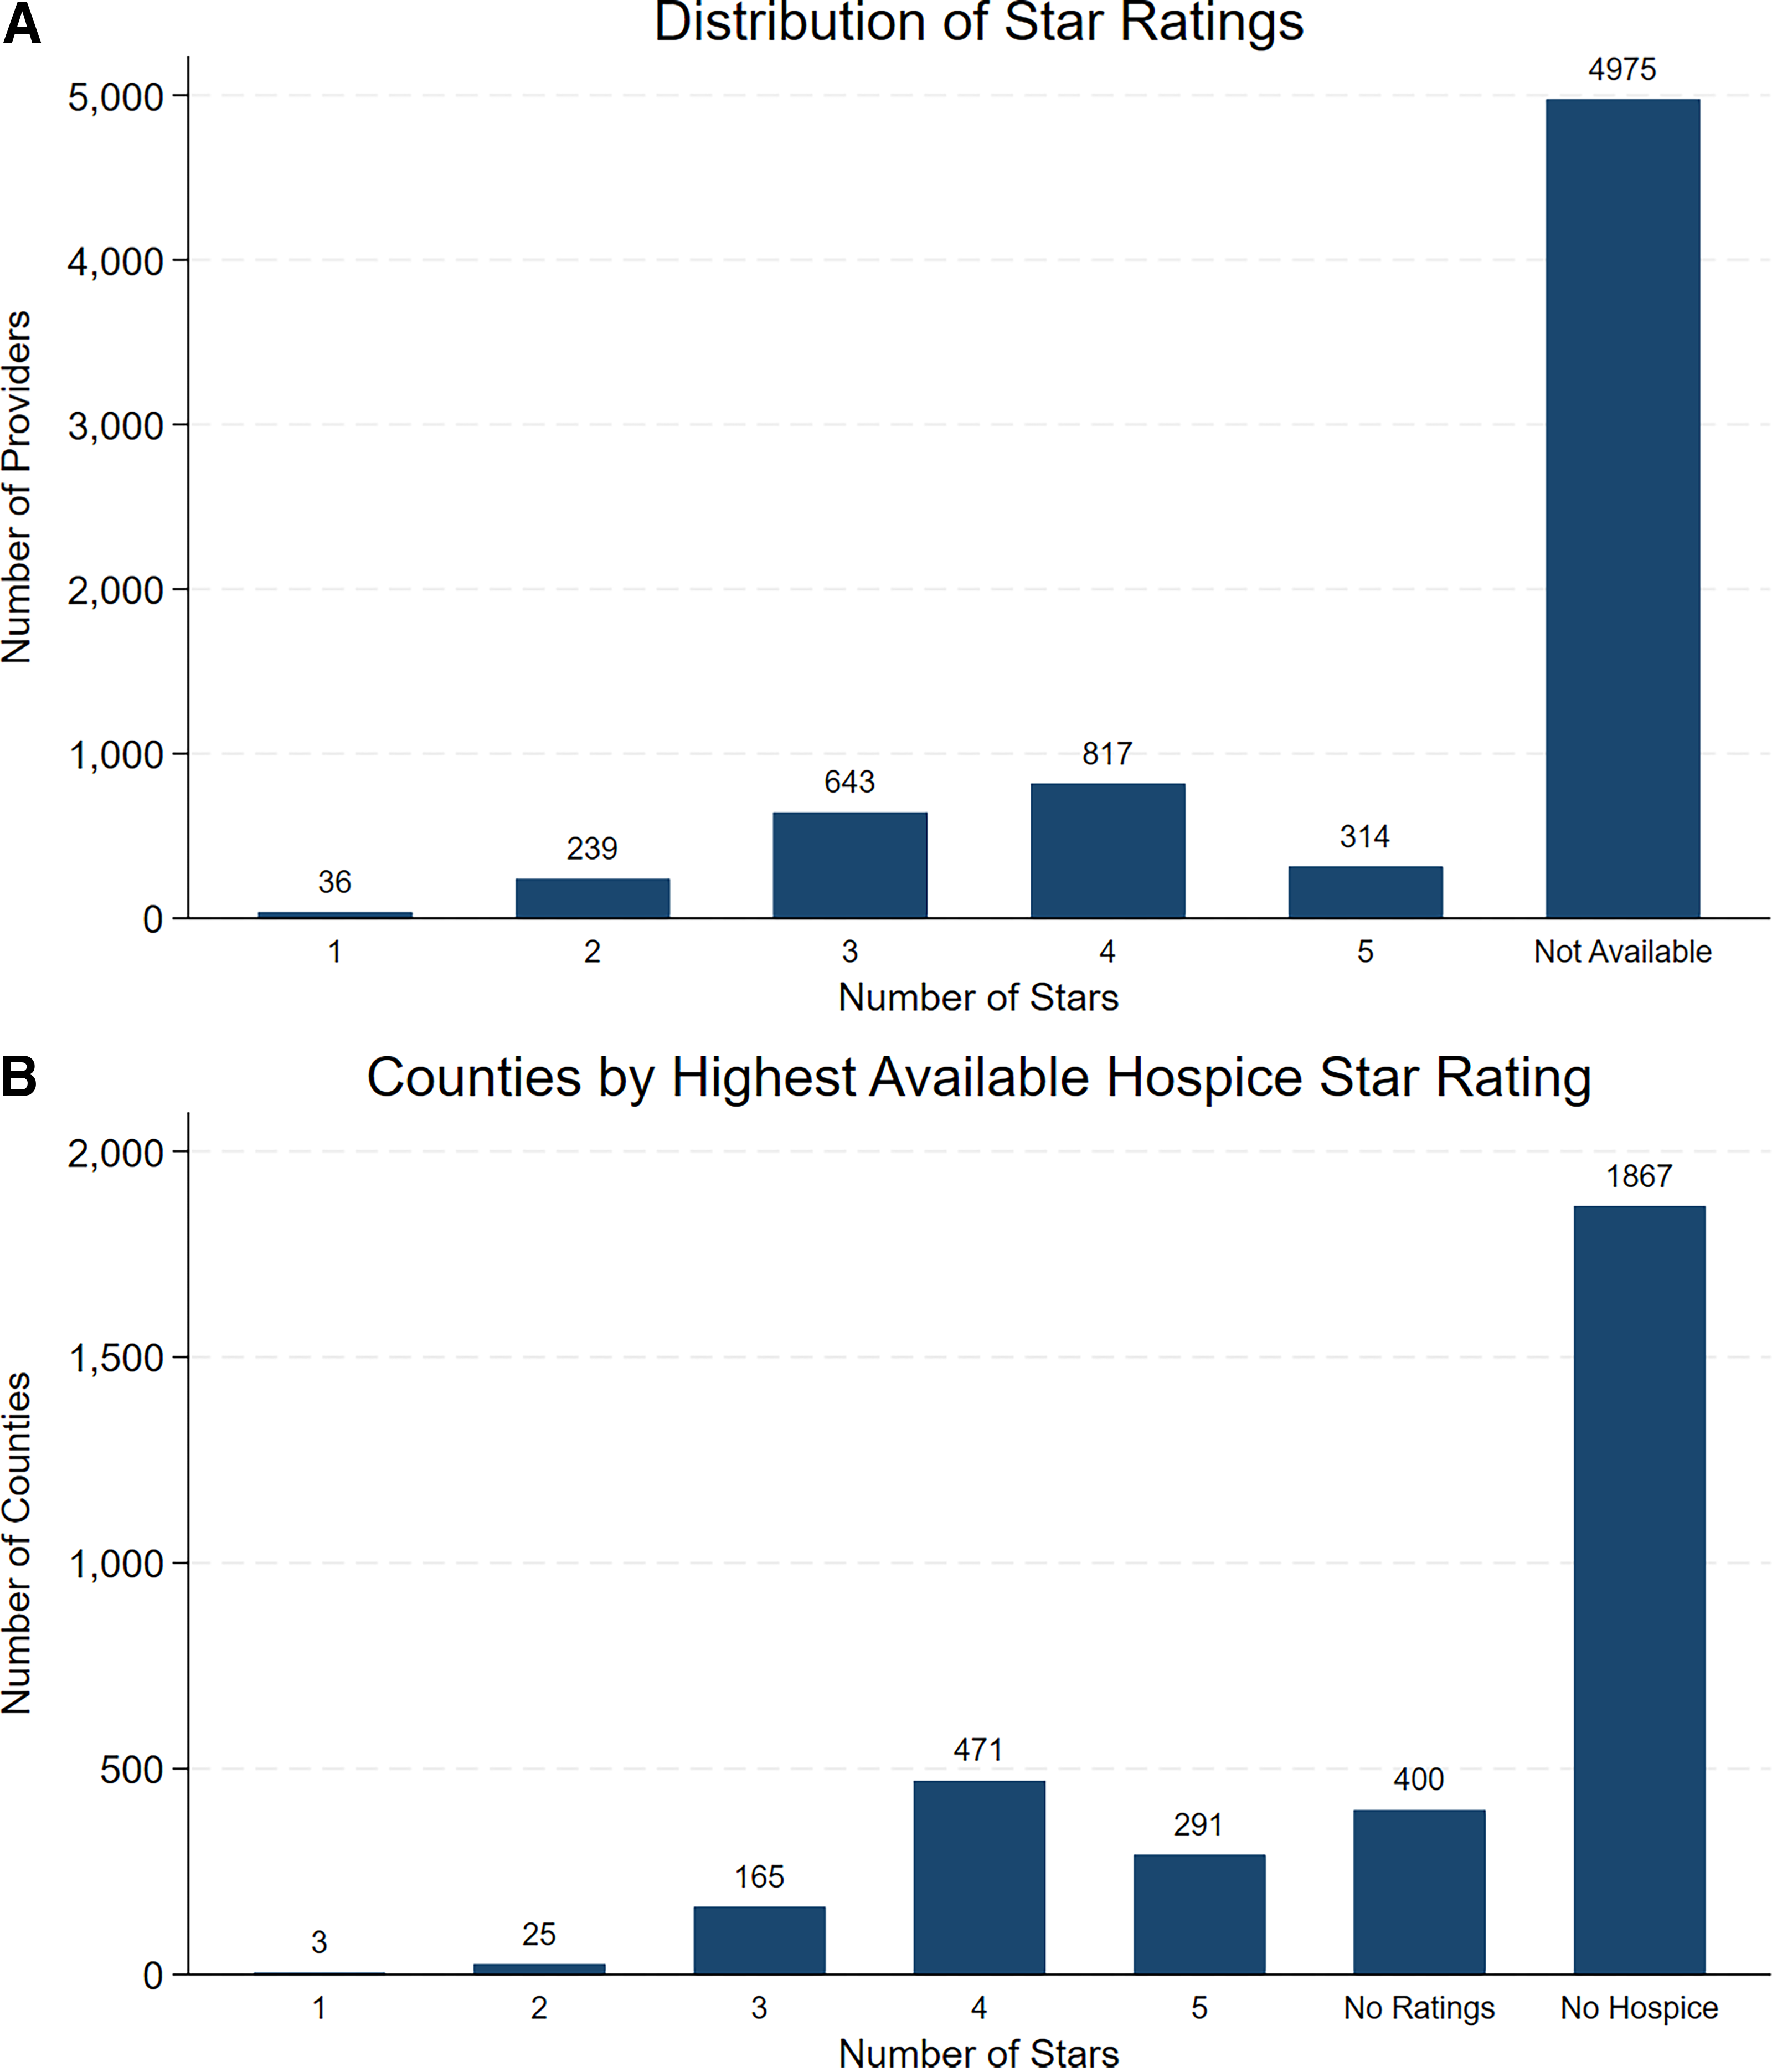
Distribution of CAHPS Hospice Survey Star Ratings, 2023. Panel A shows the distribution of star ratings among hospice providers in the United States (n = 2,049), based on the Consumer Assessment of Healthcare Providers and Systems (CAHPS) Hospice Survey, with ratings ranging from 1 (lowest) to 5 (highest). Panel B displays the highest-rated hospice provider available in each U.S. county in 2023, illustrating variation in hospice quality ratings.
Hospice providers are unevenly distributed across the United States, with many counties lacking any hospice provider registered site (Fig. 2A). In counties where hospices are located, even fewer are sites for providers with high-quality CMS ratings (Fig. 2B). Based on population estimates from the ACS, 29 22.4 million adults aged 65 and older (36%) live in counties without a reported high-quality hospice provider site.
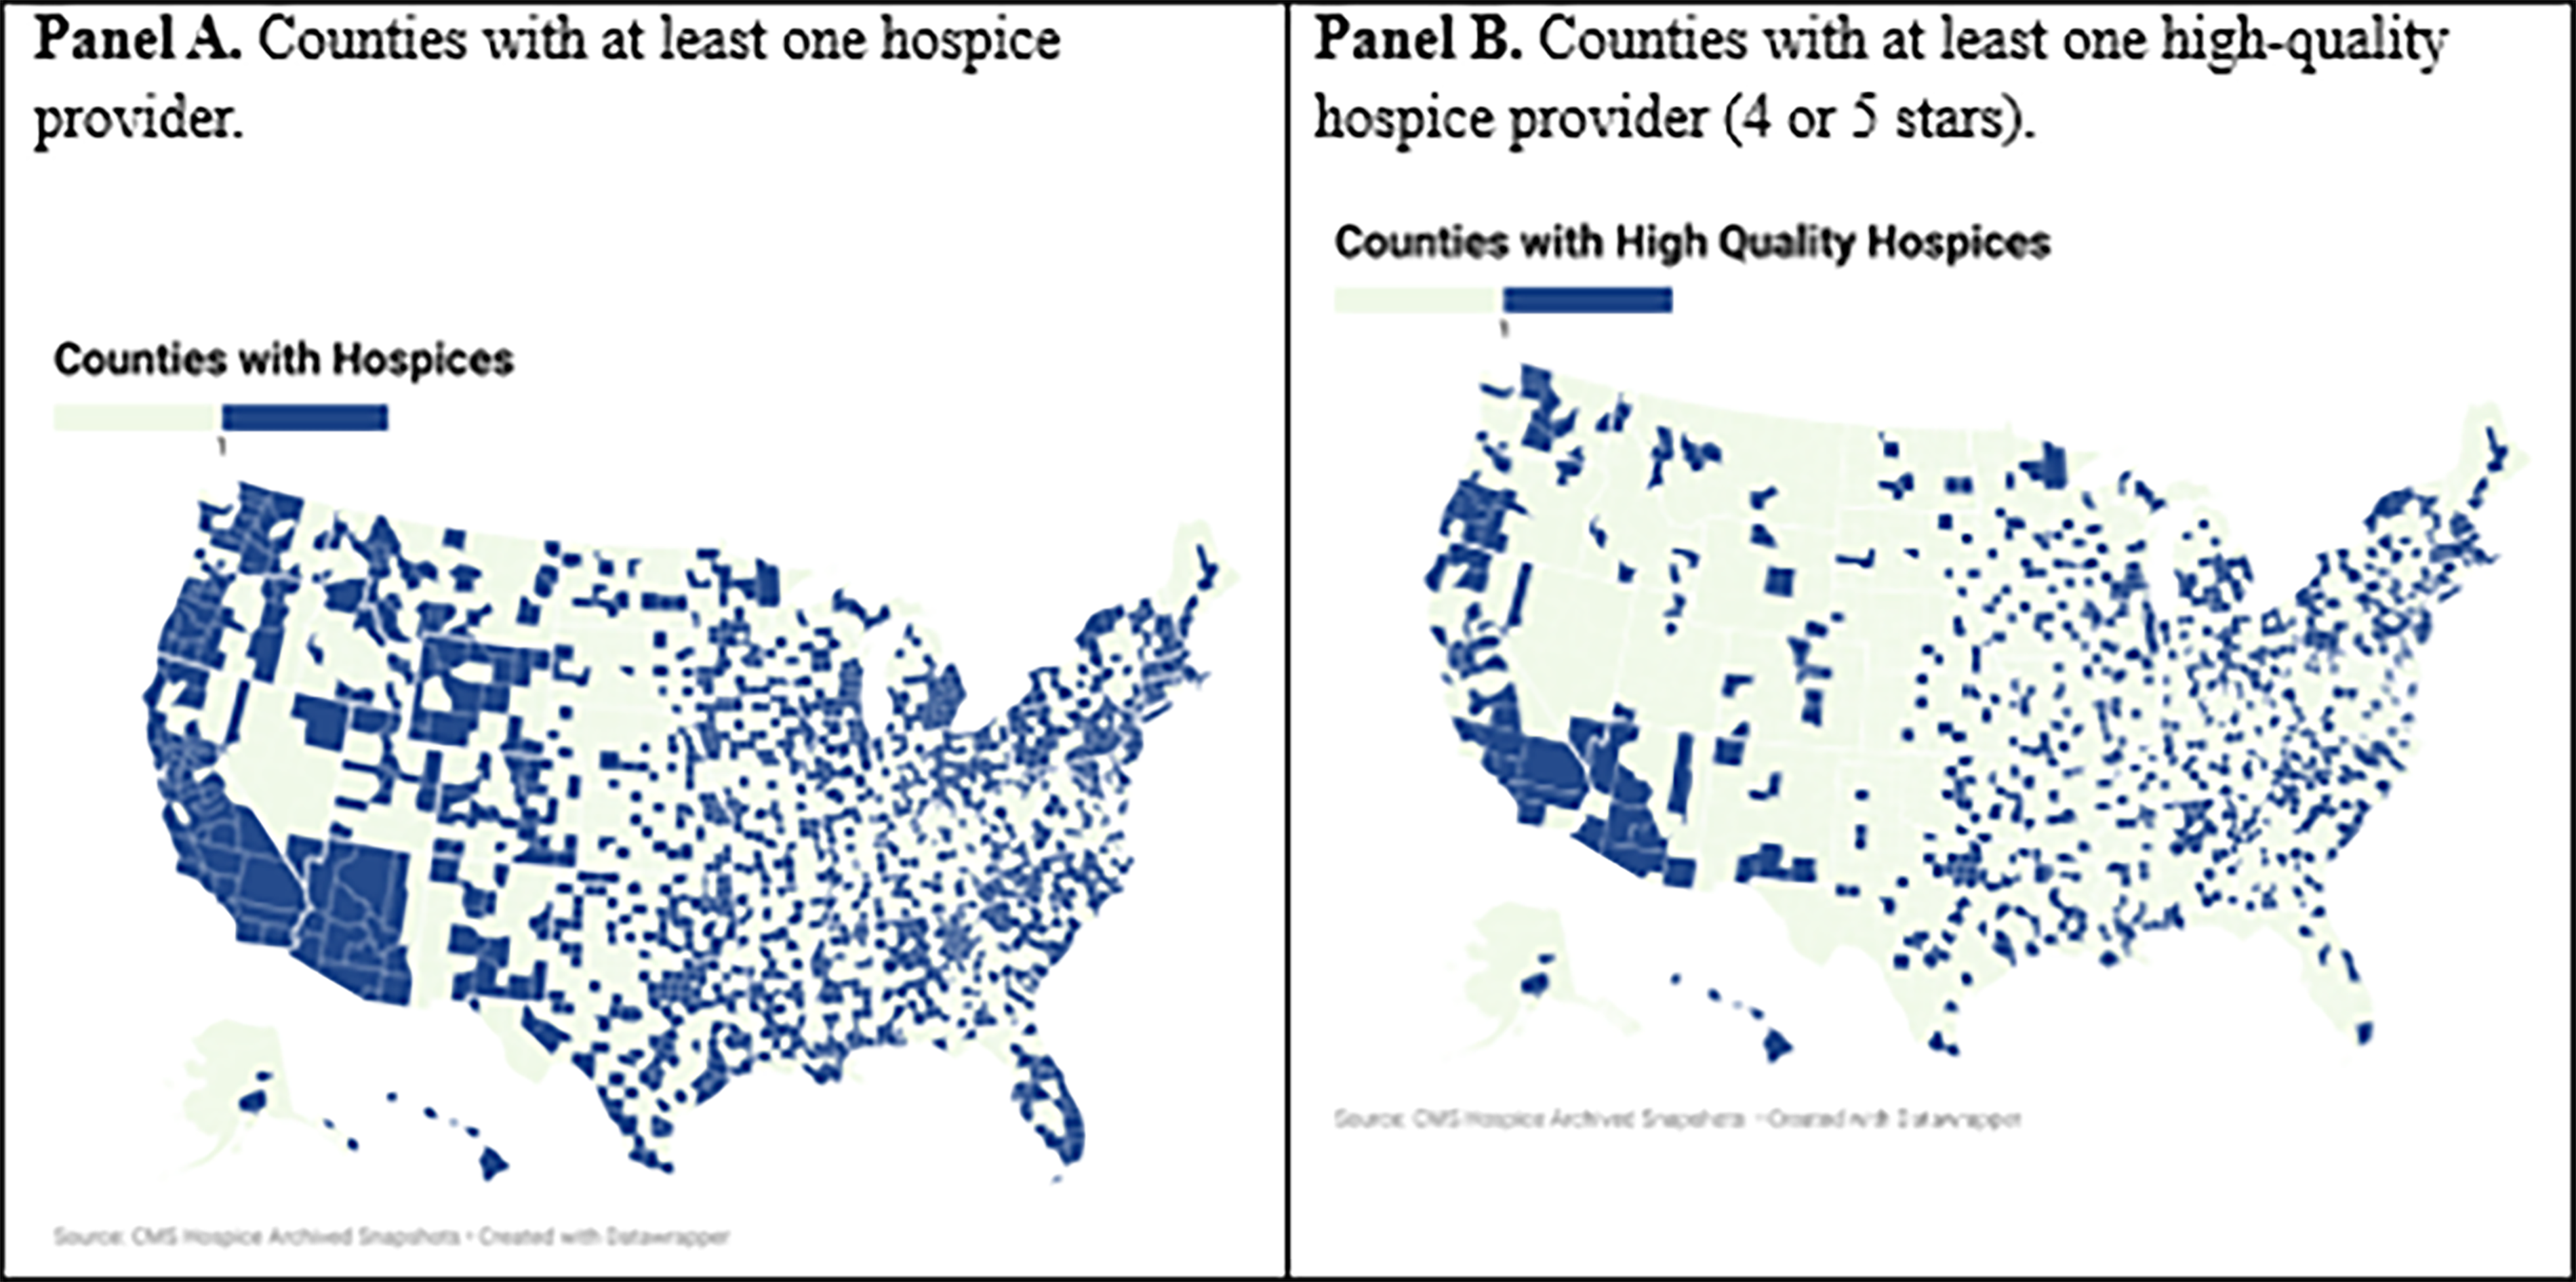
Availability of any hospice provider and high-quality hospice provider by county, 2023. Panel A displays U.S. counties with at least one hospice provider (blue) and those without any hospice provider presence (green) based on CMS Hospice Archived Snapshots (n = 3222 counties). Panel B shows counties with at least one high-quality hospice provider (4 or 5 stars; blue) and counties without any high-quality hospice provider (green), illustrating geographic disparities in access to high-quality hospice care.
Demographic differences
Counties in which a high-quality hospice provider is located differ significantly from those without high-quality providers across several sociodemographic and economic dimensions (Table 1). On average, counties in which high-quality hospice providers are located have larger populations (273,796 vs. 51,630; p < 0.0001), higher income per capita ($37,835 vs. $33,691; p < 0.001), and greater median household income ($70,889 vs. $63,236; p < 0.001) compared to those without high-quality hospice sites. They also exhibit lower rates of poverty (13.2% vs. 14.8%; p < 0.001), uninsurance (8.3% vs. 9.4%; p < 0.001), and lower shares of residents without a high school degree (6.8% vs. 8.4%; p < 0.001). In counties with known high-quality hospice provider sites, the proportion of White residents (74.7% vs. 77.3%; p = 0.001, and Hispanic residents (10.8% vs. 12.7%; p = 0.020) is significantly lower than in counties without.
Sociodemographic Differences in Counties with and without High-Quality Hospice Providers, 2023 a
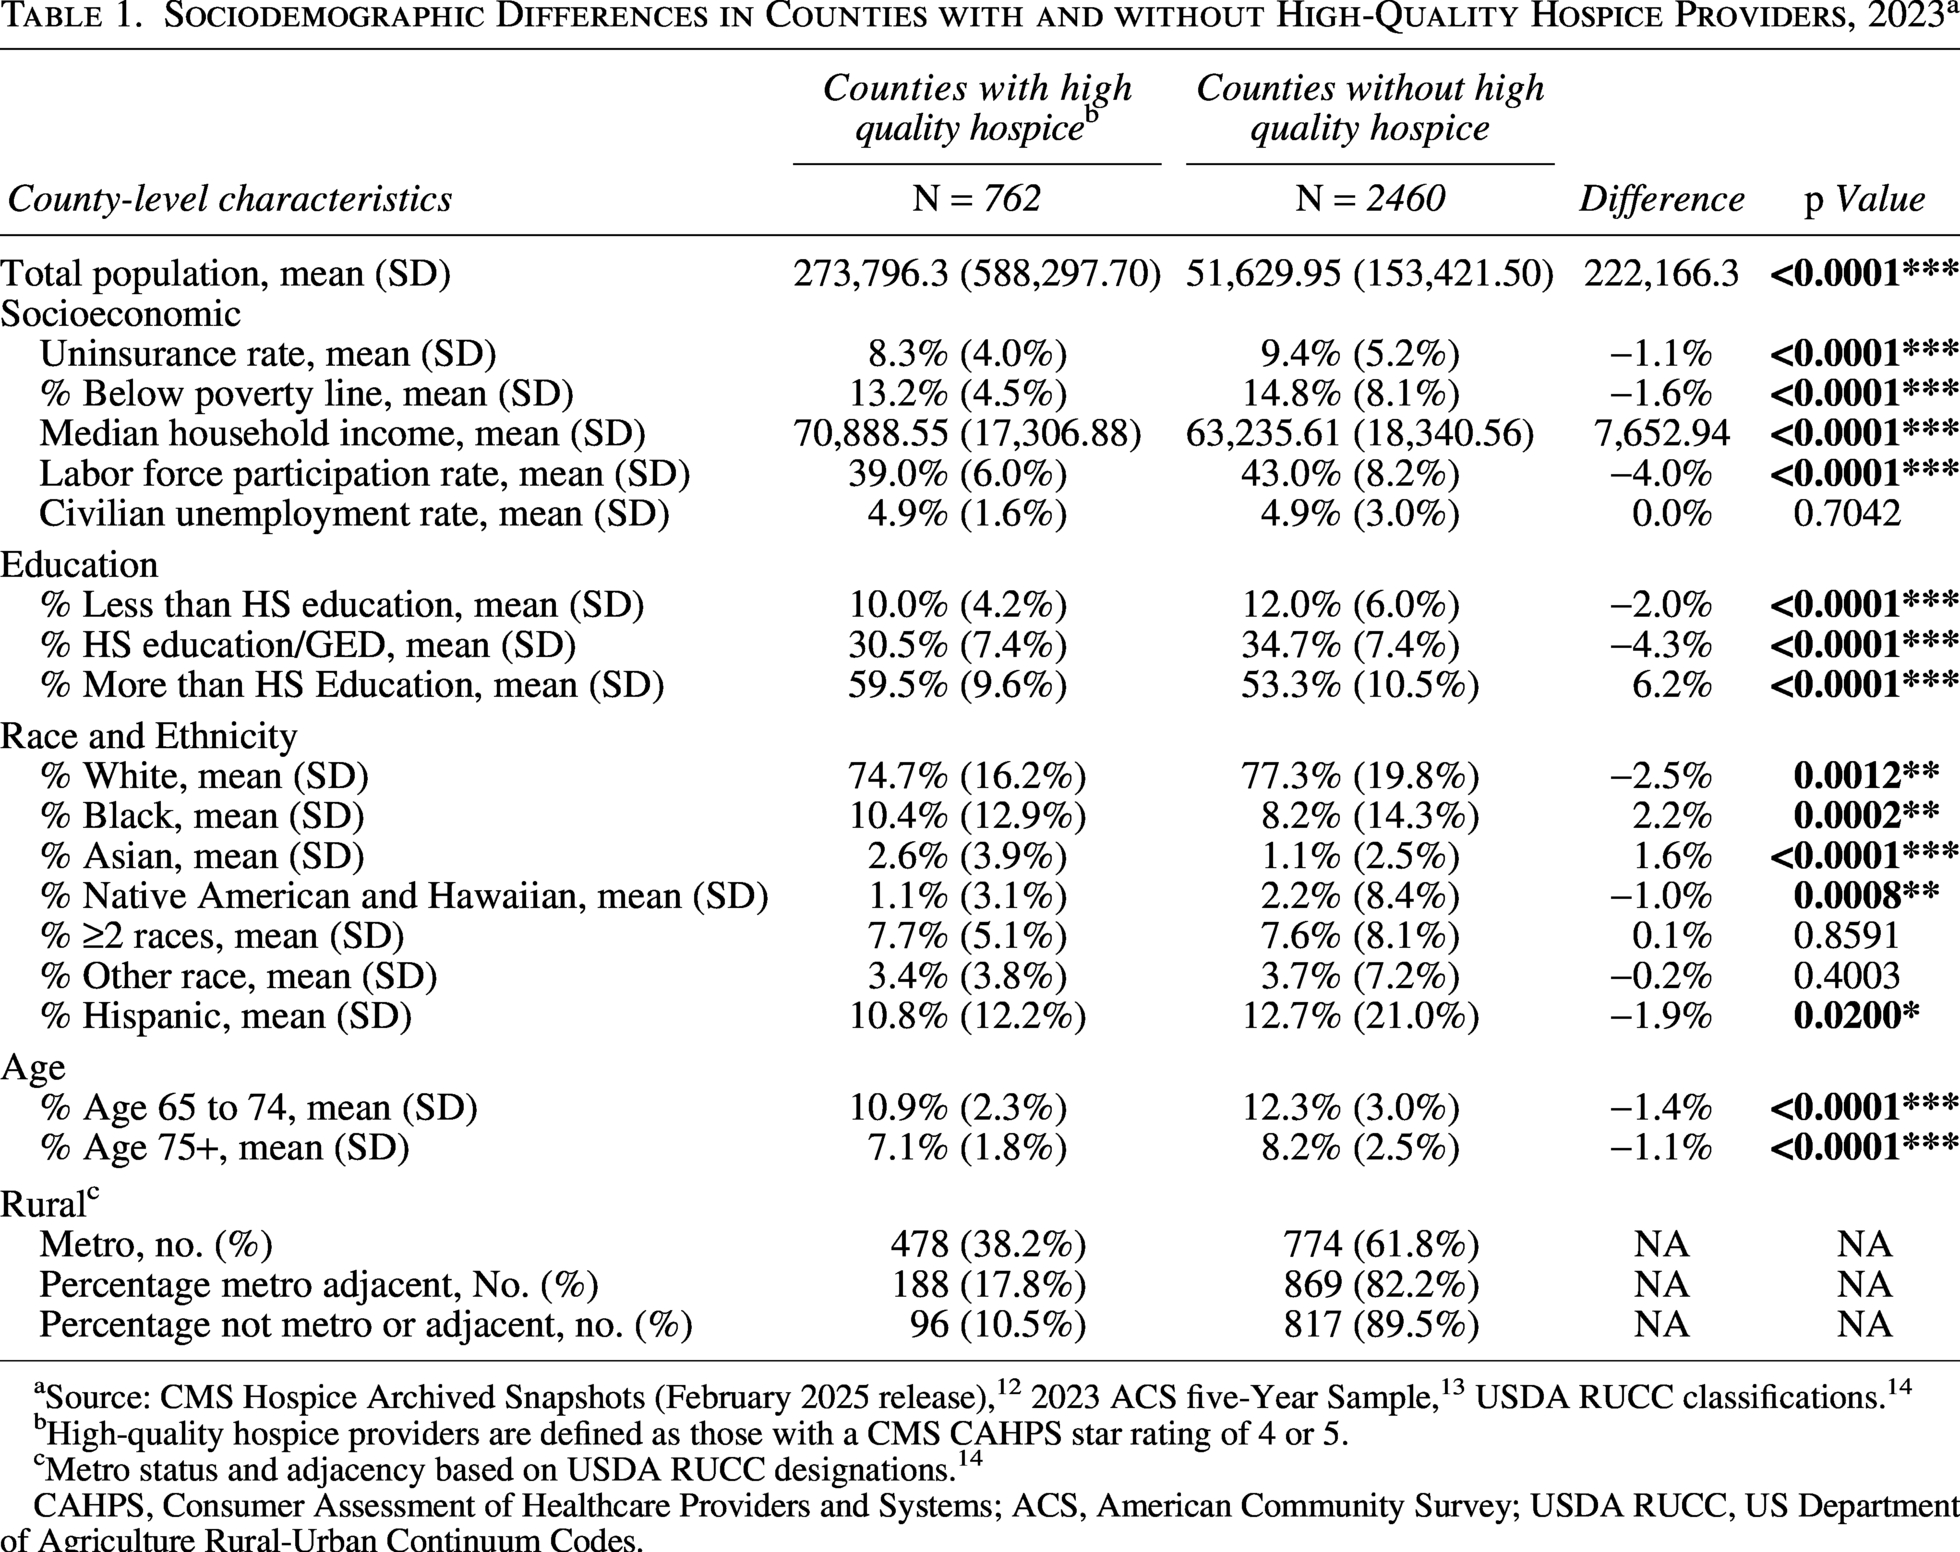
Source: CMS Hospice Archived Snapshots (February 2025 release), 12 2023 ACS five-Year Sample, 13 USDA RUCC classifications. 14
High-quality hospice providers are defined as those with a CMS CAHPS star rating of 4 or 5.
Metro status and adjacency based on USDA RUCC designations. 14
CAHPS, Consumer Assessment of Healthcare Providers and Systems; ACS, American Community Survey; USDA RUCC, US Department of Agriculture Rural-Urban Continuum Codes.
Among counties that are neither metropolitan nor adjacent to a metropolitan area, 89.5% lacked a hospice provider site with a high-quality star rating. Similarly, among counties adjacent to metropolitan areas, 82.2% lacked a highly rated hospice provider site. Even among metropolitan counties, 61.8% lacked a high-quality hospice site.
Discussion
This study examined the geographic location of highly rated hospice providers using CMS’s CAHPS Hospice Survey Star Ratings and assessed sociodemographic differences between counties with and without high-quality hospice provider sites. We found that the location of high-quality hospice providers is disproportionately concentrated in wealthier, urban counties, leaving millions of older adults in rural or socioeconomically disadvantaged areas without either high-rated providers or transparent quality data. Our findings underscore disparities in geographic location of hospice providers with high-quality ratings, possibly reinforcing geographic and sociodemographic disparities in access to high-quality end-of-life care.
The concentration of high-quality hospice providers in urban areas may reflect market demand, which enables participation in quality reporting. In contrast, rural and smaller providers may lack overall capacity to engage in quality measurement, further widening information and access gaps. 32 These findings reflect broader patterns in the U.S. health care system, where the location of high-quality specialty care is more common in urban, higher-income areas, compounding other inequities.33–36
The CAHPS Hospice Survey star ratings were designed to improve hospice evaluation and decision-making for patients and families. However, reporting rates below 30% limit the usefulness of CMS data for informing patient and family decisions. 21 Improving quality reporting compliance could help reduce disparities and support more informed choices about end-of-life care.
This study has several limitations. First, our classification of high-quality hospices is based solely on CMS CAHPS star ratings. Missing data are not random—providers without star ratings may differ systematically from those with reported data with respect to care quality.19,37 New hospice facilities and those that served under 50 survey-eligible patients are also exempt from reporting CAHPS quality data for a year or lack sufficient completed surveys for public reporting. 38 In addition, our analysis relies on county-level data, which may not serve as an adequate catchment area. The absence in a given county of a hospice provider location does not mean the complete absence of hospice care in that county, as many hospices serve more than one county. Finally, while caregiver experiences are crucial indicators of patient-centered care, CMS ratings do not account for clinical outcomes. To date, star ratings remain the most accessible and standardized measure of hospice quality available, and the lack of robust reporting restricts patients from making informed choices.
This study highlights inequities in U.S. hospice care. High-quality hospice providers, as identified by CMS star ratings, are disproportionately located in counties that are wealthier, more urban, and less socioeconomically disadvantaged. In addition, there are many counties in which hospices reporting no star ratings at all are located—leaving patients without information necessary to evaluate end-of-life care options. As public-facing quality measures become increasingly central to health care, accurate and consistent reporting is essential to ensure that all patients can make informed choices about end-of-life care.
Authors’ Contributions
All authors meet the International Committee of Medical Journal Editors (ICMJE) criteria for authorship, have approved the final article, and agree to be accountable for the work presented. J.W.: Data curation, formal analysis, and writing—original draft. H.S.: Data curation, and writing—review and editing. L.S.: Supervision, writing—review and editing, and funding acquisition. Y.S.: Supervision, writing—review and editing, and funding acquisition.
Footnotes
Author Disclosure Statement
No competing financial interests exist.
Funding Information
This project was supported by NIH grant P30CA047904 awarded to UPMC Hillman Cancer Center. Dr. Schenker was supported by K24AG070285.