
Abstract
Recently, evidence-based community policy approaches to preventing substance use and alcohol abuse, called environmental strategies, have gained in popularity. The environmental survey instrument (ESI) was developed to evaluate perceptions around drinking and related problems. Specifically, the authors were interested in assessing community perceptions about prevention practices. The 53-item self-report survey tool collects data on alcohol consumption patterns and risky behaviors such as drinking-while-intoxicated (DWI) rates. Data from the ESI collected through phone survey methods in 2008 were used for scale development analysis. The α for the total 53 subscale items on the ESI was .73. Overall, the results from the correlation matrix showed high levels of statistical significance with many items reporting p values less than .001. Additionally, an exploratory factor analysis (EFA) was conducted to examine the conceptual linkage across items in the instrument subscales. The EFA showed a link between previously theorized intervening variables and statistically derived factors. The results of the ESI study were encouraging, and findings from it can help inform future research on measurement of environmental strategies.
A significant portion of youth in the United States (Age 12–17) has used alcohol and other drugs. The most recent National Survey on Drug Use and Health (NSDUH, 2009) indicates that rates of binge drinking (five or more drinks) in underage youth is a concern, with large increases between 7th grade (1.6% of 12- and 13-year-olds), to more than one third (34.7%) by high school graduation (18- to 20-year-olds). Alcohol use by youth is linked to poor outcomes, such as inadequate- school performance, lack of family bonding, relationship issues, behavioral problems, and other consequences (Ferrer-Wreder, Stattin, Lorente, Tubman, & Adamson, 2003; Grunbaum, Lowry, & Kann, 2001; Hawkins, Catalano, & Miller, 1992). Economically, the costs of alcohol use and its related consequences in U.S. communities add up to more than $235 billion annually (Rehm et al., 2009).
Addressing alcohol abuse through only one strategy (such as a single direct service prevention intervention only) is less effective than taking a broader approach that includes the larger community (Rousseau & House, 1994; Stokols, 1996). In the last decade, community policy and enforcement approaches have gained in popularity, called environmental strategies (Birckmayer et al., 2004; Holder et al., 2000). These multicomponent strategies are rooted in ecological approaches that promote a systemic approach to solving issues recognizing that individuals operate within, and are affected by, an “environment” (Hawley, 1950). Within this framework, change is achieved through targeting community variables that are directly correlated with substance use consequences (Birckmayer et al., 2004).
Environmental strategies generally target contributing factors, also known as intervening variables. In Birckmayer, Holder, Yacoubian, and Friend’s (2004) general causal model, seven intervening variables were empirically connected to alcohol, tobacco, and other drug (ATOD) use. Other researchers have also described these factors, including pricing, promotion (Osterberg, 1995; Stockwell, Lang, & Rydon, 1993), retail access (Treno, Parker, & Holder, 1993), social access (Wagenaar et al., 1996), enforcement, perceived risk (Voas, Holder, & Gruenewald, 1997), and social norms (Holder et al., 1997). The RAND Corporation’s “Preventing Underage Drinking” (2007) highlights a number of evidence-based environmental strategies that can influence these intervening variables, including responsible beverage service training, alcohol compliance checks, happy hour restrictions, reduction of outlet density, sobriety checkpoints, social host laws, keg registration, and increased taxing on the sale of alcohol (p. 29).
Environmental strategies have been examined in a number of community-based research efforts. For example, Project Northland found a significant reduction in cigarette and marijuana use through the use of an integrated community approach for middle schools (Perry et al., 1996). The Midwestern Prevention Project, an environmental approach that used mass media, school programs for youth and families, and policy changes to address substance use, showed similar reductions in alcohol, cigarette, and marijuana use (Pentz, 1998). Holder and colleagues (1997) also found a reduction in alcohol sales to minors through environmental approaches in the prevention of alcohol trauma: community trials.
Although considered an important component of effective prevention planning, measurement of environmental strategy outcomes is difficult given the lack of experimental control. While advances have been made in the development of surveys to measure individual-level change, such as in the Youth Risk Behavior Survey (YRBS; Bener et al., 2004) and the NSDUH, little research has been conducted to assess environmental approaches to prevention strategies. To begin addressing this gap, the authors developed the environmental survey instrument (ESI). The current article reports on the largest validation study of the ESI, and offers recommendations for further refinement and, ultimately, more valid measurement.
The Environmental Survey Instrument
The development of the ESI was funded through the Strategic Prevention Framework State Incentive Grant (SPF SIG), awarded to the State of Texas, Department of State Health Services (DSHS) in 2004 by the Substance Abuse and Mental Health Services Administration’s ( SAMHSA ) Center for Substance Abuse Prevention (CSAP). Utilizing a five-step strategic planning process, the SPF SIG is one of the first federal attempts at ensuring that substance abuse prevention efforts are conducted in a data-driven manner. In Texas, 10 community coalitions in 7 counties were subrecipients of the SPF-SIG funding and implemented an environmental strategy to reduce underage and college age binge drinking. Their progress was evaluated in part through the use of the ESI.
The ESI was developed as a quantitative approach to evaluating the Texas program, as no standardized instrument was available for use. Specifically, as part of the state-level evaluation, the authors were interested in assessing the extent to which perceptions about broad community-based prevention norms and practices were affected after environmental strategies were implemented. We were also interested in developing an evaluation tool that would assess the perceptions of both legal-aged adults and underage consumers of alcoholic beverages.
ESI Item Development
The ESI was developed in order to assess change in the seven intervening variables described above, and help to determine if environmental strategies implemented by the 10 target communities were effective. Items and subscales of the original 2003 draft version were based upon a comprehensive review of previous empirical research (for further examples, see Gruenewald, Johnson, & Treno, 2002; Holder et al., 2000) and extensive consultation with an expert in environmental prevention approaches, Dr Andrew Treno (personal communication, December, 2003).
The original 2003 draft of the ESI included 27 items in a self-report survey. It collected data on consumption patterns and related risky behaviors. As an example, the availability subscale items asked how difficult or easy it is to get alcohol at a wide range of places such as family and friends’ homes and events, stores, and restaurants. Enforcement items asked about familiarity with school and local ATOD policies. The perception of risk items pertained to family, friends, and other social sanctions.
ESI Pilot Testing
The ESI was pilot-tested in Dallas in September 2003, with a convenience sample of youth aged 11–18, with 30 questionnaires completed at a drug prevention program, and 28 completed at a traditional high school (N = 58). Males comprised 58% of the sample. Latinos accounted for 55% of the sample, followed by African Americans (37%) and Caucasians (8%). Over 90% of the pilot sample was between 12 and 17 years of age, with a range of 12–18. The goal of pilot-testing was twofold: (a) to ensure most persons with a middle or high school education could understand the survey; and (b) to seek input from participants and community-based evaluators on improvements to the instrument. The ESI was piloted by being read to participants aloud, as a precursor method to later, telephone-based interviews. Additionally, community-based evaluators from the project target areas were given the opportunity to offer feedback on the pilot measure.
Based upon the results of the pilot testing, comments from community-based evaluators and Cronbach’s α coefficient reliability analyses, a number of additions were made to produce the current version of the ESI. First, subscales were added to better measure access. For instance, under the scale for “access,” three subscales were articulated (operationalized) to ensure that social access (i.e., alcohol obtained through friends), retail access (i.e., alcohol obtained through business outlet), and perceptions of access (i.e., how easy or hard it is to access alcohol if the youth desires) were measured more accurately. For “social norms,” the concepts were further articulated as community norms, individual norms, peer norms, and family norms. In the final ESI, there are 10 subscales related to the 7 conceptual intervening variables. Additionally, items were included from the National Highway Traffic Safety Administration (NHTSA) community survey to better assess behaviors related to drinking and driving. Finally, questions on past 30-day alcohol use patterns from the SAMHSA/CSAP National Outcomes Measures program were included.
ESI Scale Descriptions
The final ESI instrument can be found in Appendix A found online at http://aje.sagepub.com/supplemental. Several questions are directly associated with the seven intervening variables. For example, items listed under Question 15 were associated with Social and Retail Access. Social Access were associated with 6 items listed under Question 15 beginning with friends, family members, parties, home, friend’s home, and someone who bought alcohol for them, while Retail Access was associated with the remaining 5 items listed as restaurant or bar, grocery store, liquor store, convenience store, sporting events, or games. Both constructs were combined under the category of Perceived Access. Perceived Risk included 6 items listed under Question 17. Community Norms contained 5 items listed under Question 24; Individual Norms (disapproval of use) contained 5 items listed under Question 25; Peer Norms were associated with the 5 items listed under Question 26; Family Norms were associated with the 5 items listed under Question 27; Knowledge of Legal Consequences contained 4 items listed under Question 20; Perceived Enforcement contained 4 items under Question 21; and Perceived Physical Harm was comprised of 3 items under Question 31.
Method
Sample
The sampling design was purposive and aimed to obtain representative responses from young adults aged 18 to 25 years residing in 1 of the 10 SPF-funded coalition communities. Sample quotas in proportion to regional population data were taken from the U.S. Census (2000). Sample quotas were based on demographic variables including (a) the total population for each of the 10 regional subsamples, (b) the percentage of population 18–20, and (c) the percentage of the population 21–25. This sampling approach would allow for inquiry about legal-aged and underaged drinking and perceptions in the 10 target areas, although not the focus of the current article. The ESI was translated into Spanish in order to maximize participation of non-English-speaking respondents. One primary purpose of the study survey was to obtain a baseline to use as an initial benchmark for the seven intervening variables, alcohol consumption, and related behaviors. For the purposes of this scale development study, only data collected with the final ESI version were assessed.
The evaluation team used commercially available listed sample information on the 10 target areas and combined this with a random-digit dialing phone survey technique. A large Texas University provided computer-assisted telephone interview (CATI) facilities and student interviewers to conduct the telephone surveys. All interviewers were trained by a PhD-level researcher and supervised throughout the data-collection period. Primary data collection was conducted between September 8, 2008, and November 15, 2008. During that time 12,831 calls by telephone were made using a three-call rule, with 3,542 contacts established with individuals who met inclusion criteria. The refusal rate among those contacted was approximately 43.5%, and 4% of the respondents terminated the interview before it was completed. Only completed interviews (approximately 53% of total established contacts) were used for data analysis (N = 1,876).
Sample Demographics
Responses from the phone survey of young adults ranging in age from 18 to 25 years and were comprised of 45.7% Whites, 8.3% African Americans, 32.3% Hispanic Americans, 5.3% Asians, and the remaining 8.5% comprised of Native Americans, Alaskan Natives, mixed-race, or another race. In all, 18- to 20-year olds made up 44% of the sample, with the remaining 56% comprised of participants of age 21 to 25 years. Females made up 61% of the sample, while males made up the remaining 39%. Additional demographic characteristics can be seen in Table 1. In terms of education, 94% had graduated from high school with a little over half (52%) reporting that they were currently attending college.
Demographic Characteristic of Sample (N = 1,876)
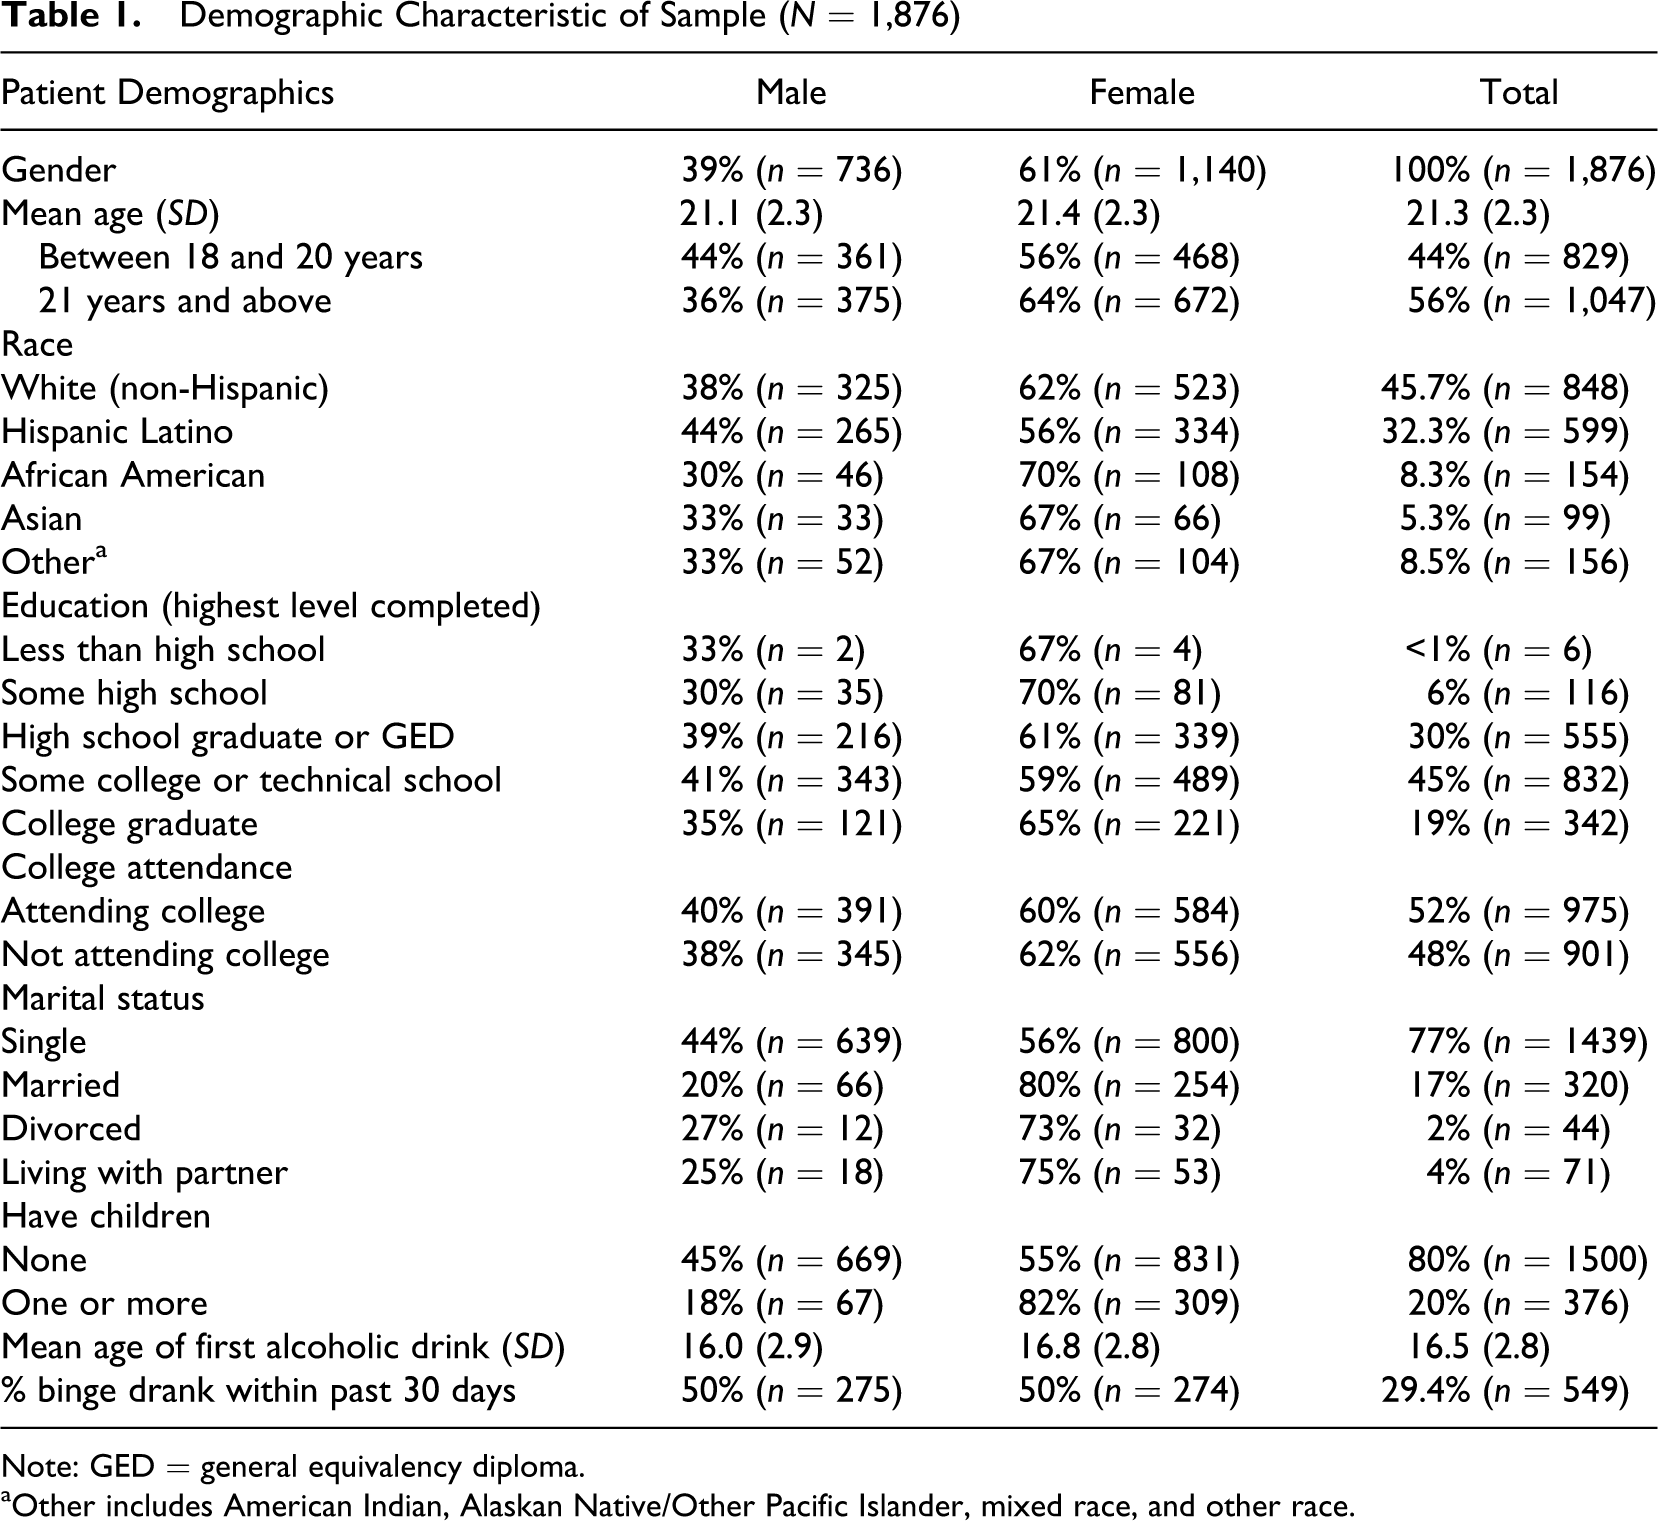
Note: GED = general equivalency diploma.
aOther includes American Indian, Alaskan Native/Other Pacific Islander, mixed race, and other race.
Results
The first step in our analyses was to test for significant difference between groups and identified some variation between subgroups, as shown in Table 1, below. Among young adults (21–25), there were significantly more females than males. There were also significantly more females who were married, living with a partner, or divorced, when compared to men, who were mostly single. Also, more women than men reported having one or more children. In the area of education, women reported higher levels of education than men overall.
Scale Reliabilities
Internal consistency based on Cronbach’s α was conducted on the ESI data using SPSS (see Table 2). Each of the ESI item subscales contained 3–11 questions. All subscale items used a 4-point, ordinal-level scale with the exception of Perceived Physical Harm, which used a 5-point, ordinal-level scale. Also, subscale items under Knowledge of Legal Consequences were scaled as dichotomous items according to whether they answered correctly or incorrectly. The α for the total combined 53 subscale items on the ESI was .73.
ESI Instrument Subscale Reliabilities (N = 1,876)
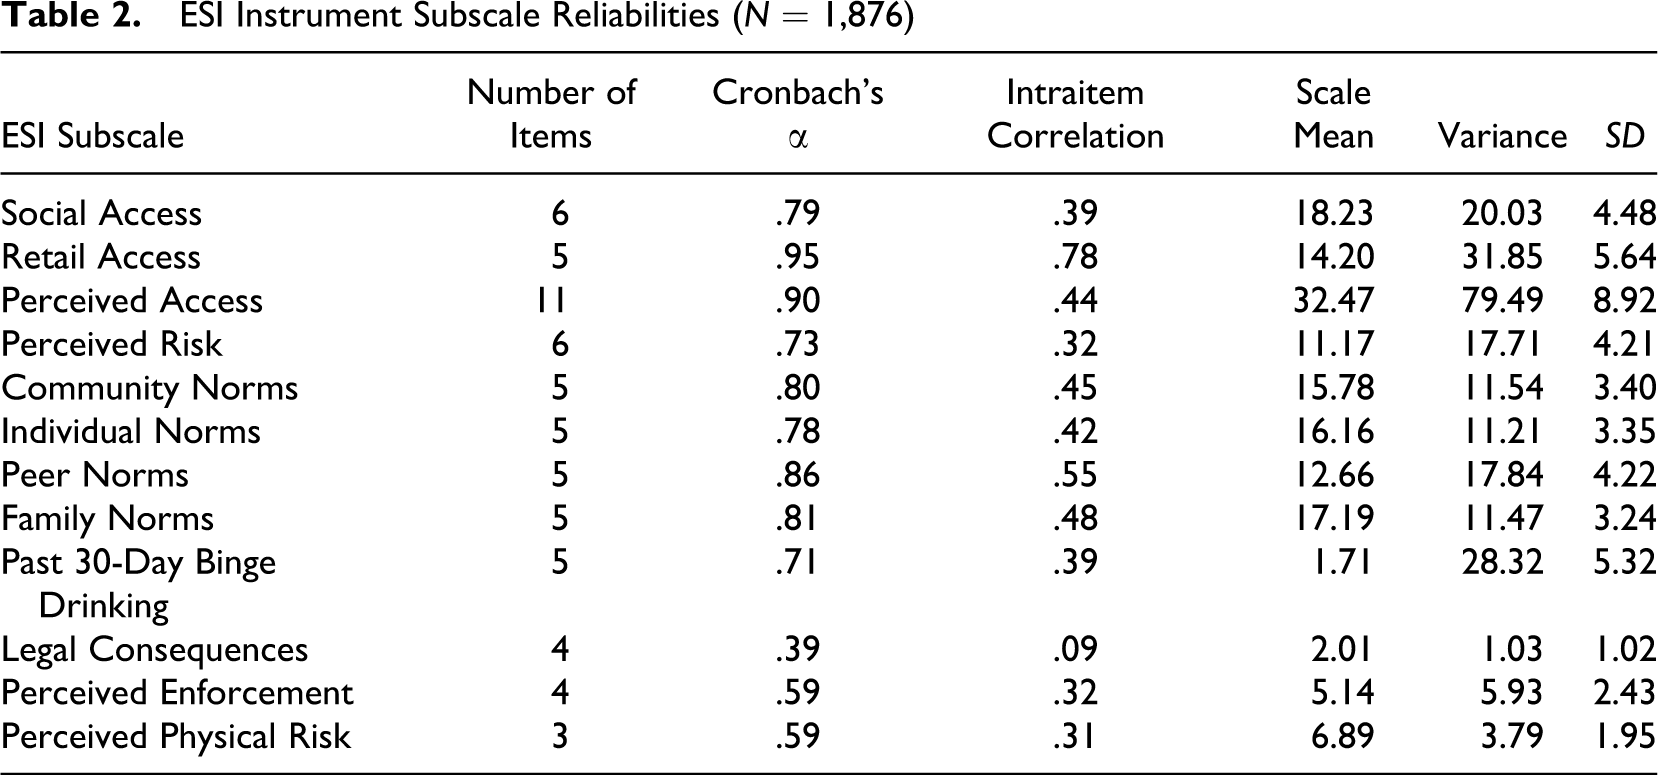
Under the construct of Perceived Access, which is further operationalized into the subscales Social Access and Retail Access, α coefficients showed high reliability (.90) for the overall construct. A high α coefficient for Retail Access (.95) indicated strong internal consistency reliability, and α for Social Access (.79) indicated moderate reliability. Under the Social Norms subscale grouping, three subscales yielded good reliability coefficients—Peer Norms (.86), Family Norms (.81), and Community Norms (.80)—with the other, Individual Norms (.78), showing moderate reliability. The αs for Perceived Risk (.73) and Past 30-Day Binge Drinking also showed moderate internal consistency reliability. While having more items in a scale typically improves α scores, subscales with only 3 items may still yield high internal consistency reliabilities despite having low intercorrelations (Cortina, 1993). However, this did not hold true for three of the ESI subscales that contained fewer items. Lower α values of .59 were reported for Perceived Enforcement and Perceived Physical Risk, both having 3 items, and an α value of .39 was found for the 4-item Knowledge of Legal Consequences.
ESI Validity—Criterion-Related Correlations
In addition to examining the scale reliabilities, Pearson correlations between the conceptual scale constructs and additional variables of interests were investigated. Our expectation was to find significant relationships between the ESI factors and actual alcohol-related behaviors. Key variables of interests based on other items in the instrument included participant age, the self-reported number of times in the last 30 days driving a vehicle after they had been drinking, and the self-reported number of times in the last 30 days riding in a car or vehicle driven by someone who had been drinking. The inclusion of these items allows us to demonstrate the relationship between the various subscales and high-risk alcohol-related behaviors and also the age of the individual. Overall, the results from the correlation matrix showed high levels of statistical significance with many items reporting p values less than .001 (Table 3).
Correlations of Scale Constructs and Criterion Variables of Interest (N = 1,876)
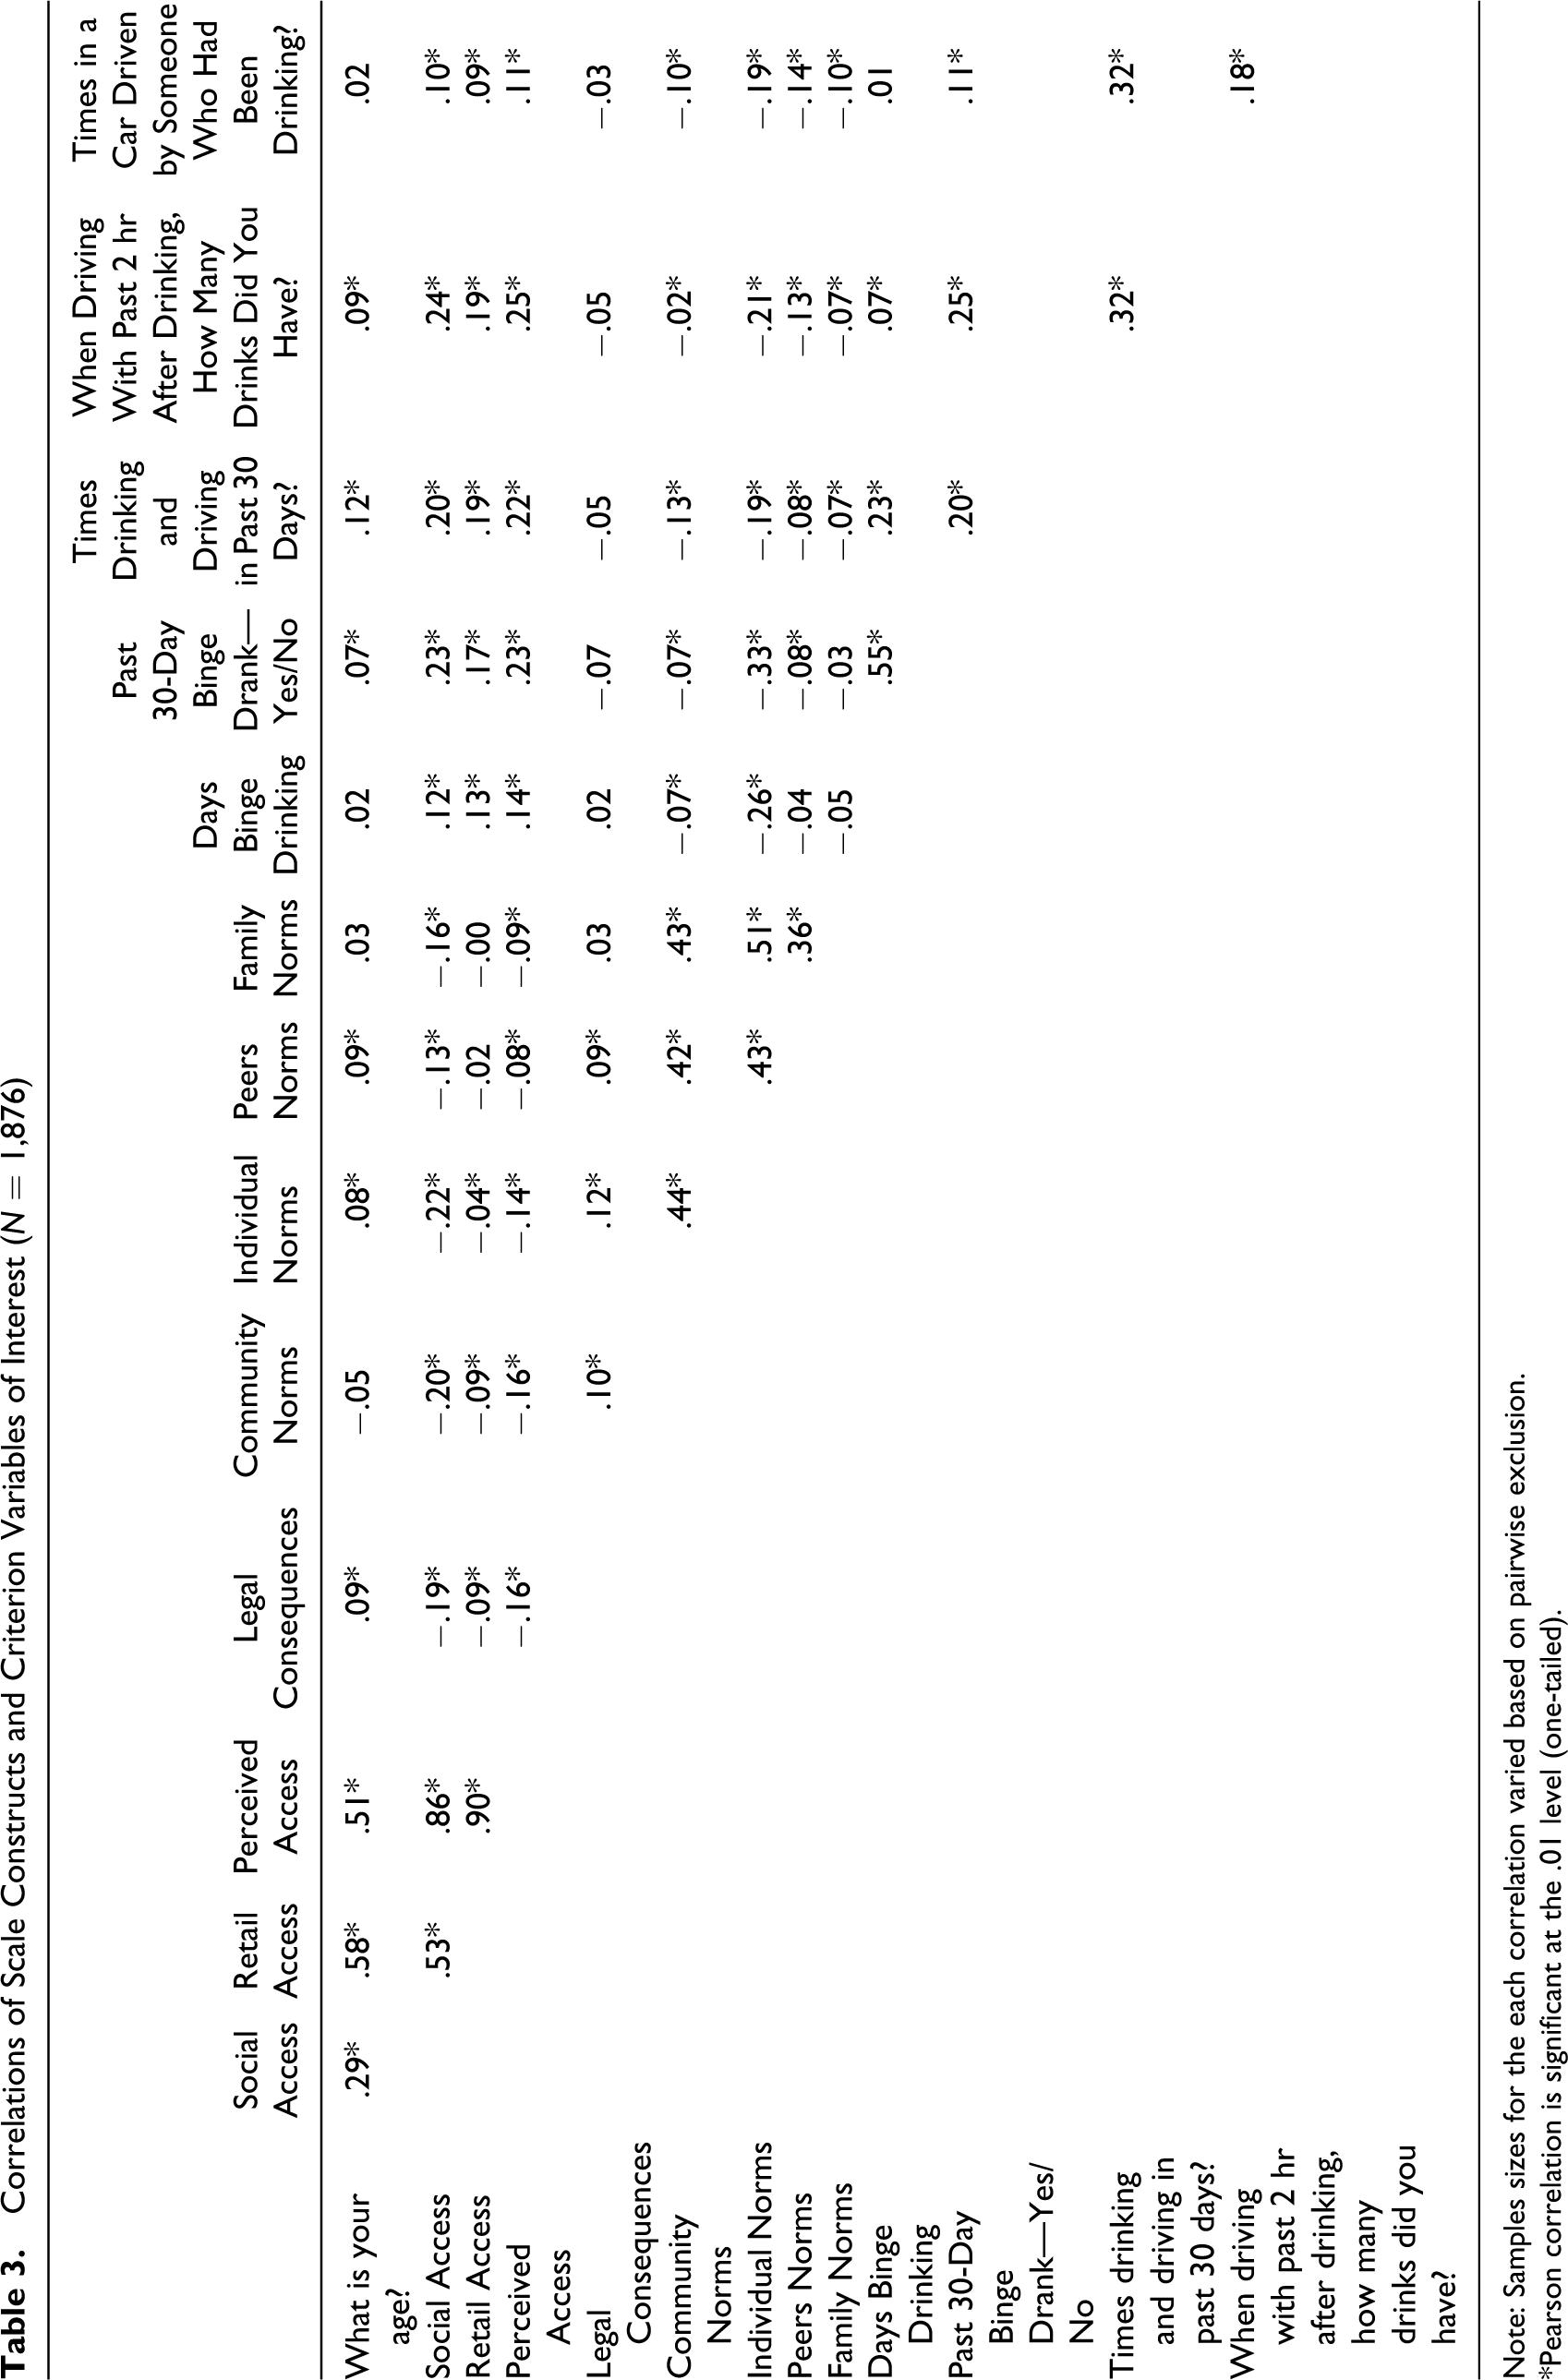
Note: Samples sizes for the each correlation varied based on pairwise exclusion.
*Pearson correlation is significant at the .01 level (one-tailed).
Perceived Access and Retail Access showed a strong relationship (r = .85, p < .001). However, this relationship is likely only a statistical artifact since Retail Access is a subset of the overall Perceived Access construct. Other moderate relationships were found clustered in the group of Social Norms constructs; Community Norms showed a moderate relationship with Individual Norms (r = .44, p < .001), Peer Norms (r = .42, p < .001), and Family Norms (r = .43, p < .001). Individual Norms also demonstrated a moderate relationship with Peer Norms (r = .43, p < .001) and also with Family Norms (r = .51, p < .001).
The relationship between construct subscales and outcome variables were also examined to see if these revealed any relationship to high-risk substance use behaviors. Past 30-Day Binge Drinking (number of days) and Past 30-Day Binge Drank (Yes/No) showed a modest correlation with Individual Norms, (r = −.26, p < .01) and (r = −.33, p < .01), respectively. Participants with higher Individual Norms scores (personal disapproval of drinking behaviors) reported fewer days binge drinking. Drinking and driving activity also showed a modest relationship with Perceived Access (r = .25, p < .01). Individuals who reported drinking-while-driving also had perceptions that alcohol was easily accessible.
Among the key variables of interest, survey participants’ age showed a strong relationship with Retail and Perceived Access (r = .58, p < .001 and r = .51, p < .001, respectively) and a moderate, yet significant relationship with Social Access (r = .29, p < .001). Age did not show any additional significant relationships with any of the other constructs. Self-reported number of times drinking alcohol and driving in past 30 days showed a moderate relationship with two of the other drinking behavior items—the number of binge drinking days within the last 30 days (r = .27, p < .001) and the number of times when they rode in a vehicle that was driven by someone who had been drinking (r = .32, p < .001).
ESI Factor Analysis
Intervening variable items were also examined using an exploratory factor analysis (EFA) to determine whether the conceptual subscales of the ESI would resemble factors generated through this psychometric approach. Factor analyses with oblique rotations were completed to test if the factor structure improved based on the assumption of intercorrelation between the factors. Examination of rotated factor structure showed low to virtually no interfactor correlation with the highest interfactor correlation being between Factors 3 and 6 (r = .396) and the lowest between Factors 4 and 7 (r = .012) using the Promax method with Kaiser normalization. Item factor loadings also showed only marginal improvement, when the orthogonality constraint was relaxed. There was also no change in the factor structure with respect to how the items loaded. Given these findings, we determined that an orthogonal approach using the Varimax method would be most appropriate. The 48 items from the conceptual subscales were pooled together and an EFA was performed using a maximum likelihood extraction method and orthogonal rotations. We retained factors with eigenvalues greater than 1 and also used a visual Scree test to determine our final factor solution. After testing five, six, and seven-fixed-factor solutions and examining the factor loading structure, we determined to retain a six-factor solution. Items were retained based on having factor loadings .32 or greater based on Tabachnick and Fidell’s (2001) recommended minimum loading of an item. Cross-loaded items were also identified as items having loadings at .32 or higher on more than one factor.
The final six-factor solution was selected based on the criteria described above and also interpretability yielding 37.4% of total variance explained by the factor solution. Factor 1 (Social Disapproval) included 5 items with factor loadings above .32 with 2 items related to an individual’s perception of underage drinking, marijuana use, and binge drinking failing to load (see Table 4 for factor loading table). Factor 2 (Access) yielded the most items with 7, all of which were clustered around Items 15e through 15k related to the Retail Access construct. Perceived ease of alcohol access by convenience store had the highest factor loading at .89, followed by perceived ease of alcohol access by liquor store .87, and finally by perceived ease of alcohol access by grocery store .85. Three items failed to load on Factor 2.
Factor Loading Table of ESI Items
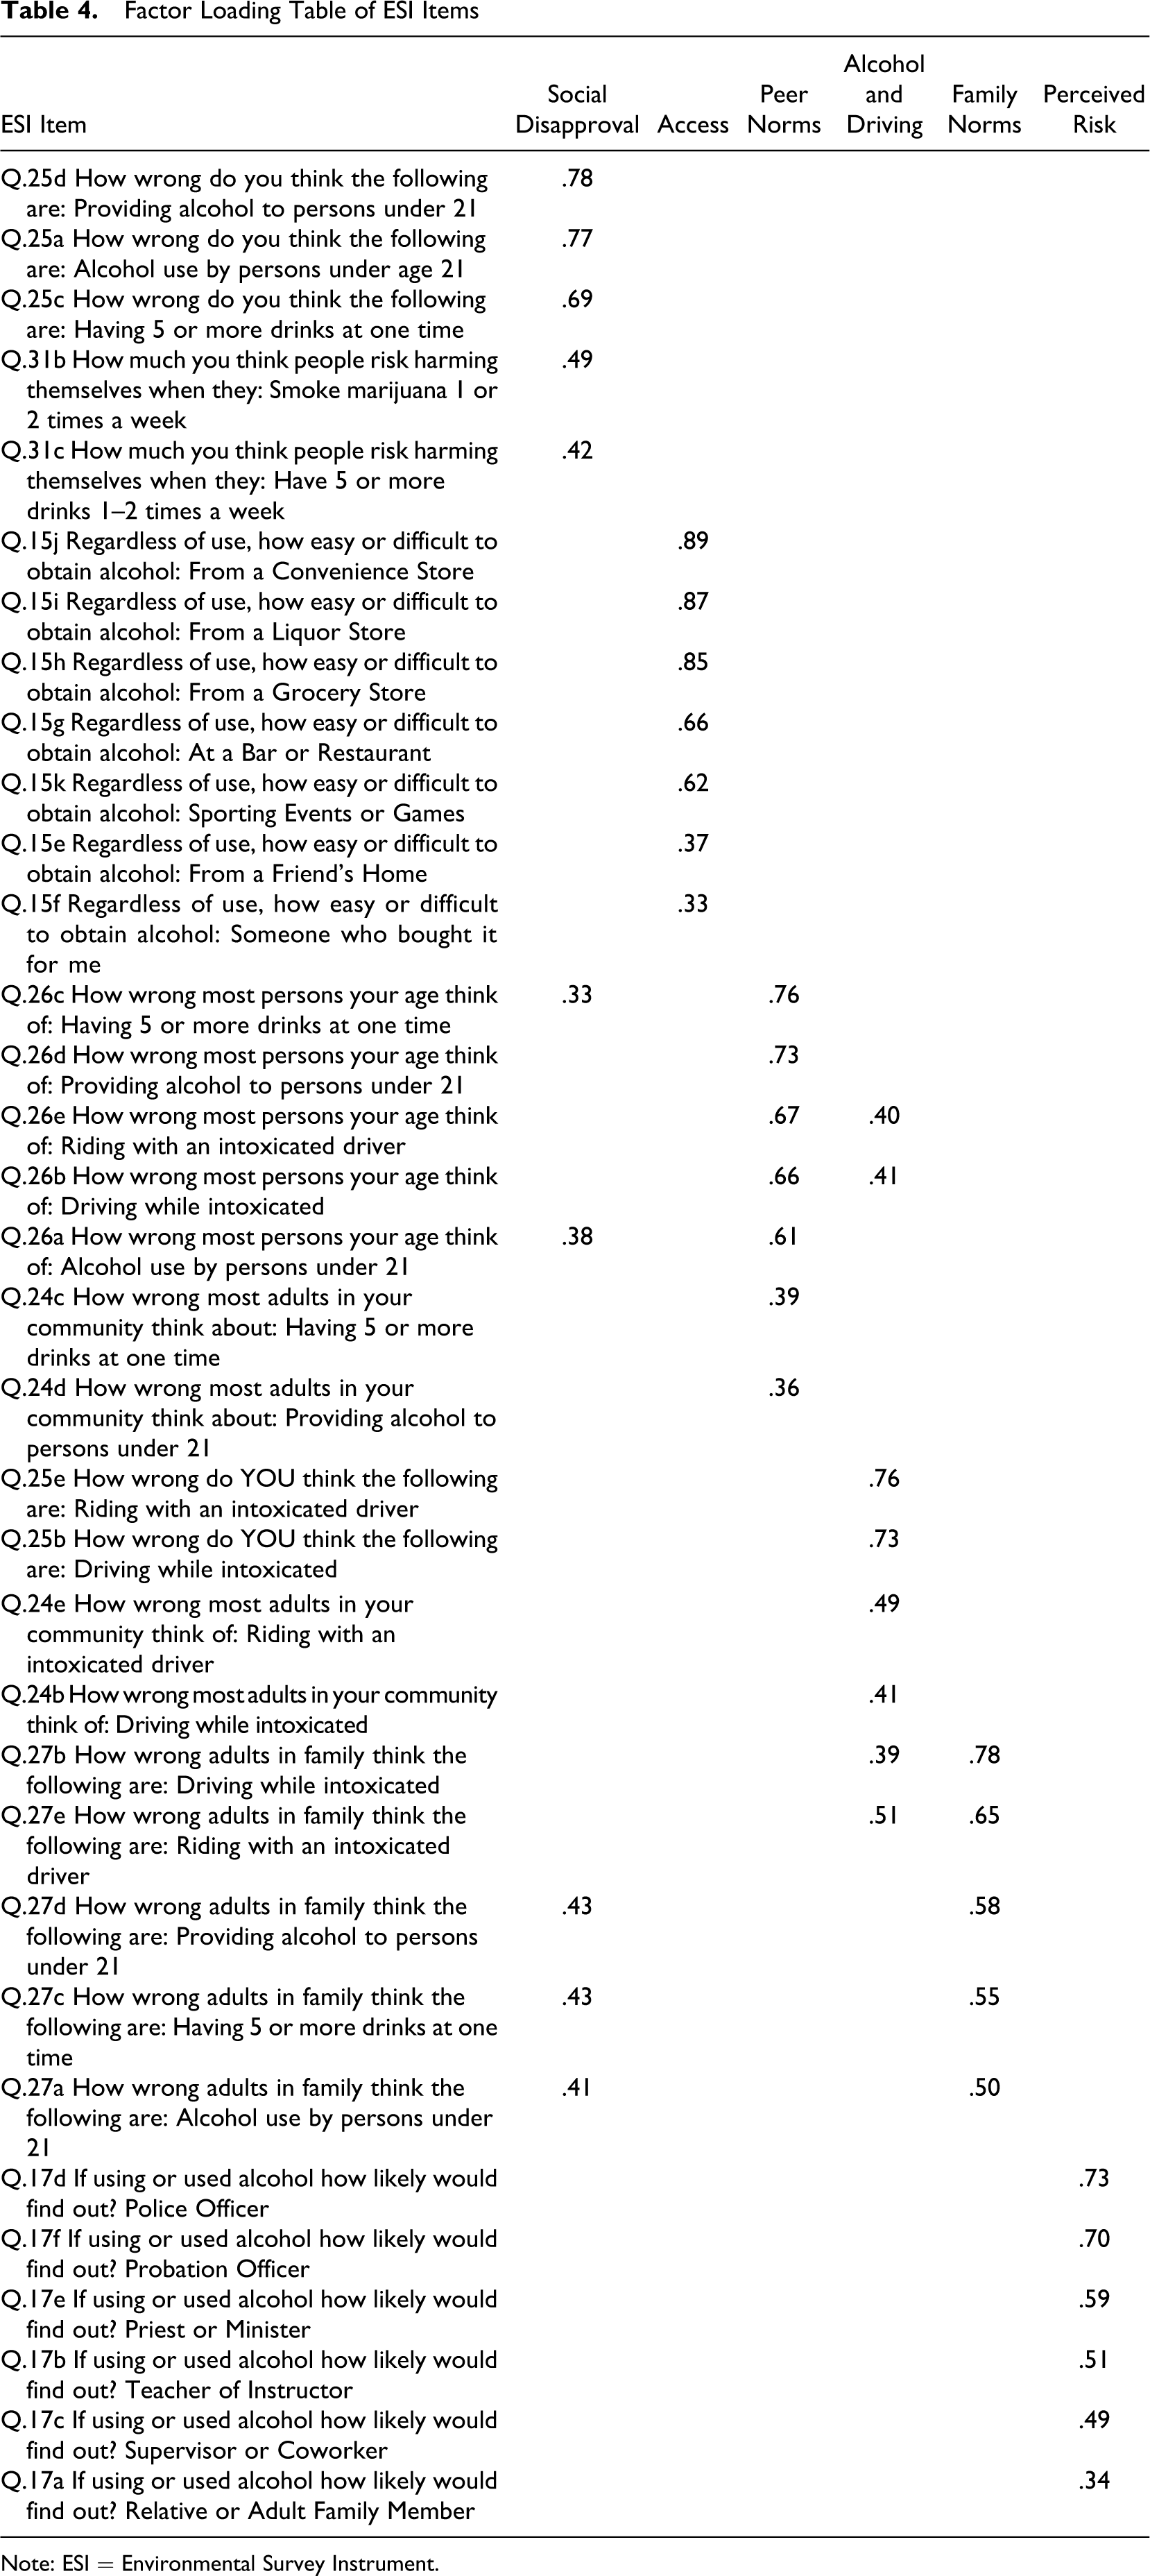
Note: ESI = Environmental Survey Instrument.
Factor 3 (Peer Norms) also contained 7 items, 2 of which were cross-loaded on Factor 4. Question 26e about how wrong peers would think it is to ride with an intoxicated driver yielded a .67 factor loading on Factor 3 and a factor loading of .40 on Factor 4. Similarly, Question 26b relating to peer perceptions on how wrong it would be to drive while intoxicated had a factor loading of .66 on Factor 3 and .41 on Factor 4. An inspection of those items suggests that this construct relates more closely to peer perceptions of underage drinking and intoxicated driving, whereas the fourth factor relates more closely with personal and adult perceptions of intoxicated driving. Factor 3 contained 2 items that did not load. The fourth factor (Alcohol and Drinking) contained a total of 6 items, 4 items all closely associated with underage and peer drinking disapproval and 2 cross-loaded items with Factor 5, with 3 items failing to load on any factor.
The fifth factor (Family Norms) contained a total of 5 items centered on the ESI Family Norms construct (27a–27e), all of which cross-loaded on another factor. Questions 27b and 27e relating to Family Norms about intoxicated driving behavior were cross-loaded on Factor 4. Questions 26a, 26c, and 26d were cross-loaded on Factor 1 relating to Personal Norms related to drinking. The sixth factor (Perceived Risk) loaded on 6 items with no cross-loadings; these were all associated with the construct Perceived Risk (17a–17e). This factor contained 2 items that failed to load.
A total of 14 items failed to load on any given factor in the factor analysis. An analysis of these items revealed a clear pattern where all items are from the original conceptual scales of Social Access (Items 15a–15d), Knowledge of Legal Consequences (Items 20a–20d), and Perceived Enforcement (Items 21a–21d), and 1 item (31a) related to cigarette smoking risk.
Using the EFA-defined subscales, additional reliability estimates were also calculated. Similar α coefficients to those described above were found, with the highest α coefficient of .91 for Access, followed by Peer Norms (.84), Family Norms (.81), Alcohol and Driving (.75), Perceived Risk (.73), with Social Disapproval reporting the lowest α coefficient of .71.
Discussion
Measuring and evaluating the impact of environmental strategies on preventing alcohol use, abuse, and related consequences has been problematic for prevention programming and evaluation research. Indicator data on incidence and prevalence of use, misuse, and consequences, such as alcohol-related fatality, may not capture more subtle and proximal community change. As environmental strategies to reduce alcohol, tobacco, and other illicit substances continue to be tested in community trials and efficacy studies, more appropriate evaluation measures that are linked to intervening variables and desired outcomes are needed to better gauge how community members perceive these interventions.
The ESI tool was created as a measure of how community members perceive the effects of environmental and social policy changes that coalitions in their communities attempt to implement. Our first set of results was related to an ESI tool that was conceptually driven, and focused on intervening variables that predict underage and young adult alcohol use in the general causal model (Birckmayer et al., 2004). The conceptually derived ESI subscales showed promising estimates of reliability and in some cases were related to criterion-related alcohol behaviors. For example, we found that individuals who perceived easy community access to alcohol were significantly more likely to drive while intoxicated. In contrast, some of the conceptual subscales showed low reliabilities in this large community sample. For example, Perceived Enforcement, Perceived Physical Risk, and Knowledge of Legal Consequences had low estimates of reliability. The addition of new items to the subscales and/or revision of the original items may help to increase reliability in future versions of the ESI.
Our second set of analyses using EFA found positive results toward the clustering of items into independent factors. As expected, the EFA-derived constructs of Social Disapproval, Family Norms, and Perceived Risk factors are linked with the conceptually derived ESI factors of Community and Social Norms. The EFA-derived factor, Access, was linked to the conceptually derived ESI subscales of both Social and Retail Access. The third factor, Peer Norms, is also linked to the conceptual ESI subscales Peer and Family Norms. Some items, such as those related to Social Access, Knowledge of Consequences, and Perceived Enforcement did not load clearly on any one particular factor, although the small number of items in the ESI may have posed difficulty in measuring this category of community perception. Moreover, the weak α values related to perceived consequences and legal enforcement, along with the fact that few of these original subscale items loaded on the EFA factors, warrants further review and possible revision of these ESI subscales and/or the structure and content of the actual items.
In terms of study limitations, the high nonresponse rate points to the fact that phone surveys are becoming increasingly difficult to conduct, especially with participants aged 18–25. Many young people have cellular phones, reducing access to their phone numbers. Additionally, as individuals may keep their area code regardless of where they live, many potential participants were ineligible as they had moved away from the target community, and thus were no longer receiving the intervention. A final limitation revolves around the generalizability of the sample used in this study. Although the current article found a six-factor solution, higher proportions of females and lower education levels of males may have skewed the findings. Additionally, the current study had a higher number of ethnic minority participants, and cultural (such as norms of drinking at ethnic festivals) and environmental issues (such as transportation issues and drinking while driving) may have an influence on study outcomes. Further analysis of the ESI subsamples may indicate differences across groups. For evaluation researchers who use the ESI in future study, reliability and validity estimates should be revisited to ensure accurate interpretation of findings.
Footnotes
The authors would like to express their appreciation to Dr Daniel Jorgensen at Texas A&M University and Adrian Reyes for their assistance in the collection and management of all ESI data.
The author(s) declared no potential conflicts of interest with respect to the research, authorship, and/or publication of this article.
The author(s) disclosed receipt of the following financial support for the research, authorship, and/or publication of this article: Contract # 2010–033770 to Behavioral Assessment, Inc. (Dr Richard Cervantes, Principal Investigator) from the Texas State Department of Health Services.
References
Supplementary Material
Please find the following supplemental material available below.
For Open Access articles published under a Creative Commons License, all supplemental material carries the same license as the article it is associated with.
For non-Open Access articles published, all supplemental material carries a non-exclusive license, and permission requests for re-use of supplemental material or any part of supplemental material shall be sent directly to the copyright owner as specified in the copyright notice associated with the article.