
Abstract
The purpose of this study was to develop triangulation coding methods for a large-scale action research and evaluation project and to examine how practitioners and policy makers interpreted both convergent and divergent data. We created a color-coded system that evaluated the extent of triangulation across methodologies (qualitative and quantitative), data collection methods (observations, interviews, and archival records), and stakeholder groups (five distinct disciplines/organizations). Triangulation was assessed for both specific data points (e.g., a piece of historical/contextual information or qualitative theme) and substantive findings that emanated from further analysis of those data points (e.g., a statistical model or a mechanistic qualitative assertion that links themes). We present five case study examples that explore the complexities of interpreting triangulation data and determining whether data are deemed credible and actionable if not convergent.
The concept of triangulation has a long history in the social sciences, capturing the interest of quantitative, qualitative, and mixed methods scholars alike. In quantitative research, D. T. Campbell and Fiske (1959) created the multitrait, multimethod matrix for systematically comparing findings across different data collection methods; if results converged across methods, D. T. Campbell and Fiske (1959) argued that researchers could have greater confidence in the validity of their conclusions (see also Webb, Campbell, Schwartz, & Sechrest, 1966). In qualitative research, early conceptualizations of triangulation highlighted how multiple methods can reveal shared perspectives and realities, without making epistemological claims regarding the “truth” of the findings (Denzin, 1978; Lincoln & Guba, 1985). In mixed methods research, triangulation has been lauded as a strategy for exploring viewpoints revealed through divergent data (Greene, 2007; Greene & Caracelli, 1997; Greene, Benjamin, & Goodyear, 2001). Although quantitative, qualitative, and mixed methodologists have varied epistemological and practical reasons for studying triangulation, there remains an enduring shared value across these methodological traditions for collecting and comparing information generated by disparate methods and sources.
In mixed methodology scholarship specifically, the literature on triangulation has been centered primarily on what Greene and Caracelli (1997) termed the theoretical level of inquiry to engage the paradigmatic and epistemological issues inherent in evaluative comparisons of data collected by different means. By contrast, the technical levels of inquiry are far less developed, as procedural guidance for mixed method triangulation coding is sparse (see Farmer, Robinson, Elliott, & Eyles, 2006; McConney, Rudd, & Ayres, 2002; Sands & Roer-Stier, 2006, as notable exceptions). Likewise, few scholars have delved into the political level of inquiry to explore how studying triangulation can reveal contested spaces in evaluation projects and influence what stakeholders deem credible and actionable evidence (Donaldson, Christie, & Mark, 2015). The purpose of this article is to advance these levels by presenting a practical framework for coding data convergence in a large-scale, policy-focused mixed methodology project and to explore the political implications of both convergent and divergent data. We present five case studies that illustrate how our triangulation assessments influenced what actions our evaluation team and our community stakeholders decided to take—or not to take—in this policy context. To set the stage for this project, we will begin with a brief review of the literature on triangulation coding in mixed methods research and evaluation.
The Technical Level: What Is Triangulation and How Is It Assessed?
To begin, a working definition of triangulation is necessary, and we draw upon Denzin’s (1978) influential conceptualization as a starting point. Given that social science methodologies have evolved considerably since the 1970s, we also offer our reinterpretations of Denzin’s four types of triangulation in this exploration. First, he defined methodological triangulation as the use of multiple methods to study the phenomenon of interest, working either within method (e.g., multiple variations of a survey) or between methods (e.g., a survey and observational data collection). Denzin did not draw a distinction between methodology and methods, but it seems reasonable to infer that this type of triangulation could include multiple methodologies (e.g., quantitative and qualitative methodologies) and/or multiple data collection methods (interviews, surveys, observations, archival, each of which could be quantitative or qualitative). Second, Denzin defined data triangulation as collecting data from multiple sources (i.e., people/stakeholders), across time, space, and person. Third, for investigator triangulation, more than one investigator/evaluator is involved in the process of collecting, analyzing, and/or interpreting data to assess the extent to which the investigators reach similar conclusions. Finally, Denzin proposed theoretical triangulation whereby multiple theories are brought to bear in the study of the phenomenon of interest. Denzin noted this form of triangulation is rare and likely impractical (see also critiques by Mathison, 1988), and he did not pursue this type of triangulation in his later works.
Building upon Denzin’s (1978) three main types of triangulation, Figure 1 presents a visual schematic of mixed methods triangulation design options. In this figure, methodological triangulation is represented in the columns, including both qualitative and quantitative methodologies and multiple methods. For simplicity, we include only three data collection methods (interviews/surveys, observations, and archival records), though this could be expanded to include others. In the rows, we represent stakeholder triangulation, a renaming of Denzin’s data triangulation, to reflect the practice of collecting the data from multiple individuals within and across stakeholder groups. As Figure 1 illustrates, researchers/evaluators could employ narrowly defined mixed method triangulation designs, such as within methodology (all qualitative), across data collection methods (interviews, observations, archival), and within stakeholder group (one stakeholder group). Another example of a tightly focused mixed method triangulation could be a within methodology (qualitative), within data collection method (interview), and across stakeholder groups. Broader interpretations of mixed methods triangulation would involve crossing the methodological boundary to include both qualitative and quantitative work, with varied data collection methods, within or across stakeholder groups. For any of these design options, investigator triangulation could be added whereby the collection, analysis, and interpretation of the data would involve multiple investigators.
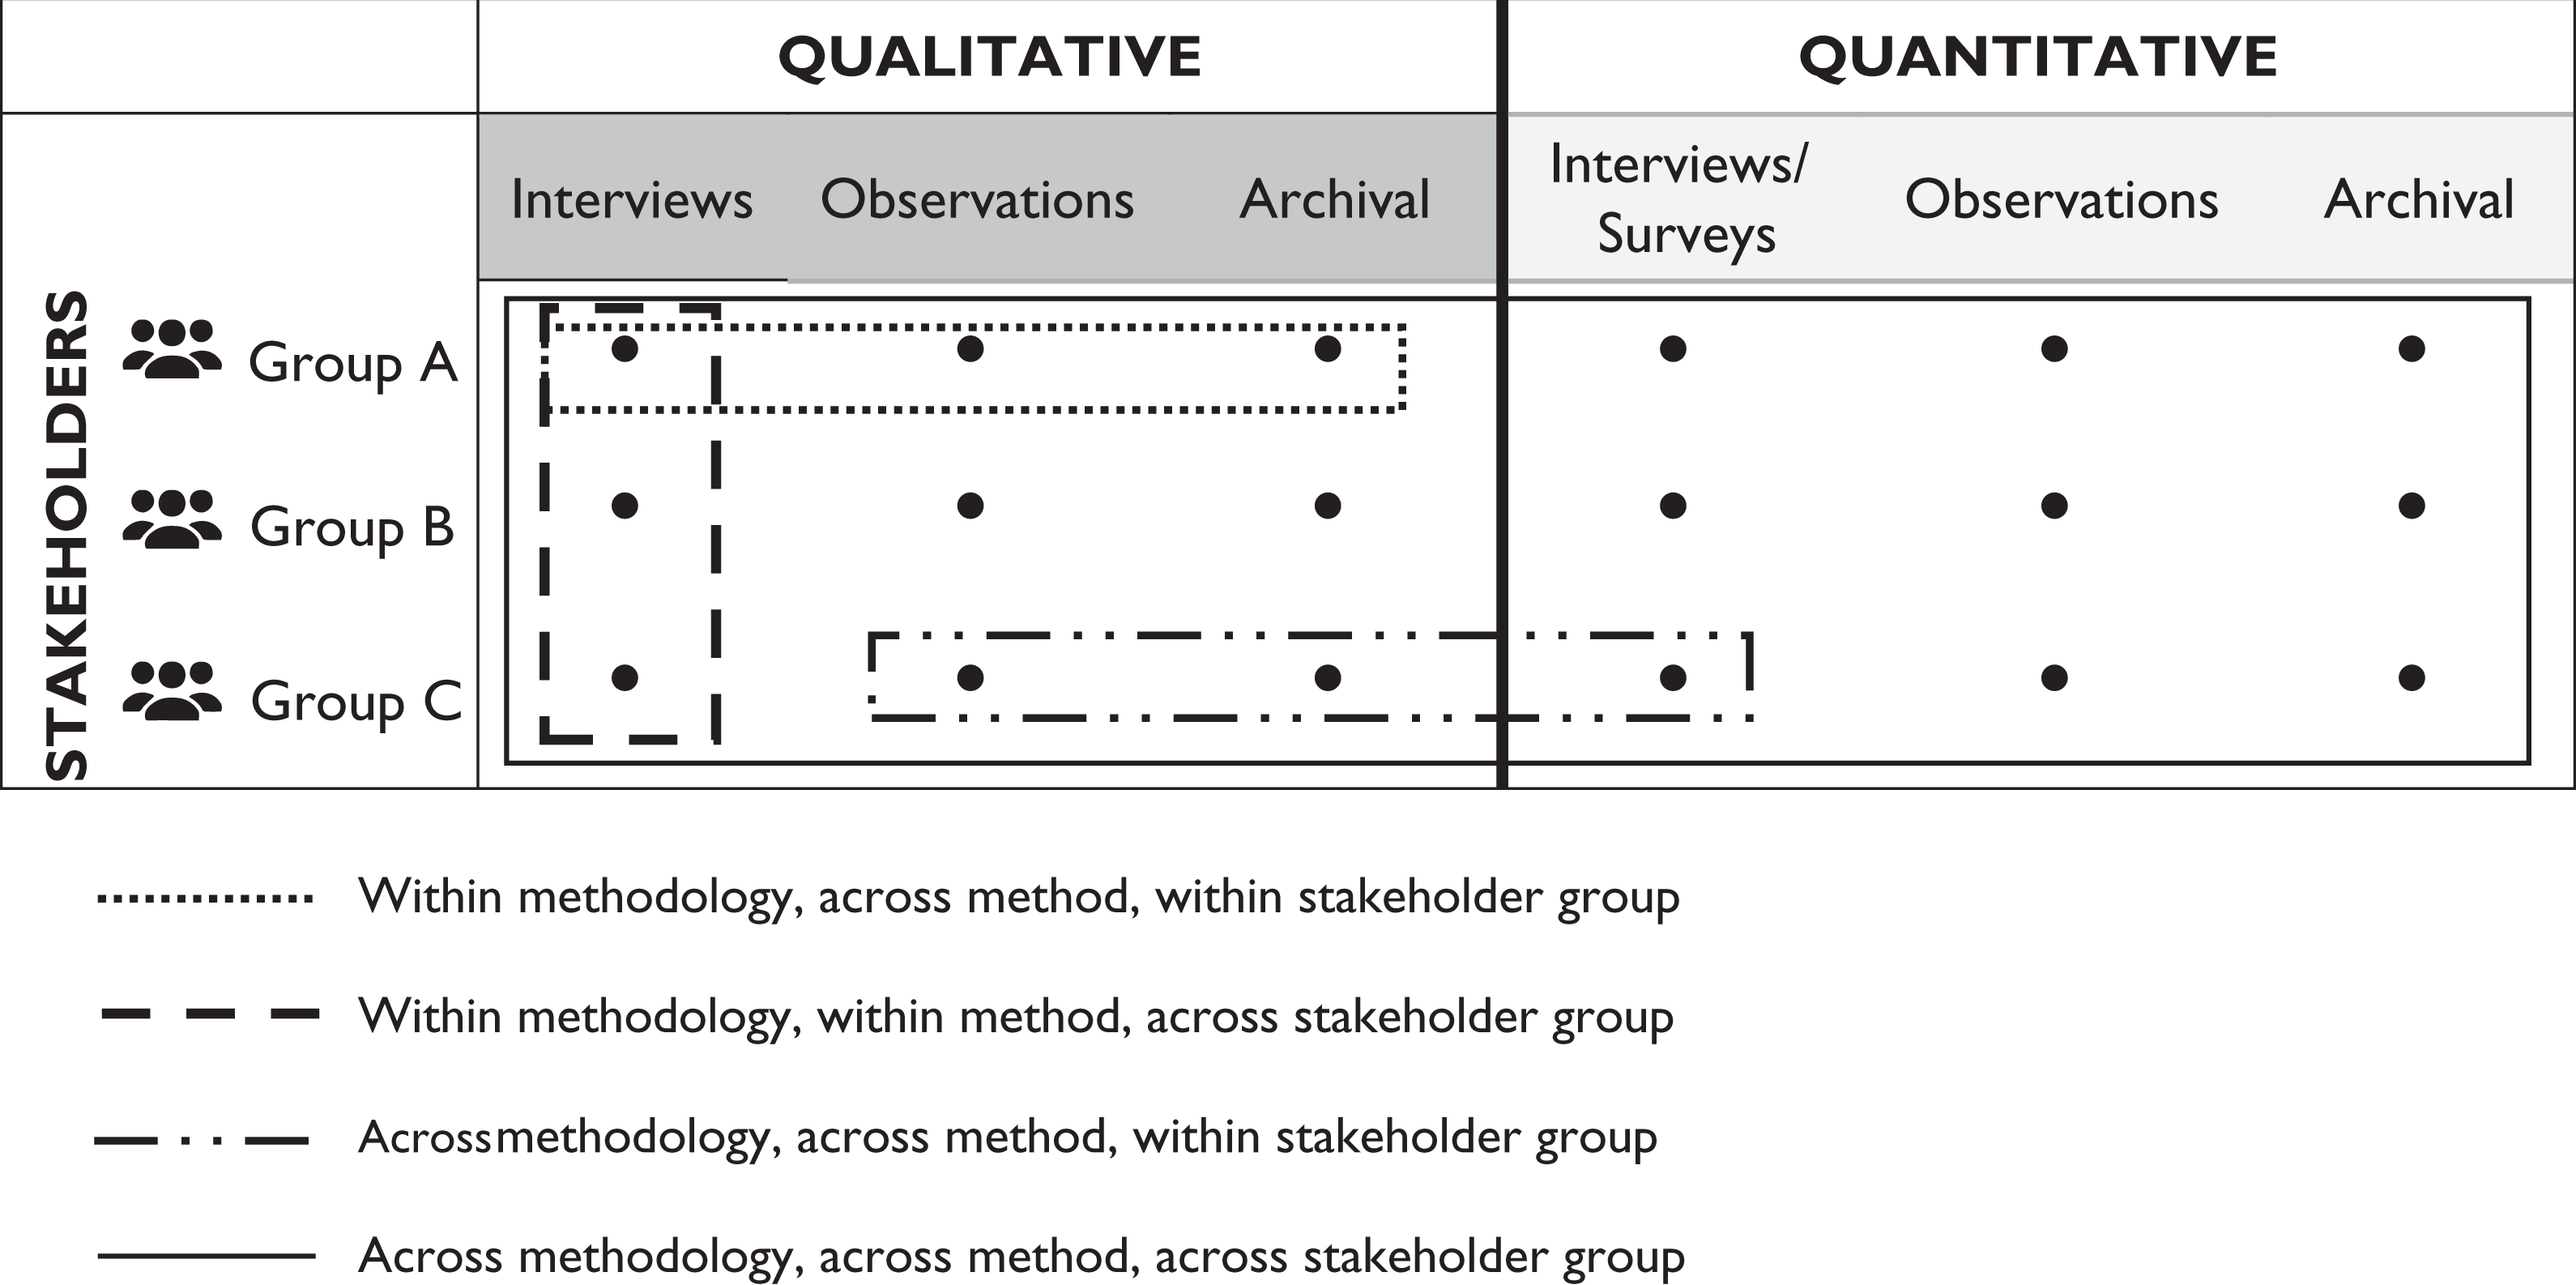
Mixed Methods Triangulation Design Options.
Figure 1 highlights that researchers/evaluators could be collecting substantial amounts of data, depending on the complexity of the triangulation design (different methodologies, methods, stakeholders, and/or investigators), so how should this disparate information be analyzed to assess the nature and extent of convergence? The technical literature consists primarily of case studies highlighting triangulation results (e.g., Bailey & Hutter, 2008; Deacon, Bryman, & Fenton, 1998; Flick, Garms-Homolova, Herrmann, Kuck, & Röhnsch, 2012; Greene & McClintock, 1985; Murphy, Banyard, Fennessey, 2013), with fewer examples presenting methods for assessing convergence and divergence. McConney and colleagues (2002) developed a mathematical coding and weighting system whereby evaluators could rate conflicting findings on a number of dimensions (accuracy, relevance, representativeness) to yield a final summative evaluation of a program’s merit or worth. For exploratory formative projects, whereby researchers/evaluators are not tasked with making summative judgments, coding the extent of convergence and reasons for divergence may be illuminating. For example, Farmer and colleagues (2006) proposed a four-category rating system, whereby emerging themes from each stakeholder group and/or data collection method are compared and evaluated for (1) full agreement across sources; (2) partial agreement across sources; (3) silence, when a theme emerges from one stakeholder group or data collection method, but not others; and (4) dissonance, when there is complete disagreement across sources. Farmer, Robinson, Elliott, and Eyles (2006) employed these methods to assess convergence in an evaluation of the Canadian Heart Health Dissemination Project, which involved collecting 40 qualitative interviews and 30 archival records across three Canadian provinces (i.e., a within methodology, across method, across stakeholder triangulation). They found that these coding methods worked well for documenting converging findings and for distinguishing incomplete from divergent data.
A similar process for coding convergence was proposed by Sands and Roer-Stier (2006) in their work interviewing 17 mother–daughter dyads (i.e., a within methodology, within method, across stakeholder triangulation). They examined the extent to which emerging themes in the mothers’ interviews were consistent with their daughters’, using a five-category rating system: (1) same story–same meaning, (2) same story–different interpretation, (3) missing pieces (both women were privy to a piece of information but only one mentioned it in her interview), (4) unique information (information was known to only one woman), and (5) illuminating (different accounts were provided by each participant). Like Farmer et al.’s (2006) coding scheme, this approach also distinguishes agreement from completeness but refines the assessment of missingness to differentiate information that was not shared by both but was (presumably) known to both, from information that was not known to both. It may be difficult to ascertain what participants could have possibly known or not known, but Sands and Roer-Stier (2006) were able to make these distinctions in their project.
The coding methods proposed by Farmer and colleagues (2006) and Sands and Roer-Stier (2006) are consistent with Greene’s (2002, 2007; Greene et al., 2001) calls for the systematic study of diversity not merely the documentation of convergence. Furthermore, these coding methods assess the extent of convergence and possible reasons for divergent points of view, rather than assigning a simple yes/no determination of whether information converged. Both projects were within methodology assessments—all qualitative—and relatively small in scale. How triangulation coding could be employed in large projects that transcend methodological boundaries to include qualitative and quantitative data are in need of further exploration.
The Political Level: What Might Triangulation Reveal?
Much of the literature on triangulation focuses on convergence and the claims of credibility that can be made when multiple methods and sources provide consistent information (Erzberger & Prein, 1997; Flick, 1992; Hammersley, 2008; Howe, 2012; Moran-Ellis et al., 2006; Morse, 2015), but reviewing triangulation design options (Figure 1) and triangulation coding methods (above) underscores that divergent findings are perhaps more likely, as there are so many ways for data not to converge. Indeed, Mathison (1988) explained that the expectation for convergence is “unrealistic…in practice, triangulation as a strategy provides a rich and complex picture of some social phenomenon being studied, but rarely does it provide a clear path to a singular view of what is the case” (pp. 13, 15). Likewise, Kidder and Fine (1987) noted that stakeholder groups’ cultures may be so vastly different that convergence of their narratives is simply not possible. Greene and colleagues have argued that this is precisely why mixed method designs are valuable, as divergent findings create an opportunity for “more insightful understanding,” which can “lead to conceptual re-reframing…or to discovery of new concepts that constitute theoretical or practical insight” (Greene et al., 2001, p. 30; see also Greene, 2002, 2007; Greene & Caracelli, 1997; Greene & McClintock, 1985). Greene, Benjamin, and Goodyear (2001) further contended that “because different methods themselves advance different values and interests, mixed method evaluation invites pluralism and thus critical commentary, public debate, and deliberative dialog about diverse perspectives on important public issues” (p. 30). As a type of mixed methods research, triangulation coding will likely reveal disagreements and inconsistencies, so what are the potential political implications of uncovering contested issues?
In an evaluation context, triangulation results may affect what stakeholders consider credible and actionable evidence (Donaldson et al., 2015). If findings do not converge across methods and sources, are they still actionable? Rallis (2015) noted that transparency of process is key to credibility: “stakeholders use findings, depending on whether they understand and accept how we have created and told the story, that is, how we made meaning of words and images” (p. 143). Triangulation coding is an excellent way to show where there are convergent and divergent perspectives, and that transparency may be instrumental for identifying actionable next steps, even when there is disagreement. At the same time, Miller (2015) noted that accuracy of evaluative data also determines what stakeholders deem credible and actionable, and triangulation coding could reveal deeper problems in the data. Comparing methods and sources could show that some information is not simply not correct—not a difference in opinion or a different point of view, but an inaccuracy. Did sources simply misunderstand or misremember, or did sources deliberately mislead the evaluator? This is an uncomfortable reality, one readily acknowledged in evaluation practice (Patton, 2008; Weiss, 1973), but triangulation coding may lay that reality bare, in incontrovertible detail. As such, triangulation is not merely a methodological task of cross-checking data, it is also a commitment to engaging political complexities and competing interests that may affect the credibility and usability of the data.
The Current Study
The purpose of this study was to take up the technical challenge of developing triangulation coding methods for large-scale, across-methodology projects and to advance political analysis by sharing how a multidisciplinary team of evaluators, practitioners, and policy makers interpreted both convergent and divergent data. Specifically, we had three primary goals. First, at a technical level, we wanted our coding methods to capture convergence separate from missingness and uniqueness and to provide some context as to why data did or did not converge, consistent with the coding procedures developed by Farmer et al. (2006) and Sands and Roer-Stier (2006). However, given the large volume of data collected in this project, we needed simplified and streamlined coding strategies that would help us capture these key distinctions reliably but efficiently. To that end, we created a green-yellow-red coding system to assess triangulation, evoking the commonly understood “go-caution-stop” meaning implied in this color-coding scheme. 1 The “green” codes signal triangulation across methodology, data collection method, and stakeholder group, giving clear evidence from multiple methods/sources regarding the presence and shared meaning of information. “Yellow” data merit caution because the presence and/or meaning of a theme is in dispute, or the data could reflect an insular point of view that is not shared by others. “Red” data are incomplete: Information was provided by only one data source, so it may be necessary to gather additional data to determine whether other methods/sources can “fill in the hole” (thereby converting “red” data to “yellow” or “green”). Alternatively, the information may be unique and no one else or no other data source can verify it, so the evaluator must decide whether further analysis and action is warranted or if there may be reasons not to share that information (e.g., confidentiality).
Second, to address both technical and political concerns, we applied this green-yellow-red coding method to individual data points (e.g., factual information or qualitative theme) and to findings/results that emanated from further analysis of those data points (e.g., a statistical model or a mechanistic qualitative assertion that links themes). In this project, we had reason to believe that stakeholders might purposely provide incorrect information to try to sway the evaluation (see below for further discussion of the context of this work), so we needed to check the accuracy of information (for factual data points) and the degree of disagreement (for thematic data points) before proceeding with further analysis to generate findings from those data. Assessing triangulation of both individual data points and findings based on those data is not yet common in the literature, but we felt it was necessary for promoting transparency (Rallis, 2015) and checking accuracy (Miller, 2015), which are critical determinants of credibility and usability. Put another way, in high-stakes, high-conflict projects, it is worth the effort to find misinformation before scaffolding those inaccuracies into broader findings.
Third, at the political level of analysis, we wanted to promote discussion about what evaluators should do with divergent data. The historical presumption has been that convergent data lend credibility and confidence and are therefore actionable (e.g., D. T. Campbell & Fiske, 1959; Erzerberger & Prein, 1997; Webb et al., 1966). The implied corollary is that divergent data are not credible and therefore not actionable, but Greene’s (2002, 2007; Greene et al., 2001) theoretical analysis challenges that presumption, so we wanted to explore how stakeholders decide whether convergent and divergent data are credible and actionable (McConney et al., 2002). We will share five cases studies that illustrate how we implemented our color-coding system and what actions we—both the evaluation team and our collaborators—decided to take based on green, yellow, and red triangulation findings.
The Context for the Current Study: The Detroit Sexual Assault Kit (SAK) Action Research Project
Although this is an article about methodological triangulation, it is necessary to provide some context about the substantive focus of this project, as the results are case study examples of convergence and divergence that require content grounding for comprehension. Briefly, this project addressed the growing national problem of untested SAKs (also termed rape kits). A rape kit is typically collected within 24–72 hr after a sexual assault in order to obtain biological evidence from victims’ bodies (e.g., semen, blood, saliva; Department of Justice, 2013). This evidence can be analyzed for DNA and compared against other criminal reference DNA samples in Combined DNA Index System , the federal DNA database, which can be instrumental in solving crimes and prosecuting rapists (R. Campbell, Feeney, Fehler-Cabral, Shaw, & Horsford, 2017; Strom & Hickman, 2010). However, in jurisdictions throughout the United States, police frequently do not submit rape kits for forensic DNA testing, and instead, kits are shelved in police property, unprocessed and ignored for years (R. Campbell et al., 2017; Pinchevsky, 2018). Conservative estimates indicate there are at least 200,000 untested SAKs in U.S. police departments, and large stockpiles of kits have been documented in over five dozen jurisdictions, sometimes totaling more than 10,000 untested SAKs in a single city (R. Campbell et al., 2017). The failure to test rape kits for DNA evidence has drawn public outrage as well as the attention of Human Rights Watch (2009, 2010) and the U.S. Department of Justice (2015), which highlighted the problem of untested SAKs as an example of biased and discriminatory police practices in their policy report, Gender Bias in Law Enforcement Response to Sexual Assault.
Detroit, MI, was one of many U.S. cities with large numbers of untested rape kits. In August 2009, approximately 11,000 SAKs were found in a remote police property storage facility. Local, county, and state officials demanded immediate review and intervention. In fortuitous timing, the National Institute of Justice released funding for collaborative action research projects whereby researchers would work with community practitioners in jurisdictions with large numbers of untested SAKs to develop and evaluate change strategies (NIJ, 2010). In the action research model, researchers/evaluators collect data about the problem at hand, share the findings with community collaborators, and together, informed by those results, the team develops, implements, and evaluates change strategies until successful solutions are institutionalized (Klofas, Hipple, & McGarrell, 2010). Detroit, MI, was selected for one of these grants, and we (the first and last authors of this article) were the primary research partners in this project.
One of the required aims of the action research project was to examine the underlying reasons why so many SAKs were not submitted by the police for forensic DNA testing. At that time this project began, law enforcement officials were defending their decisions not to test these rape kits for DNA and did not perceive that there was a problem to be solved. By contrast, practitioners from other disciplines—victim advocacy, nursing/medicine, prosecution, and forensic sciences—were alarmed that so many kits had not been tested, particularly because so many of these victims were Black women and/or poor women (see R. Campbell et al., 2015). This was a point of tremendous conflict between stakeholders, so the action research project began under a dark cloud of interpersonal and interorganizational tension. In this context, it seemed possible, perhaps even likely, that stakeholders might try to sway our investigation into why rape kits were not tested, and thus, triangulating information across stakeholder groups and data collection methods seemed prudent. Elsewhere, we discuss the substantive findings of this component of the action research project (see R. Campbell et al., 2015), but briefly, rape kits were not submitted for DNA testing because Detroit-area organizations simply did not have adequate resources (staffing, time, financial) to test all kits and investigate all reported sexual assault cases. However, there was also clear and compelling evidence that rape kits were not tested because police did not believe rape victims, and their adherence to rape myth stereotypes influenced their decisions not to invest their limited resources in this crime and these victims. In this article, we will share how triangulation coding helped us uncover these findings.
Method
Triangulation Design
Figure 2 summarizes the triangulation design we used in the Detroit SAK Action Research Project. We collected data from all five stakeholder groups/disciplines that are involved in collecting and testing rape kits, investigating and prosecuting sexual assault crimes, and providing services to victims, including police, prosecution, forensic science/crime laboratory, nursing/medicine, and victim services/advocacy. One critical stakeholder group was not formally represented in this study: rape survivors whose SAKs had not been submitted for testing. In the field of sexual assault research/evaluation, it is rare that rape survivors can be interviewed in the midst of pending legal cases, as the researchers can inadvertently become parties to the case. Each one of the ∼11,000 untested SAKs represented a potentially open, active legal case, given that the prosecutors’ office had made clear that they intended to have these cases investigated and reevaluated for possible prosecution. Our institutional review board (IRB) was concerned about possible negative iatrogenic effects of the research on open case proceedings, a concern strongly shared by the prosecutors. As such, we could not include rape survivors whose kits had not been tested as a stakeholder group. We sought other avenues for obtaining survivors’ perspectives in the action research project (see R. Campbell et al., 2015), but we could not include them as a stakeholder group in the triangulation design.
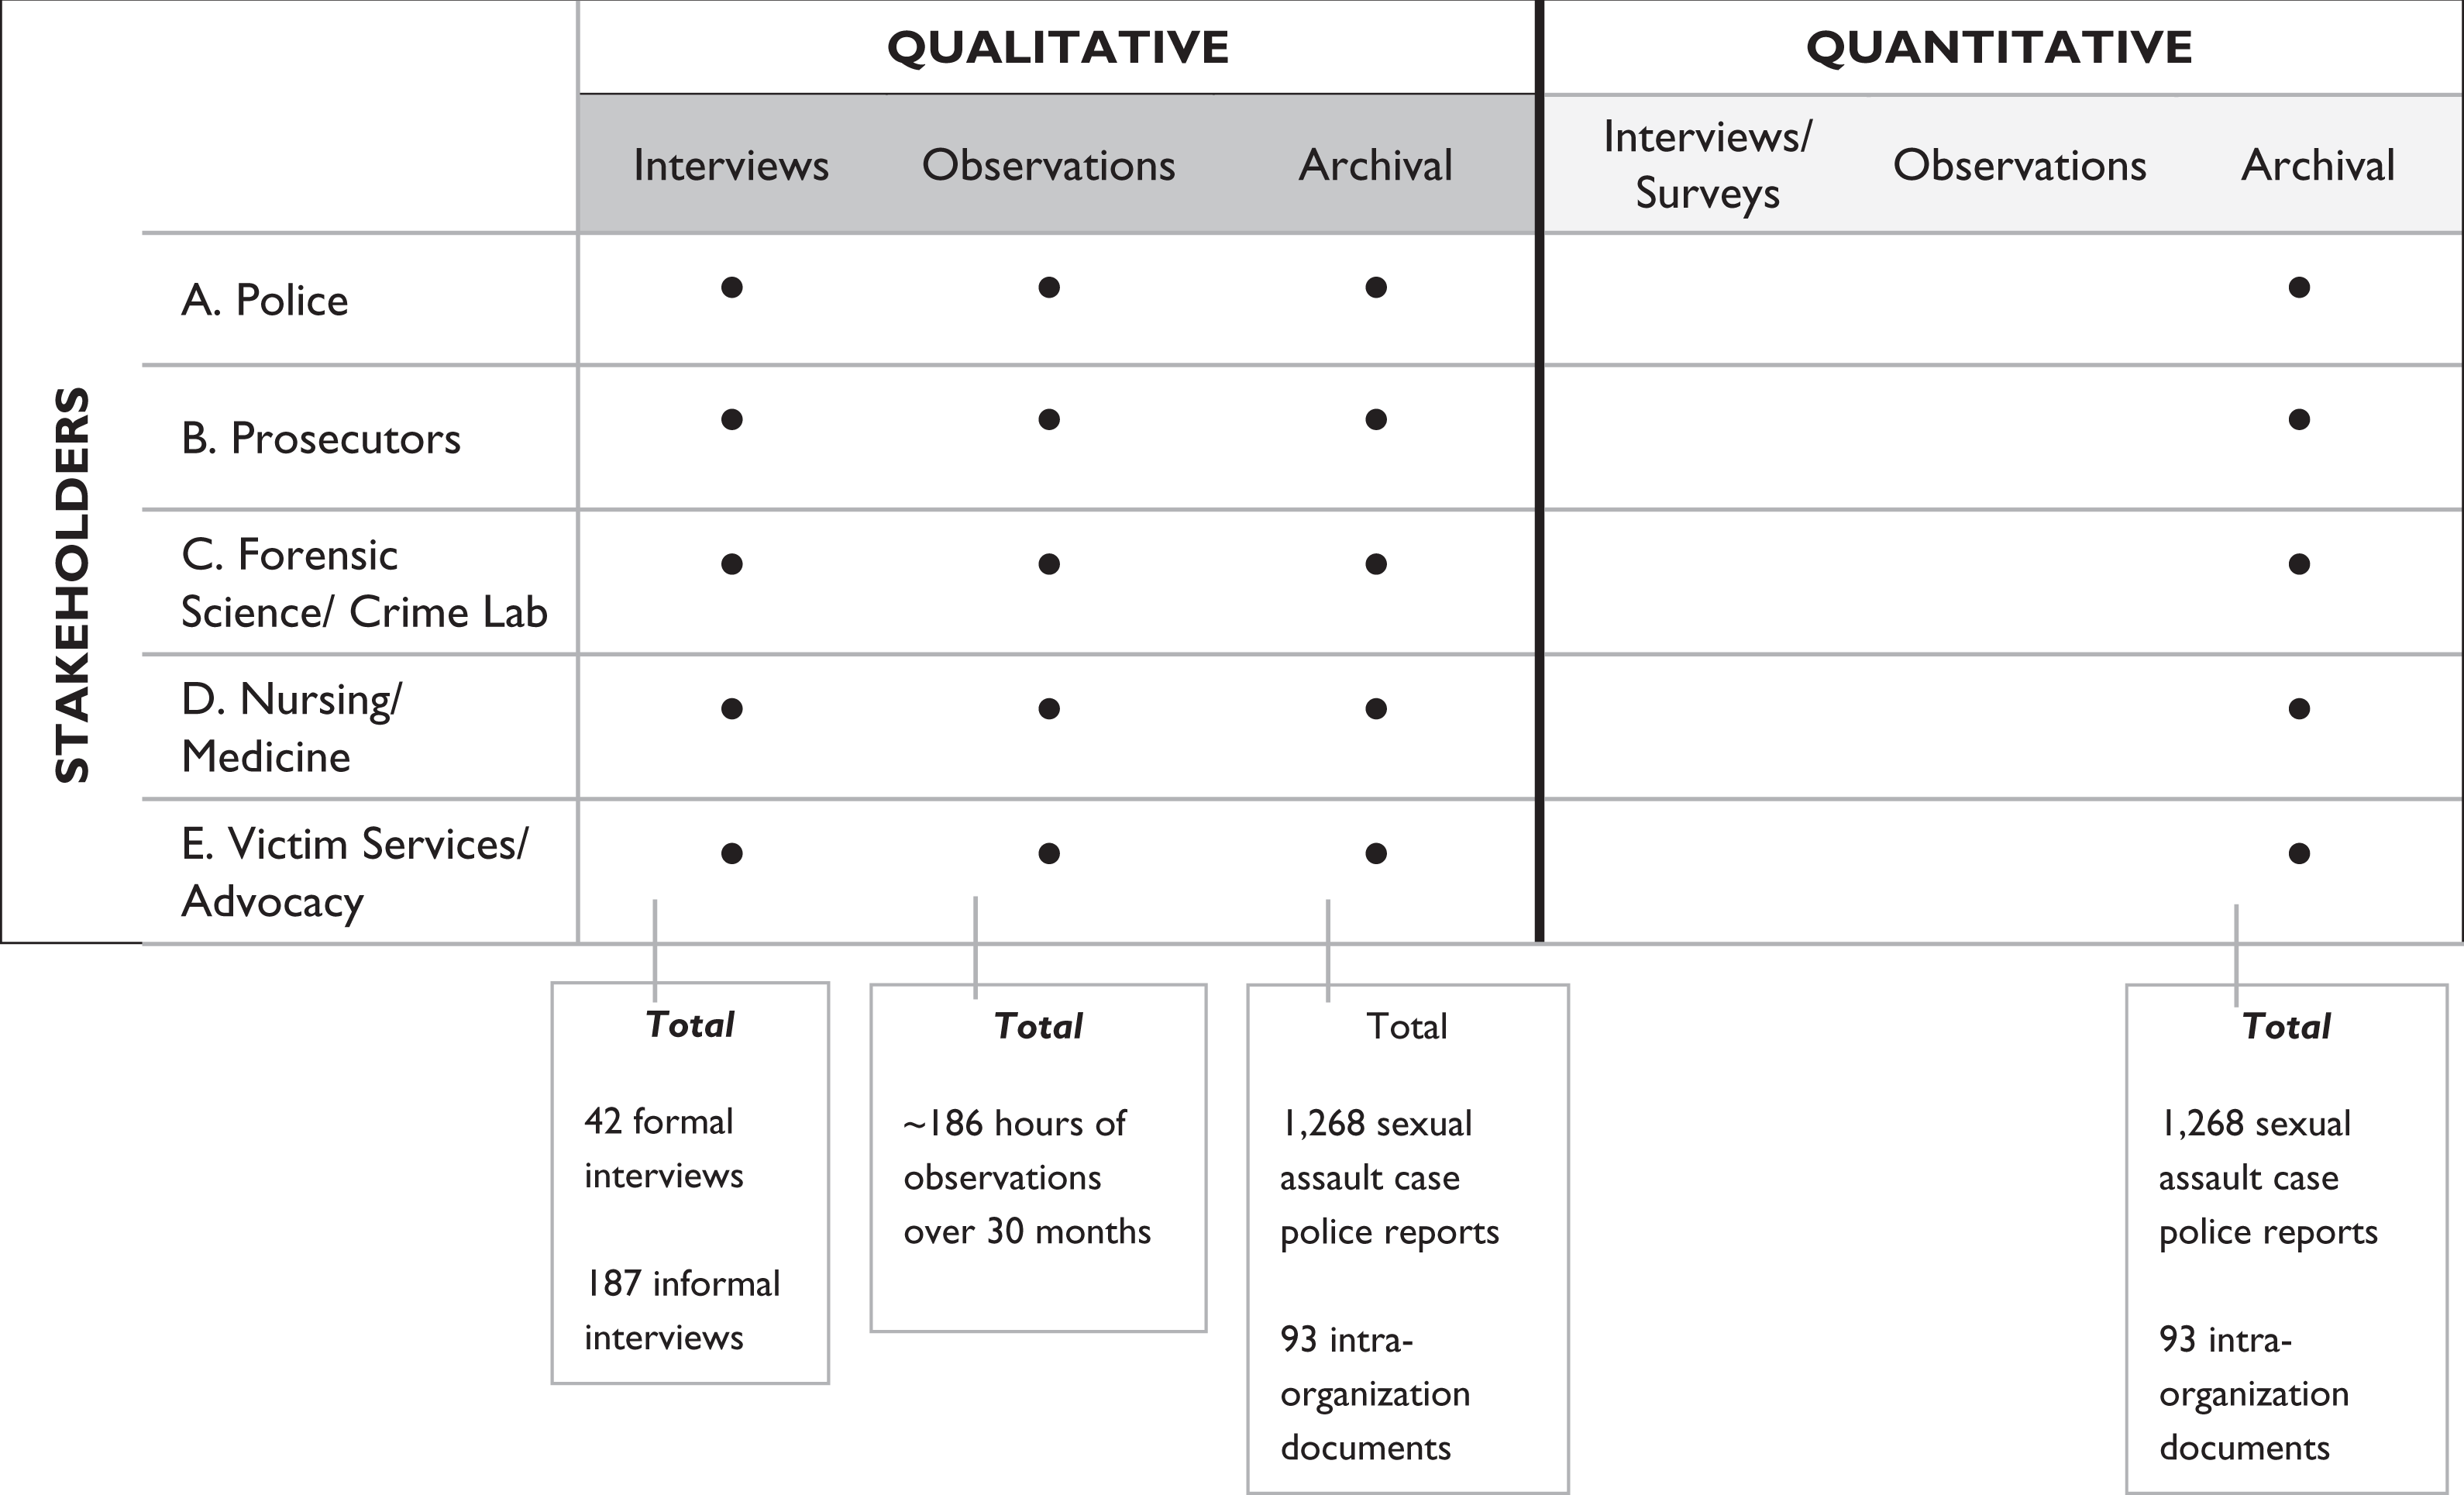
Mixed Methods Triangulation Design for the Detroit SAK Action Research Project.
We used multiple data collection methods with each stakeholder group, including qualitative ethnographic observations, qualitative interviews, and archival records that were qualitatively and quantitatively coded (e.g., sexual assault police reports, intraorganizational records of staffing levels, policies and procedures, see Figure 2). For the qualitative observational and interview data, we included high-level leadership and frontline practitioners from each stakeholder group, as well as current and former employees (e.g., key individuals who had changed positions or retired but were once closely involved in the issue of SAK processing). The data were reasonably well distributed across stakeholder groups, such that we had multiple observations, interviews, and archival records within each stakeholder group and across all stakeholder groups (see R. Campbell et al. [2015] for more information regarding how data saturation was monitored throughout the project).
Triangulation Coding Procedures
Throughout data collection, the evaluation team open coded all data sources to capture emerging themes and monitor data saturation (Corbin & Strauss, 2008; Miles, Huberman, & Saldana, 2014). We used a standard word processing program to conduct this coding, though specialized qualitative software programs are also available. The open codes captured two kinds of data points: (1) factual information that may be of interest in future analyses (e.g., dates that key events occurred, staffing levels over time) and (2) emerging qualitative themes (e.g., beliefs about rape victims, level of investigational effort invested in a case). We then reviewed all open codes across all data sources to decide which data points should be subjected to triangulation analyses. Given the labor involved in conducting such an analysis, we did not seek to triangulate every piece of factual information/thematic code but only those pertaining to our focal research question regarding why this city had amassed so many untested rape kits (see Mathison, 1988).
To assess triangulation of a data point, we compared the information that was provided about that fact/theme by each stakeholder group to determine whether individuals within the same stakeholder group provided the same information and whether individuals from different stakeholder groups also provided the same information. Likewise, we checked whether the same information appeared across different data collection methods (e.g., the same fact/theme that emerged in a qualitative interview could be verified in archival records). Table 1 provides the operational definitions of green, yellow, and red triangulation codes that guided our work. Once we were deeper in the data, we decided to form two “green” codes: dark green to reflect that information converged across methodology, data collection method, and stakeholder group (all three), and “regular” green to reflect convergence across any two (methodology, method, or stakeholder). Again, we used standard word processing and spreadsheet programs to track this work; specialized qualitative software also provides options for conducting these comparisons. Two members of the evaluation team completed this process of comparing information across stakeholder groups and data types (i.e., investigator triangulation), as this task required judgment regarding the extent to which the information converged/did not converge (MacQueen, McLellan-Lemal, Bartholow, & Milstein, 2008). The coders reviewed and discussed the compiled information and then, using our green-yellow-red color-coding system, evaluated the extent to which each data point converged across methodology/method/source. There was consistently high agreement between the coders for the dark green, green, and red codes; yellow codes required more extensive review to determine the final triangulation code. Data points that were green or yellow proceeded to the next stages of data analyses (see Results for our rationale to analyze yellow data). For qualitative data, we employed Erickson’s (1986) analytic induction method to identify mechanistic assertions that linked individual themes together into a hypothesized explanation for why SAKs went untested for decades. The quantitative data were analyzed with multilevel logistic regression to examine whether historical and contextual factors (e.g., the date when federal funding for DNA testing became available) predicted SAK testing rates (see R. Campbell et al. [2015] for details).
Triangulation Coding Operational Definitions and Examples.
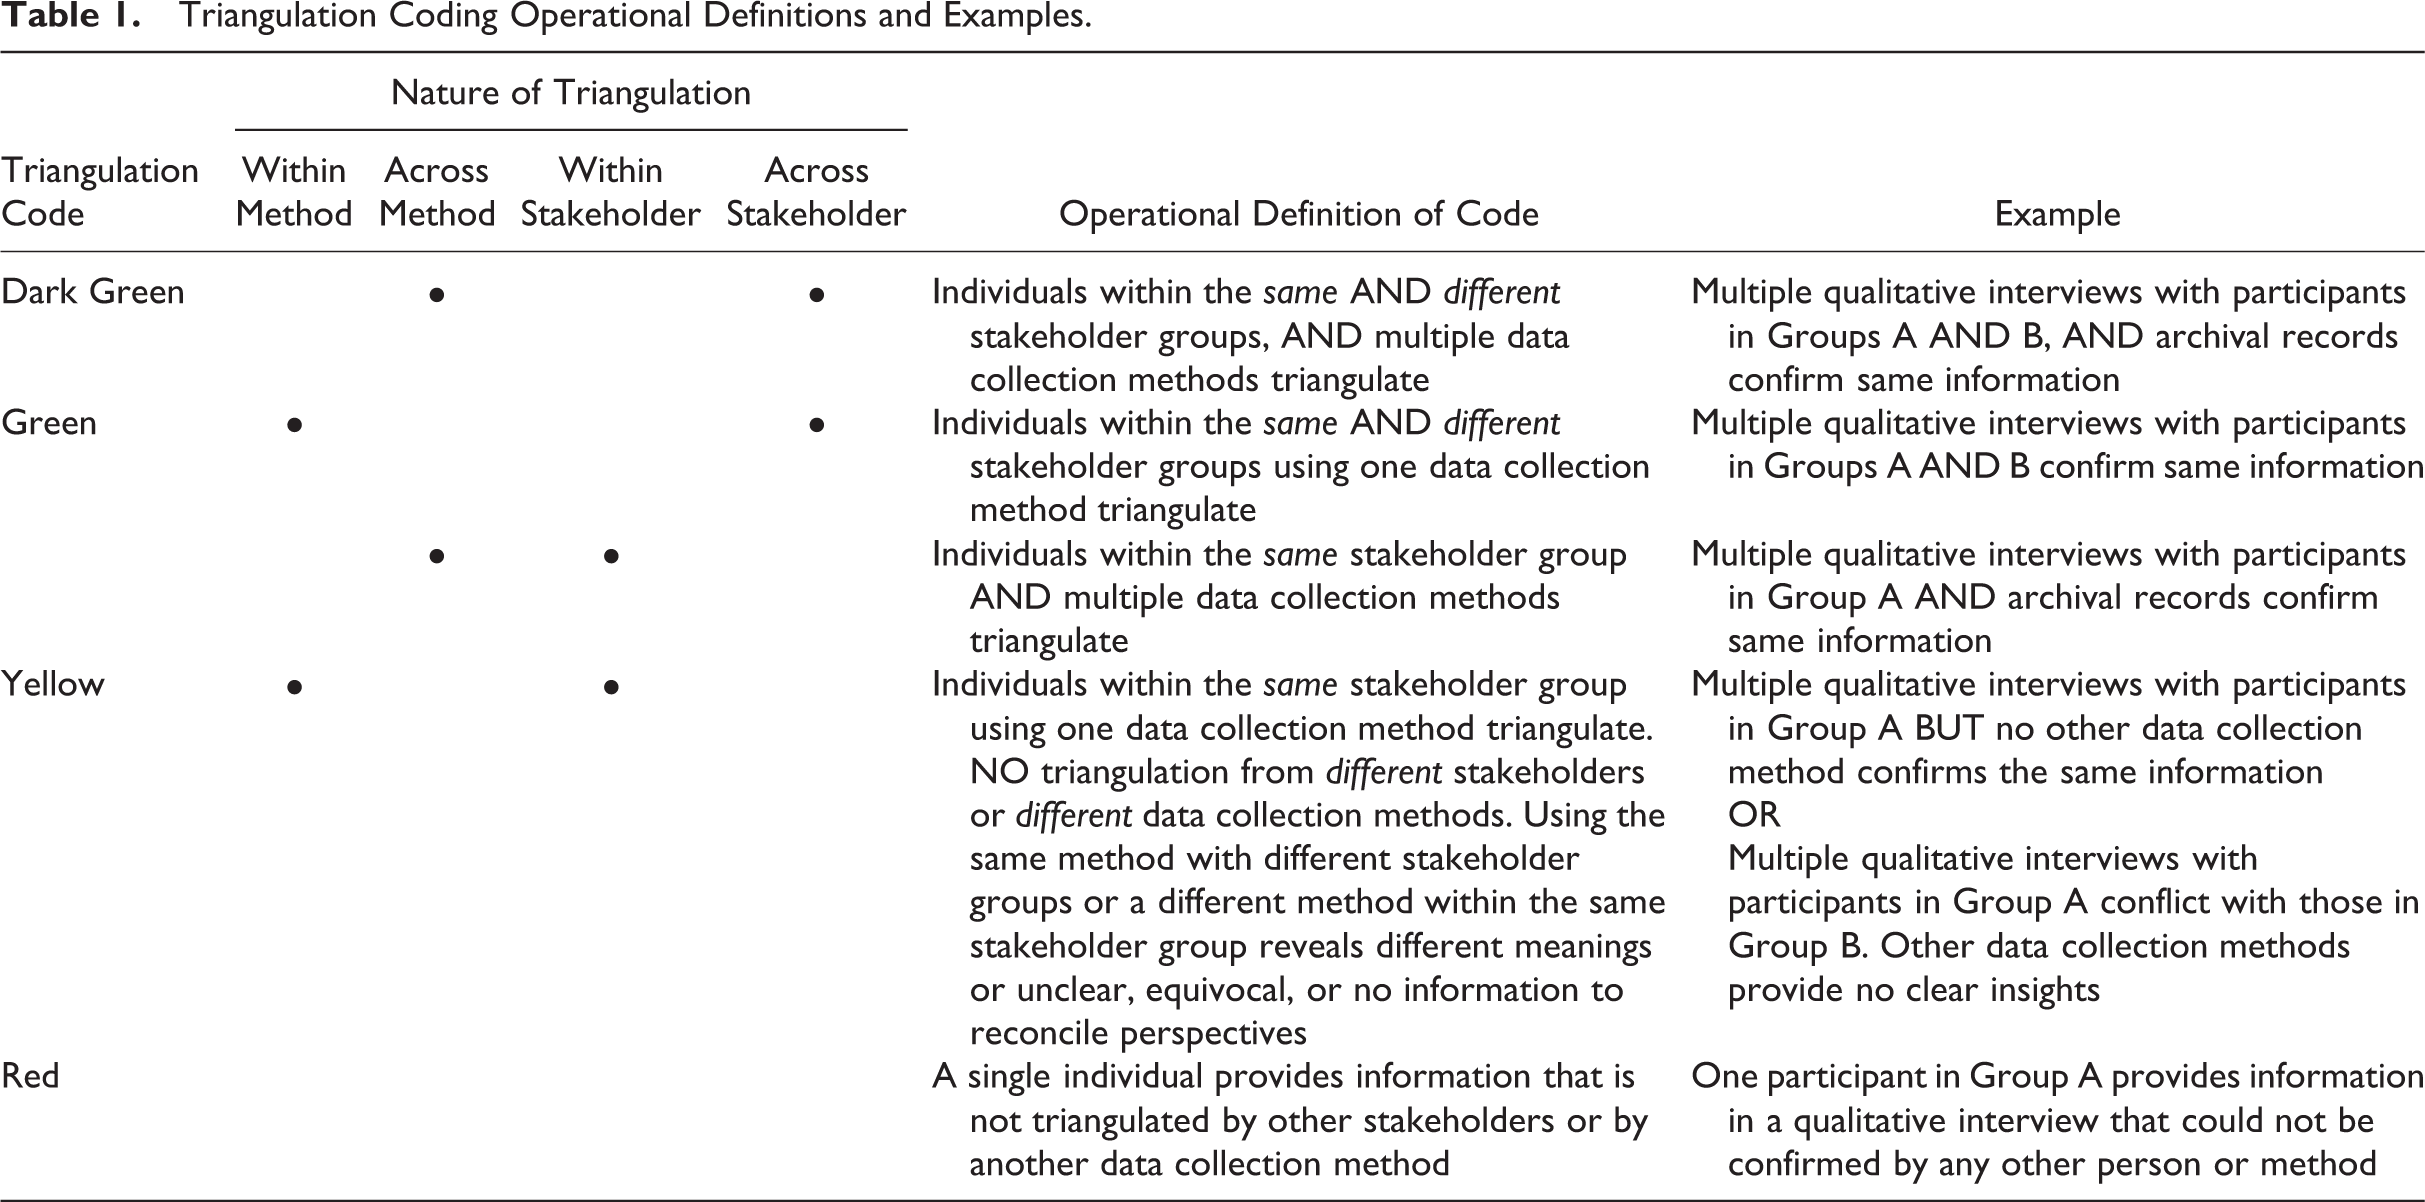
To assess triangulation of a finding that emanated from further analysis of a data point, we applied the same codes in Table 1 to each finding. For our qualitative results, the themes within each assertion had already been triangulated as data points, thus our task was to ascertain whether the mechanistic assertion in the finding could be supported with other qualitative or quantitative findings. For the quantitative results, we examined whether statistically significant effects in the multilevel logistic regression model were also identified as salient and important in the qualitative data (and vice versa for nonsignificant findings).
Triangulation Case Studies Selection
The final step in our analysis was to select specific triangulation case studies for discussion with our stakeholders and for inclusion in this article. We brought green, yellow, and red triangulation results (data points and findings) to our practitioner and policy colleagues for review, so that we could consider implications of both convergent and divergent data. We had complex confidentiality concerns to navigate in those discussions as IRB regulations stipulate that data cannot be released in identifiable form. In close-knit, long-term projects, it is quite possible that deidentified data are recognizable to those inside the project. Stakeholders might be able to recognize a source (by the content, word choice, speech mannerisms, etc.), even if it was properly deidentified for outside dissemination. Whenever possible, we used common strategies to protect confidentiality, such as lightly editing interview excerpts to remove distinctive language, but our best option was to develop case study summaries that synthesized which data were compared and what we found in that comparison. We were mindful of Rallis’s (2015) arguments regarding transparency, and we worked with our community partners to find an acceptable balance between protecting confidentiality and presenting details (see R. Campbell et al. [2015] for extended discussion of IRB and ethics issues in this project).
Results
“The Unreliable Narrator:” A Case Study of Red and Yellow Data Points
In literature, an unreliable narrator is someone who tells a story while layering a distorted lens over that reality such that the resulting narrative becomes untrustworthy. Whereas the concept of “truth” is a subject of debate in qualitative research (Lincoln, Lynham, & Guba, 2011; Randall & Phoenix, 2009), in an evaluation context, it may be helpful to at least know whether a participant’s views may be unreliable and untrustworthy. For example, in our efforts to understand why so many rape kits in this jurisdiction were not submitted for forensic DNA testing, we inquired about the focal police department’s policies regarding submitting kits for testing. Multiple stakeholders in that organization stated that the department had a written SAK submission policy, but when we asked (repeatedly) to see that policy, we were not provided with any documentation; other stakeholder groups said they had never seen the policy and when they also tried to obtain a copy of the documentation, none was provided. We could not verify the existence of this policy through any source external to this organization or through another data collection method. The triangulation code for this data point was yellow: Individuals within the same organization provided consistent information, using the same method, but no outside source (i.e., another stakeholder group) or data collection method (i.e., archival record of the written policy) could verify this information. Given the salience of this matter (whether there was a written policy regarding SAK submissions and testing), we decided to discuss this data point in our final report, highlighting it as “yellow” information to be clear that the focal organization stated it had a policy, but we could find no tangible evidence of its existence. As evaluators, we felt that the yellow data were credible and actionable and highlighted this finding in our dissemination, a decision supported by other organizations in the action research project.
Digging deeper into the transcript of the individual who first told us that the police department had a written policy about SAK testing, we noticed that other key details—such as the sequence of events regarding the discovery of the untested kits, descriptions of meetings about that discovery, dates of key events, who was involved in these events—could not be triangulated at all. These data points were coded as red because no other individuals within or across stakeholder groups—or another data collection method—could verify the information as provided. Reviewing these red data points revealed an interesting pattern: Each piece of (unverified) information presented the focal organization in a better light—slight differences in the timing of events, sequences, and actors involved that together helped portray the organization as less blameworthy. The interview was replete with these systematic shifts and slights, interspersed with information that did triangulate either across stakeholders or data collection method (i.e., green). When we rechecked our qualitative field notes regarding our interactions with this individual (in team meetings and in the interview itself), we had not made any mention that we were suspicious about the veracity of the information provided; rather, our notes indicated that this individual was straightforward, informative, and helpful. And, it turns out, incorrect—incorrect in a patterned, predictable way. It is not surprising that someone might spin a narrative to favor a particular perspective, and again, some qualitative researchers might find that an interesting issue to pursue in its own right. Our point is that we did not know and could not tell that the information was inaccurate until we conducted this triangulation analysis. Had we used these specific data points, as provided by this individual, we would have disseminated incorrect information that would have cast this organization in a better light than was warranted. Based on the results of the triangulation coding, we (the evaluation team) decided that this transcript should not be included in subsequent analyses. We checked whether the exclusion of the transcript would remove unique points of view from consideration (i.e., perspectives not shared by others but not inaccurate). The transcript contained multiple inaccuracies but also other ideas and comments that were raised by other stakeholders that could be independently verified.
“Don’t Go There:” A Case Study of a Red Data Point
This case example highlights a different contextual meaning of red data, not as information that is unverifiable due to inaccuracies, but as a signal from the participants to the evaluator/researcher: don’t go there, this is not an issue we want to discuss. In nearly all of our qualitative interviews, stakeholders discussed the problem of chronic burnout: Staff were overworked and undercompensated in extremely difficult working conditions with minimal external recognition for their work. However, one participant stated that staff were experiencing not only burnout but also vicarious trauma, a condition experienced by those in helping professions, such that repeated exposure to highly upsetting, traumatic material starts to change people’s cognitions and behaviors, often decreasing their compassion and empathy for others (Figley, 1995; Office for Victims of Crime, 2017). This participant posited that investigating sexual assault cases was causing vicarious trauma among service providers, and this trauma was negatively affecting their personal health and well-being and, ultimately, the quality of their professional work (e.g., treating rape survivors with decreased respect and empathy). This was a distinctive point of view, one that readily stoodout while we were open-coding the data; however, as the analyses proceeded, we did not find other mentions of this idea from other stakeholder groups in observational data, interview data, or archival records.
When we initially reviewed this red data point, we were unsure whether this was an instance of missing/incomplete data or unique data. Given that we were conducting follow-up interviews with participants, as well as informal interviews throughout the project, we attempted to broach the subject of vicarious trauma and ascertain whether others also felt it was a salient issue, but they had not mentioned it in their interviews (i.e., red due to missingness that could convert to yellow or green data) or whether this was indeed a unique perspective (i.e., red due to uniqueness that would remain red). In that follow-up work, we realized that this code was red because participants did not want to talk about this subject—it was not accidentally missing, it was purposely missing. It was an off-limits topic as stakeholders gave numerous verbal and behavioral indications when directly asked that this was not something they wished to discuss. Thus, the data point would remain red, due to uniqueness, and we had to decide what to do with the information we had learned. This project was not intended to be a study of vicarious trauma—there was no indication in any of the research materials, consent forms, and so on, that indicated to the participants that this would be a subject of inquiry, and we respected participants’ limits and did not pursue any further analyses on this topic. However, we did disclose in our final written report (which was previewed by the stakeholders prior to submission to the funder) that this topic came up in the project but was not deemed focal by the stakeholders. We debated whether inclusion of this example here, in this article, pushed those limits, but because we had already signaled to stakeholders that we retained the option to mention the absence of this theme (as we did in the final report), we decided to tell this story, and its backstory, here to advance discussion about the underlying reasons why data may be missing or unique in triangulation coding.
“Saving Our Bacon:” A Case Study of a Dark Green Data Point
A long-standing theme in the triangulation literature is that converging data lend credibility to the findings, so researchers/evaluators can feel more confident in their findings when responding to challenges of their work leveled by the scientific community. In this case example, we explore how well-triangulated data can also help researchers/evaluators withstand political fire and pushback from powerful stakeholders. In our qualitative interviews with law enforcement personnel, we asked why they did not submit some SAKs for DNA testing, probing whether there were particular kinds of cases or situations in which their standard practice would be to store a kit instead of test it. Multiple police representatives specifically stated that if they thought the victim had been engaged in prostitution at the time of the assault, they were suspicious as to whether a “real” crime did in fact occur, so they were less likely to submit an SAK for DNA testing. When asked how they knew a victim might be engaged in sex work, their answers tended to become vague, noting that maybe it was the time of day, the location, or just a “you can tell” feel. Regardless of whether they had proof the victim was engaged in prostitution, the suspicion thereof was sufficient, in their view, to question whether a crime occurred and therefore to store a kit instead of testing it for DNA. Police discussed this issue freely in their interviews, and sometimes publicly in team meetings, which were captured in our observational field notes. This belief was also reflected in actual police reports (i.e., there was written documentation that because they thought a victim might have been engaged in prostitution, they did not believe her account of the sexual assault). In interviews with other stakeholders groups, participants noted that they were aware of this practice by police and gave specific examples of cases in which they had seen this practice. Given how strongly this theme triangulated (i.e., dark green), we were confident in moving forward to explore how this “presumption of prostitution” theme was related to other data points, such as police investigational effort and how victims were treated by the police.
For the members of the evaluation team, this was clearly a credible and actionable finding, as it revealed problematic practices that needed to be remedied with training, supervision, and broader organizational norm-setting, so we brought it to our community partners for discussion. We anticipated that we might get some pushback from police personnel about our public airing of this theme and subsequent findings pertaining to this theme, and indeed, law enforcement challenged us on this specific issue. The triangulation assessment had helped us identify and organize incontrovertible evidence, which we could—and did—lay out for stakeholders to refute their assertion that this was practice was not common. The triangulation data saved our bacon when we were attacked for presenting controversial, politically sensitive information. As stakeholders continued to discuss these results, they agreed that all organizations in the partnership would benefit from additional training on best practices in working with sexual assault survivors, which was instituted a few months later.
“Agree to Disagree:” A Case Study of a Yellow Finding
Triangulation coding requires judgment as to whether the perspectives of stakeholders and/or information provided by different data collection methods/sources converge and coalesce into a common, unified finding, and these judgments can be hard to make in practice. An issue in this case example was a qualitative finding that race, gender, and social class oppressions were key contributing reasons why the police did not submit rape kits for testing and investigate these reported sexual assault cases. The vast majority of the rape survivors whose SAKs were not tested for DNA evidence were Black women/girls, many of whom lived in poverty (per U.S. Census data for Detroit). All stakeholder groups made note of this, except the police. In other words, we had interview data from multiple stakeholders regarding the intentions and behavior of another group (the police), who, when this issue was raised in the collaborative team meetings, vociferously refuted the assertion that their actions were rooted in race, gender, and class bias. Police representatives highlighted that many members of the department were African American and many were female, and that among the higher leadership ranks of the department, women and African Americans have been well represented throughout the years. To our ears, this rebuttal seemed wholly consistent with theories of institutional racism, which emphasize that it is possible to have individuals in leadership positions who are women and/or people of color within institutions that have systemic, structural-level policies and practices that promote oppression and systematically deny or limit access to goods, services, and opportunities in society, including the right to safety and protection (Alexander, 2012; Bonilla-Silva, 1997; Sidanius & Pratto, 2001). However, this is an interpretation of the argument put forth by the police to challenge a finding; going back to the finding itself, how should we characterize the extent to which this finding was triangulated across stakeholder groups and data collection methods?
Within the evaluation team, we debated how to assign a triangulation code to this finding. The interviews were consistent across stakeholder groups, except for the group at the center of this finding. We had observational data documenting these arguments during stakeholder team meetings, but these data seemed to be more a public airing of information that had been disclosed in individual interviews rather than an independent data source. In the archival data, we saw direct behavioral indicators of sexism in that victims were referred to as “ho’s” and “heffers” and other derogatory names. Given that most of these victims were poor African American women and girls, it seemed inconceivable to us that these derogatory references weren’t also steeped in racism and classism, even though specific racialized language in the reports was rare. Taken together, some coders felt this information merited a green triangulation code (i.e., a variation on across-method, across stakeholder triangulation); however, other coders thought yellow was the more appropriate code because the data from the stakeholder group at the heart of this finding (the police) did not triangulate and the archival data did not provide, in their view, clear support either. All coders did agree that if we were to label this finding as green, such a designation would obscure the controversy about this matter and would not clearly convey that there were vastly different perspectives on this issue.
In the end, we decided on yellow as the triangulation code, as it reflected the conflicting views among stakeholders and the “agree to disagree” decision within the evaluation team, as we didn’t feel entirely settled with this assessment. To the evaluators and to all project stakeholders except the police, this was deemed an actionable finding, one that merited inclusion in our final report, in subsequent publications, and in training curricula that emanated from this project. As expected, the police “agreed to disagree” with the inclusion of this finding in the report (and other outlets) and asked that we include their objection and their rationale for their objection, which we readily agreed to do as it helps convey the disparate perspectives in these data. This case example highlights what would be problematic about presenting only convergent data for analysis and dissemination. Including “yellow data” provides a way for evaluators to document and explain the nature of contested spaces.
“One Way or Another:” A Case Study of Yellow and Green Findings
In our efforts to understand how and why Detroit amassed so many untested rape kits, we examined the resources available in these organizations over time to understand whether they realistically could have responded to all reported sexual assault cases and tested all rape kits. We asked stakeholders which specific resources (programs, funding, staff) were particularly helpful to them and why. In our qualitative interviews, multiple stakeholder groups noted that when the crime lab received a federal Department of Justice grant in 2005 to support outsourcing DNA testing, the funding was instrumentally helpful in managing testing workloads and increasing the number of kits that could be tested each year. We verified via archival records the date and amount of funds received by the crime lab, but we were not able determine how exactly those funds were allocated and what percentage of the monies were used for SAKs specifically versus testing DNA in other types of crimes. Nevertheless, stakeholders steadfastly maintained that the funds increased the number of SAKs tested. Given that we had quantitative data regarding SAK submission rates over a 30-year period of time, we decided to conduct an across-methodology triangulation assessment to explore whether the receipt of funds was associated with a significant increase in SAK submissions. The multilevel modeling results indicated that submissions for testing did increase after the crime lab received these funds, but the effect became nonsignificant in a multivariate model that accounted for other key historical events and resource changes over time. This led to a yellow triangulation code, as the findings did not converge across methodologies. Stakeholders were not surprised by these mixed, nontriangulated findings and argued that the funds—though helpful—were probably a “drop in bucket” of what they truly needed. Some stakeholders expressed concern that the mixed findings could be interpreted to suggest that the federal funding program was ineffective, but most indicated that the triangulation assessment provided useful data that they would present in future grant applications to make the case that additional funding was necessary to create demonstrable change in this community.
Another resource highlighted by stakeholders as making an important positive contribution to serving rape victims and processing rape kits was the community’s Sexual Assault Nurse Examiner (SANE) program. SANE programs provide comprehensive postassault health care and forensic evidence collection for rape victims and often function as a connector organization in their communities by bringing together stakeholder groups that work with rape victims. Most U.S. SANE programs were founded in the 1980s and 1990s (R. Campbell, Patterson, & Lichty, 2005; Department of Justice, 2013), but Detroit’s SANE program was not established until 2006, substantially later than what has been typical in many other communities. However, once Detroit did have a SANE program, stakeholders called it a “game-changer.” In the qualitative interviews, all stakeholder groups praised this program for the quality of the care they provided to victims and the technical accuracy of their forensic evidence collection procedures. In the observational data, we witnessed many meetings in which this program was heralded by other stakeholder groups. In archival data, we saw a qualitative change in sexual assault police reports over time, as more detectives were clearly working in collaboration with the forensic nurses to document medical forensic evidence. Again, we had data available for an across-methodology triangulation to explore whether SAK submission practices changed after the implementation of the SANE program. In the multilevel model, this variable was associated with a significant increase in rape kit testing, accounting for linear time trends and other historical events and resources. These were clear, unequivocal findings that the SANE program was instrumental in this community’s response to sexual assault and the problem of untested rape kits (i.e., dark green triangulation code). Detroit-area and state-level policy makers were quick to disseminate these findings and advocate for increased funding for SANE programs. The triangulation coding provided directly useful data for practitioners and policy makers, and “one way or another…whether it’s good or bad, now we know and we can use this information,” one stakeholder noted, to help advocate for needed resources.
Discussion
In this study, we wanted to extend the technical literature on triangulation by developing and implementing an assessment procedure for use in a large-scale project that spanned multiple methodologies, data collection methods, and stakeholder groups. We created a color-coded system that evaluated the extent of within and/or across source convergence of individual data points and larger findings that came from further analysis of those data. The green-yellow-red color codes further distinguished whether divergence was attributable to conflicting information or missing/unique data. The coding procedures we established were straightforward to implement with standard word processing and spreadsheet software and did not require specialized qualitative analysis software. However, because the underlying logic of this approach is rooted in Glaser’s constant comparison process (Glaser, 2007), the coding framework and operational definitions we developed (Table 1) could be easily implemented in specialized analysis software. Overall, we spent 3 weeks (in a 30-month project) working on these analyses; the volume of data to be scanned increased time-to-completion, but the coders’ deep familiarity with the data prior to conducting the triangulation analyses helped our timeline. Consistent with Mathison’s (1988) perspective that evaluators need to think carefully about what merits triangulation and why, we did not assess convergence for every data point, and instead restricted our analysis to a primary focal question and to specific data points/themes pertaining to that question.
We acknowledge that our coding system does not capture as much detail as the procedures proposed by Farmer et al. (2006) and Sands and Roer-Stier (2006) because it does not “roll in” to the coding an interpretation of the disagreement (e.g., “silence,” “dissonance,” “illumination”). Given the tremendous volume of data we had to scan, we felt this was a reasonable modification: This coding system reliably locates and distinguishes convergent and divergent data, with some initial context about the nature of disagreement (i.e., yellow/red) that can be explored with stakeholders in later stages of analysis. We also note that our coding methods and case study examples do not address the conceptual and technical issues of assessing triangulation longitudinally (see Denzin, 1978). Across-time triangulation has not been well explored in research to date, and such work would need to consider whether change over time reflects a “failure” in triangulation or a substantive outcome (akin to how low test–retest reliabilities may reflect development, not unreliability per se; Singleton & Straits, 2018). In this action research project, our aim was to transform this city’s response to sexual assault, so change over time was a desired outcome. What across-time triangulation means in such contexts is complicated, as direction and rate of change over time may or may not converge across stakeholder groups and across data collection methods. We hope that braver evaluation teams will venture into this conceptual and methodological work.
In this triangulation project, we also wanted to explore the intersection of the technical and political levels of inquiry to explore how divergent data are interpreted and acted upon by evaluators and stakeholders (Greene & Caracelli, 1997). Historically, triangulation has been conceptualized as an indicator of validity, validity as a component of credibility, and credibility as a determinant of action (Mark, 2015). Thus, it might be expected that only convergent data (i.e., dark green/green) would be considered credible and actionable, as these data points/findings were consistent across methodology, data collection method, and or/stakeholder group. However, in this project dark green/green, yellow, and red data were viewed as credible by both the evaluation team and stakeholders; direct action was taken based on dark green/green and yellow data. In other words, disputed, conflicting data were considered a reasonable evidence base for action—why?
As Miller (2015) pointed out, the accuracy of evaluative findings influences stakeholders’ perceptions of credibility, and triangulation coding provides a structured way of checking for inaccuracies. We were concerned that stakeholders might provide misinformation to try to influence the findings, as was highlighted in the “The Unreliable Narrator” case study. Our decisions to cross-check information, to be transparent with our partners that we were doing this, and to remove incorrect information from the analyses boosted our credibility with our stakeholders as it signaled that we were aware of the politics at-play. Collecting corroborating evidence is standard practice in the criminal justice system, and our use of those techniques in the evaluation helped established trust, but we acknowledge that in other settings and systems, triangulation assessments might not be as positively perceived by stakeholders.
Whether evaluation findings are perceived as credible and actionable is also influenced by the extent to which stakeholders can “see” the process by which the findings were generated, particularly so in qualitative evaluation (Rallis, 2015). As the case studies “Saving Our Bacon” and “Agree to Disagree” illustrated, we had some rather damning stories to tell in this project. The data were clear that rape myth acceptance was a key reason why police did not submit rape kits for DNA testing, and the triangulation coding helped us compile and organize information to show the police how we reached this conclusion. We were able to capture disagreements regarding the role of sexism, racism, and classism in the law enforcement response to sexual assault, and these disputes are part of the story (Greene et al., 2001). That our findings “showed” these conflicts was important to stakeholders and increased the credibility of the work as a foundation for action.
Sometimes, we did not have sufficient evidence to be able to tell a story, and therefore, nothing to show” and act upon. In the case study “Don’t Go There,” our initial thought was that our red data point regarding vicarious trauma among service providers reflected incomplete data that would triangulate with more data collection. It did not. Instead, we learned that this was an off-limits topic to stakeholders. We did not feel that we had sufficient data to make a claim that vicarious trauma had affected police actions in these cases of untested rape kits, but there was a short story to be told about why we could not make this claim. We elected to tell that story here to emphasize that triangulation coding can reveal more than simply convergence and divergence. Here, it uncovered what seemed to be an important subject for future research and evaluation, but one that was ultimately out of scope for this action research project, despite our best efforts to understand its relevance.
Finally, credibility and usability are evaluated by stakeholders in situ, and what is relevant and needed in that context is paramount (Greene, 2015; Julnes & Rog, 2015; Schwandt, 2015). The context of this work was what one stakeholder termed “an unimaginable public safety crisis:” 11,000+ sexual assaults had been reported to the police and it was wholly unclear how many of these cases had been thoroughly investigated, given that key evidence sat untested. This city needed to understand what went wrong and how to fix it—quickly—because the clock was literally running as the statute of limitations on these criminal cases was expiring. Our action research project had to address immediate, pressing needs: Did the city have any resources to leverage to address the problem, and what resources did they need? In the “One Way or Another” case study, we saw that even conflictual information about the utility of specific resources was helpful and actionable for stakeholders as they sought to remedy this problem. It wasn’t “perfect” information by any means, nothing that would sit near the top of any “hierarchy of evidence” model (see Schwandt, 2015 for a critical review). Yet, the triangulation assessments helped stakeholders understand “what was certain and what was uncertain,” as one leader noted, and that information, in this context, was sufficient evidence for action.
Footnotes
Authors’ Note
The opinions or points of view expressed in this document are solely those of the authors and do not reflect the official positions of any participating organization or the U.S. Department of Justice.
Acknowledgments
The authors thank the members of the action research project and academic colleagues who provided feedback on prior drafts of this manuscript.
Declaration of Conflicting Interests
The author(s) declared no potential conflicts of interest with respect to the research, authorship, and/or publication of this article.
Funding
The author(s) disclosed receipt of the following financial support for the research, authorship, and/or publication of this article: The action research project described in this article was supported by a grant from the National Institute of Justice (2011-DN-BX-0001).