
Abstract
We studied the transition from elementary to middle school for 74 fifth-grade students. Specifically, we examined how behavioral risk evident in the elementary years, as measured by the Student Risk Screening Scale (SRSS), impacts students transitioning from elementary to middle school. First, we examined how student risk status shifts as students transitioned from elementary to middle school, also exploring whether these shifts in risk were comparable with the shifts in risk occurring within the fifth-grade year. Second, we explored the degree to which these shifts in risk varied as a function of student gender, special education status, and initial behavioral performance. Although gender was not predictive of performance, there was a positive relation between special education status and initial behavioral risk when compared with risk evident during the sixth-grade year. Finally, we determined the extent to which risk at the end of elementary school was associated with academic and behavioral performance during the first year of middle school. Findings suggest a strong relation between grade point average (GPA) and course failures (CFs) with behavioral risk in sixth grade. As expected, there was a statistically significant, positive relation between CFs and sixth-grade SRSS scores and an inverse relation with GPA.
Schooling constitutes a series of overlapping transitions for all students. Movements students make across the grade span are marked by myriad individual, instructional, and institutional changes that can impact the success of their educational experiences and prospects for postschool success. Perhaps most conspicuous among these transitions are the moves students make from one school to the next. Although the timing and configuration of these particular moves vary somewhat within and across school districts, each represents distinct transition points around which effective supports and interventions may be especially needed. Much attention in research, policy, and practice has focused on two of these transitions: the initial entry into school (Rimm-Kaufman & Pianta, 2000) and the final exit out of school (Bloom, 2010; Test et al., 2009). However, there are equally salient school transitions occurring along the way between these two educational markers. In particular, the shift from elementary school to middle school represents an especially important time period for students that warrants much greater attention in the field (Carter, Clark, Cushing, & Kennedy, 2005).
Entry into middle school marks a period of potential change and adjustment. For example, students typically experience a constellation of developmental changes as they approach early adolescence, which can be complicated for some students to navigate. Socially, the expectations and structures associated with peer relationships increasingly shift in focus from adults toward peers (Rubin, Bukowski, & Laursen, 2009). Although new relationship possibilities can emerge as peers converge from multiple feeder schools, challenges related to peer acceptance and rejection can also be heightened (Kingery, Erdley, & Marshall, 2011).
These individual changes often occur in the midst of substantial instructional and institutional changes as well. For example, curricular content often becomes more challenging, educators increasingly expect students to assume greater responsibility for managing their own learning, and individualized attention and supports may be somewhat less available (Clements & Seidman, 2002; Lane, Parks, Kalberg, & Carter, 2007). Changes in grading practices also may accompany these new learning contexts as academic standing may receive increased emphasis (Randall & Engelhard, 2009). At the same time, the approaches many schools use to respond to behavioral infractions can look quite different between elementary and middle school (Theriot & Dupper, 2010). Structurally, differences in the settings in which students spend their day can also be quite pronounced. Often, students find themselves leaving smaller, tighter-knit schools to ones that are substantially larger and potentially less personalized in their support (Irvin, 1997). For example, whereas elementary students may spend most of the school day with one or two educators and a consistent cohort of peers, middle school students may have to learn to navigate the expectations of as many as seven different teachers amid hundreds of different classmates.
The transition to middle school represents a critical juncture for students with and without disabilities. For some students, this constellation of changes may set the context for declines in academic achievement (Alspaugh, 1998) and motivation (Anderman & Maehr, 1994), as well as the emergence of new attitudes and behaviors that place them at heightened risk for school failure. For students who do not successfully navigate this transition, the long-term impact can be particularly concerning (Estell et al., 2007). Therefore, it is not surprising this particular segment of schooling has been highlighted as a crucial time to introduce interventions and supports to early adolescents who may be at heightened risk for poor achievement, lack motivation to learn, display conduct problems, and experience strained peer relationships (Akos, Queen, & Lineberry, 2005).
Although research addressing the transition from elementary to middle school has gradually accumulated (Farmer et al., 2010; Mullins & Irvin, 2000), additional research is needed to better understand how students navigate these particular school transitions. First, the field knows little about the extent to which student risk status maintains, increases, or diminishes as students traverse this important transition. Furthermore, the degree to which risk status may elevate (or remain stable) over the course of students’ first year in middle school (i.e., sixth grade) has received limited attention. Although middle school can certainly be a daunting place for some students, it is unclear whether or not a greater proportion of students are identified at the beginning of sixth grade relative to the semester prior to their middle school entry. Exploring such issues necessitates carefully crafted longitudinal designs in which students are followed over the course of multiple years and schools. However, most prior studies have focused narrowly on one side of this transition or other, without tracking students across time.
Second, the field has limited data addressing the extent to which risk might be elevated for particular groups of students during the elementary to middle school transition. Gender may be one salient factor to consider, as prior research suggests males may be at greater risk for some negative outcomes relative to same-age females (e.g., Petras, Masyn, Buckley, Ialongo, & Kellam, 2011). Special education status represents another factor frequently associated with heightened risk (e.g., Blackorby et al., 2007; Farmer et al., 2012). Students with identified disabilities may encounter unique or heightened challenges as they enter and progress through middle school (Carter et al., 2005). If gender or disability status were found to be associated with changes in risk status, such findings could call for focusing additional attention toward ensuring these students are well prepared and appropriately supported during this particular time frame.
Third, little is known about the ways in which early risk identification in fifth grade might set the occasion for later school challenges for students in subsequent semesters. For example, students identified by their elementary teachers as at risk for antisocial behavior tendencies or emotional or behavioral disorders (EBD) may be more likely to experience diminished academic and/or behavioral performance in sixth grade and beyond (Walker, Ramsey, & Gresham, 2004). If a strong linkage could be established between fifth-grade screening outcomes and student performance in subsequent years, educators would have access to valuable data to direct them toward the design and delivery of high-quality transition services or well-designed instruction and supports at the start of middle school (Akos et al., 2005; Schumacher, 2000).
To address these gaps in the current literature, we examined how behavioral risk evident in elementary years impacts the transition from elementary to middle school. First, we examined the extent to which student risk status as measured by a universal screening tool, the Student Risk Screening Scale (SRSS; Drummond, 1994), shifts as students transitioned from elementary to middle school, also examining whether these shifts in risk status were comparable with the shifts in risk status occurring within the fifth-grade year. Second, we explored the degree to which these shifts in risk vary as a function of student gender or special education status. Finally, we determined the extent to which risk at the end of elementary school was associated with academic and behavioral performance during the first year of middle school.
Method
Participants
Participants were 74 fifth-grade students (35 males) from two rural elementary schools in the south who transitioned to sixth grade at their local middle school. The majority of students was White (95.95%, n = 71), and 17.57% (n = 13) received special education services within the context of a full inclusion model (see Table 1). Although a total of 83 fifth-grade students graduated from the elementary schools, we excluded 9 students (7 males and 2 females, all were White and 3 received special education services) from our analyses as they were not enrolled in the middle school during the fall and spring screening time points. We analyzed data only for students with data from all three time points: spring fifth grade, fall sixth grade, and spring sixth grade.
Student Characteristics.
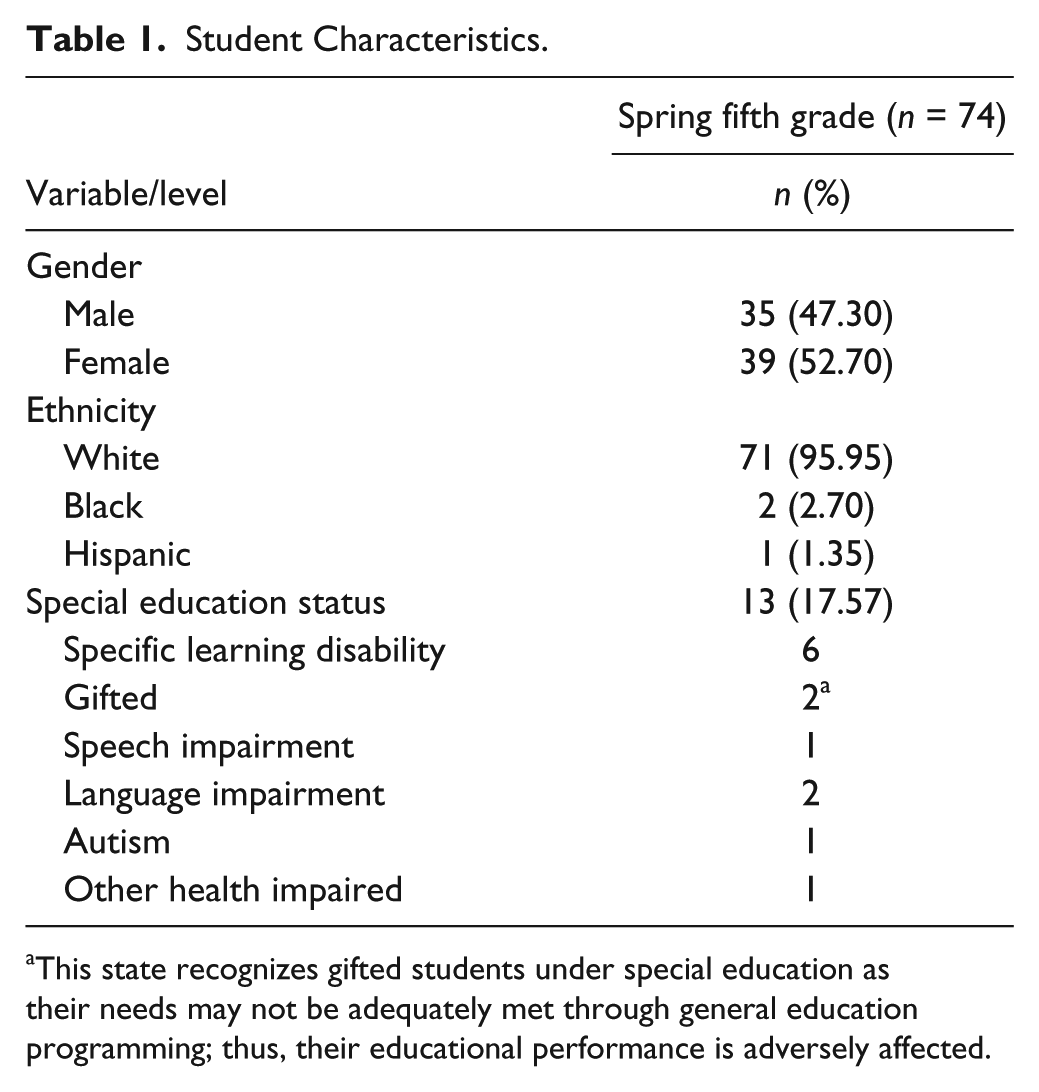
This state recognizes gifted students under special education as their needs may not be adequately met through general education programming; thus, their educational performance is adversely affected.
Elementary schools had enrollments of 124 and 441 students, with the receiving middle school serving 480 students. All schools were in good standing per No Child Left Behind Status (NCLB; 2001). Both elementary schools were Title I, with promotion rates exceeding 99%.
Procedures
All three schools implemented comprehensive, integrated, three-tiered (CI3T) models of prevention addressing academic, behavioral, and character development domains, with graduated levels of support (Tier 1, primary; Tier 2, secondary; and Tier 3, tertiary; Lane, Oakes, & Menzies, 2010). In addition to core academic curriculum, schools implemented a positive behavior intervention and support (PBIS) framework. School-wide expectations were established by faculty and staff and taught to students, including providing opportunities to practice and receive reinforcement for meeting expectations using a ticket system. The ticket system involved adults in the building recognizing students who met expectations by giving them a ticket paired with behavior-specific praise. All schools also implemented a school-wide character education or social skills program. Both elementary schools taught monthly lesson plans from the Social Skills Intervention Guide (Elliott & Gresham, 1991), focusing on the top 10 social skills rated as essential for success by the majority of faculty. The middle school implemented Character Under Construction (Forrest, 2000) per district guidelines. Schools monitored treatment fidelity of the primary plan using teacher self-report data, direct observations from the teacher and outside-observer perspectives, and the School-wide Evaluation Tool (Sugai, Lewis-Palmer, Todd, & Horner, 2001) as part of their participation in a technical assistance grant. Implementation was greater than 80% according to each method of measurement (see Lane, Kalberg, & Menzies, 2009, for a description of how their CI3T models were designed, implemented, and evaluated).
School-wide data collected as part of regular school practices (e.g., academic screening tools, grade point averages [GPAs], office discipline referral [ODR] data, and behavior screening tools) were used to make decisions as to which students might benefit from additional supports. Specifically, all three schools used the SRSS (description to follow) to monitor the overall level of risk evident in the building and link students to Tier 2 (e.g., study skills and conflict resolution skills; Kalberg, Lane, & Lambert, 2012) and Tier 3 (e.g., functional assessment-based interventions—Lane, Rogers, et al., 2007; individual counseling with the school psychologist; and direct family support facilitated by the social worker) supports. Elementary homeroom teachers and first-period middle school teachers completed the SRSS during regularly scheduled faculty meetings. Elementary teachers completed the SRSS at three time points: fall (approximately 6 weeks after the school year began), winter (prior to winter break), and spring (approximately 6 weeks before the school year concluded), with 52 students in the current sample having screening data across fifth- and sixth-grade years. The middle school teachers completed the same measure at fall and spring time points only. Demographic data were not provided for teachers, beyond publicly available directory information (e.g., grade level taught). Data were analyzed by site-level leadership teams with support from a local university via a technical assistance grant. Prior to analyzing data, reliability of data entry was confirmed by research assistants. Reliability was ≥99% for all measures, with all data entry errors corrected.
Measures
SRSS
The SRSS (Drummond, 1994) is a universal systematic screening tool designed to detect students at risk for antisocial behavior. Teachers rate each student in their class on seven items: steal; lie, cheat, sneak; behavior problems; peer rejection; low academic achievement; negative attitude; and aggressive behavior on a 4-point Likert-type scale with scores ranging from never = 0, occasionally = 1, sometimes = 2, frequently = 3. Items are summed to form total scores (range = 0–21), with higher scores suggesting higher levels of risk. Total scores are used to classify students into one of three risk categories: low (0–3), moderate (4–8), and high risk (9–21). SRSS scores are significantly correlated with the Child Behavior Checklist’s aggressive behavior subscale scores (r = .79; Walker et al., 2004). Analysis of receiver operating characteristics curves suggest the SRSS is more accurate for detecting students with externalizing behaviors (AUC = .95 ) than those with internalizing behaviors (AUC = .80; Lane, Little, et al., 2009).
GPA
GPA was computed for each individual student using the following scale: 90–100 = 4.0, 80–89 = 3.0, 70–79 = 2.0, 65–69 = 1.0, <65 = 0.0.
Course failures (CFs)
CFs were assessed by examining course grades at the end of each 9-week period to identify the number of D and F grades earned over the course of the academic year. Per district grading policies, a D constituted as a class percentage in the 65% to 69% range, whereas an F was defined as <65%. CF referred to the total number of grades below 70% earned during the academic year. Ds were included as CFs because the school district did not consider Ds as an indicator of successful completion of course learning objectives.
ODRs
ODRs were collected using a district-developed system. The middle school previously collected ODRs using the School-Wide Informational System (SWIS; May et al., 2000), a systematic and standardized web-based approach used to record and track individual student office referrals. However, the district developed a new internal system which was required for use by all schools. Infractions warranting ODRs (e.g., abusive language, physical aggression, and property misuse) were defined and procedures were established regarding how and when to complete ODRs. The rate of ODRs was computed for each student for the academic year by dividing the number of ODRs earned in an academic year by the number of days each student was enrolled.
Study Design and Analysis
This is a descriptive study in which SRSS scores were used to establish risk status in spring of students’ fifth-grade year and at two points during students’ sixth-grade year, as they first entered the middle school setting in the fall and in the spring of sixth grade, the two time points administered by this middle school. We used the following analytic approach to answer our research questions. First, we used descriptive statistics (i.e., means, frequencies, correlations) to examine shifts in risk status between spring of students’ fifth-grade year and fall and spring of their sixth-grade year as students transitioned from elementary to middle school (see Table 2). We computed a one-way, repeated-measures ANOVA comparing mean SRSS scores for these three time points. We computed effect sizes using Hedges’s g formula (which uses the pooled standard deviation [SD] in the denominator and accounts for the number of participants in groups being compared) to examine the magnitude of differences in mean scores comparisons: (a) spring of fifth grade to fall of sixth grade, (b) spring of fifth grade to spring of sixth grade, and (c) fall of sixth grade to spring of sixth grade. Finally, we computed frequency and percentage scores for low-, moderate-, and high-risk categorical scores (see Figure 1) as well as individual change scores to show how risk categories shifted across time (see Table 3 and Figure 2). Although the primary focus of our study was on school transitions, we also conducted an analysis of shifts in risk between fall and spring of students’ fifth-grade year for the 52 students who were enrolled at their respective elementary schools during the fall screening time point to determine whether the shifts in risk from fall to spring were consistent in fifth and sixth grades.
Student Risk Screening Scale Scores Over Time.
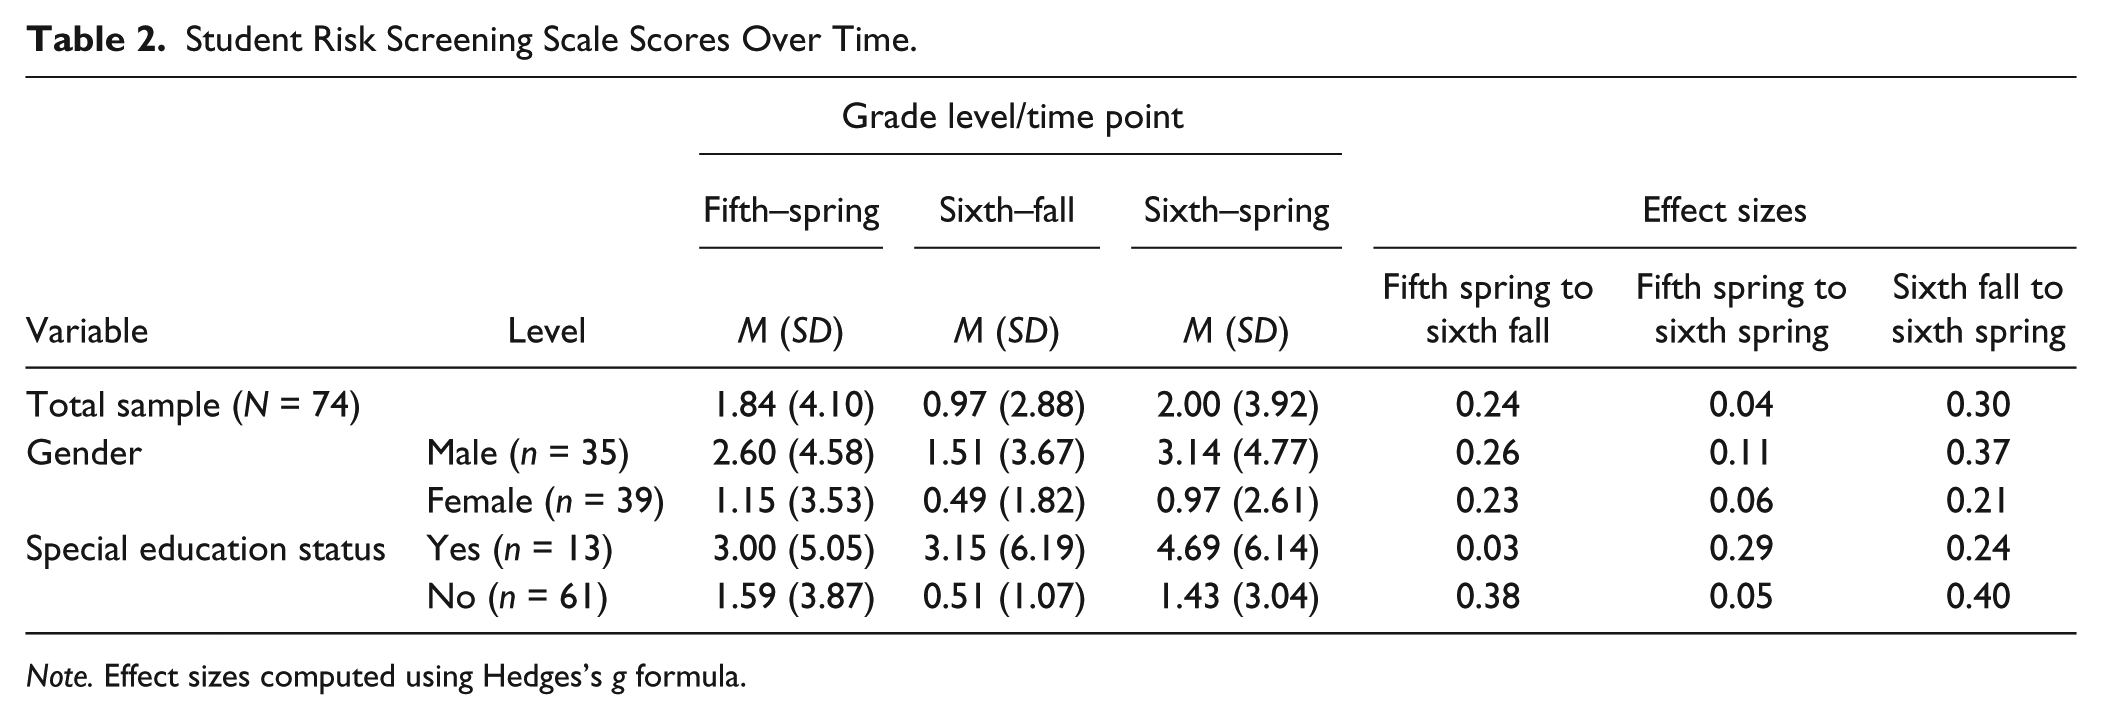
Note. Effect sizes computed using Hedges’s g formula.
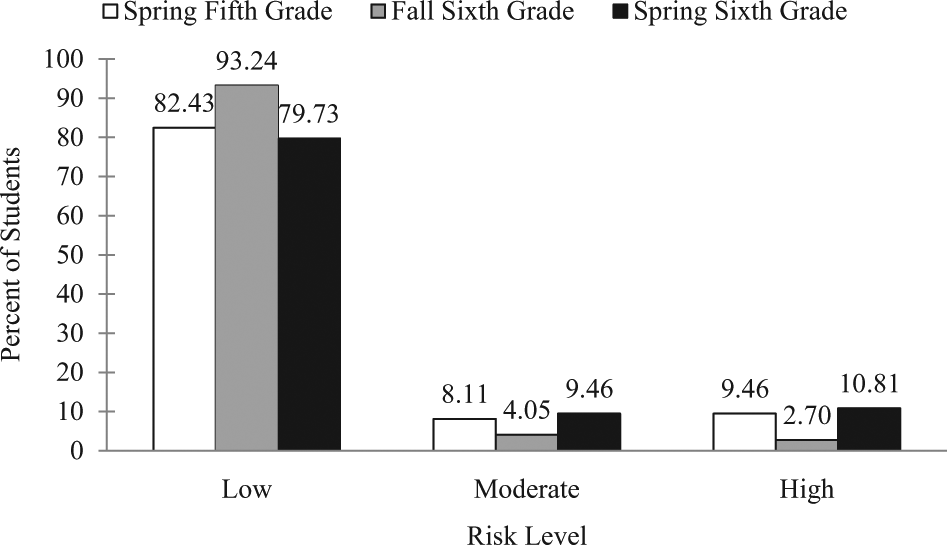
Student risk status from elementary school to middle school—fall and spring.
Student Risk Screening Scale: Change Scores.
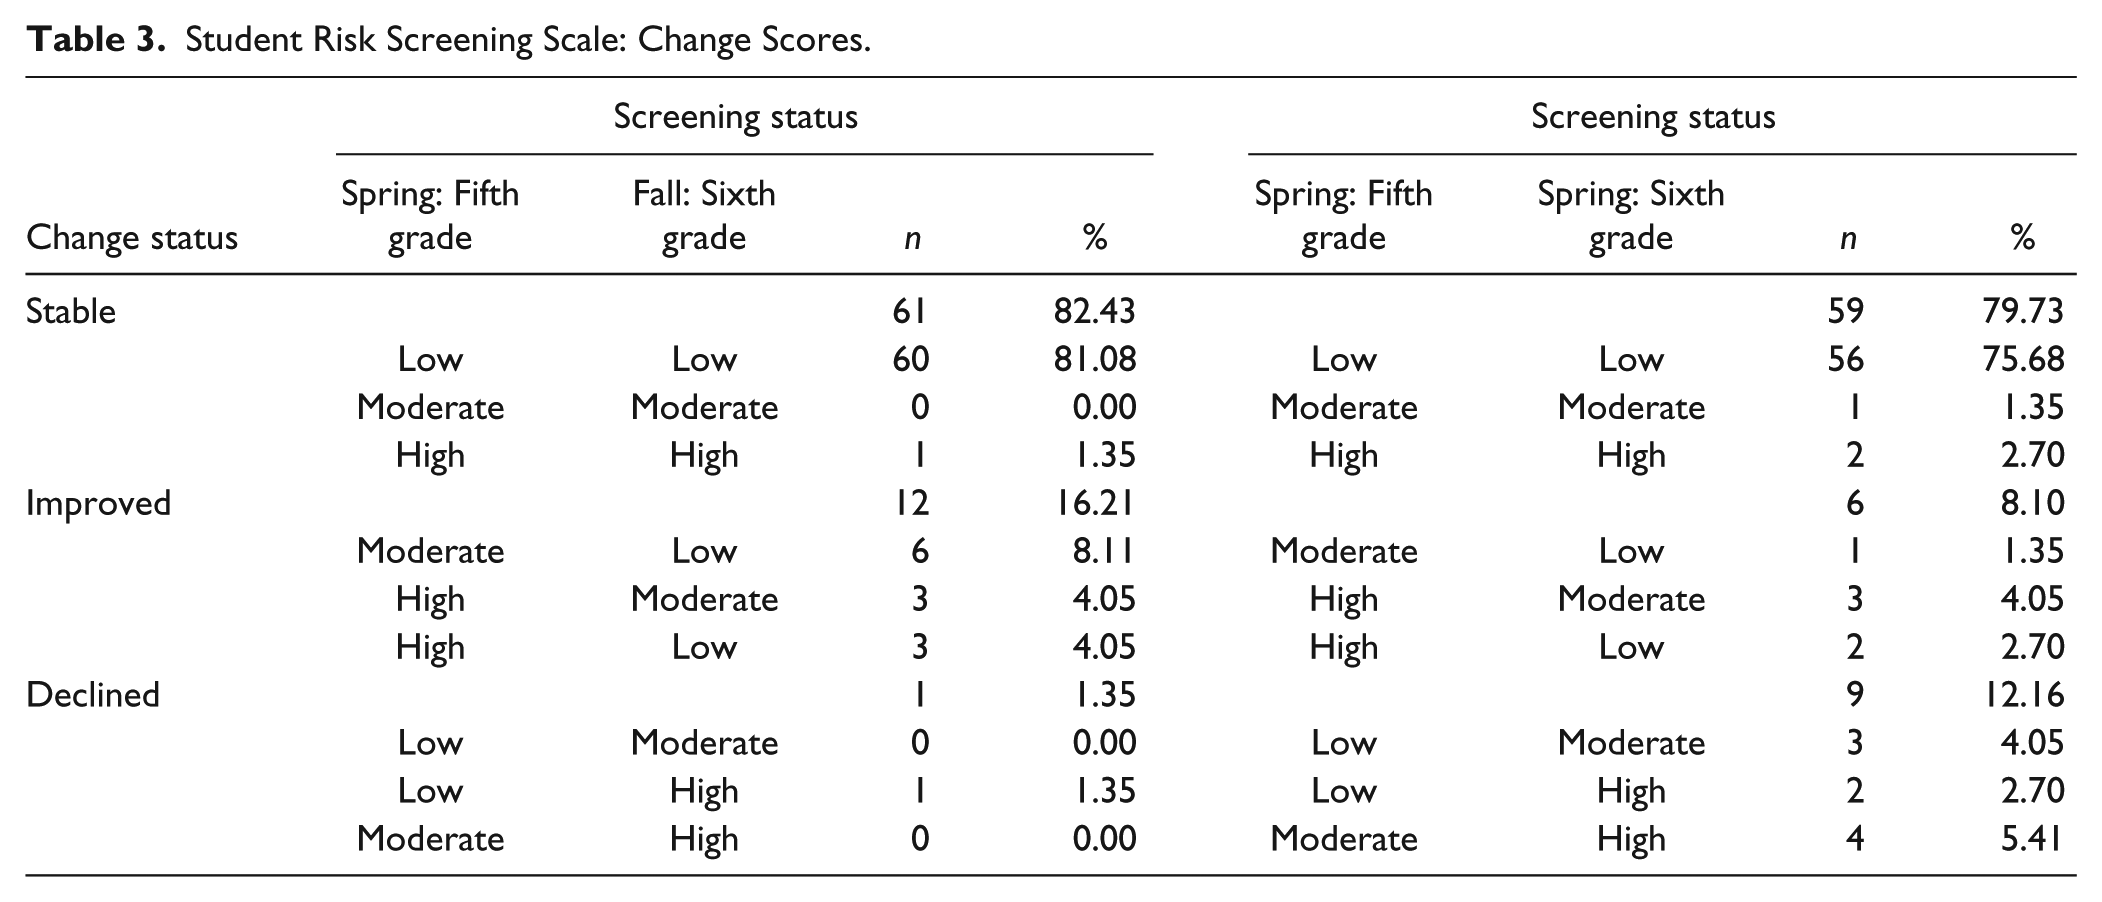
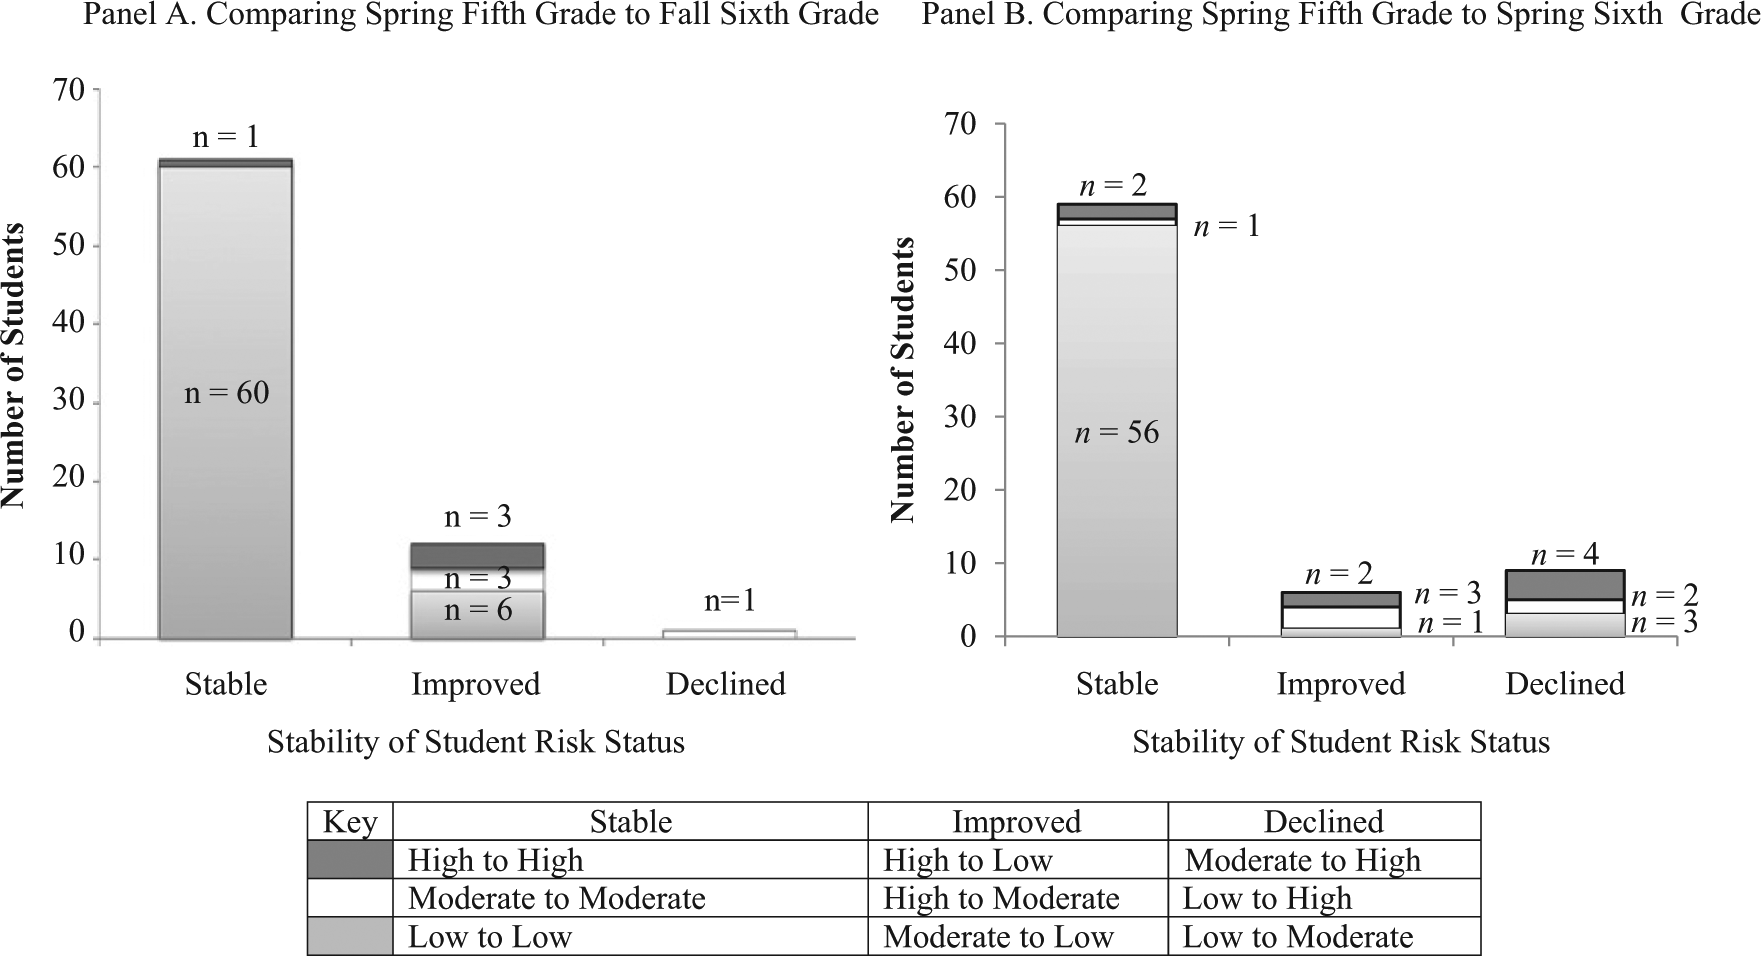
Stability of student risk status from elementary school spring of fifth grade to (a) fall of sixth grade in middle school and (b) spring of sixth grade in middle school.
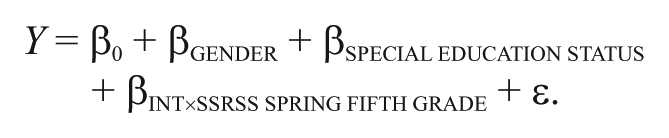
Second, we used multiple regression procedures to determine how gender, special education status, and SRSS risk status when exiting fifth grade predicted the following outcome variables: (a) SRSS fall sixth-grade scores and (b) SRSS spring sixth-grade scores. F values were interpreted to establish the significance of the overall model. If the model was significant, univariate analyses were computed to determine the unique contribution of each variable in the model. We computed t tests to ascertain the contribution of each predictor variable, controlling for the remaining two variables. Beta weights (standardized multiple regression coefficients) and uniqueness indices were examined to determine the relative value of each predictor variables in the model. The unique index refers to the percentage of variance in the criterion variable accounted for by a given predictor variable over and above the variance explained by the remaining predictor model. Semipartial correlations represents the relation between the predictor and criterion variable, controlling for the other variables in the model; whereas, bivariate correlations indicate overall relationships.
Third, we computed correlation coefficients to examine the relation between student risk as measured by SRSS scores at each time point and students’ academic and behavioral performance. Correlation coefficients are reported between SRSS scores and (a) year-end GPA, (b) number of CFs in sixth grade, and (c) rate of ODRs earned during sixth grade.
Results
Shift in Risk Status From Elementary to Middle School
A one-way, repeated-measures ANOVA comparing means scores for these three time points revealed significant difference among spring fifth-grade, fall sixth-grade, and spring sixth-grade SRSS scores, F(2, 146) = 5.78, p = .0039 (Greenhouse–Geisser epsilon value = 0.99; see Table 2). Simple contrasts indicated spring fifth-grade SRSS scores were significantly higher than fall sixth-grade scores, F(1, 73) = 7.34, p = .0084 (effect size = 0.24) and comparable (no significant differences) to spring sixth-grade scores, F(1, 73) = 0.33, p = .5672 (effect size = 0.04). Mean SRSS scores for the total sample decreased from 1.84 (SD = 4.10) in spring of students’ fifth-grade year to 0.97 (SD = 2.88) in the fall of students’ sixth-grade year, suggesting a moderate-magnitude decrease. However, scores increased to 2.00 (SD = 3.92) by the end of sixth grade, indicating a moderate-magnitude increase in risk scores between fall and spring of students’ sixth-grade year (effect size = 0.30).
When comparing categorical SRSS scores between spring of students’ fifth-grade year and fall of students’ sixth-grade year, the percentage of students in the low-risk category increased from 82.43% (n = 61) in spring of fifth grade to 93.24% (n = 69) in fall of sixth grade (see Figure 1). The percentage of students in the moderate-risk category decreased from 8.11% (n = 6) to 4.05% (n = 3) and those scoring in the high-risk category decreased from 9.46% (n = 7) to 2.70% (n = 2). However, by the end of sixth grade, the percentage of students in the low-risk category decreased to 79.73% (n = 59), with 9.46% (n = 7) of sixth-grade students scoring in the moderate-risk category and 10.81% (n = 8) in the high-risk category.
In looking at individual students’ change scores over time, the vast majority of students remained stable in their specific risk categories (82.43%, spring fifth grade to fall sixth grade; 79.73%). We found 16.21% of students showed improvement between spring fifth grade and fall sixth grade as evidenced by scoring into a lower risk category risk category relative to the previous time point (e.g., moderate to low risk). However, these shifts in risk did not sustain into the spring, with 8.10% in the improved category in spring sixth grade. Furthermore, while only one (1.35%) student declined between spring of fifth grade and fall of sixth grade; nine (12.16%) students declined by the end of sixth grade.
In looking at risk status for the 52 students who made the transition from elementary to middle school who were also enrolled in their respective elementary schools during fall of the their fifth-grade year, average SRSS scores were as follows: fall fifth grade (M = 1.64, SD = 2.88; low = 82.69%, moderate = 13.46%, high = 3.85%), spring fifth grade (M = 1.90; SD = 3.68; low = 78.85%, moderate = 11.54%, high = 9.62%), fall sixth grade (M = 1.17, SD = 3.36; low = 92.31%, moderate = 3.85%, high = 3.85%), and spring sixth grade (M = 2.38, SD = 4.47; low = 76.92%, moderate = 7.69%, high = 15.38%). While the percentage of fifth-grade students scoring in the moderate-risk category decreased from 13.46% in fall to 11.54% in spring, the percentage of sixth-grade students in the moderate-risk category increased from 3.85% in fall to 7.69% in spring. While the percentage of fifth-grade students scoring in the high-risk category increased from 3.85% in fall to 9.62% in spring; the percentage of sixth-grade students in the high-risk category increased almost threefold from 3.85% in fall to 15.38% in spring.
Variations as a Function of Gender, Special Education Status, and Risk in Fifth Grade
Predicting SRSS sixth-grade fall scores
The three-variable model accounted for approximately 19% of the variance in students’ improvement, R2 = .1894, F(3, 70) = 5.45, p = .0020. While gender was not a significant predictor of performance, special education status and SRSS spring scores in fifth grade were predictive of SRSS sixth-grade fall scores (see Table 4). Special education status (t = 2.69, p = .0089) and SRSS fifth-grade spring scores (t = 2.30, p = .0243) accounting for 8% and 6% of the variance in SRSS fall sixth-grade scores, respectively. Students receiving special education services had higher SRSS fall sixth-grade scores relative to students not receiving special education services. Furthermore, students exiting fifth grade with higher SRSS scores were more likely to have higher SRSS scores when entering sixth grade.
Outcomes of Predictive Analyses.
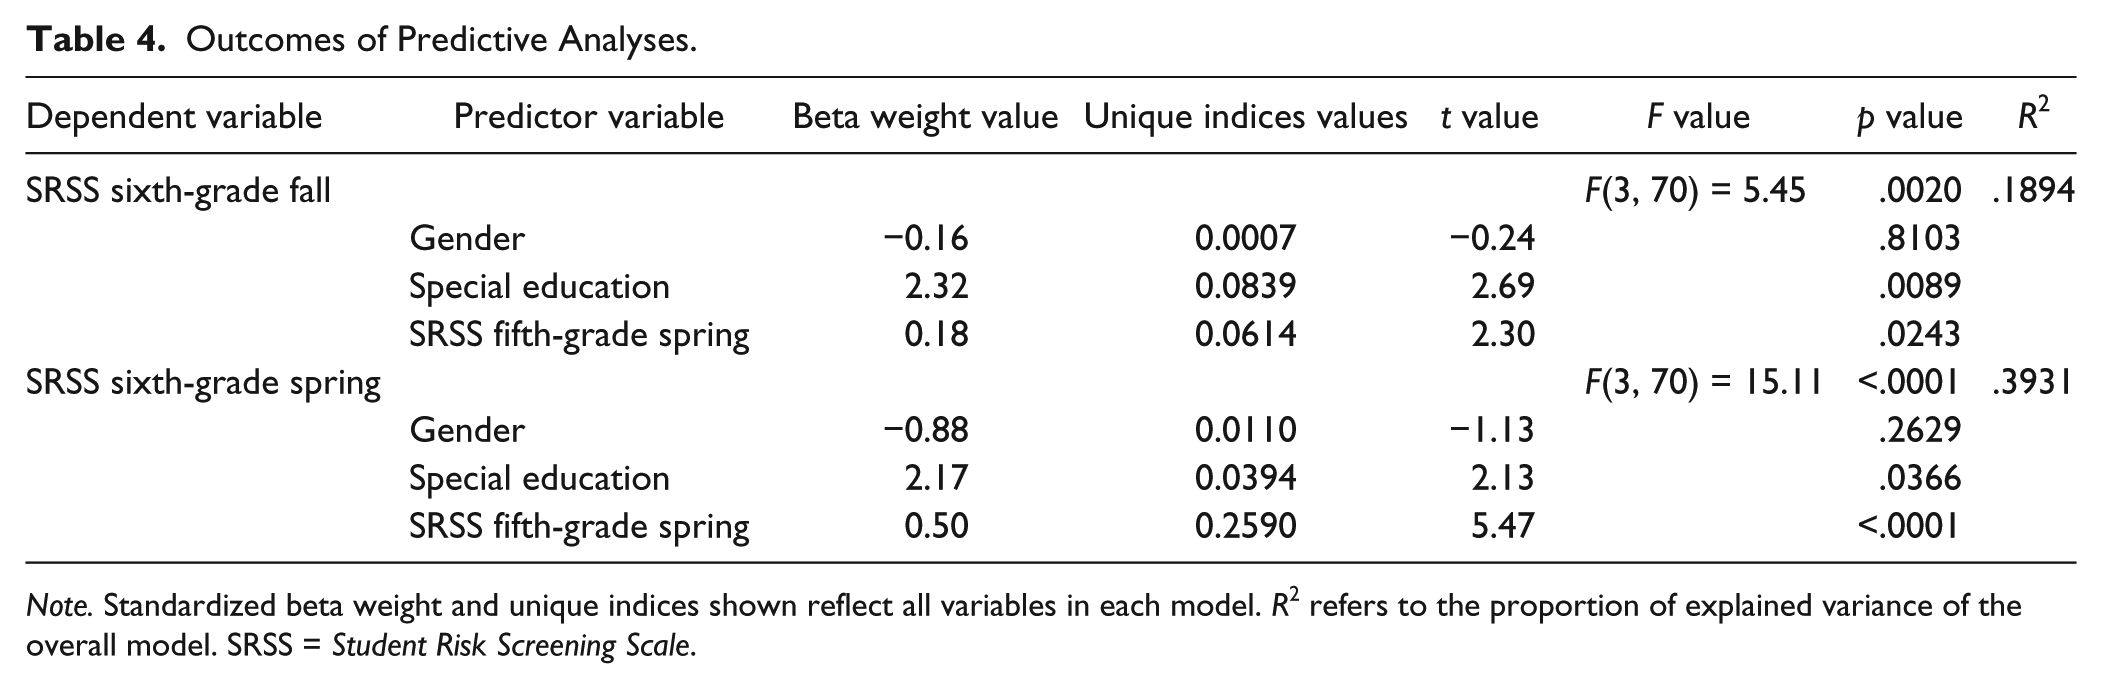
Note. Standardized beta weight and unique indices shown reflect all variables in each model. R2 refers to the proportion of explained variance of the overall model. SRSS = Student Risk Screening Scale.
Predicting SRSS sixth-grade spring scores
The three-variable model accounted for 39% of the variance in students’ improvement, R2 = .3931, F(3, 70) = 15.11, p < .0001. Again, gender was not predictive of performance. Special education status and SRSS spring scores in fifth grade were predictive of SRSS spring sixth-grade scores. Special education status (t = 2.13, p = .0366) and SRSS spring fifth-grade scores (t = 5.47, p < .0001) accounted for approximately 4% and 26% of the variance in SRSS fall sixth-grade scores, respectively. Students receiving special education services had higher SRSS spring sixth-grade scores relative to students not receiving special education services. Furthermore, students exiting fifth grade with higher SRSS scores were more likely to have higher SRSS scores at the end of sixth grade.
Academic and Behavioral Performance
Results indicated a significant, negative relation between SRSS fall fifth-grade scores and sixth-grade GPA (r = −.50, p < .0001). Students leaving elementary school with higher risk scores were more likely to have lower GPAs at the end of sixth grade relative to students with lower risk scores (see Table 5). There was a significant, positive relation between SRSS spring fifth-grade scores and the number of CFs (r = .26, p = .0247) and rate of ODRs (r = .64, p < .0001) earned during sixth grade.
Correlation Between SRSS Scores and Student Outcome Measures.
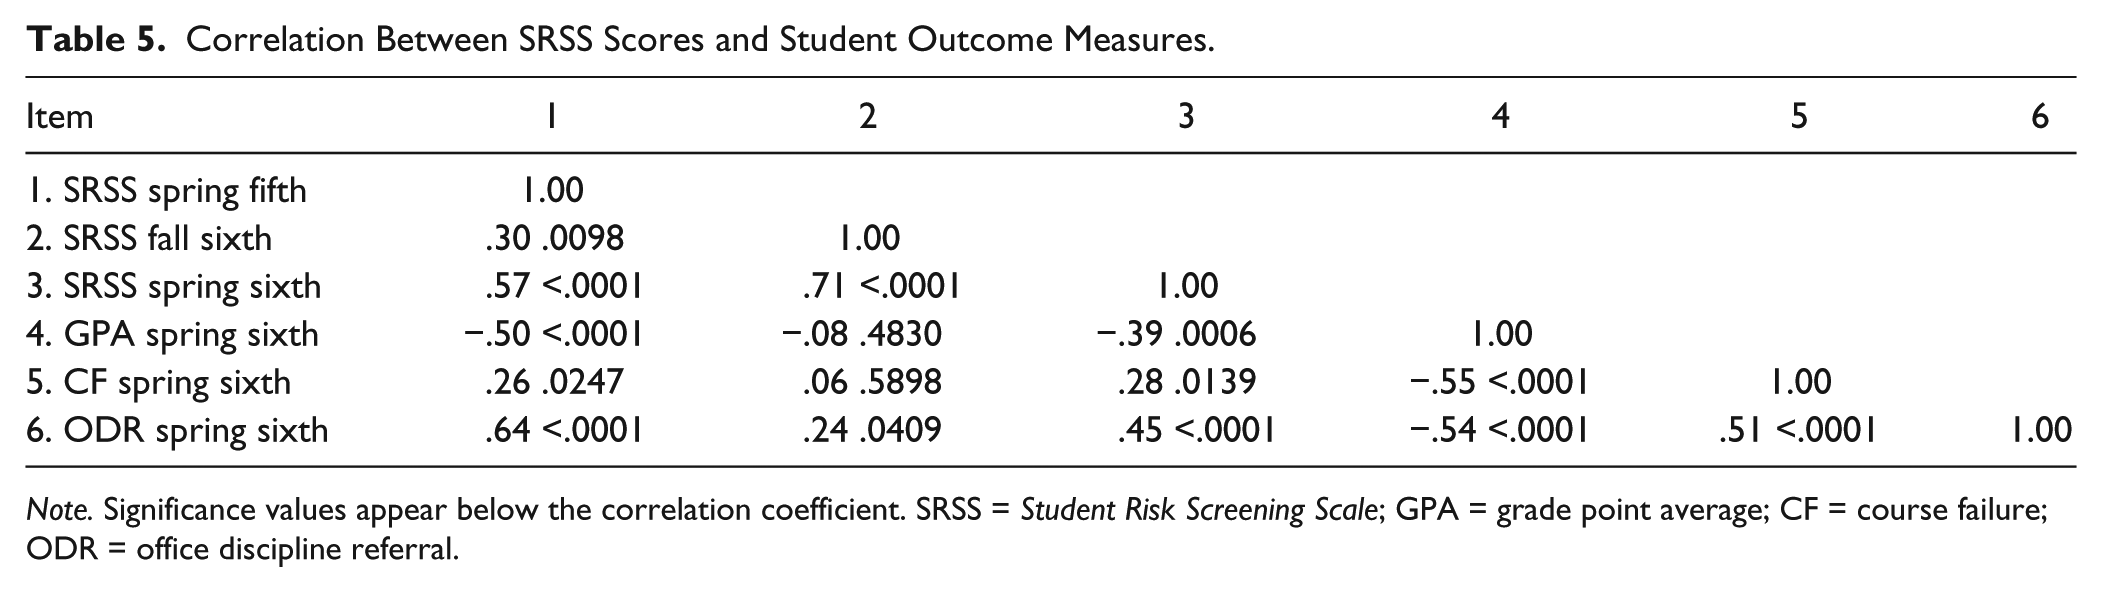
Note. Significance values appear below the correlation coefficient. SRSS = Student Risk Screening Scale; GPA = grade point average; CF = course failure; ODR = office discipline referral.
Discussion
The transition from elementary to middle school represents a critical juncture for students with and without disabilities (Lane, Parks, et al., 2007). Exploring these transitions necessitates longitudinal designs in which students are followed over the course of multiple years and schools, with attention to issues of gender, disability status, and previous behavioral performance patterns (e.g., Petras et al., 2011). By better understanding the salient features associated with this particular period, educators and parents can support students making this transition by informing educational programming with the design and implementation of high-quality transition services or well-designed instruction and supports during middle school (Cauley & Jovanovich, 2006). To this end, we conducted the current study to examine the role of risk evident in the elementary years as it impacts the transition from elementary to middle school. Our findings extend the knowledge base in several ways.
First, we explored the degree to which student risk status as measured by a universal screening tool, the SRSS, shifts as students transitioned from elementary to middle school. Results of a one-way repeated-measures ANOVA comparing students’ risk status between spring of students’ fifth-grade year and fall and spring of their sixth-grade year revealed a significant difference among fifth-grade spring, sixth-grade fall, and sixth-grade spring SRSS scores. Spring fifth-grade SRSS score were significantly higher than fall sixth-grade scores (effect size = 0.24); however, SRSS scores increased substantially between sixth-grade fall and sixth-grade spring indicating a moderate-magnitude increase in risk scores between fall and spring of students’ sixth-grade year (effect size = 0.30). Despite the appearance of initial improvements in risk status as students transition from elementary to middle school, these improved behavior patterns did not sustain over the course of the sixth-grade year.
To understand the nature of these shifts in risk, we examined changes in risk categories. Although the percentage of students in the low-risk category increased from 82.43% in spring of fifth grade to 93.24% in fall of sixth grade (see Figure 1), by the end of sixth grade, the percentage of students in the low-risk category had decreased to 79.73%, with 9.46% of sixth-grade students scoring in the moderate-risk category and 10.81% scoring in the high-risk category. In essence, any improvements were lost and in fact, more students were demonstrating antisocial behaviors by the end of sixth grade. Collectively, these findings may suggest students transitioning from elementary to middle school who completed elementary school with moderate or high risk may benefit from targeted supports (e.g., Check-in/Check-out or self-monitoring) in fall to support this transition to and through their first year of middle school even though their initial middle school risk scores may not indicate risk. In looking at the performance patterns of the subset of 52 students who were enrolled at the onset of fifth grade, it is also noteworthy that while students experienced increases in risk status during their fifth-grade year (mean scores shifting from 1.63 to 1.90), the increases in risk status were more pronounced in sixth grade (mean scores increasing twofold from 1.17 to 2.38). Thus, while intervention efforts are certainly needed at the elementary level, they are especially needed during the transition to middle school.
Second, we used multiple regression procedures to determine how gender, special education status, and SRSS risk status when exiting fifth grade predicted later risk status. In terms of predicting SRSS fall sixth-grade scores, gender was not a significant predictor of performance, suggesting uniformity of performance for males and females. However, special education status and SRSS spring scores in fifth grade were predictive of SRSS fall sixth-grade scores with special education status predicting 8% of variance in fall sixth-grade scores and SRSS spring fifth-grade scores, 6% of the variance. Moreover, students receiving special education services had higher SRSS fall sixth-grade scores relative to students not receiving special education services. Also, students who left their elementary school with higher SRSS scores were more likely to have higher SRSS scores when entering sixth grade, indicating the stability of risk for these group of students. This suggests students receiving special education services as well as those exiting elementary school with higher levels of behavioral risk may benefit from both universal and targeted supports during this time frame. For example, some districts already arrange visits to the middle school and other orientation events for all students. Students at heightened risk may also benefit from more targeted supports tailored to address their specific needs, such as additional social skills training, tutoring, connections to a peer mentor, a written transition plan, or other supports.
A similar pattern was observed with predicting spring sixth-grade SRSS scores. Patterns of performance did not vary as a function of gender; yet, special education status and SRSS spring fifth-grade scores were significant, accounting for approximately 4% and 26% of variance in SRSS fall sixth-grade scores, respectively. In looking at the percentage of variance explained by spring fifth-grade scores relative to the variance explained by special education status, it appears that for males and females, how they leave their elementary schools with respect to heightened behavioral risk and exceptionalities will predict behavioral risk at the end of their first year of middle school. Students leaving elementary school with heighten risk for antisocial behaviors are likely to also conclude their first year of middle school with similar levels of risk, with a similar pattern for students with exceptionalities (yet, to a lesser extent).
Collectively, these predictive analyses suggest school-site teams would be wise to attend particularly to supporting students receiving special education services as well as those who have higher levels of risk according to the SRSS. Because risk status can elevate throughout the first year of middle school, it could be helpful to have as a Tier 2 support a peer-mentoring program where eighth-grade students served as peer mentors to sixth-grade students. A mentoring program could have a selection process for the eighth-grade mentors, summer training, and participation in a summer transition boot-camp or jump-start program introducing the incoming sixth graders to the middle school context and expectations. As well, mentors provide ongoing support to the sixth-grade students throughout the year. In one illustration, Karcher (2005) examined a peer-mentoring model with high school mentors and fourth- and fifth-grade mentees. He found participation in the peer-mentoring program improved students’ school connectedness, social skills, and behavioral performance. Of importance was that attendance and participation of the mentor was related to the positive outcomes of mentees. Such peer-mentoring programs can alleviate some of students most pressing concerns when transitioning to the middle school (i.e., the amount of homework to expect, getting to class on time, and getting lost; Akos & Galassi, 2004).
Third, we examined the degree to which risk at the end of elementary school was associated with academic and behavioral performance during the first of middle school. This was accomplished by computing correlation coefficients between fifth-grade SRSS scores and (a) year-end GPA, (b) number of CFs in sixth grade, and (c) rate of ODRs earned during sixth grade. Results yielded significant, negative relation between SRSS fall fifth-grade scores and sixth-grade GPA (r = −.50) and significant, positive relation between CFs earned during the sixth-grade year. Students leaving elementary school with higher risk scores were more likely to have lower GPAs and fail more courses over the course of sixth grade relative to students with lower risk scores (see Table 5). For every teacher who feels they do not have time to address behavioral concerns as their main goal needs to be attending to academic performance, these findings offer some support of the transactional relation between academic and behavioral performance (McIntosh, Flannery, Sugai, Braun, & Cochrane, 2008). Furthermore, there was a significant, positive relation between SRSS spring fifth-grade scores and rate of ODRs (r = .64) earned during sixth grade. Namely, risk is important as it impacts behavioral and academic performance during this critical transition from elementary to middle school (Chung, Elias, & Schneider, 1998).
Limitations and Future Directions
Results from the present study should be interpreted in light of the following considerations. First, participants involved in this study were all from one geographic locale. Prior to generalizing the finding reported here, it is important to replicate these findings with students from other geographical local and with more diverse student bodies.
Second, only a subset of the 74 students were enrolled in their respective elementary schools at the beginning of fifth grade, limiting our ability to examine the performance patterns of all students within fifth and sixth grades as well as across these grade levels. Although a common challenge within longitudinal inquiries, not having fall screening data on 22 students limited the scope of the analyses available.
Third, in terms of analyzing academic performance, it would have been desirable to use academic performance in middle school as a covariate when analyzing academic and behavioral outcomes longitudinally. However, the two elementary schools did not use comparable academic measures (e.g., AIMSWeb) as part of regular school practices. As such, prior academic performance could not be built into the regression models tested.
Fourth, the degree to which a screening by itself provides an accurate portrayal of a student’s true risk status at transition points between schools warrants continued consideration. Although there are several studies offering evidence to suggest fall screening data collected 4 to 6 weeks following the onset of the academic year do indeed predict year-end outcomes for middle school students (e.g., Lane, Parks, et al., 2007), it may be that risk ratings at the beginning of school year were elevated due to the amount of time teachers had to get to know students and a result of the changing context rather than providing an authentic portrait of risks status at that time point. We do recommend teachers have access to both systematic screening data and other direct measures (e.g., academic performance, attendance, behavioral incidents) so they can draw on multiple data sources to inform the design and delivery of individualized supports.
Fifth, this descriptive study did not account for other factors that may have contributed to the improvements or declines of student risk. Future studies could examine the transitions of students attending schools with and without multitiered models of prevention (e.g., CI3T, PBIS). The middle school in the current study was responsive to students’ identified needs across multiple domains (e.g., academic, behavioral, and social) through the systemic screening approach described here. As such, students were considered and participated in interventions when data supported those decisions. Students in this study may have fared better than students transitioning to middle schools without multitiered prevention efforts.
Finally, lack of information such as the nature and quality of special education programs offered for the students receiving special education services (beyond acknowledging the school subscribed to a full inclusion model), the extent to which students at risk received Tier 2 and Tier 3 supports during the first year of middle school, and information about teachers’ experience assisting students who needed more intensive supports impede our ability to explore more deeply the explanations as to why these shifts in risk occurred during this period of transition. To be clear, the school did use screening data to connect students to supports. However, we did not have permission to access these data and therefore could not explore these conditions explicitly. Our inability to analyze these data and examine the associated outcomes of the existing Tier 2 and Tier 3 supports is a noteworthy limitation. We encourage future inquiry into these and other variables, some of which are malleable factors, as they influence students’ behavioral and academic performance during the transition from elementary to middle school. After subsequent descriptive studies are conducted, we are hopeful that information gleaned will be useful in shaping intervention efforts to support students with heightened behavioral risk and those receiving special education services to transition to, and through, middle school with greater success.
Implications for Practice
These findings have several implications for educational practice. First, this study raises important questions about the optimal timing for screening. As noted earlier, we do not know whether fall ratings were higher because teachers may have had less familiarity with students, because risk status was truly lower, or because other factors were in play. However, the fall screenings were conducted within the recommended 4- to 6-week window following the onset of the academic year which is consistent with recommended practices affording sufficient time for the teachers to become familiar with students’ behavioral performance. Results also suggest a need for a winter time point to detect students who begin to decline behaviorally after making the transition to middle school. Had the middle school incorporated a winter time point, it would have been possible to detect and support students who were having difficulties negotiating the transition to middle school at the first sign of behavioral decline rather than waiting until spring to determine which students were struggling behaviorally.
Second, findings from this study highlight the importance of establishing a continuum of supports for students that extent over time. Risk status across each of the two spring screening time points remained high for a subgroup of students. Ensuring well-designed instruction and supports are provided to these students before the move to middle school and with consistency throughout their entire first year may be especially key to supporting the successful entry into and completion of sixth grade.
Third, we were somewhat surprised that overall risk status at the beginning of sixth grade had somewhat diminished rather than deepened. Conceptualizing the transition to middle school narrowly as the movement from fifth to sixth grade may be far too narrow. While this movement remained a challenge for some students, struggles returned or were introduced for other students across their first year of middle school. Thus, it may be more helpful to focus on supporting transition to and through middle school. In adopting such a perspective, additional work is needed to identify (a) exactly when difficulties are most likely to emerge for students, (b) ways of anticipating and assessing these difficulties, and (c) how both contextual and student factors interact to contribute to or mitigate these difficulties.
Summary
How students leave fifth grade with respect to risk status is highly predictive of how they complete their first year of middle school. These outcomes are very consistent across males and females but are more pronounced for students entering the middle school setting with elevated risk or receiving special education service. In terms of the latter group, it is important to not assume special education services are meeting these students’ multiple needs. We contend the transition from elementary to middle school is a challenge for many students, especially those leaving the elementary school with elevated levels of risk and requiring special education. We support the need for ongoing transition plans to assist students through their entire first year in middle school.
Footnotes
Declaration of Conflicting Interests
The author(s) declared no potential conflicts of interest with respect to the research, authorship, and/or publication of this article.
Funding
The author(s) disclosed receipt of the following financial support for the research, authorship, and/or publication of this article: This research was supported in part by the Project SUPPORT and include a technical assistance grant from the Tennessee Department of Education (GR-10-27642-00).