
Abstract
Middle school teachers frequently struggle with positively managing student behavior. However, praise-to-reprimand ratios (PRRs) have received little research attention. PRRs studied in elementary school have been positively associated with improvements in on-task and prosocial behavior, but limited research has been conducted on optimal PRRs in middle schools. We conducted this study in the context of a randomized control trial of Class-wide Function-related Intervention Teams Middle School (CW-FIT MS) to isolate the effects of one of the main components of the intervention, PRR. After controlling for the intervention, we examined the effects of PRRs in 28 U.S. middle school classrooms on (a) class-wide on-task behavior, (b) on-task behavior of students at risk for emotional and behavioral disorders (EBD), and (c) disruptive behavior of students at risk for EBD. Multivariate regressions revealed a statistically significant linear relationship between middle school PRRs and the variables of interest: As PRRs increased, on-task behavior of the entire class improved, on-task behavior and grades of students at risk for EBD increased, and disruptive behavior of students at risk for EBD decreased. We discuss the implications of our findings and suggest areas for future research.
Keywords
Effective middle school classroom management is critical for student success. During adolescence students experience significant changes and growth (Steinberg, 2014) along with increased vulnerability to psychopathology and problem behavior (Paus et al., 2008). The elementary to middle school transition includes changing from one primary teacher to six or more middle school teachers, with varied teaching styles and classroom expectations (Bernstein, 2002; Young et al., 2012). This transition often includes decreased academic interest, motivation, and achievement (Young et al., 2012), commonly resulting in distractibility, hyperactivity, anxiety, immaturity, and bullying behaviors (De Shannon Lawrence, 2017; Harrison et al., 2012). Such problems are often reflected in office discipline referrals related to issues of aggression, disrespect, defiance, and classroom disruptions (Kaufman et al., 2010), particularly for students with emotional or behavioral disorders (EBD; Kauffman & Landrum, 2018). Problems may emerge from a mismatch between classroom management practices and developmental needs of students, particularly adolescents’ increasing needs to be respected (King & Vidourek, 2010).
Well-managed middle school classrooms create opportunities to foster students’ engagement and learning, while poorly managed classrooms decrease students’ learning time and attention (Emmer & Evertson, 2017). Thus, effective classroom management and positive academic achievement are interactive (e.g., Wang et al., 1993). But middle school teachers often struggle with managing classrooms (Englehart, 2013), experiencing stress and emotional exhaustion when teaching with high levels of student misbehavior, negatively affecting both teaching and learning (Haydon & Musti-Rao, 2011). Such struggles can increase students’ disengagement and disruptive behavior, especially those with or at risk for EBD (Kauffman & Landrum, 2018).
Unfortunately, many teachers resort to reactive, punishment-based approaches to managing classroom behavior, increasing practices such as the students’ transition from elementary to middle school (Owen et al., 2015). Students from minority groups and those with or at risk for disabilities (such as EBD) are more likely to experience such punishments (e.g., suspensions, expulsions) than those from majority groups or without disabilities (Kauffman & Landrum, 2018; Skiba et al., 2012). Using punishment also negatively affects teachers who use harsh reprimands but still report high rates of disruptive classroom behavior, as they feel ineffective and complain of emotional exhaustion (Jennings & Greenberg, 2009). Such punishment-based practices, which harm teachers and their students, tend to be less effective than positive proactive classroom management strategies (Reinke et al., 2013). School interventions may fail because they do not align with adolescents’ increasing desire to be respected and accorded status (King & Vidourek, 2010). One positive behavior management strategy gaining increased attention is teachers’ use of praise-to-reprimand ratios (PRRs, also known as praise-to-behavior-correction ratios; Caldarella, Larsen, et al., 2019; Caldarella, Larsen, Williams, Downs, et al., 2020; Pisacreta et al., 2011; Sabey et al., 2019).
Praise-to-Reprimand Ratios
The use of PRRs has been conceptualized as a simple strategy by which a teacher attempts to increase the number of praise statements given to students compared with the number of reprimands (Caldarella, Larsen, Williams, Downs, et al., 2020). Praise and reprimands are specific teacher responses to student behaviors, with praise showing admiration or approval and reprimands showing disapproval or rejection (Brophy, 1981). No universal definition has been established for PRRs—they are defined in the current study as total teacher praise statements divided by the sum of total teacher praise statements and total teacher reprimands, like prior studies conducted in elementary schools (Caldarella, Larsen, et al., 2019; Caldarella, Larsen, Williams, Downs, et al., 2020). Various target PRRs have been discussed in the literature, ranging from 3:1 (Shores et al., 1993) to 5:1 (Flora, 2000). However, Perle (2016) and Sabey et al. (2019) recommended tailoring PRRs to the needs of the student or class based on their behavior, rather than targeting a specific ratio. Similarly, research in elementary schools has suggested that PRRs may be related more linearly to student behavior rather than as a threshold for behavior improvement (Caldarella, Larsen, Williams, Downs, et al., 2020). However, specific PRR targets have yet to be examined in middle schools.
Research on Praise-to-Reprimand Ratios in Elementary Schools
Research on PRRs in elementary schools has shown that PRRs tend to worsen as grade level increases from kindergarten through fifth grade (Reddy et al., 2013), possibly due to the greater complexities inherent in classrooms as grade level increases and teachers interact less (in terms of praise and reprimands) with older students (White, 1975). Caldarella, Larsen, Williams, Downs, et al. (2020) conducted a study in nine elementary schools, 151 classrooms, across three states analyzing effects of teachers’ PRRs on students’ on-task behavior. A multilevel linear regression was used to analyze direct observational data. Although no ideal PRR threshold was found, a positive linear relationship suggested that the higher the teachers’ PRRs, the higher the students’ percentage of on-task behavior.
Caldarella, Larsen, et al. (2019) examined elementary teacher PRRs and on-task behavior of students at risk for EBD. In this study comparing 311 students identified as at risk with 229 of their peers, results indicated that elementary students with EBD received much lower PRRs than those without EBD. A multilevel linear regression was used to analyze direct observational data. As teacher PRRs increased, the engagement of at-risk students also increased, though engagement for typically developing peers did not, suggesting a greater PRR sensitivity for the at-risk students. A PRR of approximately 9:1 was needed for students at risk for EBD to approximate the engagement levels of their typically developing peers. No relationship between PRRs and disruption rates was found for either group of students.
Research on Praise-to-Reprimand Ratios in Middle Schools
Limited PRR research has been conducted in middle schools, though results of these studies have been informative. Pisacreta et al. (2011) conducted a single-subject, multiple baseline study across three general education middle school classrooms, finding that as PRRs increased from near 0:1 to just over 1:1 classroom disruptive behavior decreased significantly.
Middle school classroom training and interventions have been shown to positively influence PRR. Three studies (Caldarella, Wills, et al., 2019; Monson et al., 2020; Wills et al., 2019) showed increased PRRs after implementing a group contingency program titled class-wide function-related intervention teams for middle schools (CW-FIT MS; for details, see Caldarella, Wills, et al., 2019; Wills et al., 2019). CW-FIT MS is a universal classroom management intervention that consists of multiple evidence-based classroom management practices including direct teaching of social skills (e.g., “How to Show Respect” and “Follow Directions”), interdependent group contingencies, and increasing praise to assist teachers in managing behavior. For the group contingency, the class is separated into teams (often based on seating arrangement) where students strive to follow the social skills and be on-task during class. Approximately every 5 min, the teacher scans the room, praises appropriate behavior, gently corrects if needed, and awards a point to each team that was appropriately on-task at that time. At the end of the period, the teams that meet a predetermined point goal receive a brief or small reward. Research on CW-FIT MS has shown promising results in increasing teacher PRRs and student on-task behavior, as well as decreasing student disruptive behavior (Caldarella, Wills et al., 2019; Monson, et al., 2020; Orr et al., 2020; Wills et al., 2019).
Caldarella, Wills, et al. (2019) used a single-subject withdrawal design with 234 students in grades 6–8, including 23 identified as at risk for EBD. Results showed increased teacher PRRs and improved student on-task behavior and decreased disruptive behavior after CW-FIT MS implementation. Similarly, Wills et al. (2019) used an ABAB design across three middle school classrooms. Teachers implemented CW-FIT MS with results showing an increase in teacher praise and a decrease in teacher reprimands, along with improved student on-task behavior. Monson et al. (2020) used an ABAB design in two middle school art classrooms. Results indicated that teacher PRRs more than doubled and class on-task behavior increased by more than 25% during CW-FIT implementation compared with baseline levels. Results also indicated that on-task behavior for students identified as at risk for EBD improved by more than 18% during the intervention.
Study Purpose
Considering the current state of PRR research, additional studies are needed in middle schools. Although increased PRRs have been associated with increased on-task student behavior and decreased disruptive behavior in past studies, none of these studies have controlled for the effects of classroom interventions in the presence of PRRs or evaluated whether there are optimal ratios. Additional research is also needed to learn more about how these ratios affect middle school student behavior, especially for students with or at risk for EBD. Such students are commonly placed in general education classrooms (Floress et al., 2018) with teachers who have little to no knowledge of or experience working with EBD (Allday et al., 2012).
The current investigation analyzed data from a sample of middle school students across two states, from multiple classrooms, across multiple grade levels, during a variety of subjects, and using clear operational definitions, while simultaneously measuring students’ on-task behavior. As general teacher praise is low (Pisacreta et al., 2011), we had the teachers implement CW-FIT MS to increase their praise, to achieve greater variability in PRR. We statistically controlled for the effects of the CW-FIT MS intervention, using multivariate regressions, to examine the effects of PRRs on student behavior. An additional purpose of this study was to examine the relationship between teacher PRRs and behavior of middle school students at risk for EBD. Given differing PRR recommendations in the literature, this study also examined whether there was an optimal PRR threshold at which student behavior dramatically improved. Three research questions guided the study, while controlling for any possible intervention effect:
Method
Settings and Participants
Data were collected as part of a pilot study of CW-FIT MS, a universal classroom management intervention. Five U.S. Title I middle/junior high schools (Grades 6–8) in the urban Midwest and interurban West participated (see Table 1). While some participants were in middle schools and some in junior high schools, for simplicity we refer to this population as middle school. The study took place across various subjects: math (31.58%), social studies/history (28.95%), English language arts/reading (26.32%), and science (13.16%). Half of the teachers were randomly assigned to receive the intervention and half maintained their business-as-usual condition as the control group. Data collection, which was consistent across both conditions, occurred during the latter portion of fall semester for approximately 2 months.
Descriptive Data for Participating Schools.
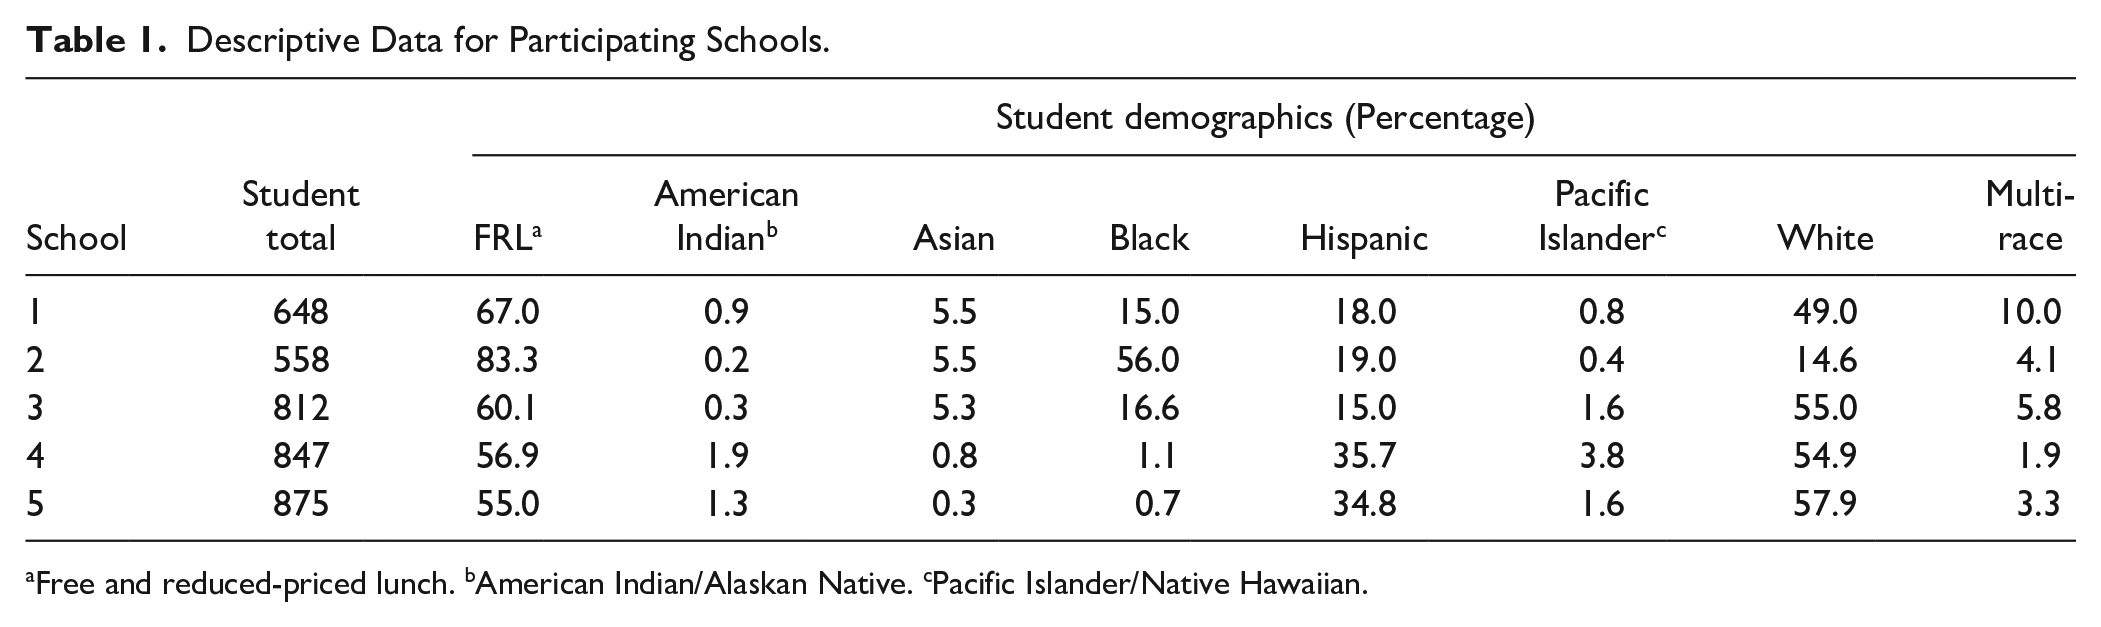
Free and reduced-priced lunch. bAmerican Indian/Alaskan Native. cPacific Islander/Native Hawaiian.
Teacher participants were 28 middle school general education teachers (8 males, 20 females), with approximately 23 students in each classroom (n = 628 students). Teachers were predominantly White (89.29%) and female (71.43%). The mean age of teachers was 35.27 years (SD = 10.51), and they had taught for a mean of 7.14 years (SD = 7.44). There were no significant differences for teacher age or years of experience between the treatment and control groups.
Student participants were 75 middle school students (38 treatment, 37 control) who, through screening, had been identified as at risk for EBD and had submitted informed consent. There were approximately 2 to 3 students identified as at risk per classroom. In this article, student participants are referred to as target students. Sixty-one target students were male (81.33%) and ranged in age from 11 to 14 years (M = 12.29, SD = 0.94). Twenty-nine students were Black/African American (38.67%), 23 were White (30.67%), 19 were Hispanic (25.33%), and two Asian/Pacific Islander (2.67%), with two (2.66%) not reported. Twenty-three students (30.67%) were in sixth grade, 24 (32.00%) were in seventh, and 28 (37.33%) were in eighth. English was the primary language spoken at home for 55 (73.33%) of the students; 14 (18.67%) reported having either an individualized education program (IEP) or a 504-accommodation plan.
Identification of students at risk for EBD
Teachers nominated target students using the Systematic Screening for Behavior Disorders–Second Edition (SSBD-2; Walker et al., 2014), Stage 1, which identifies students at risk for externalizing or internalizing problem behavior. The SSBD-2 is a standardized norm-based screening tool appropriate for use in middle schools (Caldarella et al., 2008; Walker et al., 2014). After reading the definitions and examples provided for externalizing and internalizing behaviors, teachers considered all students in their identified class and nominated those whose characteristic behavior patterns most closely matched the definitions and examples of externalizing or internalizing behaviors. Teachers then rank ordered those listed in order of severity. Informed consent requests were sent to the homes of the three students with the most severe ratings.
Once consent was obtained, teachers completed the School Social Behavior Scales–2nd Edition (SSBS-2; Merrell, 2008) to aid in evaluating target students’ risk level. The SSBS-2 is a nationally normed scale (kindergarten–12th grade) that measures social competence (32 items) and antisocial behavior (32 items). Scale raw scores are converted to T-scores (x̅ = 50, SD = 10). The SSBS-2 items are rated on a 5-point Likert-type scale (1 = never to 5 = frequently). Sample items include “behaves appropriately at school,” “is accepting of other students,” “is disrespectful or sassy,” and “is physically aggressive.” Internal consistency alphas range from .96 to .98. SSBS-2 scores were supportive of the target students’ at-risk status: social competence x̅ = 88.01, SD = 22.92 (T-score = 42); antisocial behavior x̅ = 85.25, SD = 23.76 (T-score = 62).
Observations of classroom behavior
Researchers observed in each teacher’s classroom to collect direct observational data on class-wide on-task behavior and target students’ on-task behavior and disruptive behavior, as well as on teacher praise and reprimands given to the class or to any individual in the class. These data were collected during 20-min direct observations using a paper/pencil momentary time sampling procedure. Data were collected 3 times during baseline and 6 times during the intervention/control phase and then aggregated into a baseline average and an intervention/control average. Baseline lasted 1 to 2 weeks and the intervention/control phase lasted 8 to 10 weeks. Observations were conducted during the same class period per teacher. Before beginning the observation, the observer would arbitrarily split the entire class into four to six groups (e.g., one row or table of students would be one group). Every 30 s the observer would systematically scan the room and record on/off task behavior for each group (the whole class) and then for each target student (scanning group one, recording group one; scanning group two, recording group two . . . scanning target student one, recording target student one).
On-task behavior was defined as complying with classroom rules and following teacher instruction, which included looking at teacher/speaker or materials, cooperating with peers during group work, and reading and writing as directed by the teacher. A group was coded as on task only if every student in the group was on task. If one student was off task, the whole group was counted as off task.
Observers also recorded the disruptive behavior of target students using a frequency count if that behavior occurred at the 30-s interval. Disruptive behavior was defined as any verbal or motor behavior interfering with the learning or participation of the student at risk and/or his or her peers. Examples included calling out, talking to a peer, making inappropriate gestures or physical contact, throwing objects, making excessive noise, or engaging in other distracting behaviors not related to teacher instruction.
During the same 20-min observation period, observers used a frequency count to record teacher praise and reprimands as given. Teacher praise was defined as a verbal statement indicating approval of student behavior beyond acknowledgment of adequate performance or correct response. Examples included “Great job finishing your paper, Billy!” and “Class, you listened very carefully during the lesson on fractions!” Non-examples were simple acknowledgments (e.g., “I’ve got Johnny’s paper”), smiling, or giving a nonverbal gesture of praise. Teacher reprimand was defined as a verbal comment intended to stop misbehavior. This included negative comments, harsh redirection, and reprimands that referenced future negative consequences: “Start paying attention or your name is going on the board” or “Sam, stop bothering Kim.” As with praise, nonexamples were acknowledgments: “That is incorrect” or asking students to “Have a seat.”
Observations for Interobserver Agreement
Observers were trained to collect the direct observation data by (a) studying the behavioral definitions, (b) passing a quiz regarding behavioral definitions and observation techniques, (c) watching and coding videos of classrooms previously scored by the researchers until 90% accuracy was achieved, and (d) practicing with a research coordinator in live non-study classrooms until 90% accuracy was achieved. Once observers were trained, data collection began. According to Cooper et al. (2007), to maintain quality data interobserver agreement (IOA) should be collected on a minimum of 20% of observations. In this study, a reliability observer was present during 25.56% of observations. Across data collection, IOA averaged 94.71% (SD = 8.87) for teacher praise, 89.91% (SD = 16.53) for teacher reprimands, 93.31% (SD = 2.68) for class on-task behavior, 94.40% (SD = 3.14) for target students’ on-task behavior, and 93.88% (SD = 7.72) for target students’ disruptive behavior.
Calculation of PRR
After observing, researchers calculated the PRR, using the following formula for statistical analyses:
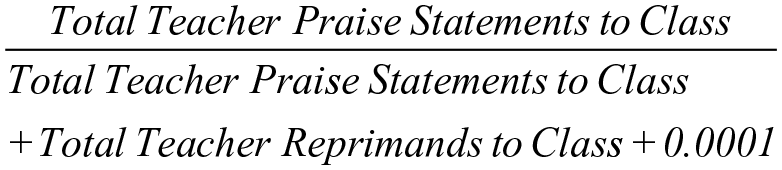
Total teacher praise and total teacher reprimands to the class included any statement made to individuals in the class, groups of students, or the whole class. A small correction factor (0.0001) was added to ensure no ratio included zero if there were no praise statements or reprimands given during a class. For readability, we reported the PRR in a more traditional ratio format to be congruent with previous research (e.g., 4:1). A value of 1.00 on the PRR would mean all the interactions with the teacher were praise, while a value of 0 would mean that none of the interactions with the teacher were praise. A PRR value of 0.50 would mean half the interactions were praise statements and half were reprimands (e.g., 1:1 PRR). A PPR value of 0.75 would indicate 75% of the interactions were praise statements (e.g., 3:1 PRR). This is a slight modification (but mathematically equivalent) to the classic PRR, as this metric allows for the cases of no praises or no reprimands.
Procedures
In collaboration with local school districts and then with principals, researchers identified middle schools to participate in the CW-FIT MS study. A recruitment meeting was held at each school to solicit teacher participants. Teachers then signed informed consent documents as required by university and school district institutional review boards. Later, researchers met with teachers to have them select their most behaviorally challenging class period. Notice of study participation was mailed home to all students in nominated classes. Teachers then completed the SSBD-2 Stage 1. Informed assent/consent was sent to homes for these students and their parents; in each classroom consent was received for an average of two to three students. The SSBS-2 forms were also completed, and baseline observational data were collected. Teachers reported letter grades (A, B, C, etc.) students were receiving in their class pre- and post- intervention. Teachers were randomly assigned to implement CW-FIT MS or to participate in the control condition during the fall semester, when direct observations were conducted.
Analytic Strategy
We began with preliminary des-criptive analyses and a correlation table for the variables of interest. We created two multivariate regressions to answer the research questions regarding the relationships between PRR and (a) class-wide student on-task behavior and (b) target students’ on-task behavior, disruptions, and grades. As the variability of PRRs was small during baseline, we only examined data collected for the intervention/control phase. As CW-FIT MS increases PRR, by examining both control and treatment classrooms we were able to have a greater range of variability than just examining either group alone. We considered multivariate regression assumptions of linearity, independence, normality, variance equality, and multicollinearity. We checked the assumptions of the multivariate regression as a whole and looked at the residual plots produced by the regression to check for nonlinear trends. Residual plots and histograms showed no departure from normality, linearity, or variance equality. Variance inflation factors (VIFs) showed no extreme multicollinearity, and the lack of independence (students nested within classrooms) was handled by allowing for clustering via clustered standard errors (TYPE = COMPLEX, sandwich estimator, in Mplus) in the model. A traditional multilevel model was not feasible as several of the student level variables (e.g., gender, race) did not have variation within a classroom for several of our classrooms as we only sampled two to three students per classroom. For any regression to run, there must be variation on the predictor variables (in this case the regression within an individual classroom with only two students where both are female for example).
As these data were from a pilot study that utilized randomization, causal relations could be appropriately inferred. We investigated variables of interest influenced by the intervention by using mediation analysis to suggest how the intervention affected the outcomes. We ran a series of multivariate regressions in Mplus 8.3 (Muthén & Muthén, 2017) to answer the research questions. Both models included the independent variables of interest, PRR, and the curvilinear effects of PRR (PRR2) during the intervention/control phase, and the following covariates: (a) grade level, (b) school, (c) class subject, and (d) classroom treatment status (CW-FIT MS or control). Controlling for CW-FIT MS as well as the PRR allowed for additional intrinsic elements of the intervention to also affect the outcomes.
The correlations between the total praise and reprimand rates and the PRR were very high (.80 and −.80, respectively) which suggested that including just one of those three variables (PRR) would essentially contain all the variability of the other two. In other words, there was not a wide disparity of total praise and reprimand rates in classrooms with similar ratios. Including all three variables would have violated the independence of covariates assumption of multivariate regression, which would lead to misleading results. Therefore, only PRR was used in the multivariate regression.
Unique covariates for the class-wide model included (a) teacher ethnicity (1 = White, 0 = other), (b) teacher education level (1 = bachelor’s degree, 0 = other), and (c) teacher gender (1 = female, 0 = other). These specific covariates were tested and found to not affect the outcomes and thus were dropped from the final model for parsimony.
Unique covariates of the model of students at risk for EBD included (a) student gender (1 = male, 0 = female), (b) student ethnicity (dummy variables for African American/Black, Hispanic, and other, with White being the reference group), (c) student academic grade, (d) class average academic grade, and (e) student disability status (1 = IEP, 0 = other). Final models for the main effects, for which nonsignificant curvilinear effects had been excluded to obtain an accurate p-value, are presented.
Results
Baseline Descriptive Statistics
At baseline, the PRR, teacher praise, teacher reprimand rates, target student disruptions, target student on-task behaviors, and class-wide on-task behaviors were not statistically different between treatment and control conditions. Baseline rates for treatment PRR averaged 0.09 (SD = 0.11), or approximately 1:9, and control averaged 0.18 (SD = 0.17), or approximately 1:4 per 20 min. Baseline praise rates averaged 0.76 (SD = 1.00) statements for treatment classrooms and 1.03 (SD = 1.20) statements for control classrooms, while reprimands for treatment classrooms were 8.82 (SD = 6.13) statements and for control classrooms were 6.10 (SD = 6.60). Baseline target student disruptions averaged 8.34 (SD = 5.79) for treatment classrooms and 6.67 (SD = 3.98) for control classrooms. Baseline target student on-task behaviors averaged 42.04 (SD = 15.67) for treatment classrooms and 46.93 (SD = 14.92) for control classrooms. Baseline class-wide on-task behavior averaged 39.18 (SD = 11.73) for treatment classrooms and 39.04 (SD = 10.32) for control classrooms. To keep our multivariate regression model as parsimonious as possible, we did not include these baseline data in the model. As we found no significant differences between treatment and control groups at baseline, we were able to examine causal effects of the variables of interest (PRR and treatment), according to experimental theory (Shadish et al., 2002).
Post-Intervention Descriptive Statistics and Correlations
Table 2 shows the descriptive statistics and correlations of the variables of interest used in the analysis. As expected, the percentage of class-wide on-task behavior was positively associated with the PRR (r = .89) and with CW-FIT MS (r = .86). Also as expected, target student on-task behavior was positively correlated with the PRR (r = .83) and with the treatment (r = .79). Target student disruptions were negatively correlated with the PRR (r = −.66) and with the treatment (r = −.58). Target student grades were positively correlated with the PRR (r = .35) and with treatment (r = .63). The p values for all these statistically significant correlations were less than .01. The PRR ranged from .00 to .98, and on-task behavior ranged from 22.73% to 98.25% (almost completely on-task), indicating a broad range of classroom environments relevant to the number of praise statements, reprimands, and instances of students’ on-task behavior.
Descriptive Statistics and Correlations of Variables of Interest Used in Multivariate Regression Models.
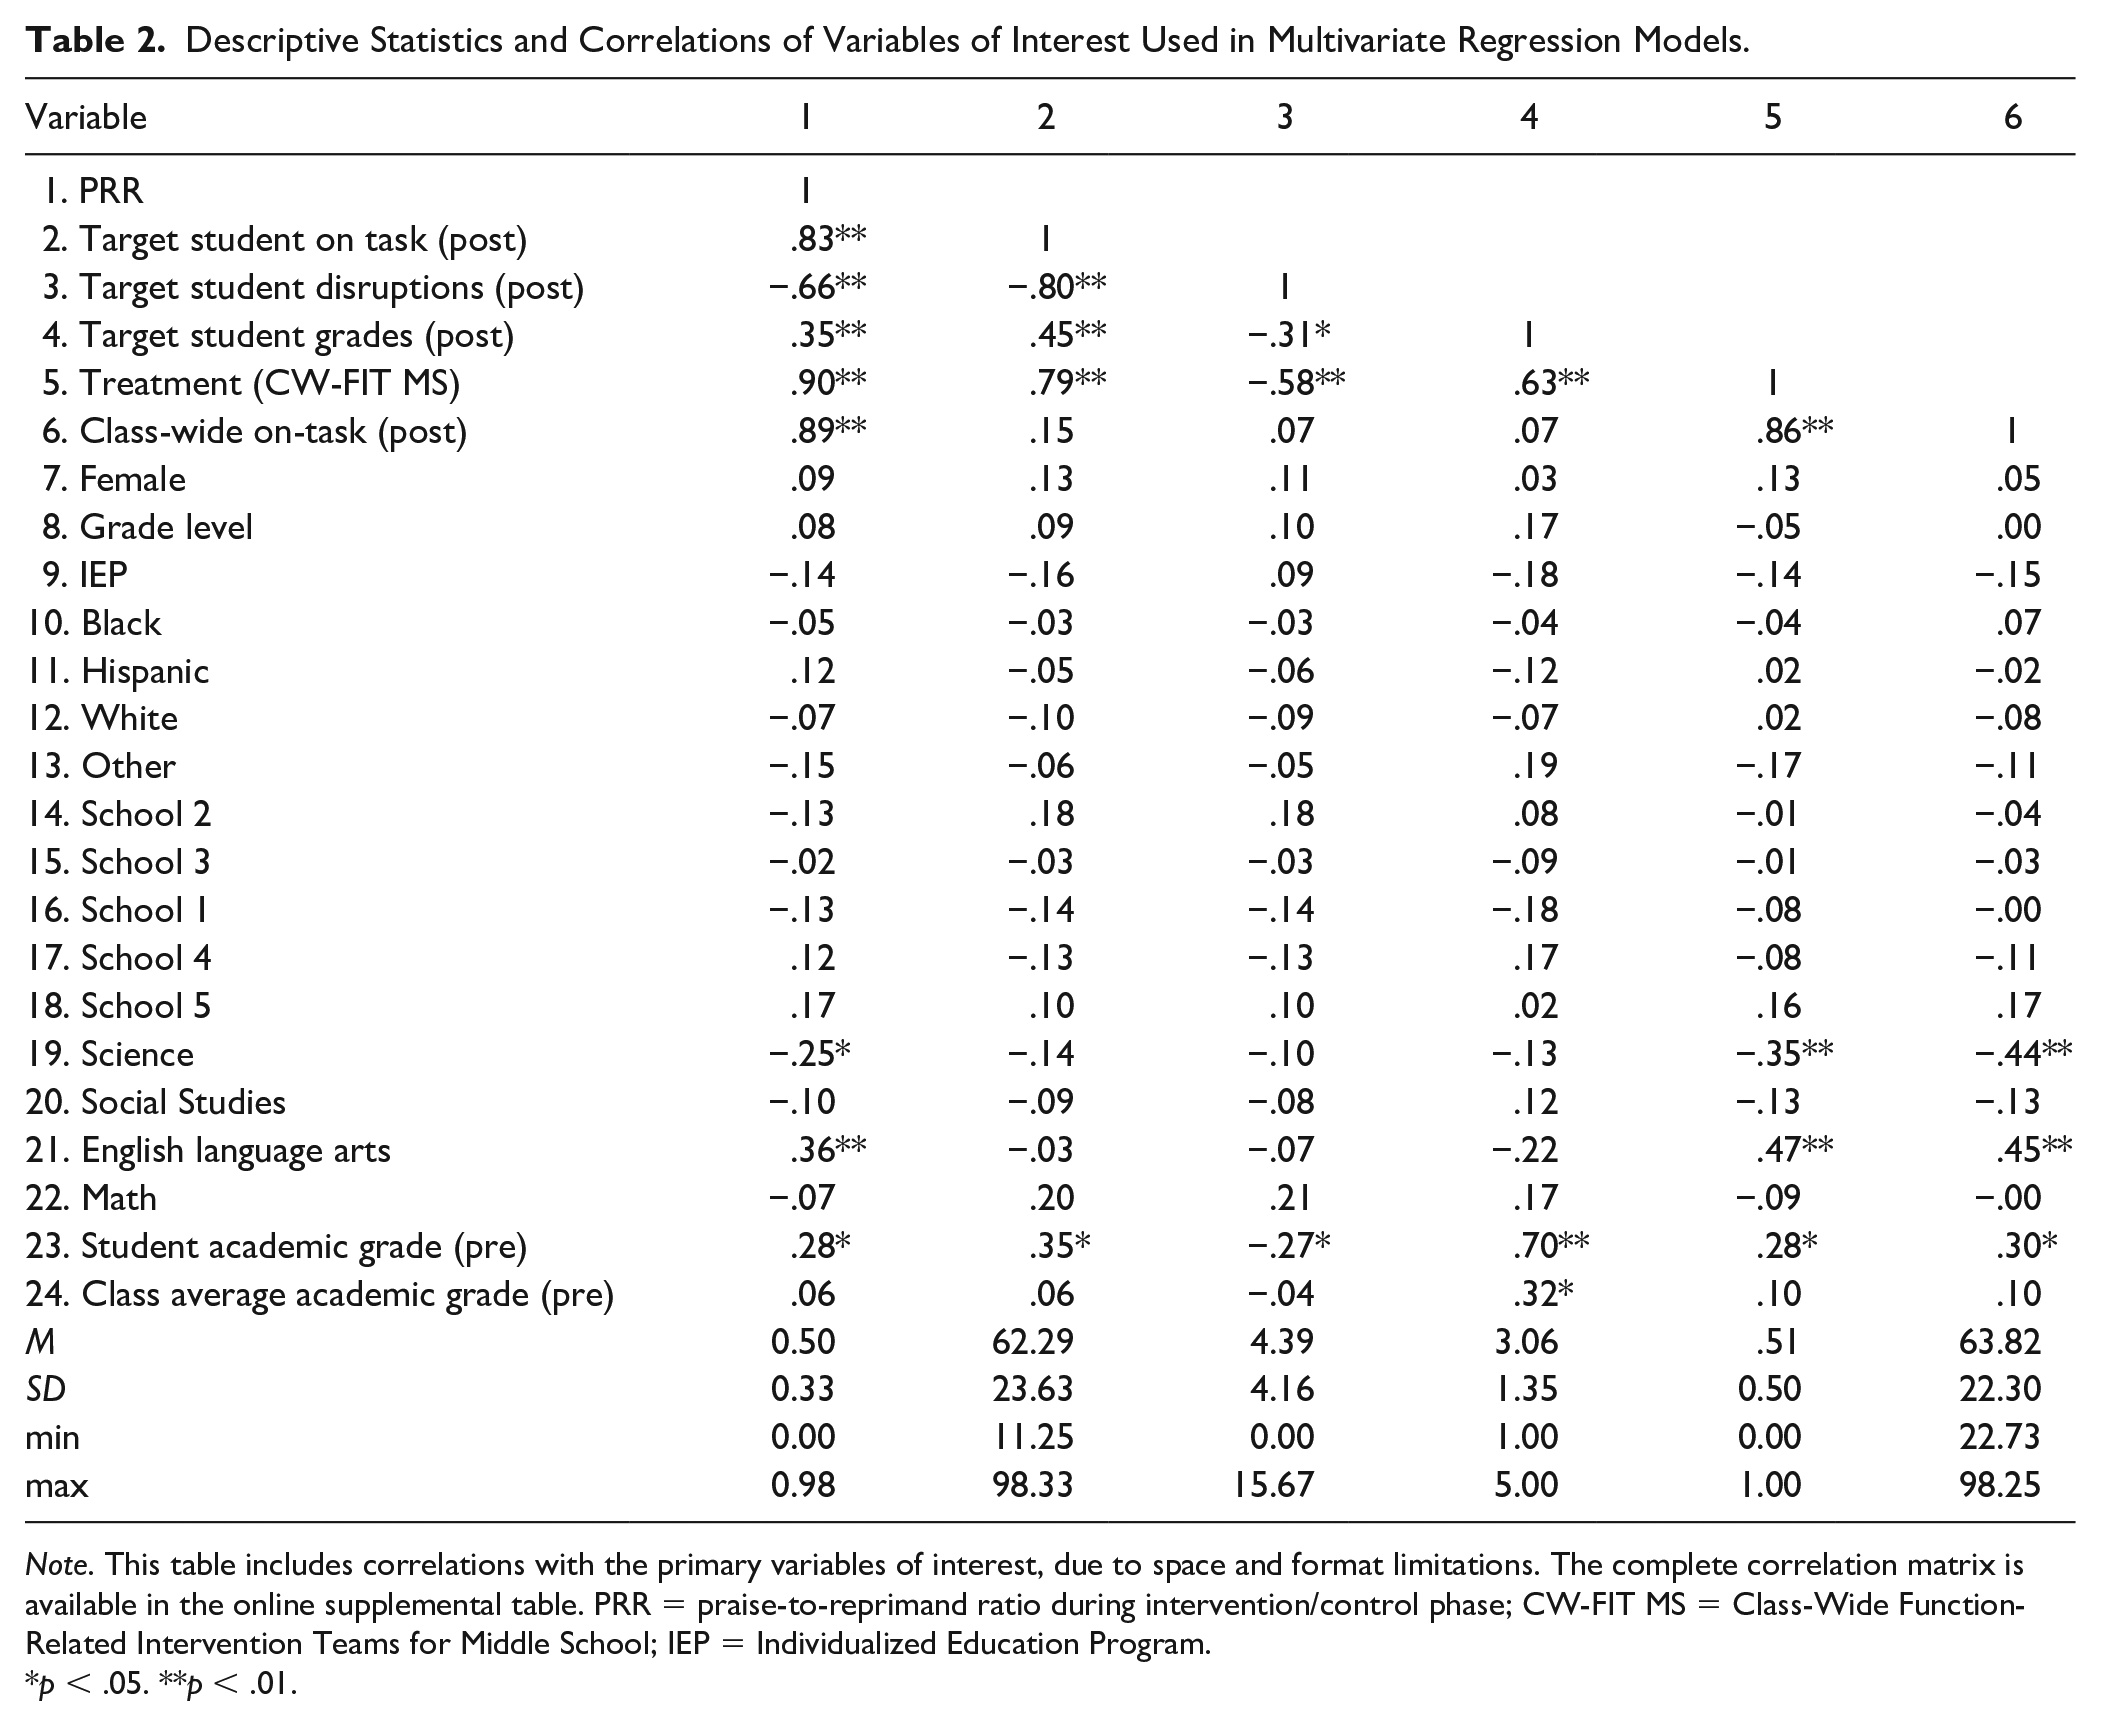
Note. This table includes correlations with the primary variables of interest, due to space and format limitations. The complete correlation matrix is available in the online supplemental table. PRR = praise-to-reprimand ratio during intervention/control phase; CW-FIT MS = Class-Wide Function-Related Intervention Teams for Middle School; IEP = Individualized Education Program.
p < .05. **p < .01.
Praise-to-Reprimand Ratios Effects on Class-Wide On-Task Behavior
As represented in Table 3 and Figure 1, the effect of the PRR was significant (b = 54.53, p < .001, 95% confidence interval, CI = [33.88, 75.18]). For every standard deviation increase in the PRR, class-wide on-task behavior increased by 0.78 -standard deviations. The model strongly predicted the outcome (r2 = .88). Several control variables (see the “Analytic Strategy” section) were included in this and the subsequent models, but not included in Table 3 because of space limitations.
Linear Multivariate Regression Model Results Predicting Outcomes.
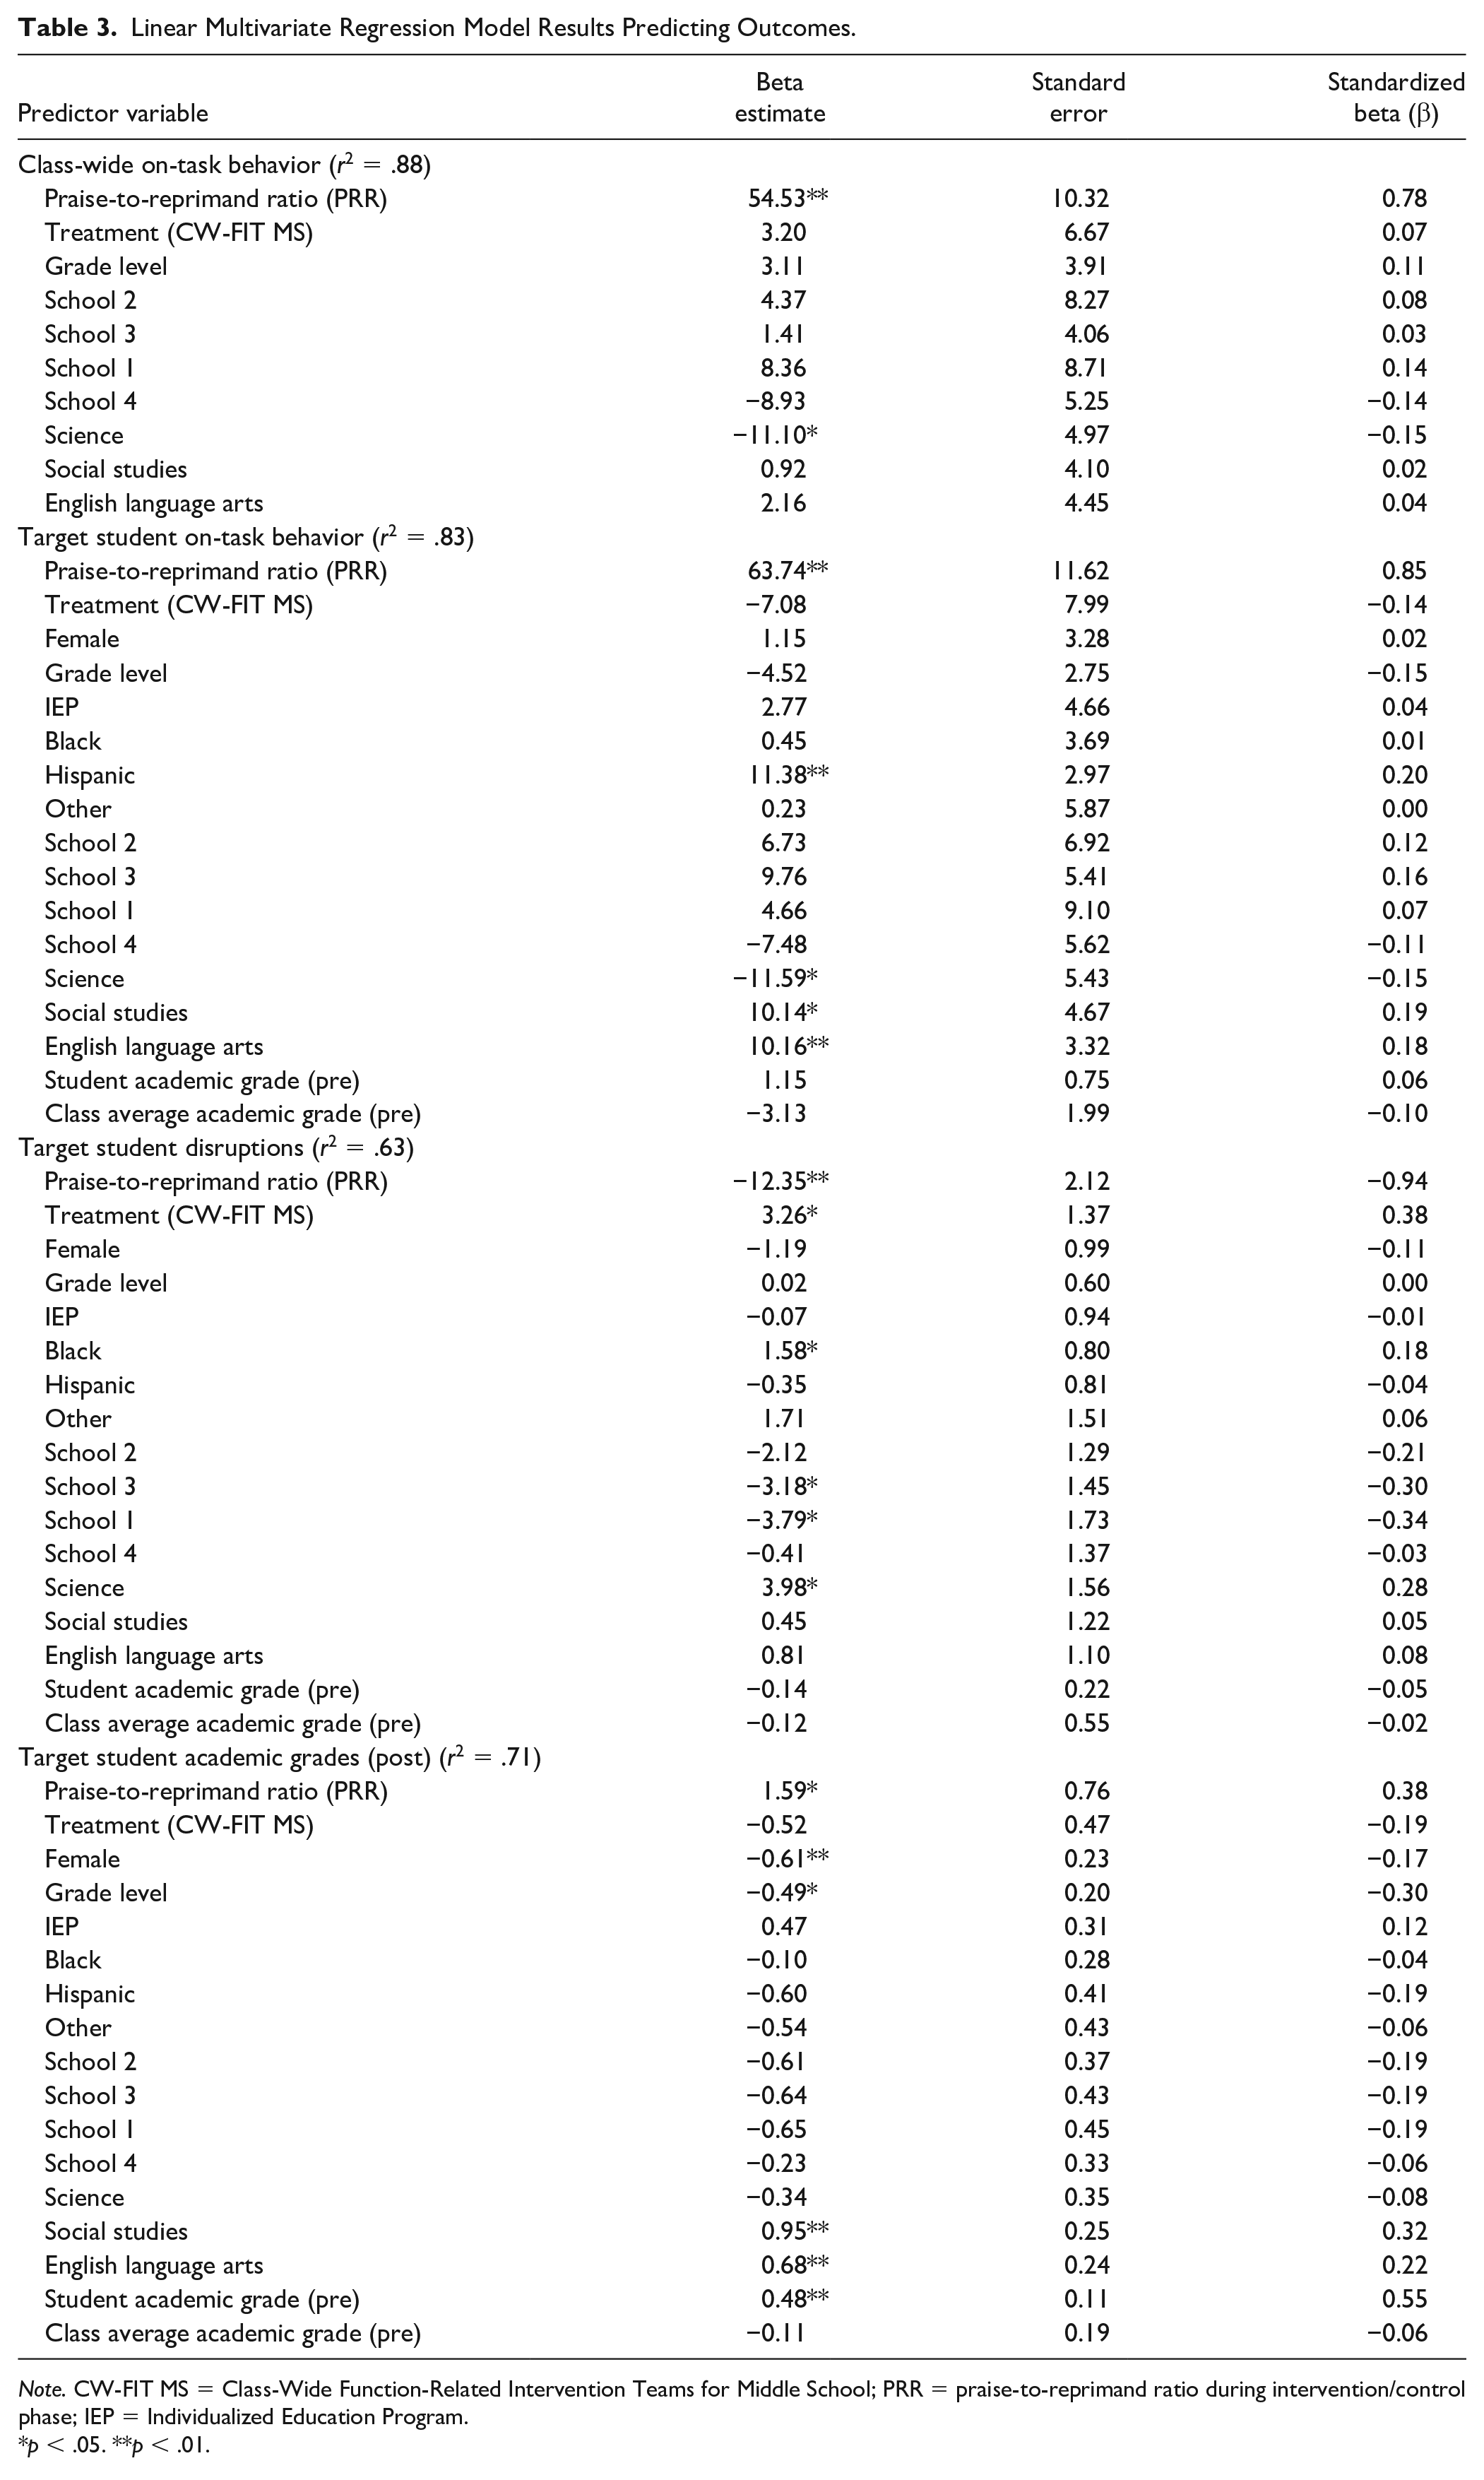
Note. CW-FIT MS = Class-Wide Function-Related Intervention Teams for Middle School; PRR = praise-to-reprimand ratio during intervention/control phase; IEP = Individualized Education Program.
p < .05. **p < .01.
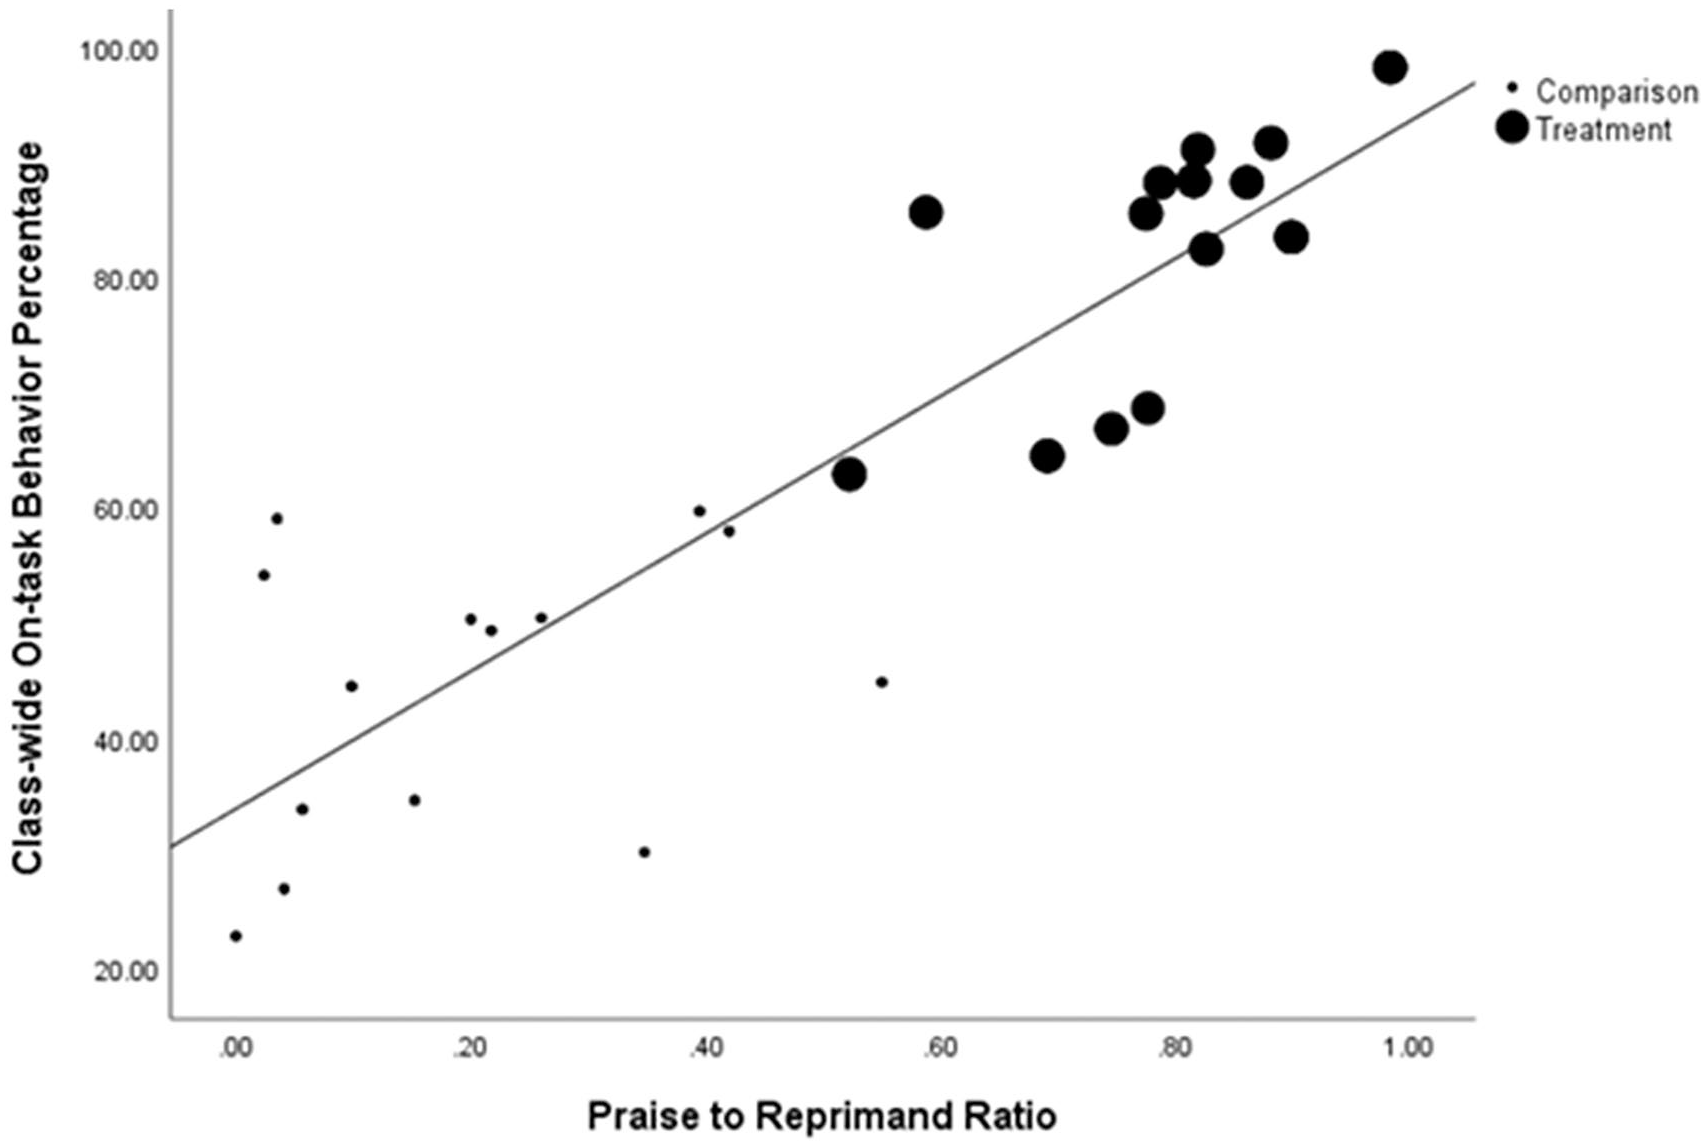
Simple linear relationship between teachers’ praise-to-reprimand ratio and class-wide on-task behavior percentage per teacher.
Praise-to-Reprimand Ratios Effects on Target Students
As shown in Table 3 and the top panel of Figure 2, the effect of the PRR on target students’ on-task behavior was significant (b = 63.74, p < .001, 95% CI = [40.50, 86.98]). For every standard deviation increase in the PRR, target student on-task behavior increased by 0.85 standard deviations. The model strongly predicted the outcome (r2 = .83).
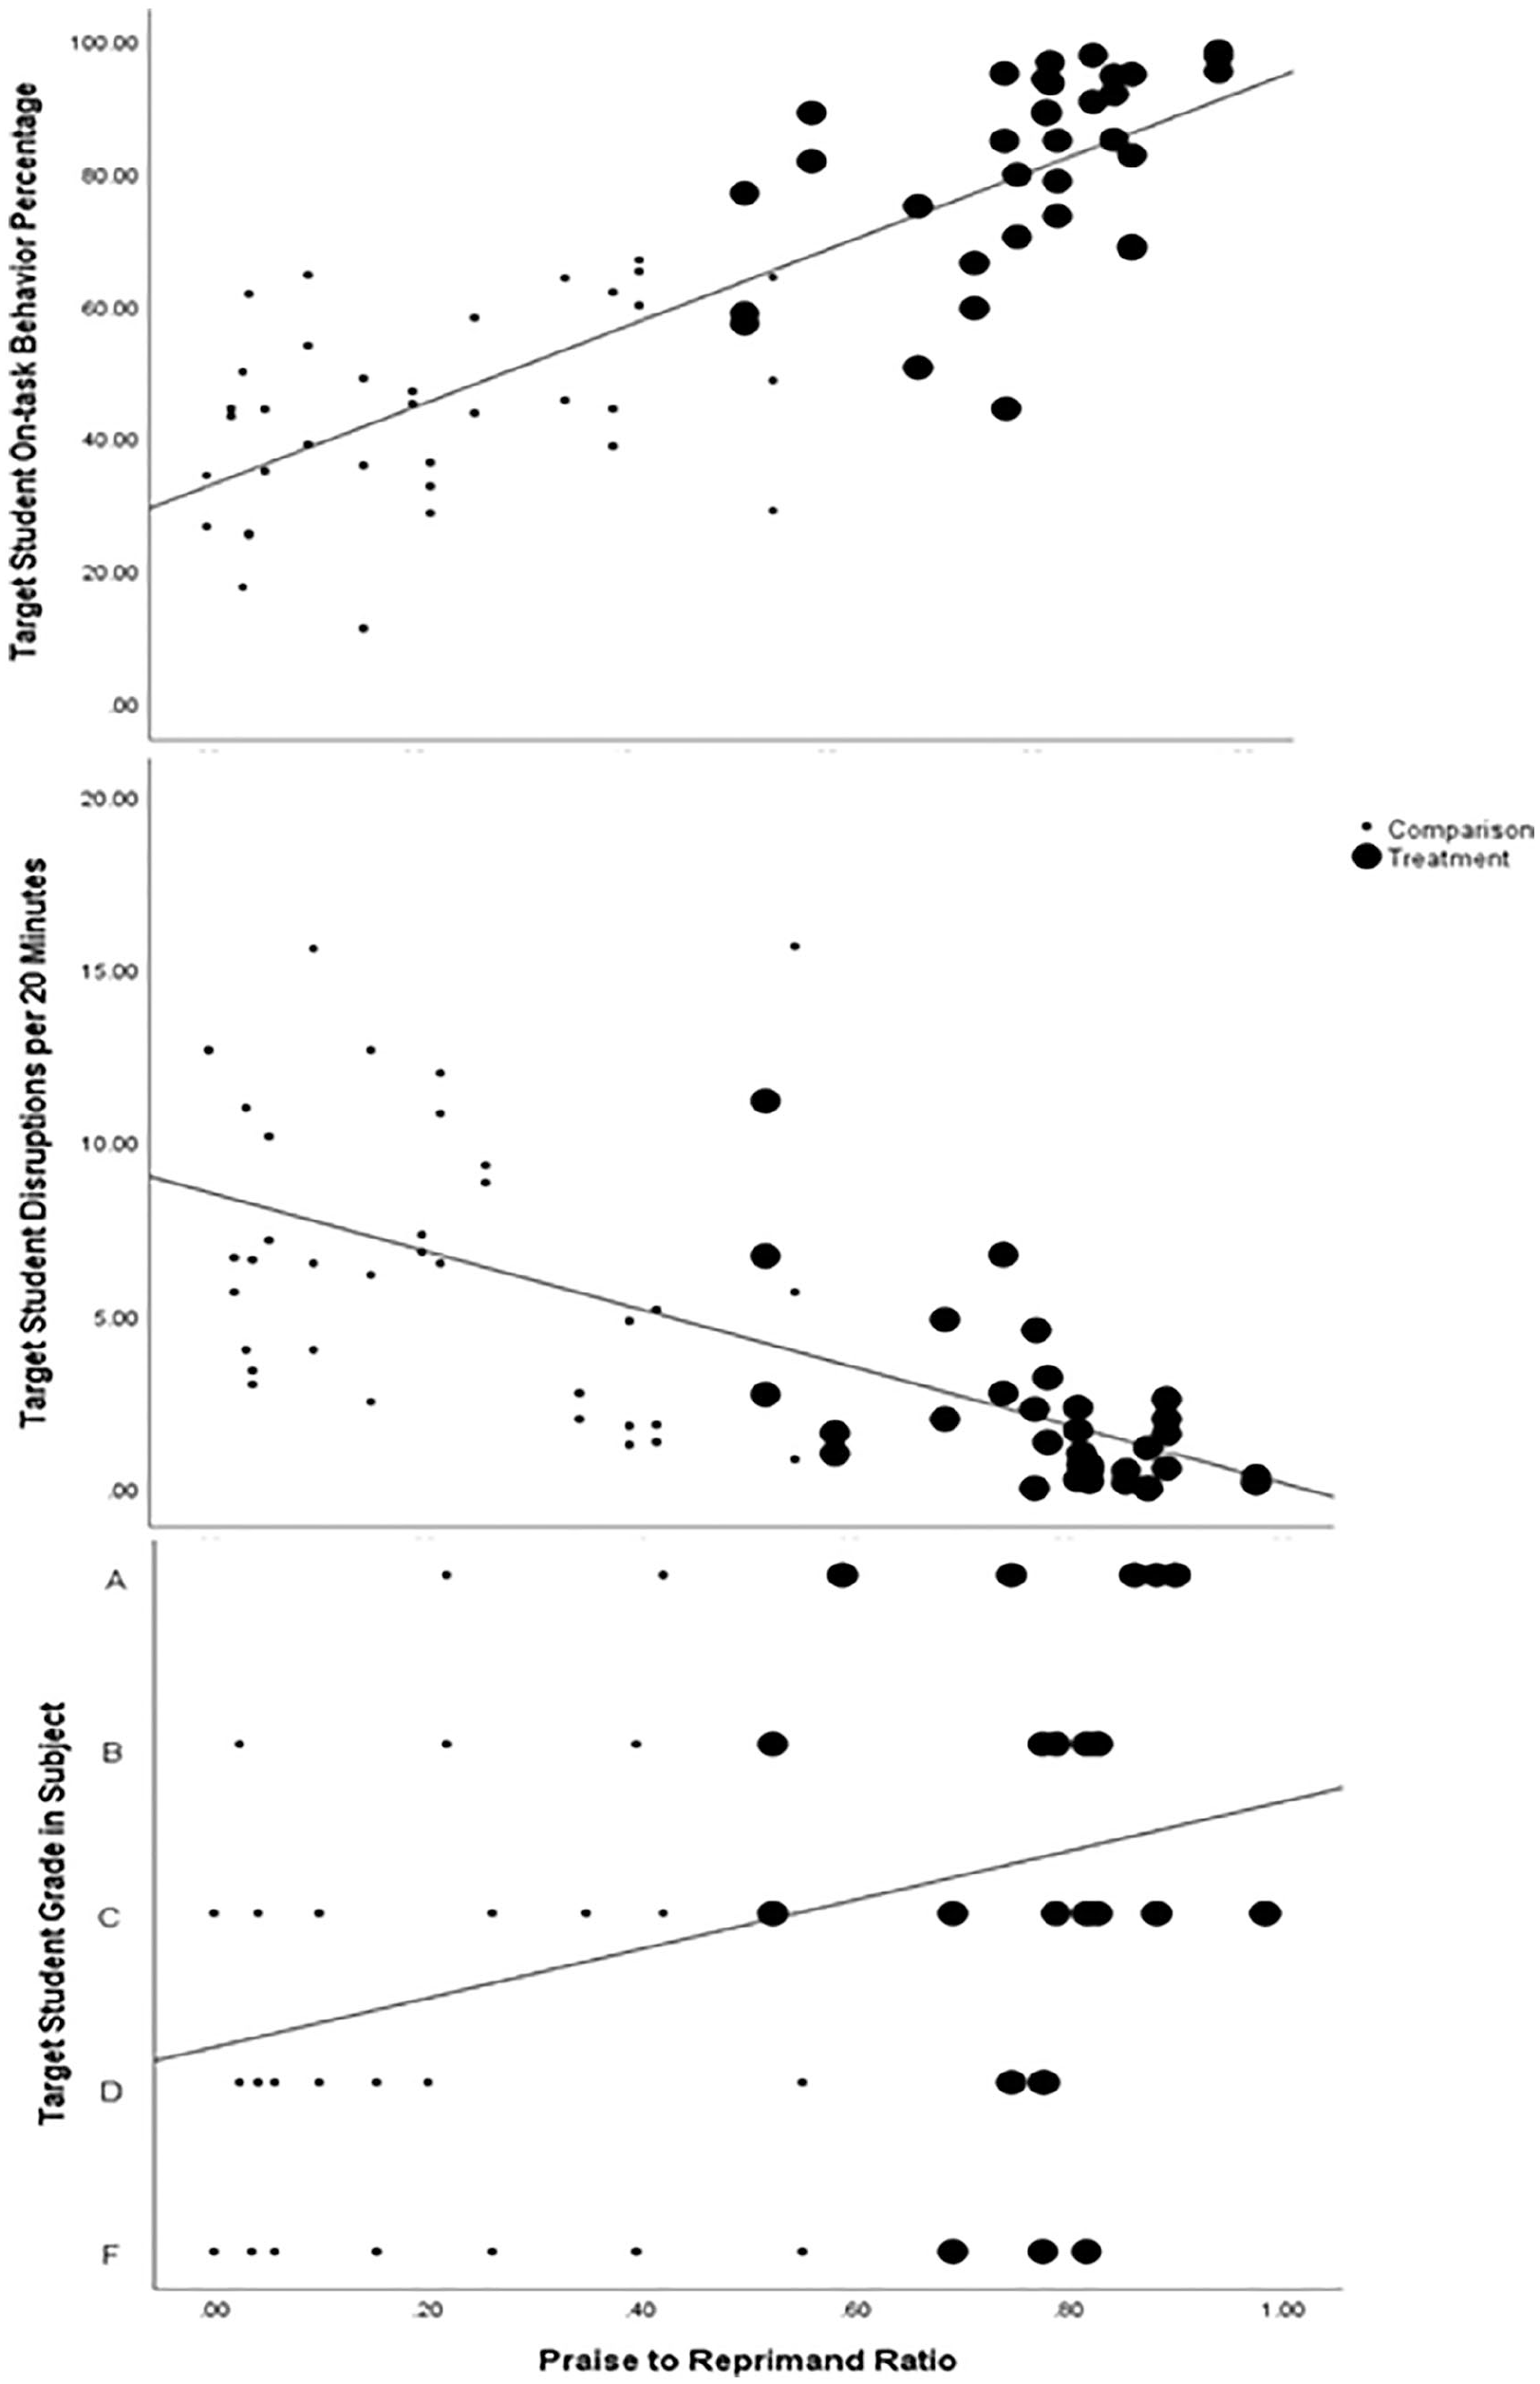
Simple linear relationship between teachers’ praise-to-reprimand ratio and target student outcomes per student.
As presented in Table 3 and the middle panel of Figure 2, the effect of the PRR on target students’ disruptions was significant (b = −12.35, p < .001, 95% CI = [−16.59, −8.11]). For every standard deviation increase in the PRR, target student disruptions decreased by 0.94 standard deviations. The model moderately predicted the outcome (r2 = .63).
As shown in Table 3 and the bottom panel of Figure 2, the effect of the PRR on target students’ grades was significant (b = 1.59, p = .037, 95% CI = [0.07, 3.11]). For every standard deviation increase in the PRR, target student grades increased by 0.38 standard deviations. The model strongly predicted the outcome (r2 = .71).
Praise-to-Reprimand Ratios Thresholds
To answer the question of whether there is a PRR threshold on the outcomes, we included a squared (nonlinear) term in the multivariate regressions. If a PRR threshold existed, the relation or line between PRR and the outcomes would be flat until this threshold was met and then a steep incline would be apparent. The nonlinear terms were all found to be nonsignificant (p > .05), revealing only a linear relation between the PRR and the outcomes, with no steep incline or decline (see Figures 1 and 2), indicating a relation between the PRR and outcomes but not an observed optimal threshold or tipping point.
Discussion
We conducted this study in the context of a randomized control trial of Class-wide Function-related Intervention Teams Middle School (CW-FIT MS) to isolate the effects of one of the main components of the intervention, PRR. After controlling for the intervention, we examined the effects of PRRs in 28 middle school classrooms on (a) on-task behavior class wide, (b) on-task behavior of students at risk for emotional and behavioral disorders (EBD), and (c) disruptive behavior of students at risk for EBD. Middle school teacher PRRs positively affected both class-wide on-task behavior and target student on-task behavior. In comparing the present study to past research (Caldarella, Larsen, et al., 2019; Caldarella, Larsen, Williams, Downs, et al., 2020), we found that the effect of PRRs was more powerful in middle schools than in elementary schools. Results showed 60 to 70 percentage point increases in both class-wide and target students’ on-task behavior as PRRs varied from near 0 to near 1, more than double the improvements shown in elementary school classrooms (see Caldarella, Larsen, et al., 2019; Caldarella, Larsen, Williams, Downs, et al., 2020). This may be because as student grade level increases teachers tend to communicate about behavior less frequently (White, 1975), though students still benefit from high PRRs (see Haydon et al., 2020). Middle school teachers may also expect students to be capable of managing their behavior with less teacher feedback. Furthermore, the higher mean percentage of class-wide and target students’ on-task behavior observed in the CW-FIT MS groups (see Figures 1 and 2) supports proactive classroom interventions designed to improve student outcomes. Results suggest that if teachers can reach a 1:1 PRR, class-wide and target students’ on-task behavior can reasonably be expected to reach approximately 60% in the absence of other interventions, like results in elementary schools (Caldarella, Larsen, Williams, Downs, et al., 2020).
A significant effect of PRRs on disruption rates for target students was also found, differing from previous elementary school studies (Caldarella, Larsen, et al., 2019). Results suggest that if teachers could reach a simple 1:1 PRR, they would see almost a 50% reduction in disruptions. If classrooms became void of reprimands, disruptions might approach zero for target students. A clear relationship between PRRs and reduction of disruptive behaviors seems apparent. The reasons for differences between results in elementary and middle school are unknown but may relate to adolescents’ increasing ability to self-regulate or self-manage their behavior (Steinberg, 2014). Furthermore, the lower mean percentage of students’ disruptive behavior observed in the CW-FIT MS group supports proactive classroom interventions intended to decrease student disruptive behavior.
A novel finding from this study showed that as PRRs increased so did the grades of target students, a meaningful but previously undocumented phenomenon. In no-praise classrooms, students were predicted to have, on average, D grades. As PRRs approached 1:1, students’ average grades were predicted to improve by one letter grade to C. Furthermore, as PRRs increased to all praise, students’ average grades were predicted to improve one additional letter grade to B. Furthermore, the higher mean letter grade observed in the CW-FIT MS group supports proactive classroom interventions intended to improve student academic outcomes.
Finally, we found a linear relationship between PRRs and all outcomes, suggesting that there is not a particular PRR (e.g., 3:1 or 4:1) at which behavior dramatically improves (similar to past studies: Caldarella, Larsen, et al., 2019; Caldarella, Larsen, Williams, Downs, et al., 2020). This finding is helpful, as teachers may find it difficult to keep track of a PRR threshold in the classroom. If teachers can simply praise more and reprimand less, they should experience improvements in class-wide and target student behavior and target student grades.
Limitations and Areas for Future Research
As this was one of the few studies to specifically examine PRRs in middle school classrooms, limitations and needed replications must be considered. First, we did not track PRRs specifically directed at target students but included praise and reprimands to anyone in the classroom including target students. Doing so provided a useful context for the classroom environment but did not show potentially unique effects of PRRs given specifically to a student at risk. It is possible that a classroom teacher could have a high PRR but have given no specific praise to a target student. Future studies would benefit from measuring praise and reprimands directed at target students as well as the entire class. In addition, while we collected data on whole-class on-task behavior, we did not collect data on disruptions and grades for the whole class, which would be another area for more research.
The granularity of some of the data collected was less than ideal. For example, student grades were reported as letter grades rather than percentages, making the data analysis less statistically powerful. While biases were possible regarding teacher-reported grades, some researchers have endorsed the use of grades as outcome variables because grades reflect what teachers’ value in student work (Brookhart et al., 2016).
Also, the sample size in this study was relatively small and restricted to five middle schools. Replications with larger, more diverse samples would be helpful. A larger sample size would increase accuracy in evaluating the relative impact of PRRs. Another limitation was disproportion between the percentage of Black/African American students designated as at risk (38.67%) compared to the school-wide demographic (17.88%), which may represent issues of disproportionality with risk identification (Osher et al., 2004). In addition, although target students were identified as at risk, few of them had been classified by their schools as having EBD. A study including more students formally classified with EBD, with stricter inclusion criteria, would be helpful.
Finally, we acknowledge there are other components of CW-FIT MS (social skills lessons, group contingency, etc.) that were not measured in this study. Nevertheless, the fact that we controlled for treatment status and PRR in the same statistical model allowed us to isolate any unique variance that PRR contributed above and beyond any other changes the teachers made because of CW-FIT MS. It is also important to note similar PRR and behavioral outcome data patterns for intervention and comparison groups (see Figures 1 and 2). This was true whether the classes were treatment or control, thus these results appeared robust to the presence or absence of CW-FIT MS further confirming the positive effects of PRRs.
Conclusion
Results from this study suggest that PRRs are a potentially important strategy for middle school teachers to manage the behavior of classrooms and target students during this difficult time of major student change and growth. There does not appear to be an optimal PRR for improving student behavior, but rather a recommended PRR of at least 1:1. However, higher ratios, approaching 9:1 (see Figures 1 and 2), with few if any reprimands (Caldarella, Larsen, Williams, Wills, & Wehby, 2020), are predicted to result in the best student outcomes. Middle school teachers may apply these results to improve their classroom environments by increasing their PRRs to improve student behavior. Middle school teachers should be trained and supported in giving high rates of praise and low rates of reprimands to improve student outcomes. Although the results are promising, additional research is needed to confirm study findings across other middle school contexts.
Supplemental Material
sj-xlsx-1-pbi-10.1177_10983007211035185 – Supplemental material for Effects of Middle School Teachers’ Praise-to-Reprimand Ratios on Students’ Classroom Behavior
Supplemental material, sj-xlsx-1-pbi-10.1177_10983007211035185 for Effects of Middle School Teachers’ Praise-to-Reprimand Ratios on Students’ Classroom Behavior by Paul Caldarella, Ross A. A. Larsen, Leslie Williams and Howard P. Wills in Journal of Positive Behavior Interventions
Footnotes
Action Editor: Melissa Stormont
Declaration of Conflicting Interests
The author(s) declared no potential conflicts of interest with respect to the research, authorship, and/or publication of this article.
Funding
The research reported here was supported by the Institute of Education Sciences, U.S. Department of Education, through Grant R324A160279, to University of Kansas in collaboration with Brigham Young University. The opinions expressed are those of the authors and do not represent the views of the Institute or the U.S. Department of Education.
Supplemental Material
Supplementary material for this article is available on the Journal of Positive Behavior Interventions website with the online version of this article.
References
Supplementary Material
Please find the following supplemental material available below.
For Open Access articles published under a Creative Commons License, all supplemental material carries the same license as the article it is associated with.
For non-Open Access articles published, all supplemental material carries a non-exclusive license, and permission requests for re-use of supplemental material or any part of supplemental material shall be sent directly to the copyright owner as specified in the copyright notice associated with the article.