
Abstract
Coaching is a key driver supporting implementation of evidence-based instructional and behavioral practices (EBPs). The purposes of this study were to propose a model of coaching and examine the effects of two coaching mechanisms (prompting and performance feedback) on (a) teacher use of classroom management EBPs and (b) student classroom disruption. Using two counterbalanced, concurrent multiple-baseline designs across seven teachers, modest functional relations were found between highly efficient delivery of coaching using prompting alone and performance feedback alone on (a) an increase in teacher use of EBPs and (b) a decrease in classroom disruption. No consistent differences were observed in the order with which prompting versus performance feedback were introduced, nor were consistent benefits observed when adding combined versus individual use of prompting or performance feedback. Findings and implications for coaching research and practice are discussed.
Keywords
Professional development combining training workshops and on-site coaching is a common approach for building the knowledge and skills to support behavioral change in schools (Bastable et al., 2019). Joyce and Showers (2002) described the important value of distinguishing between training and coaching as components of professional development. Training is the process by which new skills and knowledge are acquired, while coaching is the process for improving the use of new skills and knowledge under natural conditions. The core features of training for the implementation of evidence-based practices (EBPs) typically consist of (a) providing background knowledge and a theoretical framework underpinning the EBPs, (b) lecture and discussion regarding new knowledge and procedures, (c) modeling of new skills, and (d) behavioral rehearsal with feedback (e.g., Kealey et al., 2000; Sheridan et al., 2009). Although training is a critical step to support acquisition, sustained implementation of new skills often requires supplemental coaching (Eccles & Mittman, 2006; Odom et al., 2014).
Coaching is one strategy within the emerging field of implementation science that serves to promote and sustain behavior change for staff selected to implement EBPs (Fixsen et al., 2015). Coaching highlights natural stimuli that should control a newly learned skill (e.g., emphasizing when a new skill should be used), shapes the performance of the new skill (e.g., rewarding successive approximations), acknowledges the performance of the new skill (e.g., providing reinforcing feedback), and guides improved precision and fluency of the new skill (e.g., increasing speed, accuracy, and ease of use). Unfortunately, when individuals or groups are trained in new skills without embedded coaching, sustained implementation at the desired scale is less likely (Furman et al., 2021; Odom et al., 2014). Without support for establishing stimulus control, competing stimuli in the natural context often continue to reinforce existing patterns of behavior and block adoption of new strategies. Although research highlights coaching as a bridge between training and implementation (Noell et al., 2005; Reinke et al., 2012), there is not agreement about effective mechanisms of coaching.
Four Mechanisms of Effective Coaching
Literature on coaching has grown substantially since the 1990s but often emphasizes the desired qualities of coaches (e.g., being knowledgeable, approachable, trustworthy) or coaching activities (Bastable et al., 2019) and focuses less on the mechanisms of effective coaching (Anderson, 2001; Blazar & Kraft, 2015). Currently, most coaching evaluation is based on a binary measure of delivery (i.e., Did you receive coaching?) as opposed to the form, quality, and competence of coaching (i.e., What/how many/how much of the effective elements of coaching were delivered and received?). There remains a paucity of information on the mechanisms by which coaching is effective, and the mechanisms by which it produces positive outcomes in educational contexts. Improving the use of coaching in education will benefit from clarity about the mechanisms of effective coaching and documentation of the impact of coaching on both educators and students (Reinke et al., 2014).
The coaching logic model underpinning the current study was developed from a behavioral conceptualization of coaching and the fundamental mechanisms that make coaching effective (Massar, 2014; Massar & Horner, 2015). Freeman et al. (2017) describe coaching as the delivery of on-site antecedent and consequence manipulation intended to arrange the environmental conditions to increase successful implementation and sustainability. These environmental manipulations are adjusted by the coach to match the trainee’s current phase of learning (acquisition, fluency, maintenance, generalization, adaptation). Similarly, our coaching model is based on the delivery of antecedent and consequence strategies and posits that the provision of fluency-building opportunities and supporting cultural and organizational adaptation is important for increasing coaching effectiveness. We suggest that coaching improves the fidelity and sustainability of EBP adoption as a function of four basic mechanisms: (a) prompting, (b) performance feedback, (c) fluency building, and (d) adaptation.
Prompting is the delivery of an antecedent visual, auditory, or physical cue that increases the likelihood of a targeted response (Joseph et al., 2016). Within coaching, the delivery and fading of prompts serves the function of bringing new skills or behaviors under the control of natural stimuli (Touchette, 1971). Training prompts are used to teach what a new skill is, and coaching prompts typically emphasizes when a new skill is used.
Performance feedback is behavior-specific information provided about the form, context, accuracy, or frequency of an individual’s behavior. Performance feedback targets the likelihood of a new skill being used (reinforcement or punishment) or to improve the precision with which a new skill is used (shaping). Performance feedback is arguably the most widely recognized and researched coaching component (Knight, 2007), although the extent to which feedback is related to specific positive outcomes remains contested (Cavanaugh, 2013). Performance feedback as a coaching mechanism typically emphasizes how well a new skill is used.
Fluency describes the accuracy and speed of behavioral responding (Howell & Lorson-Howell, 1990). Fluency building is the process by which multiple and sufficient opportunities for practicing newly acquired skills are provided to increase the likelihood of using skills correctly and quickly in naturally occurring conditions. It is more likely new skills will generate naturally occurring reinforcers when the skills are developed with the necessary fluency to be easy and effective (Weiss et al., 2010). Coaching to support fluency building is necessary when a skill has been accurately established in an individual’s behavioral repertoire during training but (a) an individual has not developed efficient and effective use of a skill or (b) the skill is not used enough to be sustained by natural reinforcers. Fluency building typically emphasizes how naturally a new skill is used.
Adaptation is the process by which the features of a program, intervention, or curriculum are aligned with the skills, resources, administrative support, and values of the local environment (e.g., school staff, students, families, and community; Carr, 2007; McIntosh et al., 2014). Adaptation emphasizes the process of adjusting elements of an EBP to fit the local context while maintaining the core features that make the EBP effective (Embry, 2004).
Purpose of the Study
The purpose of the present research was to experimentally examine the effects of two mechanisms of effective coaching (prompting and performance feedback) on teachers’ use of one of three evidence-based classroom EBPs for preventing problem behavior recommended by the PBIS Technical Report on Evidence-Based Classroom Strategies for Teachers (Simonson et al., 2015): behavior-specific praise (BSP; Ennis et al., 2020a), opportunities to respond (OTRs; MacSuga-Gage & Simonsen, 2015), and precorrection (PRE; Evanovich & Kern, 2018). Recent literature suggests that providing teachers with coaching on these EBPs may increase use of the practices as well as student outcomes (Ennis et al., 2020b; Randolph et al., 2019). Two studies were conducted to allow counter-balanced examination of the independent and combined effects of using prompting and performance feedback on teacher use of targeted EBPs. In the first study, teachers who had received prior training on EBPs initially received coaching only via performance feedback, followed by a phase in which coaching combined performance feedback with prompting. In the second study, the order of coaching mechanisms was reversed, and prompting was introduced first and then combined with performance feedback.
Secondary aims of the two studies were to examine whether increases in teachers’ use of the classroom EBPs improved student outcomes and whether teachers perceived the mechanism of classroom coaching to be effective and socially valid.
Method
Setting and Participants
The study took place within three public elementary schools (K–Grade 5) in one midsize suburban school district in the U.S. Pacific Northwest with a total of 22 schools serving 10,945 students. All elementary schools in the district were implementing Positive Behavioral Interventions and Supports (PBIS) to adequate Tier 1 fidelity (M = 87%) based on Tiered Fidelity Inventory scores (TFI; McIntosh et al., 2017).
Teachers
A recruitment email was sent from a district-level administrator to elementary teachers interested in receiving coaching support to implement classroom EBPs. Eight teachers responded and an initial 20-min observation was conducted in each classroom by the first author. Seven of the eight general education teachers who met the following inclusion criteria were selected to participate: (a) at least two of three highly recommended classroom EBPs (BSP, academic OTR, and use of PRE) were being implemented below levels recommended by Simonson et al. (2015) and Simonson and Myers (2015) and (b) teacher self-report of lower than desired levels of student academic engagement and/or higher than desired levels of disruptive behavior. The eighth teacher met the initial study inclusion criteria but soon thereafter started receiving coached professional development on classroom management from district personnel and chose to exit the study prior to baseline data collection. All seven of the participating elementary teachers were female. Teachers A–D were in Study 1 and Teachers E–G were in Study 2. Teachers C, D, and E taught Grade 1, Teachers A and G Grade 3, Teacher B Grade 4, and Teacher F Grade 5. Teachers A, B, D, and E had taught for 1 year, Teacher F for 2 years, and Teachers C and G for 5 years. Class sizes across teachers ranged from 22 (Grade 1; Teacher E) to 30 (Grade 3; Teacher G).
Coaches
Two graduate students in a special education doctoral program were selected as coaches based on the following inclusion criteria: (a) having completed at least 1 year in their doctoral program and (b) having experience working in an educational/clinical setting. Coach A was a third-year male student who provided coaching to Teachers A–D (Study 1). Coach B was a third-year female student who provided coaching to Teachers E–G (Study 2). Both coaches had expertise in PBIS and professional development. Coach A had 4 years of prior experience conducting research in schools implementing PBIS and providing trainings and coaching to school personnel on Tier 3 interventions. Coach B had 9 years of experience supporting school personnel in PBIS implementation (e.g., providing training and coaching on data-based decision-making). The coaches received training, and met criterion, on the delivery of prompting and performance feedback from the first author based on the Coaching for Effective Outcomes (CEO) curriculum (Massar, 2017). Training for the coaches included (a) presentations on coaching (i.e., describing coaching objectives, background on coaching, and participating in coaching activities and applications [e.g., identify when to use prompting, what types of prompting could be used]), (b) providing coaches with handouts (e.g., brainstorm sheets for identifying barriers to coaching), and (c) administering 10-item multiple-choice knowledge assessment to coaches to determine mastery of content and to ensure coaches were prepared to deliver coaching to teachers. Examples of items on the knowledge assessment included “What is the difference between training and coaching” and “Effective performance feedback has multiple characteristics including.” Coaches needed to answer all items correctly on the knowledge assessment to ensure readiness for coaching. The content of coaches’ training (performance feedback vs. prompting) was staggered for each coach depending on the order in which they were using that coaching mechanism across the two studies.
Students
All students in the teachers’ classes were participants in the study. Student data were collected and reported at the class-wide level.
Measures
Teacher implementation of classroom evidence-based practices
Three classroom EBPs were examined: (a) PRE, (b) BSP, and (c) academic OTR. Two of the EBPs were selected for each teacher using a modified version of the Classroom Management Self-Assessment Revised (Simonsen et al., 2006). The measure included five subscales: (a) maximize structure and predictability (n = 4 items), (b) behavior expectations taught and reinforced (e.g., PRE; n = 4 items), (c) engage students in observable ways (e.g., OTR; n = 3 items), (d) use a continuum of strategies to acknowledge appropriate behavior (e.g., BSP; n = 4 items), and (e) use a continuum of strategies to respond to inappropriate behavior (n = 4 items). The coached (primary) EBP and the uncoached EBP were selected from EBPs from Subscales 2 to 4 (PRE, BSP, and OTR). Evidence-based practices from Subscales 1 and 5 were not selected because opportunities to use these EBPs were unlikely to occur with adequate frequency during classroom observations (e.g., arrange classroom to minimize crowding and distraction). The coached EBP was selected for each teacher by the first author based on their lowest or second lowest score from Subscales 2 to 4. The uncoached EBP for each teacher was selected at random from the other two EBPs. The subscale score for the coached EBP for Teacher A was 25% (PRE), Teacher B was 66% (BSP), Teacher C was 0% (BSP), Teacher D was 33% (BSP), Teacher E was 50% (PRE), Teacher F was 0% (BSP), and Teacher G was 66% (BSP).
Precorrection
Precorrection was operationally defined as a positively stated verbal cue or reminder, modeling, or behavioral practice delivered just before the desired behavior is expected. Examples include (a) verbal prompting (e.g., “Remember to line up quickly and quietly, with our hands by our sides”), (b) visual cueing (e.g., “Let’s look at our poster and review what our Ready to Read body looks like”), and (c) modeling or practicing a skill (e.g., “I am going to show you how we walk from our desks to our stations. Watch me. First. . .”).
Behavior-specific praise
Behavior-specific praise was operationally defined as verbal praise delivered contingent upon student(s) demonstration of appropriate behavior that includes a statement of specific behavior student(s) demonstrated. Examples include (a) “Great job lining up quietly with your hands to your side,” (b) “I like the way Group 2 is on task and working quietly,” and (c) “Juan, excellent job following directions the first time.”
Academic opportunities to respond
Opportunities to respond was operationally defined as a verbal or visual request for academic-related information from students. Examples include (a) holding a flashcard up for a student to answer, (b) calling on a student to answer an academically related question, (c) posing a question to the class related to academic content, and (d) requests for performance (e.g., “Write the answer to problem 1 on your whiteboards”).
Academic engagement
Student data on academic engagement were collected for only four baseline sessions in Study 1 and after only one baseline session in Study 2. This measure was abandoned after initial sessions because of ceiling levels of academic engagement across classrooms. Academic engagement was assessed during a 15-min observation by randomly selecting individual students for 1-min observations, then rotating through the selected students until the 15-min observation was complete. During each 1-min observation, observers recorded the proportion of 10-s intervals in which the student was oriented toward or engaged with the instructional or work materials during designated work time for at least 80% of the interval. A percentage academic engagement score for the class was the mean percentage engagement intervals across the 15 students.
Classroom disruption
After two informal observations, it was determined that the three most common disruptive behaviors occurring across all classrooms were (a) out of the assigned seating, (b) peer-to-peer disruption, and (c) interrupting the teacher. Each behavior was operationally defined and measured using 10-s partial interval recording. All three behaviors were coded as “classroom disruption.” Out-of-seat behavior was operationally defined as a student or students being out of or leaving an assigned seat or assigned seating area (e.g., carpet) and/or walking around the classroom without permission. Peer-to-peer disruption was defined as students engaging in peer-to-peer conversation unrelated to the assigned task, or when the expectation was to be quiet, or engaging inappropriately with peer(s) (i.e., making faces at another student, touching another peer). Classroom interruption was defined as a student or students commenting or asking questions at a time when the expectation is to be quiet and/or shouting out or interrupting the teacher or another student when speaking.
Trained observers conducted one 15-min observation a day three times per week per teacher. Data collection sessions resulted in a composite score of the proportion of intervals with disruptive behavior by any student and proportion of intervals that teachers used the classroom EBPs. Consistency in classroom schedules and procedures, coupled with high rates of opportunity for teachers to use each EBP, regularly made partial interval recording feasible.
Interobserver agreement
Interobserver agreement (IOA) was calculated for at least 33% of sessions across all phases and at least 30% of the sessions within each phase. Interobserver agreement was measured by calculating both total agreement and Cohen’s kappa (Byrt et al., 1993). Total agreement IOA was calculated by dividing the number of intervals with agreements by the total number of intervals (intervals with agreement plus intervals with disagreement) and multiplying by 100%. The IOA percentage was considered acceptable if total agreement was above 85% in all scored sessions. Cohen’s kappa is a measure of overall agreement between two observers that adjusts for the possibility that agreement occurs by chance (Byrt et al., 1993). Kappa was calculated after each IOA session for every teacher participant and included calculations for all three dependent variables.
Total agreement IOA for all teachers and behaviors was at or above .85 across all IOA assessments. Mean kappa for academic OTRs was .67 (range = .55–.78), BSP was .83 (range = .67–.90), and PRE was .79 (range = .69–.83). Mean kappa for classroom disruptive behavior was .64 (range = .58–.71).
Procedural fidelity
Procedural fidelity data were collected in 100% of coaching sessions across all phases and teachers using the Coaching Fidelity Checklist: Performance Feedback (10 items) and the Coaching Fidelity Checklist: Prompting (7 items) through self-report from Coaches A and B (see Massar, 2017 for the full list of items). The Performance Feedback (PF) measure assessed the extent that the coach delivered performance feedback and that prompting was not delivered and the Prompting (PR) measure assessed the extent that coaches delivered prompting and that performance feedback was not delivered. Items across measures were rated as delivered, not delivered, or not applicable. Example items included on the PF measure included “Coach provides reinforcing feedback with 1-2 specific examples of how the teacher used the skill successfully in the lesson (e.g., “I noticed that you delivered specific verbal praise to individual students [insert value] times during the lesson”)” and “Coach does not provide feedback on any other behavior management skills.” Examples of items on the PR measure included “Coach offers 1–2 concrete examples of the behavior (skill)” and “Coach does not provide any feedback on teacher performance using the behavior (skill).” In cases where an item was marked as not applicable, it was not included in the total number. Fidelity was calculated by dividing the number of items delivered by the total number of items and multiplying by 100%. In Study 1, fidelity for Phase B (PF) was 100% across teachers. In Phase BC (PF with PR), fidelity for Teacher A was not measured due to her withdrawal from the study. Fidelity for Teacher B was 97%, Teacher C was 100%, and Teacher D was 98%. In Study 2, fidelity in Phase C (PR) and Phase BC was at or above 95% for all teachers.
Social validity
Following completion of both studies, teachers completed the Teacher Evaluation Inventory for Coaching Intervention Survey, a 6-item Likert-type survey (Massar, 2017) assessing ease, efficiency, acceptability, and impact of the coaching received. Survey items were assessed on a 5-point scale (strongly disagree = 1 to strongly agree = 5).
Procedures
Studies 1 and 2 were each conducted using a concurrent multiple-baseline across participants design employing a baseline (BL) phase and two intervention phases sequentially counterbalanced across the two studies (Study 1: A= BL, B = PF, BC= PF plus PR; Study 2: A = BL, C = PR, BC = PF plus PR). Together the designs allowed for an examination of a functional relation between implementation of three approaches to coaching (e.g., coach-delivered prompting alone, performance feedback alone, and combined prompting with performance feedback) and (a) an increase in teacher use of the classroom EBP and (b) a decrease in classroom disruption. Decisions about length of phases and intervention order were response-guided following guidelines recommended by Kratochwill (2013).
Step 1: Training and initial assessment
Prior to the initial observation, teachers completed a 30-min online training module (Massar, 2017) presenting an overview of the components of class-wide PBIS (CW-PBIS; Simonsen & Myers, 2015). The online training module provided teachers with information on (a) why classroom management is important for teachers (e.g., improve student engagement, decrease student problem behaviors), (b) the importance of collecting student data (e.g., count of behaviors) for decision-making, and (c) detailed descriptions of the three EBPs that included providing examples and nonexamples (PRE, BSP, and OTRs; Freeman et al., 2017; Simonsen & Myers, 2015). Upon completion of the online module, teachers completed a multiple-choice assessment (Massar, 2017) to evaluate their comprehension and ability to use the three EBPs in their classrooms. Once teachers were trained, the coaches and first author conducted an initial, 20-min assessment of classroom management and class-wide systems using a modified Classroom Management Self-Assessment (CW-PBIS; Simonsen & Myers, 2015) to identify (a) areas of strength in classroom practices and (b) select classroom EBPs for measurement and coaching in Phases 2 and 3.
Step 2: Baseline
Baseline data collection procedures occurred three times per week and included direct observation of (a) teacher implementation of classroom EBPs and (b) student academic engagement and classroom disruption. Coaches A and B observed teachers approximately once per week in each assigned classroom during BL phases (Study 1: Teachers A–D for Coach A, and Study 2: Teachers E–G for Coach B). Coaches did not deliver feedback during BL but used this time to (a) initiate contact with teachers; (b) understand the classroom environment, routines, and procedures; and (c) establish a routine for observing prior to Step 3.
Step 3: Intervention
The third step began once BL data had been collected and a stable data pattern emerged. Teachers in both studies had intervention conditions introduced at different points in time following multiple-baseline protocols to avoid history as a potential confound. Intervention phases—performance feedback (B) or prompting (C) and prompting with performance feedback (BC)—were counterbalanced across Study 1 and Study 2 to control for sequencing effects (Ward-Horner & Sturmey, 2010). With the use of counterbalancing, Teachers A, B, C, and D had PF delivered by Coach A in the first intervention phase (B) followed by PR with PF (BC) in the second intervention phase. Teachers E, F, and G had PR (C) delivered by Coach B in the first intervention phase, followed by PR with PF (BC). Data collectors continued to take data on teacher, classroom disruption, and procedural fidelity of coaching sessions. Teachers were asked to complete the social validity questionnaire at the end of all intervention.
PF phase (B)
During the PF phase (B), Coach A observed Teachers A–D for 20–30 min a week and met with the teacher once a week for a 10-min performance feedback session that was delivered in person in the teachers’ classrooms. During the feedback session, only the targeted classroom EBP was discussed. Coach A followed a structured feedback protocol and self-reported on procedural fidelity.
PR phase (C)
During the PR phase (C), Coach B observed Participants E–G once per week and delivered a weekly email prompt to each teacher with a brief reminder of the targeted classroom EBP. No performance feedback was provided. To ensure that teachers received the prompt, emails were sent with a requested read receipt (i.e., when the email was opened, a notification was sent to the coach and first author). Coach B followed a structured prompting protocol and self-reported on procedural fidelity.
PR and PF phase (BC)
All teachers received PR and PF in the final intervention phase (BC). During this phase, Coach A and B continued to observe teachers once per week. Following the observation, coaches provided the 10-min feedback session. Although coaching sessions typically occurred immediately following coaches’ observations, scheduling conflicts pushed some coaching sessions to the next school day. Weekly coaching sessions were conducted using the same procedures utilized in the PF phase (B). Immediately following the coaching session, coaches sent an email prompt to the teacher using the procedures followed in the prompting phase (C).
Analysis
Visual analysis was used to assess functional relations and nonparametric (Tau-U) analyses were used to assess magnitude of effect. Visual analysis was employed to (a) assess design integrity and (b) determine whether there was a functional relation between intervention procedures and change in teacher behavior and student disruption. Visual analysis focused on systematic consideration of graphed data and included evaluation of (a) level, (b) trend, (c) variability, (d) immediacy of effect, (e) overlapping data, (f) similar patterns across similar phases, and (g) vertical analysis for multiple-baseline designs (Horner et al., 2005).
Tau-U is a measure of intervention effect size that allows for control of monotonic BL trend and serial dependency in the data (Parker et al., 2014). Along with the results of visual analysis, the Tau-U analysis allowed for the determination of the magnitude of effect of the coaching components on the dependent variables. Tau-U scores range from −1.0 to 1.0 and were calculated using a free, web-based calculator (Vannest et al., 2016).
Results
Figures 1 and 2 summarize the results of Study 1 and Figures 3 and 4 summarize the results for Study 2. Table 1 provides a summary of the Tau-U estimates across both studies.
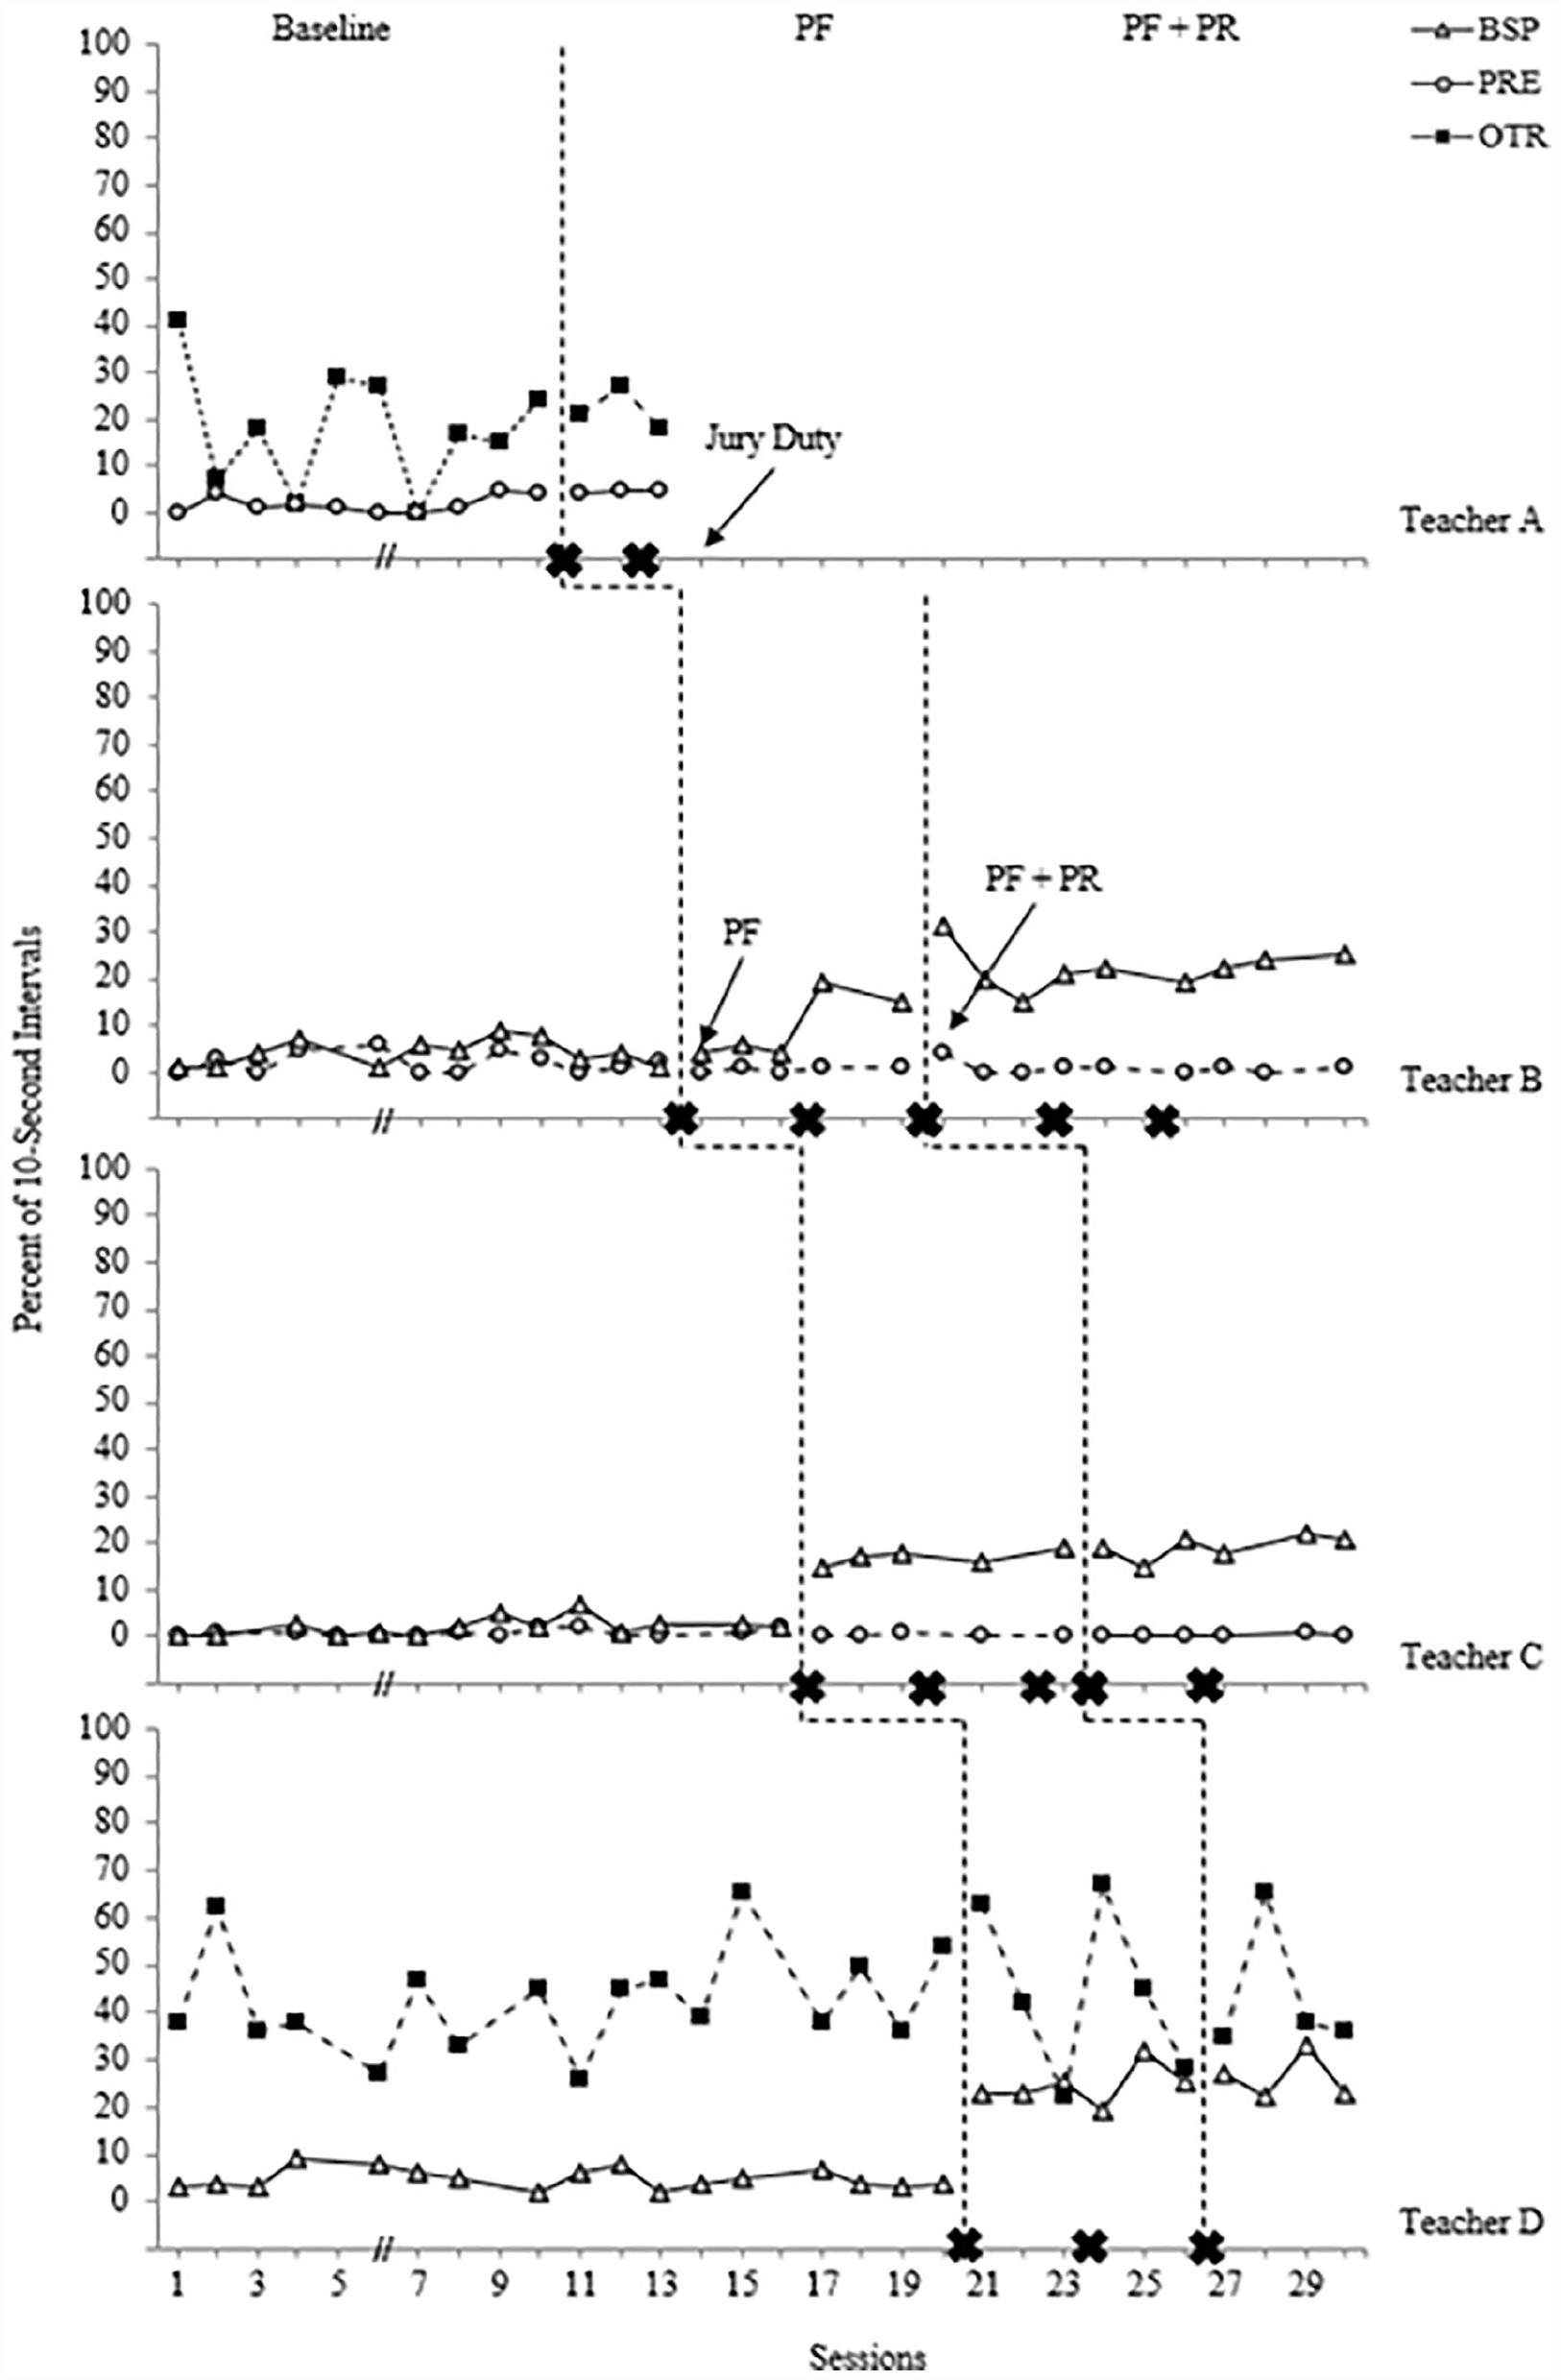
Teacher’s use of coached and uncoached classroom EBPs for Study 1.
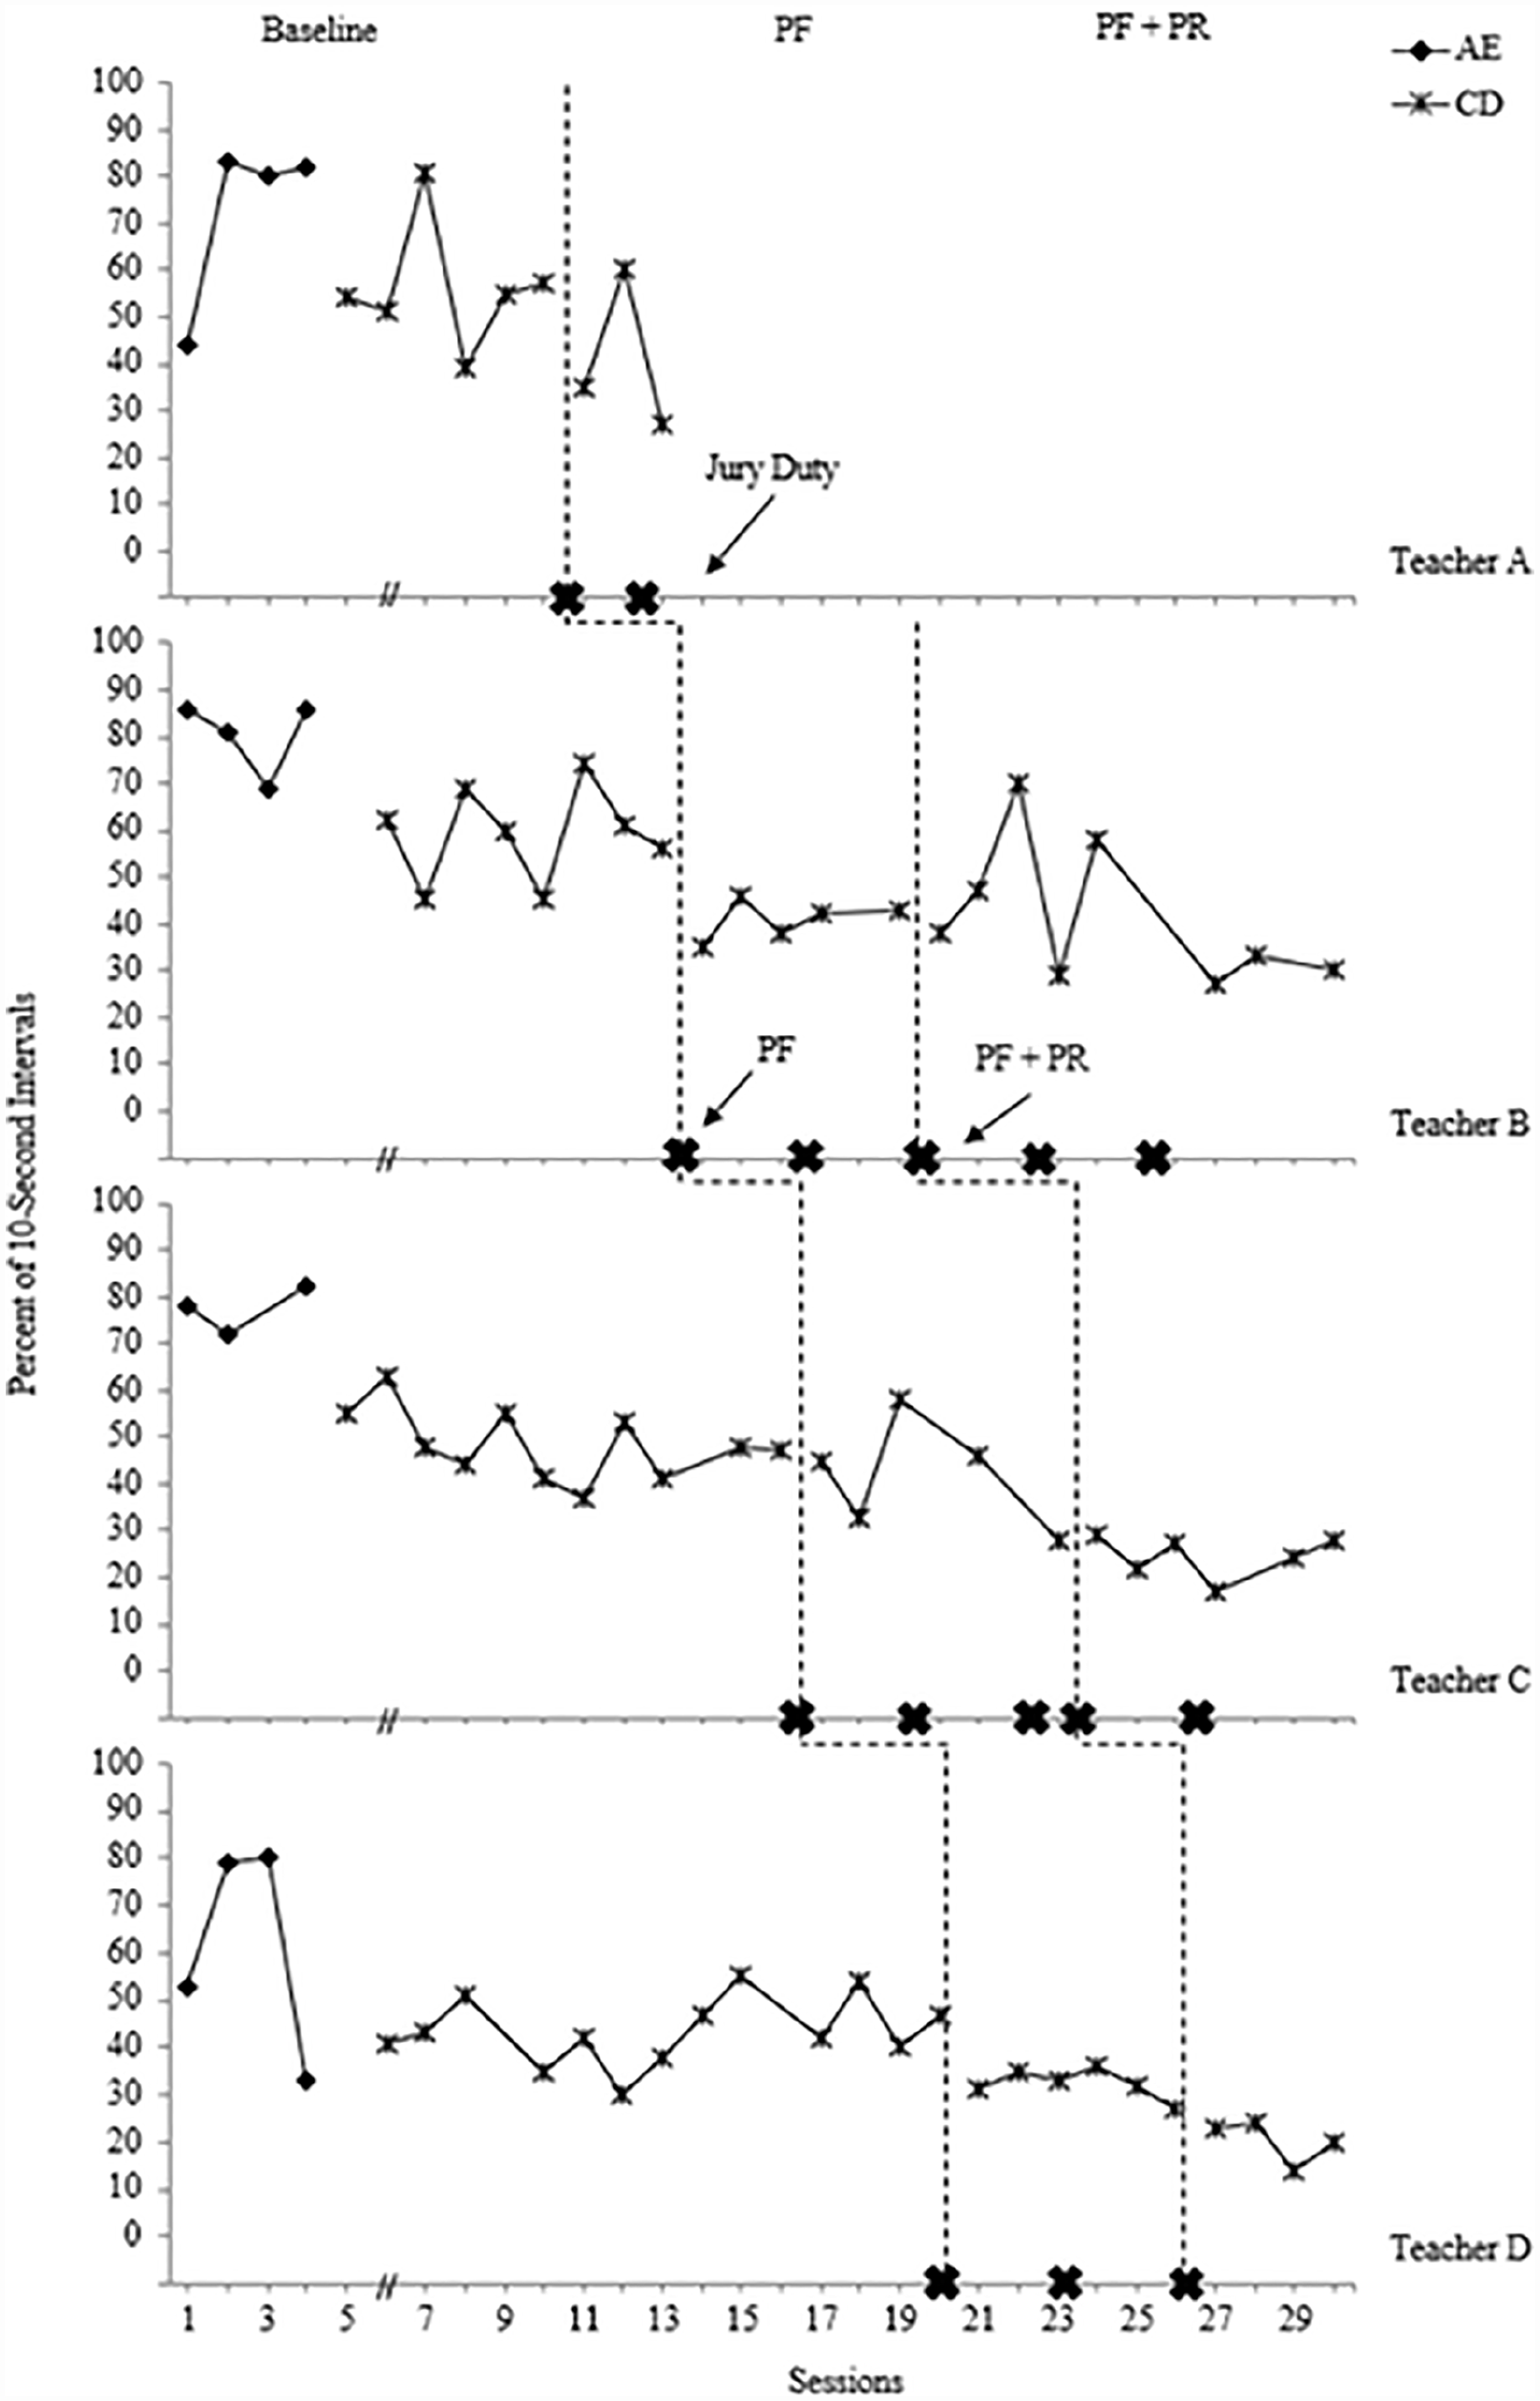
Percentage of intervals with classroom disruption for Study 1.
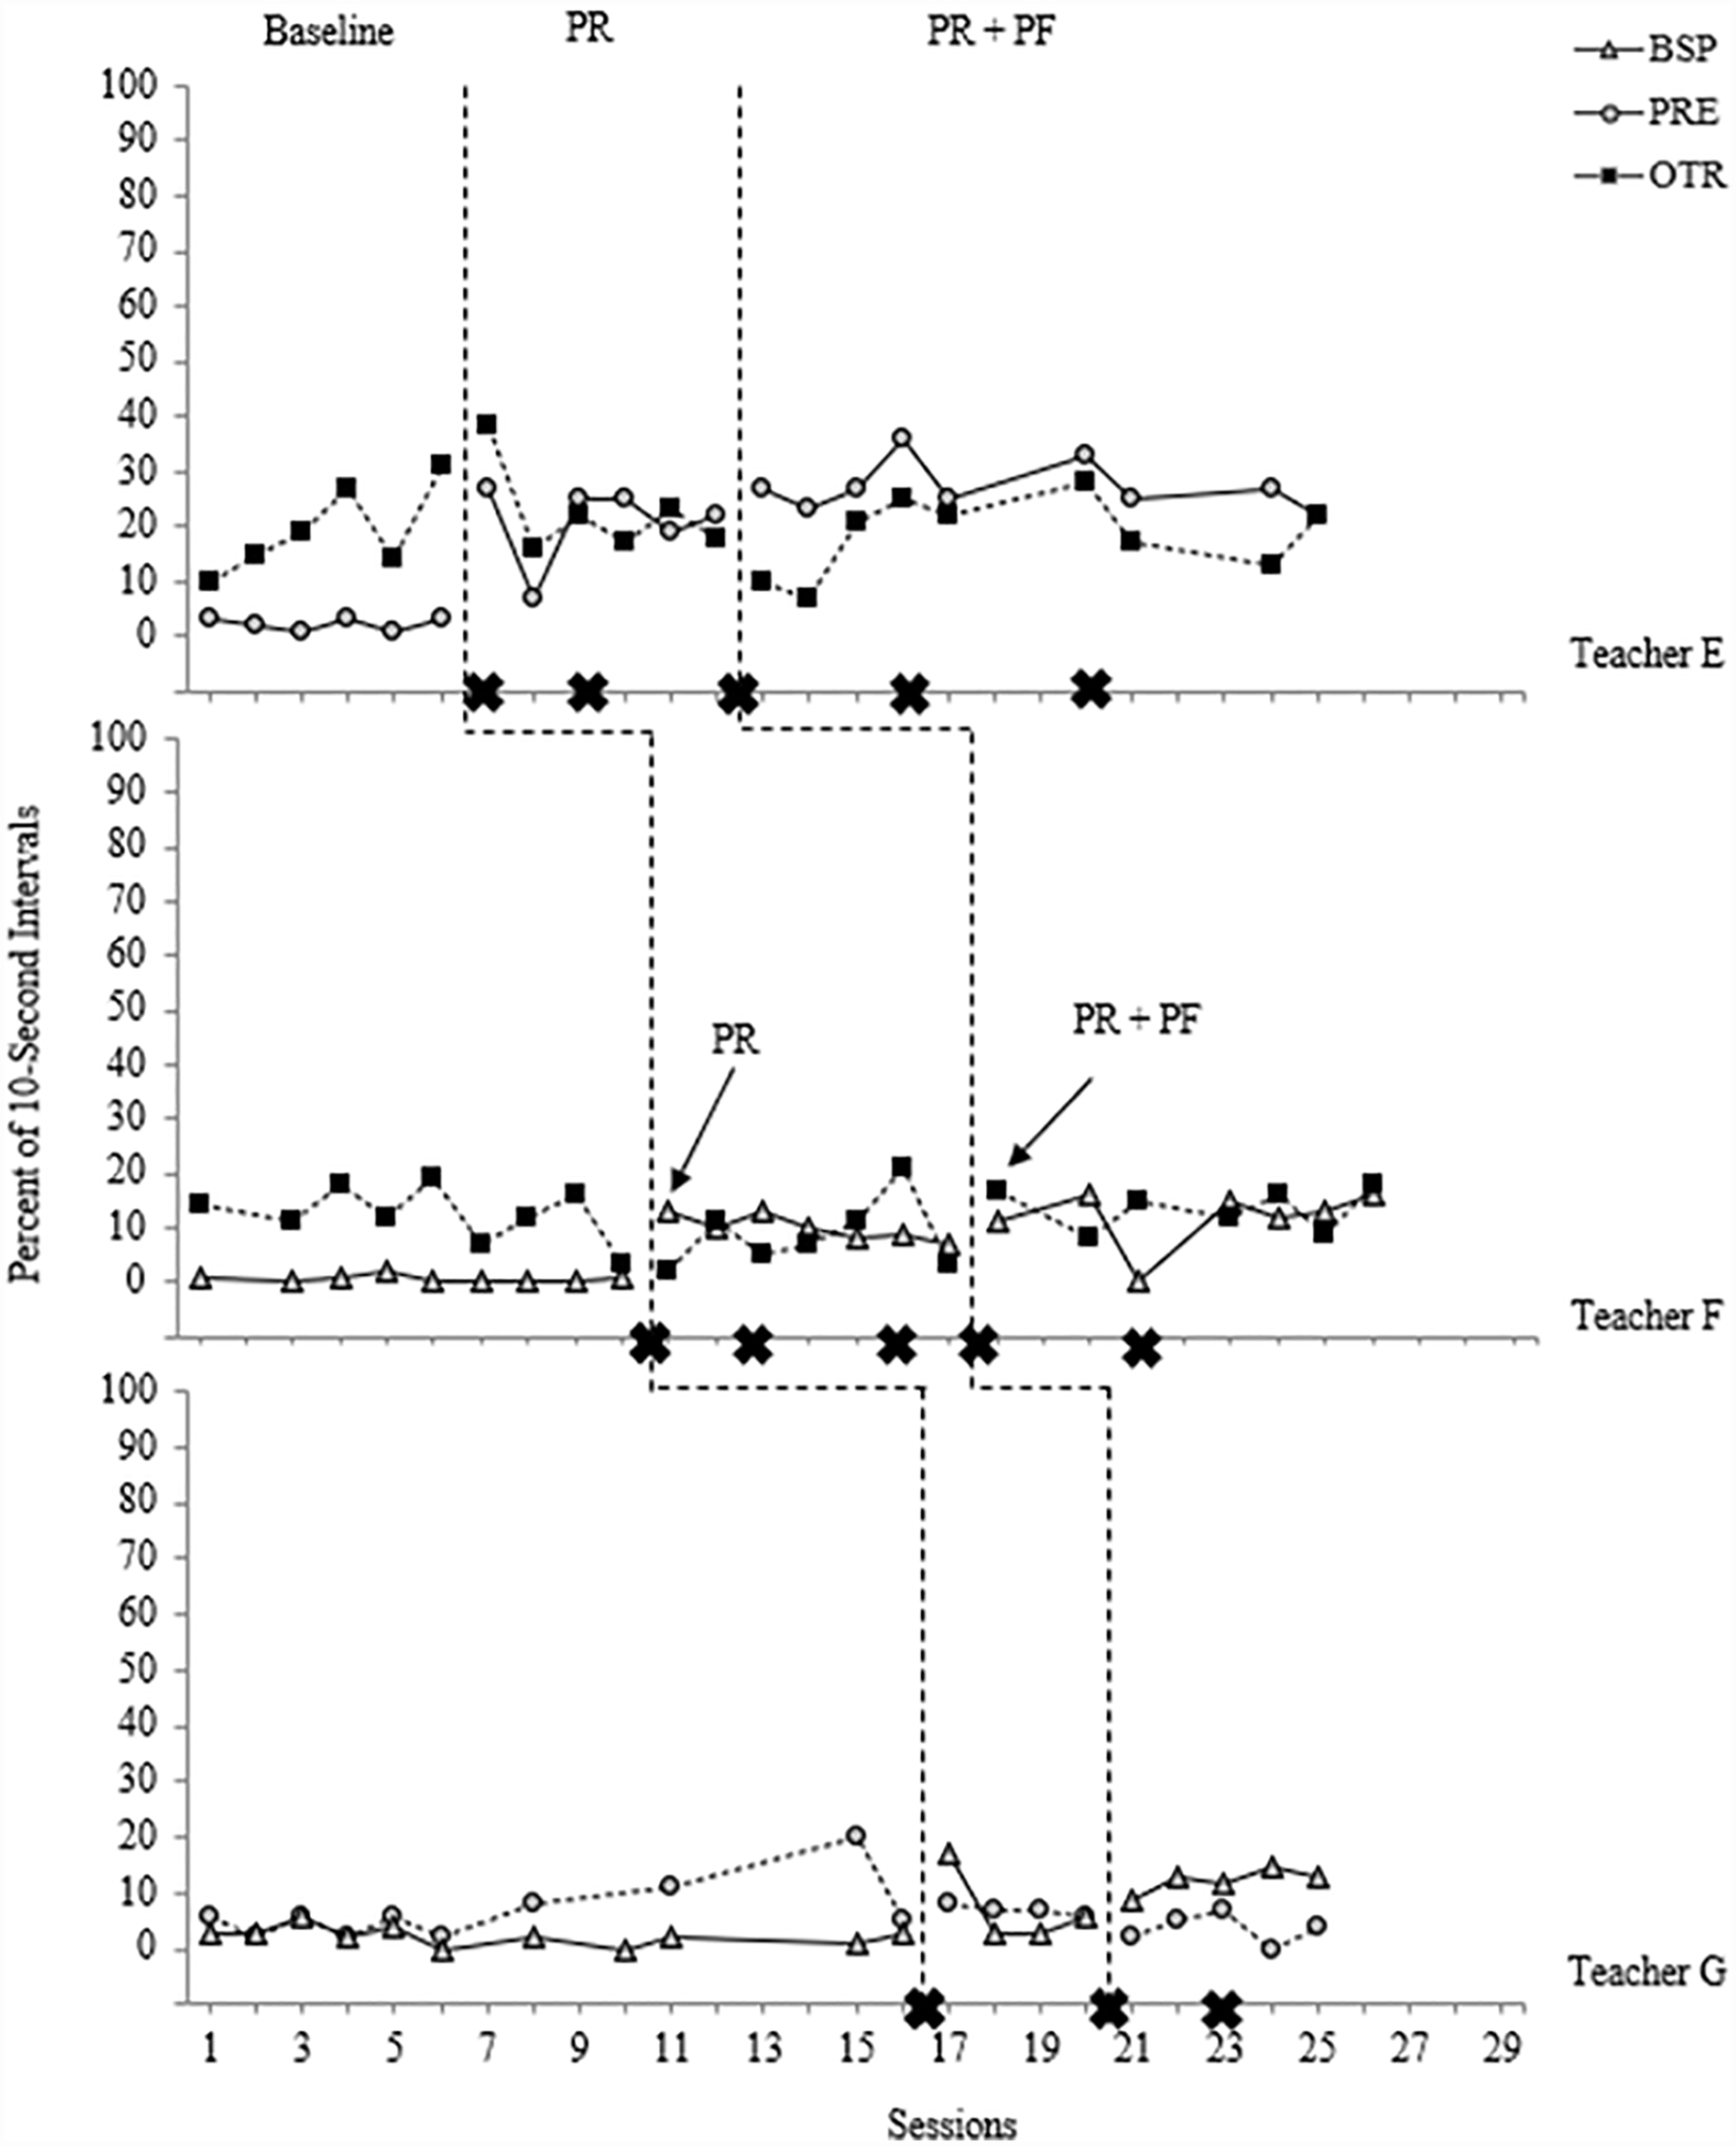
Teacher’s use of coached and uncoached classroom EBPs for Study 2.
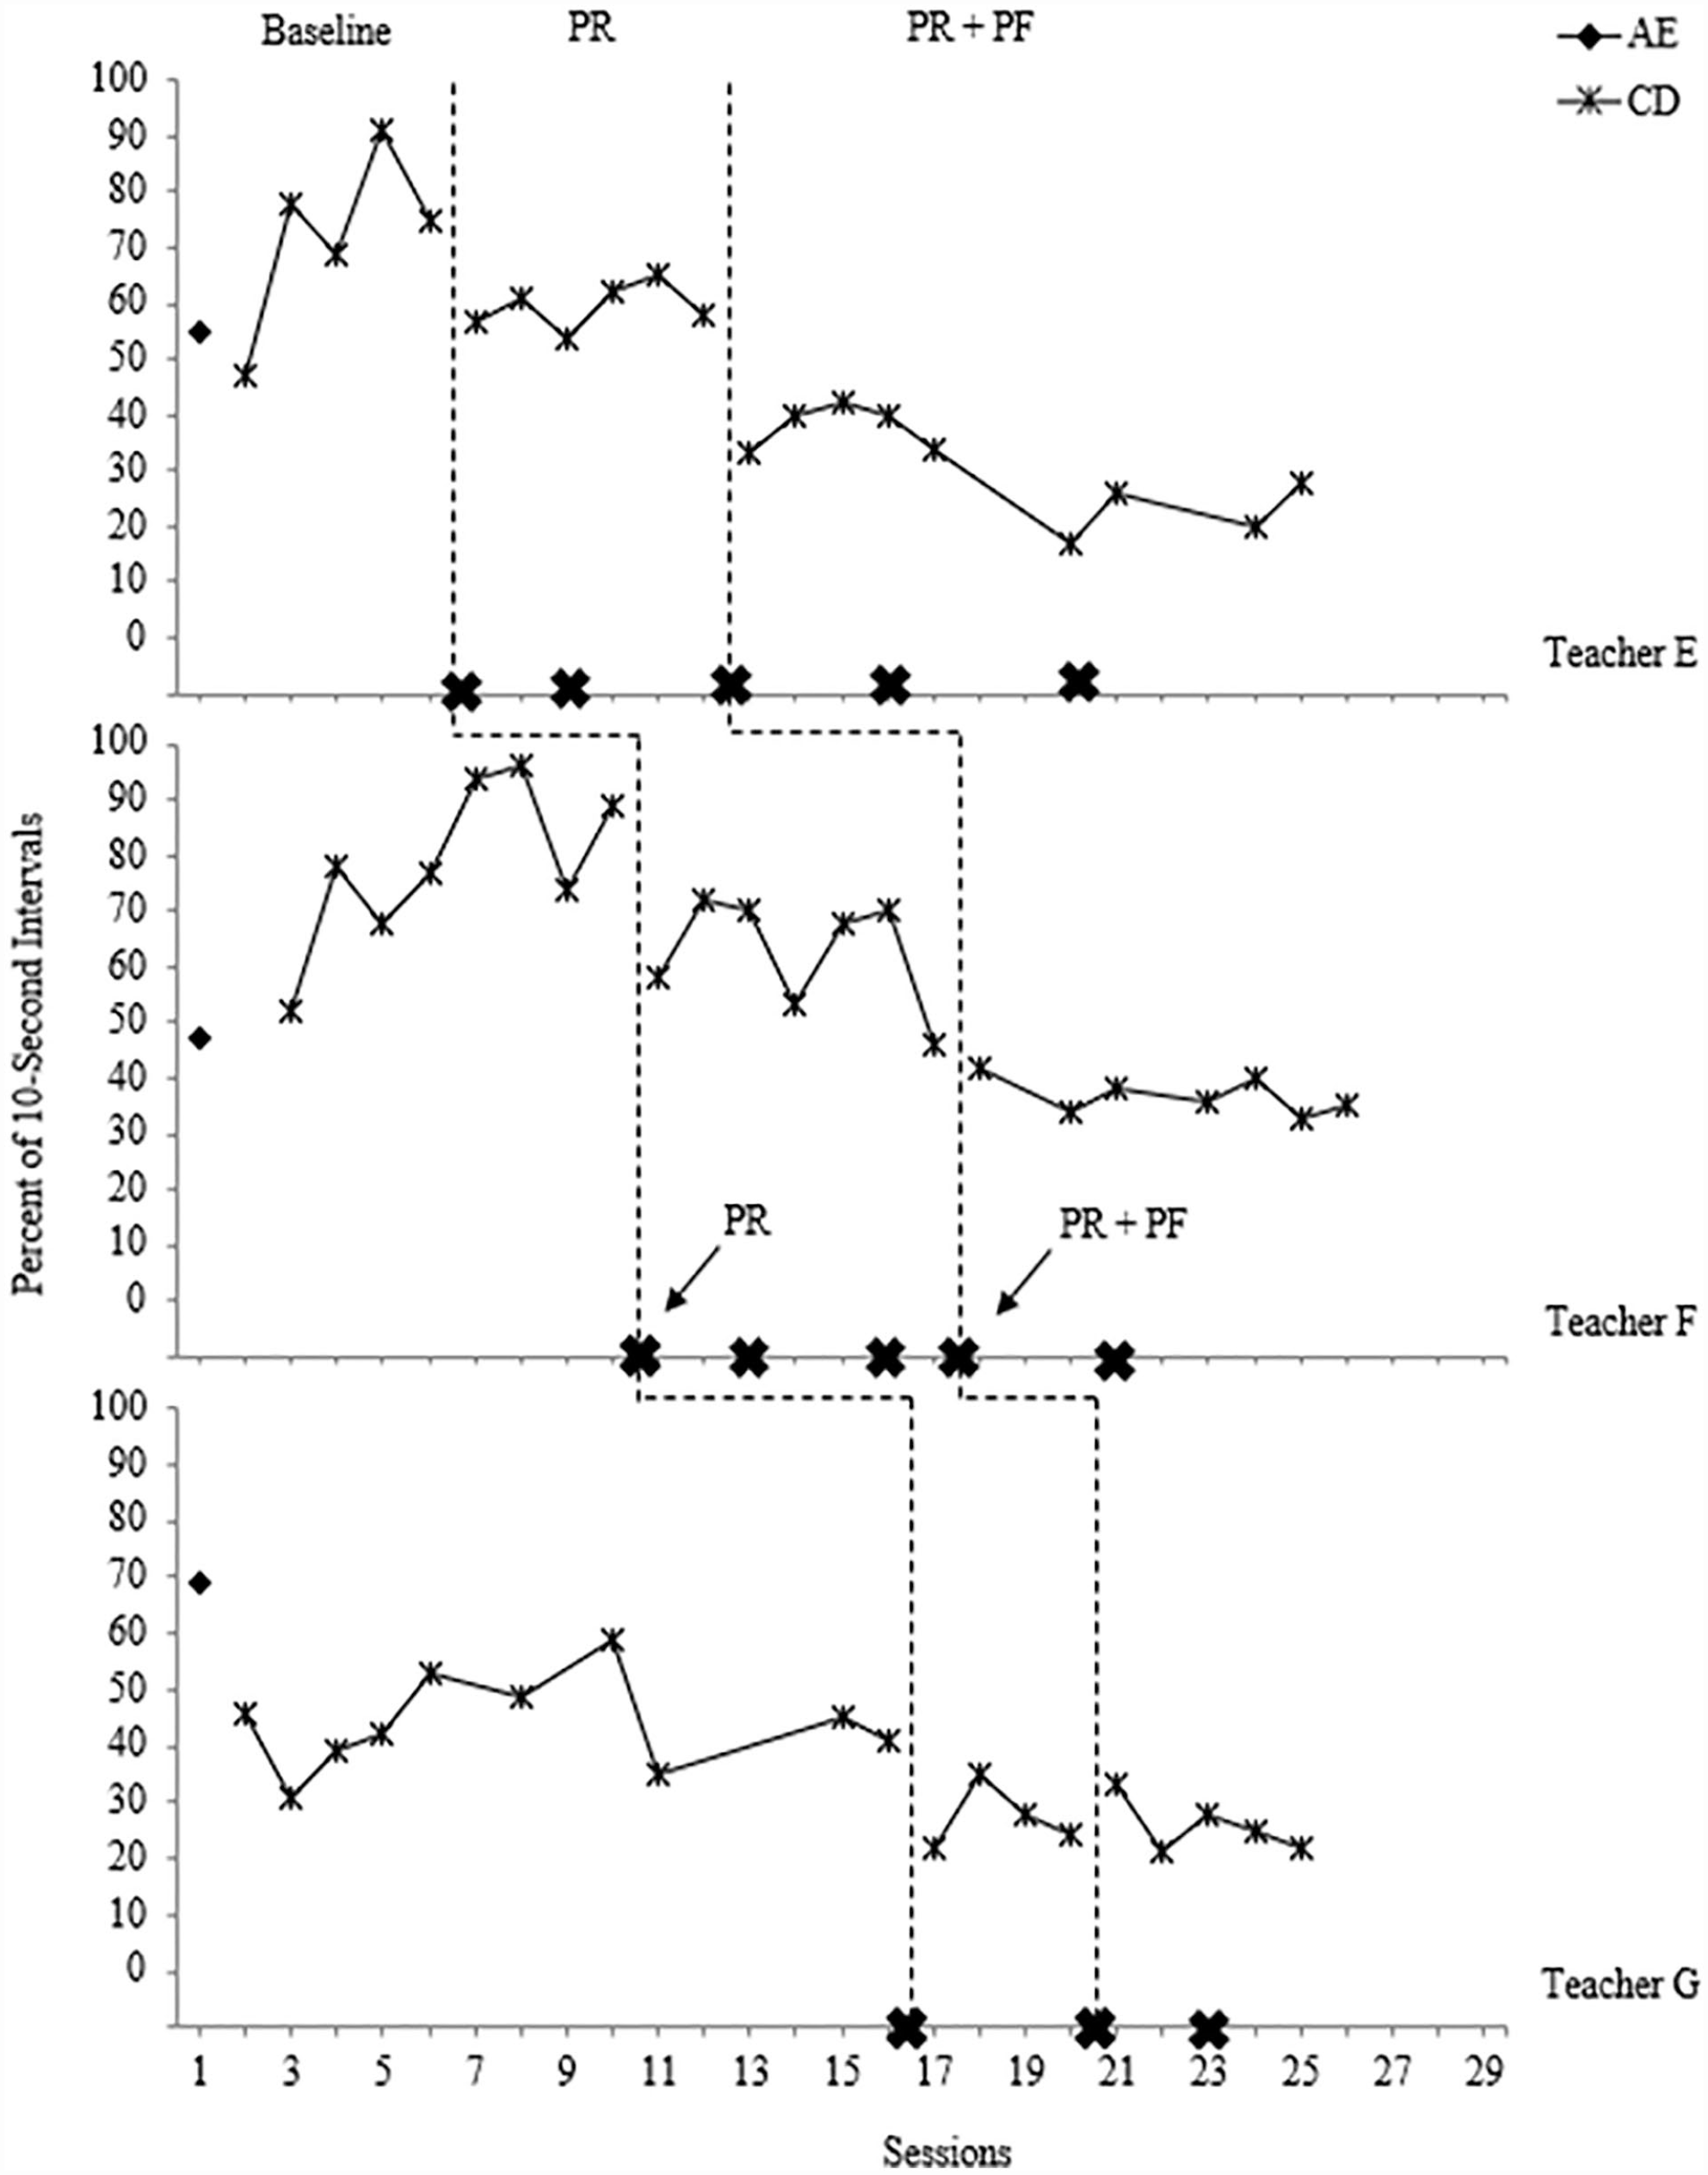
Percentage of intervals with classroom disruption for Study 2.
Summary of Tau-U Estimates Comparing (a) BL With Initial Coaching Component and (b) Initial Coaching Component With Combined Coaching Components Across Studies 1 and 2.
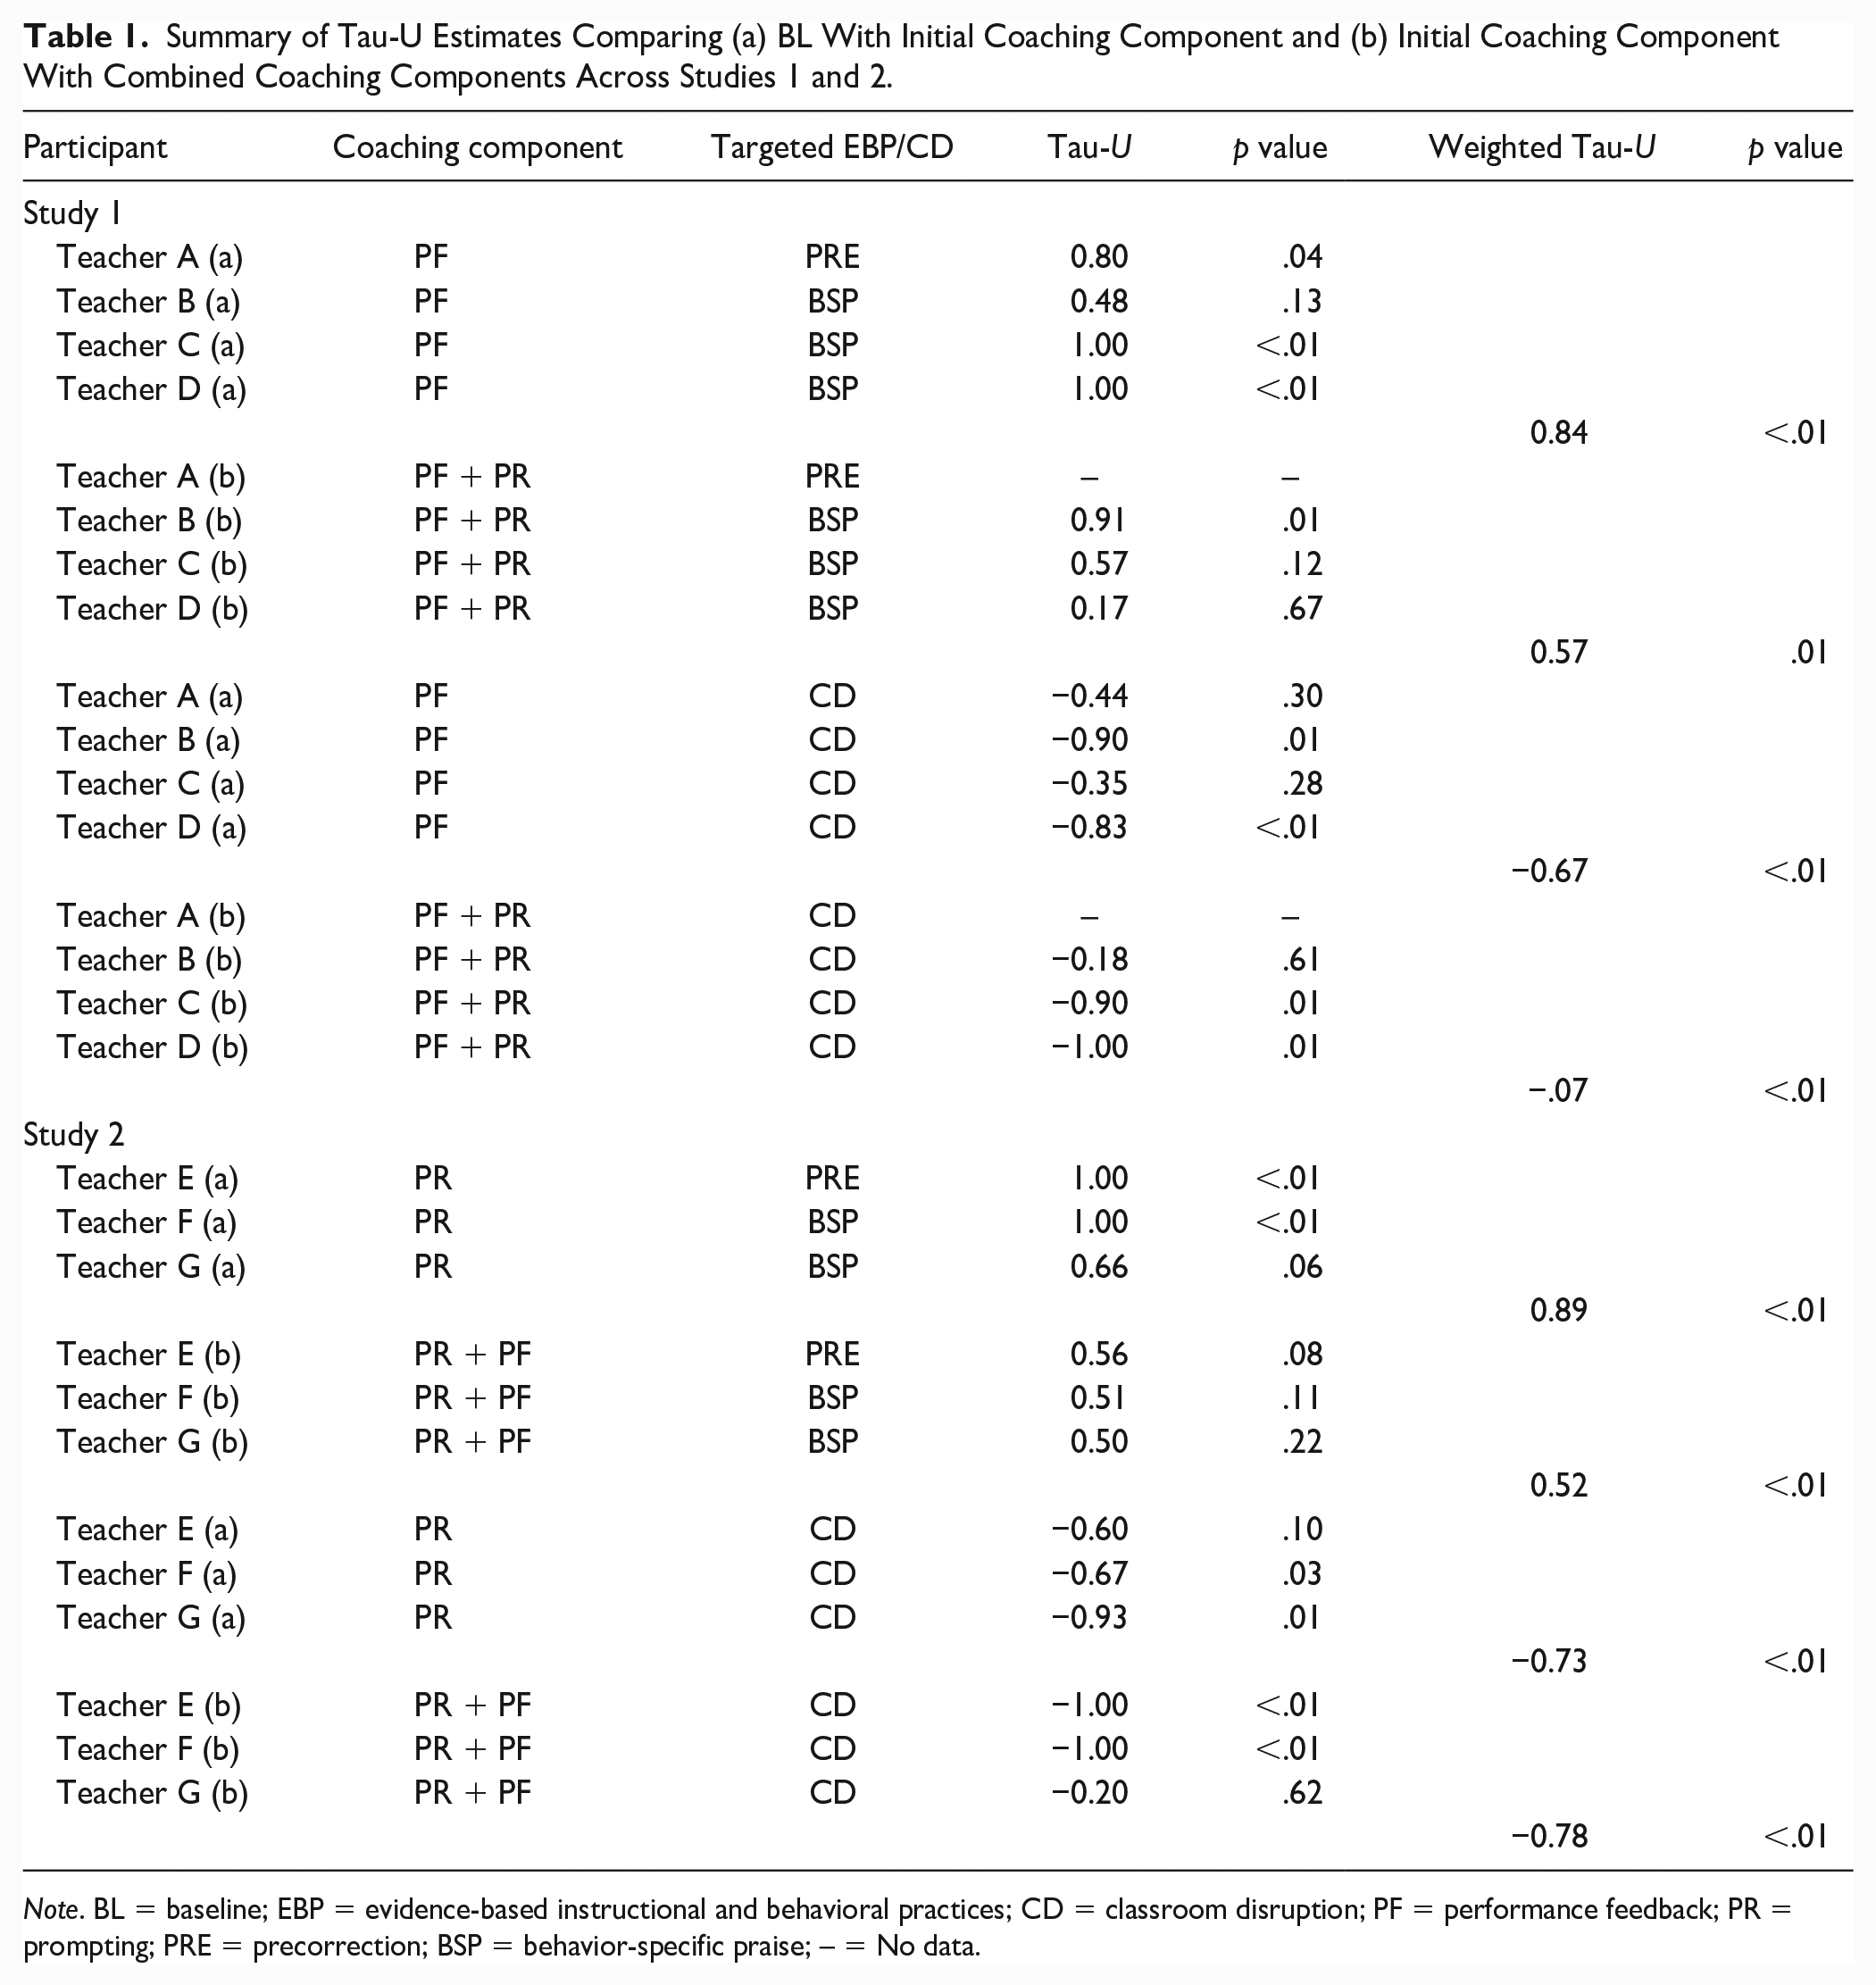
Note. BL = baseline; EBP = evidence-based instructional and behavioral practices; CD = classroom disruption; PF = performance feedback; PR = prompting; PRE = precorrection; BSP = behavior-specific praise; – = No data.
Study 1
Effect of coaching on teacher use of classroom evidence-based practices: Performance feedback first
Study 1 assessed the effects of coach-delivered performance feedback on teacher use of targeted EBPs, and additional effects associated with combining PF with PR during coaching sessions. The targeted EBPs per teacher are summarized in Table 1.
Baseline levels for targeted and nontargeted EBP use for all four teachers documented stable patterns with minimal trend. Following introduction of weekly coaching sessions, there were three patterns. Teacher A was called for jury duty after 3 days in the coaching with PF phase. Data for these 3 days indicated modest increases in level (though this increase was foreshadowed in the last 2 days of BL), and no substantive change in trend or variability for either the targeted EBP (PRE: BL M = 1.8%, PF M = 4.7%) or the nontargeted EBP (OTR: BL M = 18%, PF M = 22%).
Teacher B demonstrated an increase in use of the targeted EBP following introduction of coaching (BSP: BL M = 4.2%, PF M = 9.6%), but only after the second coaching session. The nontargeted EBP remained unchanged during the coaching with PF phase for Teacher B (PRE: BL M = 2.1%, PF M = 0.6%).
Teachers C and D maintained stable BLs when coaching was introduced with Teachers A and B, but when Teachers C and D each received access to coaching with PF, there was an immediate-level increase in the their use of the targeted EBP (Teacher C BSP: BL M = 2.1%, PF M = 17%; Teacher D BSP: BL M = 4.9%, PF M = 24.5%) and unchanged level, trend, and variability in their nontargeted EBP (Teacher C PRE: BL M = 0.7%, PF M = 0.2%; Teacher D OTR: BL M = 42.7%, PF M = 44.2%). Taken together, data from BL and coaching with PF phases for Teachers B–D provided three demonstrations of improvement in targeted EBPs’ use when coaching was introduced, and no improvement in the uncoached EBPs.
In the final phase of Study 1, Coach A combined coaching using PF with PR for Teachers B–D. Teacher B demonstrated a mean phase increase in the coached EBP (BSP: PF + PR M = 22.1%) during the final phase, but the level in PF + PR matched the last two observations in the PF phase. There was no improvement in the uncoached EBP (PRE: M = 0.9%). Teacher C maintained but did not improve use of the coached EBP with the combined coaching procedures (BSP: M = 19.3%). The uncoached EBP remained at near-zero BL levels (PRE: M = 0.2%). Teacher D similarly maintained (but did not increase) improved rates for the coached EBP (BSP: M = 26.3%) and continued near-zero levels for the uncoached EBP (OTR: M = 43.5%). Taken together, the data during the combined PF with PR phase did not support a functional improvement over providing PF coaching alone.
Classroom disruption
Figure 2 provides a summary of Study 1 results for classroom disruptive behaviors. Resulting BL rates for classroom disruption ranged from an average of 44% – 59% across Teachers A–D. The BL data document moderate variability with stable trends for Teachers A, B and D, and moderate variability with a modest decreasing trend for Teacher C.
Following introduction of the coaching with PF phase, students for each of the four teachers demonstrated reduction in the mean rate of classroom disruption. Classroom disruption for Teacher A shifted from a BL mean level of 56.2% to 40.7% for the 3 days in the coaching with PF phase. Teacher B’s class documented a reduction in classroom disruption in BL (M = 59%) compared with the coaching with PF phase (M = 40.8%) with a substantial reduction in variability across the five sessions of PF. Classroom disruption for Teacher C’s class averaged 48.4% with a slight decreasing trend in BL and 42.0% during the PF phase. The downward trend in BL data, however, was consistent with the continuing pattern of classroom disruption reduction observed during the coaching with PF phase. Teacher D’s class averaged a stable classroom disruption rate of 44.4% during BL with a decrease to 27.3% during the coaching with PF phase. Classroom disruption levels in the combined PR plus PF condition maintained below BL levels for Teachers B, C, and D (41.5%, 24.5%, and 25.8%, respectively). In each case, however, the level of classroom disruption during the combined phase was consistent with trends and levels observed when coaching only involved PF.
As shown in Table 1, Tau-U estimates were calculated comparing teacher use of target EBPs in (a) BL to the PF phase, (b) PF phase to the combined PF and PR phase, (c) BL to the PF phase for classroom disruption, and (d) PF phase to the combined PF and prompting phase for classroom disruption. Individual Tau-U estimates were calculated for each teacher, as well as an overall weighted average across teachers for each outcome variable. When comparing data from the BL with PF phase, there was a statistically significant effect for teacher use of the target EBP for Teachers A (Tau-U = 0.80, p = .04), C (Tau-U = 1.00, p = <.01), and D (Tau-U = 1.00, p = <.01). The Tau-U estimate was statistically significant for Teacher A and not for Teacher B, and these results are in contrast with visual analysis. For example, there was no substantive change in trend or variability observed for Teacher A after receiving the two coaching sessions; however, there was an increase in level after the second coaching session for Teacher B. When comparing data from the PF phase with the combined PF and PR phase, there was only a significant effect for Teacher B (Tau-U = 0.91, p = .01).
When comparing data from BL with data from the PF phase for classroom disruption, there was a significant effect for Teachers B (Tau-U = −0.90, p = .01) and C (Tau-U = −0.83, p = <.01). When comparing the PF phase with the combined PF plus PR phase for classroom disruption, there was a significant effect for Teachers C (Tau-U = −0.90, p = .01) and D (Tau-U = −1.00, p = .01). Overall weighted averages were significant across all four comparisons (Tau-Us = −0.07 to 0.84).
Study 2
Teacher use of classroom evidence-based practices
Study 2 replicated Study 1 but the initial intervention involved coaching via PR rather than PF. Results for implementation of the selected and nontargeted EBPs for Teachers E (PRE), F (BSP), and G (BSP) are presented in Figure 3. Inspection of the BL data for the coached EBPs for Teachers E, F, and G documented a consistent pattern of near-zero levels of use. Increases in use of the targeted EBPs were observed for all three teachers following implementation of the first coaching session using prompts and maintained without major alteration when the PR plus PF procedures were implemented. Teacher E improved use of PRE from an average of 2.2% in BL to a mean of 20.8% in the coaching via prompting phase and maintained this level with slight increasing trend in the combined prompting plus PF phase to an average of 27.2% over the last nine sessions of the study. Teacher F demonstrated a BL level of 0.6% intervals using BSP. This stable pattern increased to an average of 10% during the PR phase and maintained with a slight increase to average 11.9% over the final PR plus PF phase. Teacher G also had BSP as her targeted EBP and demonstrated a modest BL level of 2.4%. When Teacher G received coaching prompts, her level of BSP use increased to an average of 7.3% and this level improved to a mean of 12.4% across the PR plus PF phase.
Results for targeted EBPs were compared with results for nontargeted EBPs. Figure 3 provides data on the nontargeted EBP of OTR for Teachers E and F, and PRE for Teacher G across the three phases. The nontargeted EBPs were performed at moderate-to-low rates, and there was no consistent change in level, trend, or variability across the BL, PR alone, and PR plus PF phases. Teacher E averaged 19.3% intervals with nontargeted OTRs in BL, 22.3% in the prompting phase, and 18.3% in the PR plus PF phase. Teacher F implemented nontargeted OTRs at an average of 12.4% during BL, 8.6% during the PR phase, and 13.6% during the PR plus PF phase. Teacher G implemented nontargeted PRE at an average of 6.8% in BL, 7.0% in the PR phase, and 3.6% in the PR plus PF phase.
Classroom disruption
Figure 4 depicts the results for classroom disruption for Teachers E–G. Students in Teacher E’s classroom engaged in classroom disruption an average of 72% of observation intervals in BL. This average reduced to 59.5% during the PR phase, and 31.3% during the PR plus PF phase. For Teacher F, student classroom disruption averaged 78.5% in BL, a mean of 62.4% during the PR phase, and a mean of 36.9% during the combined PR plus PF phase. The students in Teacher G’s classroom engaged in classroom disruption an average of 44% during BL, an average of 27.3% during the PR phase, and an average of 25.8% during the PR plus PF phase.
Like Study 1, Tau-U estimates were calculated across dependent variables (Table 1). Comparing BL with the PR phase, significant effects were found for Teachers E (Tau-U = 1.00, p = <.01) and F (Tau-U = 1.00, p = <.01). Comparing PR with the combined PR plus PF phase, there were no significant effects across teachers. Comparing BL with the PR phase for classroom disruption, there were significant effects for Teachers F (Tau-U = −0.67, p = .03) and G (Tau-U = −0.93, p = .01). Last, comparing PR with the combined PR plus PF phase for classroom disruption, significant effects were found for Teachers E (Tau-U = −1.00, p = <.01) and F (Tau-U = −1.00, p = <.01). Overall weighted averages across teachers were significant for the four comparison conditions (Tau-Us = −0.78 to 0.89).
Social Validity for Studies 1 and 2
Following completion of Studies 1 and 2, five of the seven teachers completed the 6-item social validity coaching survey (1 = strongly disagree and 5 = strongly agree). Overall, teachers indicated that (a) it had been relatively easy to receive the coaching intervention (e.g., amount of time and effort; M = 4.80, range = 4–5); (b) had noticed positive differences in their class-wide behavior management practices since receiving the coaching intervention (M = 4.40, range = 4–5); (c) had noticed positive differences in student behavior since receiving the coaching intervention (M = 4.40, range = 4–5); (d) overall, perceived their teaching practices to have benefited from receiving the coaching intervention (M = 4.40, range = 4–5); (e) would have liked to continue to receive coaching in this manner (M = 4.00, range = 3–5); and (f) did not believe that the coaching intervention process required more time and effort than it was worth (M = 1.60, range = 1–3).
Discussion
Study 1 results document, with reservation, that coaching through PF was functionally related to improved rates in the use of targeted EBPs and was not associated with change in uncoached EBPs. Teachers B, C, and D provide three demonstrations of effect. The strength of the effect is compromised, however, by the loss of Teacher A to jury duty, and a delay in improvement during the PF phase for Teacher B. The combined PF plus PR phase was associated with sustained gains for Teachers B–D, but not consistent improvement over the coaching with PF alone phase. There was a reduction of classroom disruption when teachers increased their use of the targeted EBPs but decreasing trends in the BL data for students in classrooms of Teachers A and C prevent documentation of three demonstrations of basic effect, and hence limits demonstration of a functional relation (Horner et al., 2005).
Data from Study 2 demonstrate a modest functional relation between introduction of coaching via prompting and improvement in targeted EBPs. Each of the three teachers in Study 2 improved their use of targeted EBPs after receiving coached prompts and documented no improvement in their noncoached EBPs. When coaching combined PR and PF, effects on targeted EBPs maintained but did not improve appreciably. The combined PR plus PF phase documented no improvement in the nontargeted EBPs over either BL or the coaching with PF alone phase.
Study 2 results for student behavior document a functional relation between introduction of the initial coaching via prompting phase and reduction in classroom disruption. In each of three introductions of coaching, there was a reduction in the trend and/or level of disruption. The combination of PR and PF coaching was not found superior to prompting alone due largely to the trend in the PR phase for Teacher F and the absence of level change for Teacher G. It is worth noting, however, that a comparison of classroom disruption data in BL with levels of disruption in the combined PR plus PF phase documented substantive improvements in all three classrooms participating in Study 2.
The addition of Tau-U analyses supported the complexity of interpretation. Effects throughout the study were moderate to small, and in some cases, basic effects that appear valid through visual analysis were not found statistically significant through Tau-U estimates. Taken together, the results cautiously support the argument that brief coaching efforts employing either PR or PF are effective approaches for improving teacher use of classroom EBPs, and that effective use of classroom EBPs is related to improvement in student behavior. Results are encouraging given the modest intensity of the coaching support provided in these two studies.
To determine the functions of effective coaching, this study focused on a universal approach to coaching; however, it is recognized that each classroom and teacher requires different levels of support intensity (Freeman et al., 2017). Coaches are encouraged to consider the level of coaching support necessary to meet the needs of individual teachers, and to adjust coaching support to meet changing needs over time (e.g., reduce coaching as a teacher becomes fluent using a skill). Finally, Teacher B, who did not immediately respond to coaching, demonstrated behavior change after the second coaching episode. This result may encourage school-based professionals to consider planning for at least two coaching sessions after training.
Limitations
There are several limitations worth noting. First, the delivery of coaching via PF was not provided to every participant on the same schedule. Although all teachers received coaching once per week, some teachers received coaching via PF with a longer delay between coaching and the next observation. Ideally, all teachers would have had PF delivered immediately after an observation. Due to scheduling constraints, feedback was delivered within a range (within at least one school day following an observation, but not always on the same day as the observation and no more than two school days before the next observation). Narrowing the range of time between both observing and providing feedback may influence the strength of effect.
Another limitation was the introduction of the coaching intervention before five data points for Teacher G in Study 2. Intervention was introduced due to scheduling constraints and lack of time for data collection. Because PR with PF began after four data points, it is unclear whether teacher use of BSP increased in the second intervention phase because another coaching session was needed or because the effects of PR with PF were more effective for her. Without sufficient data to establish a data trend in the prompting phase, it cannot be determined whether she would have responded to prompting only compared with PR with PF.
An additional limitation could include the selection of PRE as one of the classroom EBPs of interest in this study. Although PRE is important for classroom management, it is possible that teachers had fewer opportunities to use PRE during instruction compared with OTR or BSP. Therefore, there may have been ceiling effects for demonstrating improvements for this EPB after coaching compared with the other two EBPs.
Consistency in classroom schedules and procedures, coupled with high rates of opportunity for teachers to use each EBP, regularly made partial interval recording feasible. However, because some EBPs could be used with higher frequencies (e.g., rates of BSP vs. PRE), it may have been more helpful to capture these rates using another type of data collection method (e.g., event recording).
Teachers also self-selected to participate and therefore selection bias is another possible confound and limits generalization. Teachers who self-select to receive coaching may be more likely to respond to coaching or respond in a differential manner from teachers who do not want coaching. Finally, the decision to use a secondary variable that measured disruptive classroom behaviors across students may not be the best representation of the actual classroom environment. For example, classroom disruptive behaviors were recorded any time one or more students engaged in one of the three classroom disruptive behaviors (i.e., out of seat, peer-to-peer disruption, and classroom interruption). Therefore, one or two students could be skewing the data.
Future Directions
There are many research questions to guide future coaching research. Three specific lines of research from the present results include (a) manipulating the content, level of precision, timing, and/or communication form of coaching; (b) examining the effects of different coaching practices used independently or combined; and (c) establishing a measure of coaching that assesses which coaching components were delivered. First, similar studies could be employed to examine variations to coaching, the impact of these modifications on coaching effectiveness, and for whom different variations are effective. Studies could examine the extent to which PR or PF are more effective for different types of teachers with differentiated needs (e.g., Is prompting with PF more or less effective than prompting or PF alone for teachers with high vs. low levels of support needs?). Researchers could compare coaching interventions in which coaches provide global feedback versus specific feedback (e.g., Is specific feedback more effective at producing desired behavior change than global feedback?). Studies may modify timing to determine the ideal scheduling of PR and PF delivery.
Next, research is needed to identify the effects of a full complement of coaching functions. It is possible that in the current study PR and PF remained separate and effective functions of coaching but separating the two functions may be arbitrary. Results suggest that both functions were influencing teacher behavior, even when the coach only delivered PR or PF. A reasonable hypothesis is that prompts may simultaneously function as discriminative stimuli for behavior on one day and feedback for behavior on a previous day, and analogously, instances of PF for one day may provide functional feedback yet also serve as a prompt for implementation on the next day. In addition, research could examine the other functions of coaching described in the coaching logic model in this study. Namely, researchers could assess the effects of fluency-building opportunities and adaptation on valued teacher and student outcomes. Guiding research questions in this area of study may include (a) is there a functional relation between coach-facilitated fluency-building opportunities and an increase in teacher use of classroom EBPs and (b) how can coaches support adaptation and is adaptation related to higher levels of contextual fit and increased likelihood of durable implementation?
Finally, measures of coaching used in future research are encouraged to document not just if any coaching occurred, but the specific coaching practices and functions employed.
Conclusion
This study provides modest evidence that (a) coaching is effective, (b) coach-delivered PR and PF are related to an increase in teacher use of classroom EBPs, and (c) when teachers increased their use of coached EBPs, classroom disruption decreases. These results are cautiously encouraging, particularly because of the change in teacher behavior was observed after the delivery of relatively low-intensity and low-dosage coaching. Findings from this study may suggest a more nuanced understanding of the active ingredients of successful coaching. The results contribute to the understanding of ways that effective coaching can be researched, measured, and implemented in K–12 educational settings.
Footnotes
Declaration of Conflicting Interests
The author(s) declared no potential conflicts of interest with respect to the research, authorship, and/or publication of this article.
Funding
Development of this paper was supported by the Office of Special Education Programs U.S. Department of Education (H326S980003 and H326K120005). Opinions expressed herein are those of the authors and do not necessarily reflect the position of the U.S. Department of Education, and such endorsements should not be inferred.