
Abstract
Teacher-directed self-monitoring (TD-SM) is often recommended to special education teachers as a simple and efficient method for improving the implementation fidelity of evidence-based practices in the classroom and strengthening outcomes for students. This systematic review and outcomes analysis investigated the conditions and intervention packages under which TD-SM can be effective at improving implementation fidelity as well as the associated effects of TD-SM on student outcomes targeted by the practices monitored for fidelity. Results indicate TD-SM demonstrated generally positive outcomes when used to improve the fidelity of instructional methods with varying intervention packages. Gains in instructional method implementation fidelity sometimes resulted in gains in student outcomes. The use of TD-SM to improve the fidelity of behavioral interventions resulted in varied fidelity and student outcomes, despite the use of consistent intervention packages. Implications for future research and practical use of TD-SM are discussed.
Special education teachers seeking positive outcomes for their students are directed to select an evidence-based practice (EBP) that meets unique student learning needs and to carefully implement the selected practice with fidelity (Cook & Odom, 2013; Spencer et al., 2012). Implementation fidelity, or the extent to which teachers carry out interventions as directed by research-tested protocols, is the critical link between EBPs and positive student outcomes (Collier-Meek et al., 2013). Despite the suggested positive influence of implementation fidelity on student outcomes, accomplishing strong fidelity in practice can be difficult. Implementation fidelity can be impacted by a variety of variables including implementation climate, stress, and lack of resources (e.g., Larson et al., 2018; Robertson et al., 2020). These challenges have been found to translate into persistently low implementation fidelity in practice (Locke et al., 2019; Suhrheinrich et al., 2020) and suggest a need for a simple and effective strategy to support teachers to improve the fidelity of intervention implementation. While many methods have been evaluated to improve implementation fidelity (Noell et al., 2014), self-monitoring is routinely suggested to in-service special education teachers as a simple and effective method for enhancing the implementation of EBPs (Collier-Meek et al., 2013; Myers et al., 2017; Sanetti & Luh, 2020). Given the popularity of these recommendations and the critical role of implementation fidelity, an exploration into the effectiveness of self-monitoring to improve EBP implementation is warranted.
Self-Monitoring Interventions
Self-monitoring is a popular and versatile intervention, described as the observation of one’s own behavior, combined with the act of recording the occurrence of the behavior (Browder & Shapiro, 1985; Cooper et al., 2020). This intervention is unique as it positions the recipient of the intervention as the intervention agent to monitor and change their own behavior (Cooper et al., 2020). Furthermore, self-monitoring is part of a broader class of interventions, self-management, where the individual receiving the intervention acts as the agent of behavior change (Cooper et al., 2020). Other components of self-management interventions are often paired with self-monitoring, including goal setting (i.e., setting a standard for the monitored behavior), self-evaluation or assessment (i.e., comparing behavior to a set standard), self-instruction (i.e., use of sequential visual or audio cues to prompt a specific behavior or task), and self-reinforcement (i.e., accessing a known reinforcer contingent upon the presence of behavior or previously determined standard; Browder & Shapiro, 1985; Cooper et al., 2020).
In education research, self-monitoring is more commonly investigated as a student-directed intervention (i.e., used to teach students to monitor and change their own behavior; Briesch et al., 2019). Teacher-directed self-monitoring (TD-SM) focuses on teachers monitoring their own behavior with the goal of improving their teaching practice (e.g., Pinkelman & Horner, 2017). The research supporting the use of TD-SM to encourage the frequent and effective use of EBPs has been examined in a systematic review of 17 studies of TD-SM for behavioral practices to synthesize study characteristics and effects of TD-SM on teacher and student outcomes (Rispoli et al., 2017). The synthesis results found that TD-SM demonstrates largely positive effects; however, the quality of the included studies indicated a need for increased methodological rigor in future research, and the majority of identified studies examined the use of TD-SM to increase the frequent use of an intervention (Rispoli et al., 2017). As only six of 17 included studies applied TD-SM to improve implementation fidelity, this review provides limited insight into the effectiveness of TD-SM to target implementation fidelity as commonly recommended in practical guidance.
Implementation Fidelity
Implementation fidelity describes the steps a teacher takes to implement an intervention and is expected to have direct implications on student performance (Collier-Meek et al., 2013). Adherence to implementation steps is also called treatment fidelity, adherence, or integrity (Sanetti et al., 2021), or intervention fidelity or integrity (King-Sears et al., 2018). These terms are used to distinguish implementation fidelity from methodological rigor measurements of fidelity (i.e., procedural fidelity) that measures the extent to which independent and control variables are implemented as planned under research conditions (Ledford & Gast, 2018). Fidelity rigor measurement supports confidence in attributions of the effects of an intervention to intervention implementation under research conditions (Ledford & Gast, 2018; Sanetti et al., 2021). In contrast, implementation fidelity measures the practical implementation of an intervention, bridging the gap between research and practice (Brock et al., 2017; Noell et al., 2014; Sanetti et al., 2021). Implementation fidelity can be measured across multiple dimensions, such as adherence to treatment protocols (e.g., an accounting of intervention steps/components to ensure a sufficient number are completed or completed in sequence), or measurement of implementation quality (e.g., individual steps or components can be measured for their accuracy using a scale or rubric; Sanetti et al., 2021).
While implementation fidelity is routinely cited as a critical component of successful intervention implementation (Cook & Odom, 2013; Spencer et al., 2012), practical implementation of EBPs often falls below thresholds considered adequate to achieve positive effects (Zhang et al., 2022). One study of implementation fidelity found teachers implemented less than 60% of the prescribed intervention components when implementing EBPs for students with autism (Stahmer et al., 2015). Similarly, a study of the implementation fidelity of a social engagement intervention found implementers routinely implemented zero to four of the seven total steps, and no implementers achieved adequate implementation fidelity during implementation (Locke et al., 2019). The persistent challenge of implementation fidelity has led to calls for further investigation into the factors and strategies to improve implementation fidelity and ensure the effectiveness of EBPs is achieved (Zhang et al., 2022).
Implementation fidelity interventions, including self-monitoring, have been synthesized for review in two recent publications (Brock et al., 2017; Noell et al., 2014). Brock et al. (2017) examined teacher training strategies as a method to improve the implementation of EBPs and found several training strategies associated with improved implementation of EBPs. While TD-SM was included in this review, parametric analysis did not indicate a positive association with improved implementation, and the authors noted most self-monitoring studies focused on the increased frequency of implementation instead of implementation fidelity (Brock et al., 2017). Noell et al. (2014) synthesized implementation fidelity studies and found the best results were obtained when multiple strategies were used together (e.g., coaching and TD-SM). Furthermore, the authors noted TD-SM appeared to produce positive outcomes, but the small number of studies (three of 29) using TD-SM limited the interpretability of the variable outcomes (Noell et al., 2014). Brock et al. (2017) and Noell et al. (2014) collectively suggest implementation fidelity may be improved through the use of teacher-directed strategies, a finding consistent with Rispoli et al. (2017). However, it is unclear, from the small number of studies employing TD-SM to improve implement fidelity included in these previous reviews, if TD-SM is likely to improve fidelity as it is popularly recommended to teachers (Collier-Meek et al., 2013; King-Sears et al., 2018; Myers et al., 2017; Sanetti & Luh, 2020). Further examination of the TD-SM evidence base would be beneficial to determine (a) for whom, in what settings and conditions, and with which intervention packages TD-SM has been investigated and (b) the effect of TD-SM on educator implementation fidelity and student outcomes.
Study Purpose
The present review is an investigation of the use of TD-SM interventions to improve educator implementation fidelity for academic and behavioral interventions. We examined participants, settings, conditions, and intervention packages. Outcomes analyses were used to estimate the effects of TD-SMs on implementation fidelity and student outcomes. We planned a meta-analysis but did not conduct it due to an insufficient number of designs. Research questions guiding the review were the following:
Method
Systematic Search and Inclusion Criteria
Four strategies were employed to identify eligible studies: (a) electronic database search, (b) hand search, (c) ancestral search, and (d) forward citation search. A Preferred Reporting Items for Systematic Reviews (PRISMA) diagram (Page et al., 2021) detailing the systematic search process can be found in Supplemental Materials found on Open Science Framework (OSF; “PRISMA Diagram”; https://tinyurl.com/2xjsancv). All studies were evaluated for the following inclusion criteria: (a) use of an experimental single case design (b) conducted in a school setting, (c) included TD-SM as a discrete independent variable, and (d) included implementation fidelity as a dependent variable. For the purpose of this review, “teacher” was defined as any adult with an instructional role in the classroom inclusive of general or special education teachers, co-teachers, teachers working in specialized class settings, student teachers, paraprofessionals, and related service providers. “Self-monitoring” was defined as a teacher observing their own behavior and recording the occurrence of targeted behavior. To best reflect the current literature base, recording of behavior could be reported to occur in real time, reflectively within the same school day or retrospectively through a video recording. Studies describing procedures consistent with the self-monitoring definition as “self-management” or “self-evaluation” were included if the procedure included observation and recording of a target behavior. Studies reporting the use of TD-SM implemented with supplemental interventions (e.g., coaching, performance feedback) were included if TD-SM was applied as an independent variable immediately following the baseline condition. Studies that were conducted outside of school settings (e.g., home, community, and after-school programs), that applied a group design methodology, or that taught students to conduct self-monitoring were excluded. Experimental single-case designs were defined as those including three demonstrations of effect found within adjacent conditions (Ledford & Gast, 2018). To allow for a larger body of literature, studies using non-experimental single-case designs and including TD-SM dependent variables other than implementation fidelity were retained at the title and abstract screening stage and thoroughly screened at the full-text stage (Ledford et al., 2020). Dissertations or unpublished studies (i.e., gray literature) were included in the search procedures to reduce the likelihood of publication bias. This review included only primary studies of TD-SM. As such, research syntheses (e.g., systematic reviews and meta-analyses), books, practitioner papers without an experimental design, or non-peer-reviewed primary studies were excluded from the systematic search.
To identify potential studies for analysis, electronic database searches were conducted in July 2020 using ERIC, PsycINFO, Academic Search Complete, Professional Development Collection, Psychology and Behavioral Sciences Collection, and ProQuest Dissertations & Theses Global utilizing the following search string: “(teacher OR educator OR therapist* OR practitioner OR assistant or paraprofessional* OR paraeducator*) AND (self-manag* OR self-evaluat* OR self-monitor*) AND (teacher training) AND (classroom management OR intervention OR academic OR behavioral strateg*).” Results were limited to English-language publications. Inclusion criteria were first applied to titles and abstracts and then full-text manuscripts (i.e., studies) following PRISMA guidelines for a systematic search (Page et al., 2021). The database search yielded 33 records published in the last 40 years.
The coders next conducted a hand search of journals likely to publish studies on this topic: Behavioral Interventions, Education and Treatment of Children, Education and Training in Developmental Disabilities, European Journal of Teacher Education, Global Education Review, Journal of Applied Behavior Analysis, Journal of Early Intervention, Journal of Positive Behavior Interventions, Psychology in the Schools, Rural Special Education, Teaching and Teacher Education, The Elementary School Journal, and Topics in Early Childhood Special Education. Six additional studies were located by hand search. Next, an ancestral search of the reference lists of the studies located by the database and hand searches, as well as a recent systematic review (i.e., Rispoli et al., 2017), was conducted and yielded nine more studies. Finally, a forward search of the studies located by the database, hand, and ancestral searches was conducted using Web of Science and Google Scholar. These efforts located nine additional studies resulting in a total of 57 studies for full-text screening.
Finally, the full text of 57 studies was screened against the inclusion criteria, including a review of single-case design procedures and graphs to detect the presence of three potential demonstrations of effect between adjacent conditions. A total of 47 studies were excluded from the review: four studies were excluded for use of non-experimental single-case designs, three studies for non-school settings, and four studies for TD-SM independent variables that could not be isolated from supplemental interventions. In addition, 36 studies were found to include a non-implementation fidelity-dependent variable and were excluded from the present review but retained for separate review and meta-analysis. A detailed list of excluded studies can be found on OSF (“Full Text Excluded Studies”; https://tinyurl.com/2xjsancv). The systematic search process identified 10 TD-SM implementation fidelity studies for inclusion.
Descriptive Analysis
The following characteristics of the included studies were coded and analyzed at the study level: (a) information about for whom and in which settings and conditions TD-SM was investigated (e.g., teacher demographics and experience, student demographics, setting and self-monitoring supplemental interventions, and dependent variables); (b) intervention packages (e.g., self-monitoring, other self-management interventions, recording methods, and training components); and (c) study rigor and quality information (e.g., research design, reliability, generalization, and maintenance). A comprehensive coding manual including definitions and coding rules for all descriptive variables can be found on OSF (“Coding Rules”; https://tinyurl.com/2xjsancv). Variables were coded according to the author report and were coded as “not reported” if the information was not included in the study, with the exception of self-management components that were coded by comparing intervention procedure descriptions to author definitions (“Coding Rules” p. 4; https://tinyurl.com/2xjsancv). If authors reported a numerical range or minimum/ maximum numbers (e.g., range of ages or minimum years of experience), the information was coded as reported but excluded from further descriptive analysis calculation (e.g., average years of teacher experience). Disagreements were discussed between primary coders and the second author until consensus.
Quality and Rigor Analysis
The Single Case Analysis and Review Framework 2.0 (SCARF; Ledford et al., 2020) was used to assess the methodological quality and rigor of each design and associated outcomes. The SCARF provides a robust assessment of study rigor by applying a weighted coding scheme to 46 variables across seven quality/rigor domains (reliability, fidelity, data sufficiency, social and ecological validity, participant descriptions, condition descriptions, generalization measurement, and maintenance measurement) and three outcome domains (primary, generalization, and maintenance). These 46 variables are coded in yes/no format, for each single-case experimental design present within a study. The coded results were auto-calculated into final rigor/quality and outcome scores (range 0–4) and plotted using the SCARF template (Ledford et al., 2020). Studies with quality/rigor scores above 2.0 were deemed to have adequate quality and rigor, consistent with SCARF procedures (Ledford et al., 2020).
Outcomes Analysis
The outcomes from designs demonstrating sufficient quality and rigor (i.e., SCARF quality/rigor scores above 2.0) were further analyzed to quantify their effect using visual analysis, quantitative, and meta-analysis methods. Visual analysis was conducted for all included designs; quantitative outcome calculations and meta-analyses were only conducted with designs meeting quality and rigor standards (Zimmerman et al., 2018). Studies were grouped by outcome during the analysis: (a) instructional method implementation fidelity outcomes (IM-TF), (b) instructional method student outcomes (IM-SO), (c) behavioral intervention implementation fidelity outcomes (BI-TF), and (d) behavioral intervention student outcomes (BI-SO).
Visual analysis
Visual analysis was conducted using a structured visual analysis worksheet (Ledford et al., 2018) by the first author and the third author, both of whom received additional training in systematic visual analysis from the fifth author, a single-case research expert. The systematic visual analysis included formative analysis to evaluate response patterns by analyzing the level, trend, and variability between conditions; degree of overlap and immediacy of change between conditions; and consistency of changes within conditions and between demonstrations of effect (Ledford et al., 2018). These findings were then summarized to illustrate the response patterns of implementation fidelity when self-monitoring was implemented. Next, summative visual analysis was used to determine the presence of a functional relation indicating the application of self-monitoring produced a desirable change in implementation fidelity behavior. A functional relation was recorded when consistent changes in the level, trend, and variability of data as well as an immediate (or near-immediate) change in the level or trend in the desired direction were present between conditions across at least three potential demonstrations of effect (Ledford et al., 2018).
Visual analysis was reported consistent with the SCARF scoring framework, with “no functional relation” indicating a score of 0 to 2 (i.e., no change in behavior, change in an undesirable direction, or change inconsistent or variable and the presence of at least one demonstration of non-effects). Designs with a score of 3 indicate the presence of at least one demonstration of “weak” effects and were reported as “weak.” Weak effects were defined as a delayed change between conditions, the presence of overlapping data, or a smaller in magnitude change in level. The SCARF outcome scores of 4 indicate the presence of consistent and unequivocal positive effects in at least three demonstrations. Designs with a score of 4 were reported as “Strong” to indicate consistent behavior change and no demonstrations of non-effects, suggesting the clear presence of a function relation (Ledford et al., 2020).
Quantitative analysis
A quantitative, parametric analysis of outcomes was conducted to determine the overall magnitude of effect for TD-SM addressing implementation fidelity using a mean-based measure of effect: Between-Case Standardized Mean Difference (BC-SMD; Valentine et al., 2016). The BC-SMD is a standardized mean difference calculation of the magnitude of change from baseline to intervention conditions across cases while considering autocorrelation and an individual accounting of between- and within-participant variability (Pustejovsky et al., 2014). The BC-SMD allows for the most robust calculation of between-case effects across multi-tiered designs and includes a bias-corrected estimator due to serial dependency and the small number of cases (Moeyaert et al., 2018). Pustejovsky and colleagues (2014) describe variance estimates within and across cases, including sample correction, autocorrelation and serial dependency, and index calculations.
To calculate BC-SMD, data were extracted using Web Plot Digitizer, an open-source web-based software tool used to obtain numerical data from graphic displays with adequate reliability (Moeyaert et al., 2016). Extracted data for each phase (e.g., baseline and intervention) were organized in AB comparisons for each design. The BC-SMD values were calculated from all AB phase contrasts using the scdhlm interactive web application (Pustejovsky et al., 2021) using the restricted maximum likelihood estimate (REML) with no specified trend or linear trend (Valentine et al., 2016). Given no trend or linear trend was specified, fixed effects were included for each time trend for parsimony (Valentine et al., 2016). A positive BC-SMD value indicates the presence of outcomes in the desired direction (e.g., positive values for outcomes expected to increase) and relative comparisons of magnitude within a group of studies (Barton et al., 2019).
Meta-analysis
In the event a sufficient number of designs were available among study groups, a meta-analysis was planned to synthesize BC-SMD effect sizes using a multilevel random effects meta-analysis model. The anticipated multilevel models were expected to include random effects at study and participant levels and standard deviation calculations at both levels to describe the degree of heterogeneity across studies as well as participants (Pustejovsky, 2018). In addition, cluster-robust variance estimation methods were planned to estimate the overall average effects across studies to account for autocorrelation errors in the effect size standard errors (Moeyaert et al., 2018).
Reliability
Primary coding and reliability calculations were conducted by the first author (a doctoral student in special education who holds a board certification in behavior analysis) and the third author (a doctoral student in psychology with training in single case design). Reliability was estimated at all levels of the review (i.e., initial study screening, study inclusion, descriptive coding, quality/rigor coding, and outcomes coding) using point-by-point agreement calculated by dividing the number of agreements by the total possible coding variables and multiplying the value by 100 (Ledford & Gast, 2018). Disagreements were initially discussed by the primary and secondary coders and brought to the research team if a consensus could not be reached. Coders were trained at the screening and descriptive levels by the second author (a PhD-level expert in single-case research design) and at the rigor and quality level by the fifth author (a PhD-level expert in single-case research design and synthesis) by first reviewing the operational definitions of the inclusion criteria, coding manual, or the SCARF, then modeling and practicing with non-included studies; disagreements were discussed to increase the likelihood of adherence to coding protocols. At the screening and inclusion levels, the secondary coder screened 100% of studies with an average agreement of 98.7% (range 96%–100%) at the title and abstract level and 100% at the full-text level. During descriptive coding, 40% of studies were screened, with an average agreement of 91.33% (range 88%–93%). During rigor and quality coding, 36% of designs were screened by the secondary coder, with an average agreement of 91.25% (range 89%–93%). During outcomes coding, data were extracted by a secondary coder for 54% of designs, with an average agreement of 96.9% (range 09%–100%; low agreement for two designs [09% and 33%] was due to a data extraction error made by the secondary coder, data were reviewed by the research team to ensure accuracy for these designs. All other designs had 100% agreement between coders).
Results
Ten studies including 22 designs met the inclusion criteria (Browder et al., 1986, 2007; Coogle et al., 2022; Fallon et al., 2018; Hyer & Cooper-Duffy, 2019; Mouzakitis et al., 2015; Pelletier et al., 2010; Pinkelman & Horner, 2017; Plavnick et al., 2010; Roberts & Leko, 2013). All were either multiple baseline or multiple probe designs. The unit of analysis was the study for descriptive coding; design for quality/rigor coding and visual analysis (outcome coding); AB comparison for data extraction (outcome coding); and design for BC-SMD (outcome coding). All data for descriptive and outcome analyses, including extracted data and BC-SMD values, are available in on OSF (https://tinyurl.com/2xjsancv).
For Whom and in Which Settings and Conditions
Teachers and students
A total of 31 teachers conducted self-monitoring in classroom settings: 22 classroom teachers, six paraeducators, and three student interns; all but six teachers were special educators. Education level was not reported for 38% of teachers (n = 12); when reported, 10 teachers had completed bachelor’s or master’s degrees, and the remaining participants were obtaining bachelor’s (n = 3) or master’s (n = 6) degrees. Teachers had an average of 6.3 years of experience, although the range varied from 2 to 22 years across studies. Paraeducator experience ranged from 7 to 22 years and general or special education teacher experience ranged from less than a year to 22 years. Gender was not reported for 29% of participants; when reported, all participants were reported male except one female. Race/ethnicity was not reported for 48% of participants; when reported most teachers were White (n = 12), with fewer Black (n = 2), and Hispanic (n = 1) teachers. Participant characteristics details are reported in Table 1.
Participant and Implementation Setting Characteristics for the Reviewed Studies.
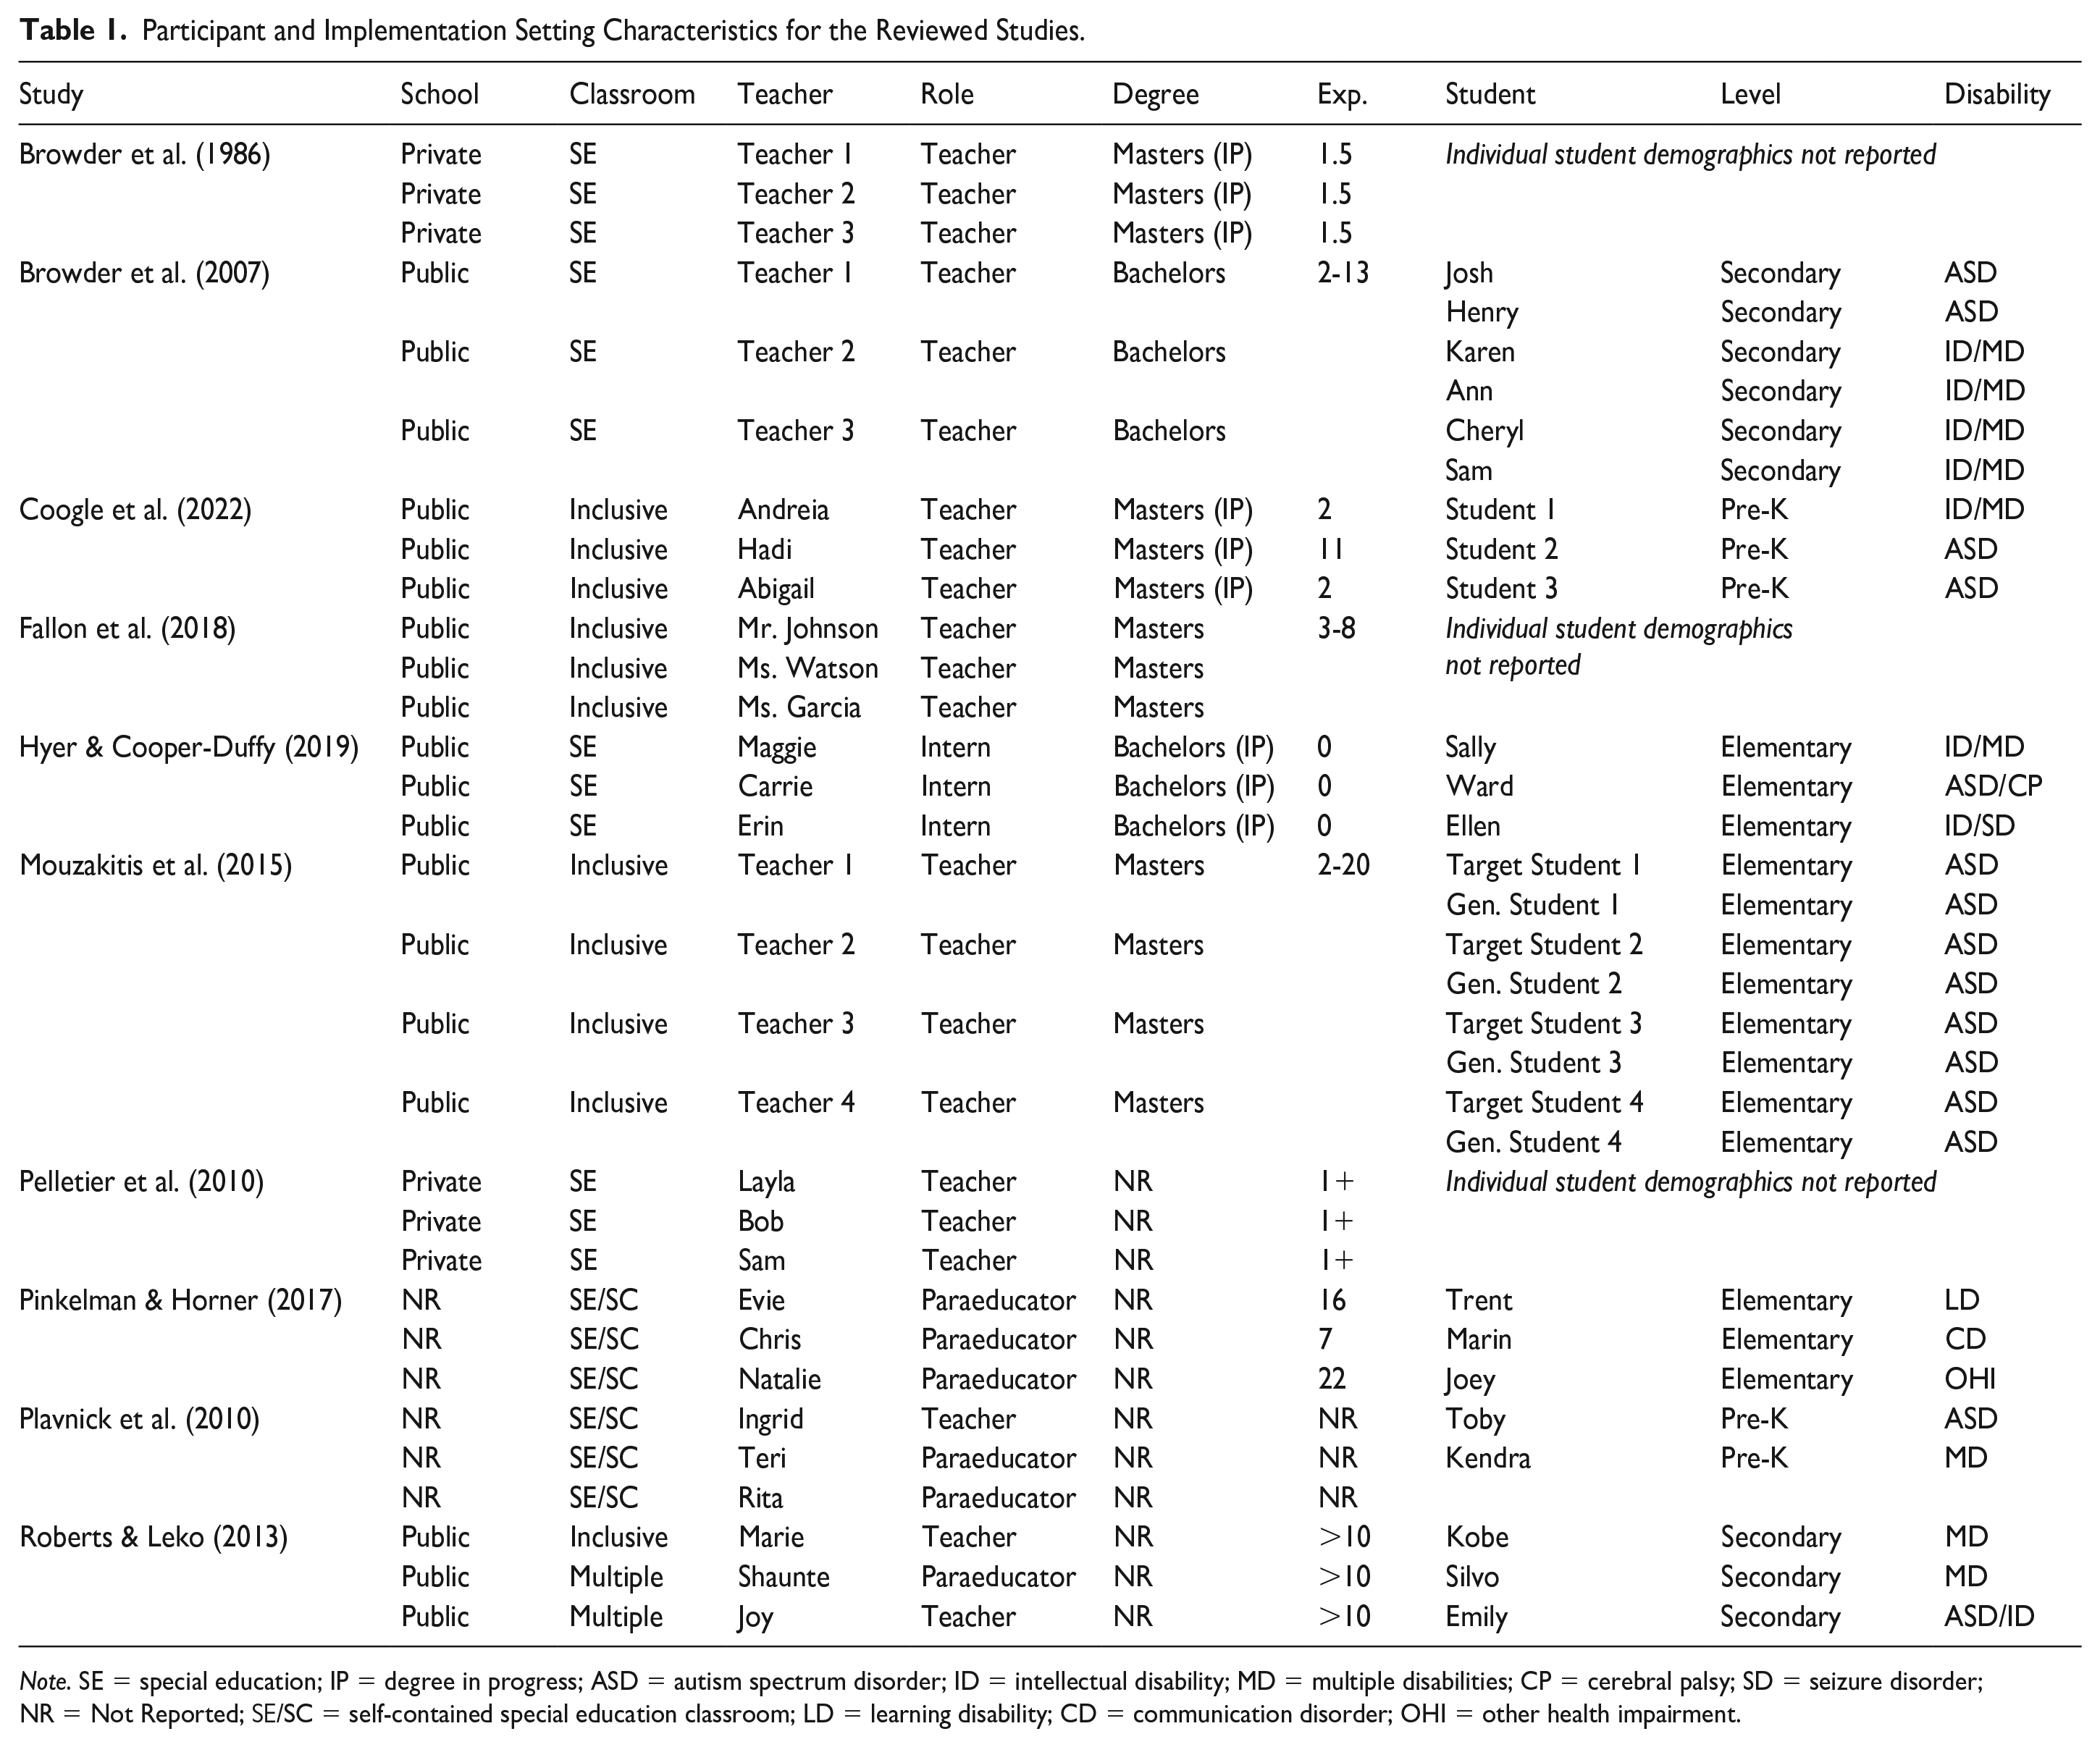
Note. SE = special education; IP = degree in progress; ASD = autism spectrum disorder; ID = intellectual disability; MD = multiple disabilities; CP = cerebral palsy; SD = seizure disorder; NR = Not Reported; SE/SC = self-contained special education classroom; LD = learning disability; CD = communication disorder; OHI = other health impairment.
A total of 28 student participants were reported in the included pool of studies; two studies did not report individual student data (Browder et al., 1986; Pelletier et al., 2010) and one reported class-wide data from three middle school classrooms (Fallon et al., 2018). Gender was not reported for 39% of students; 16 of the remaining participants were reported male and one was reported female. One-half of the students were in elementary school (n = 14), followed by middle/high school (n = 9), and preschool (n = 5). All participating students carried a medical diagnosis or were eligible for special education under the following: autism spectrum disorder (n = 14), intellectual disabilities (n = 8), multiple disabilities (n = 3), learning disabilities (n = 1), or other disabilities (e.g., other health impairment; n = 2).
Intervention settings and conditions
All but two studies occurred in public education settings; Browder et al. (1986) and Pelletier et al. (2010) reported implementation in non-public special education schools. The TD-SM was implemented mostly in non-inclusive self-contained classrooms (50% n = 5). Other settings included inclusive combined general education and special education classrooms (n = 2), special education classrooms (n = 2), and general education classrooms (n = 2). One study reported implementation in general education and special education classrooms (Roberts & Leko, 2013).
Implementation fidelity outcomes
Studies reported a single dependent variable pertaining to the implementation fidelity of an identified practice or strategy (i.e., “monitored practice”) in all but one study, which reported two forms of implementation fidelity (Browder et al., 1986). The percentage of steps recorded was the most common form of implementation fidelity reported (n = 8). Browder et al. (2007) reported the number of steps recorded, and two studies reported the accuracy of the steps observed (Browder et al., 1986; Coogle et al., 2022). The practices implemented varied across studies but included either instructional methods (e.g., literacy lesson; n = 4; Browder et al., 1986, 2007; Coogle et al., 2022; Hyer & Cooper-Duffy, 2019; Roberts et al., 2013) or behavioral interventions (e.g., token economy; n = 5; Fallon et al., 2018; Mouzakitis et al., 2015; Pelletier et al., 2010; Pinkelman & Horner, 2017; Plavnick et al., 2010). Only one study (Hyer & Cooper-Duffy, 2019) measured implementation fidelity across two instructional method practices: handwashing and literacy lessons. See Table 2 for study-level details.
Implementation Fidelity Self-Monitoring Intervention Conditions and Packages.
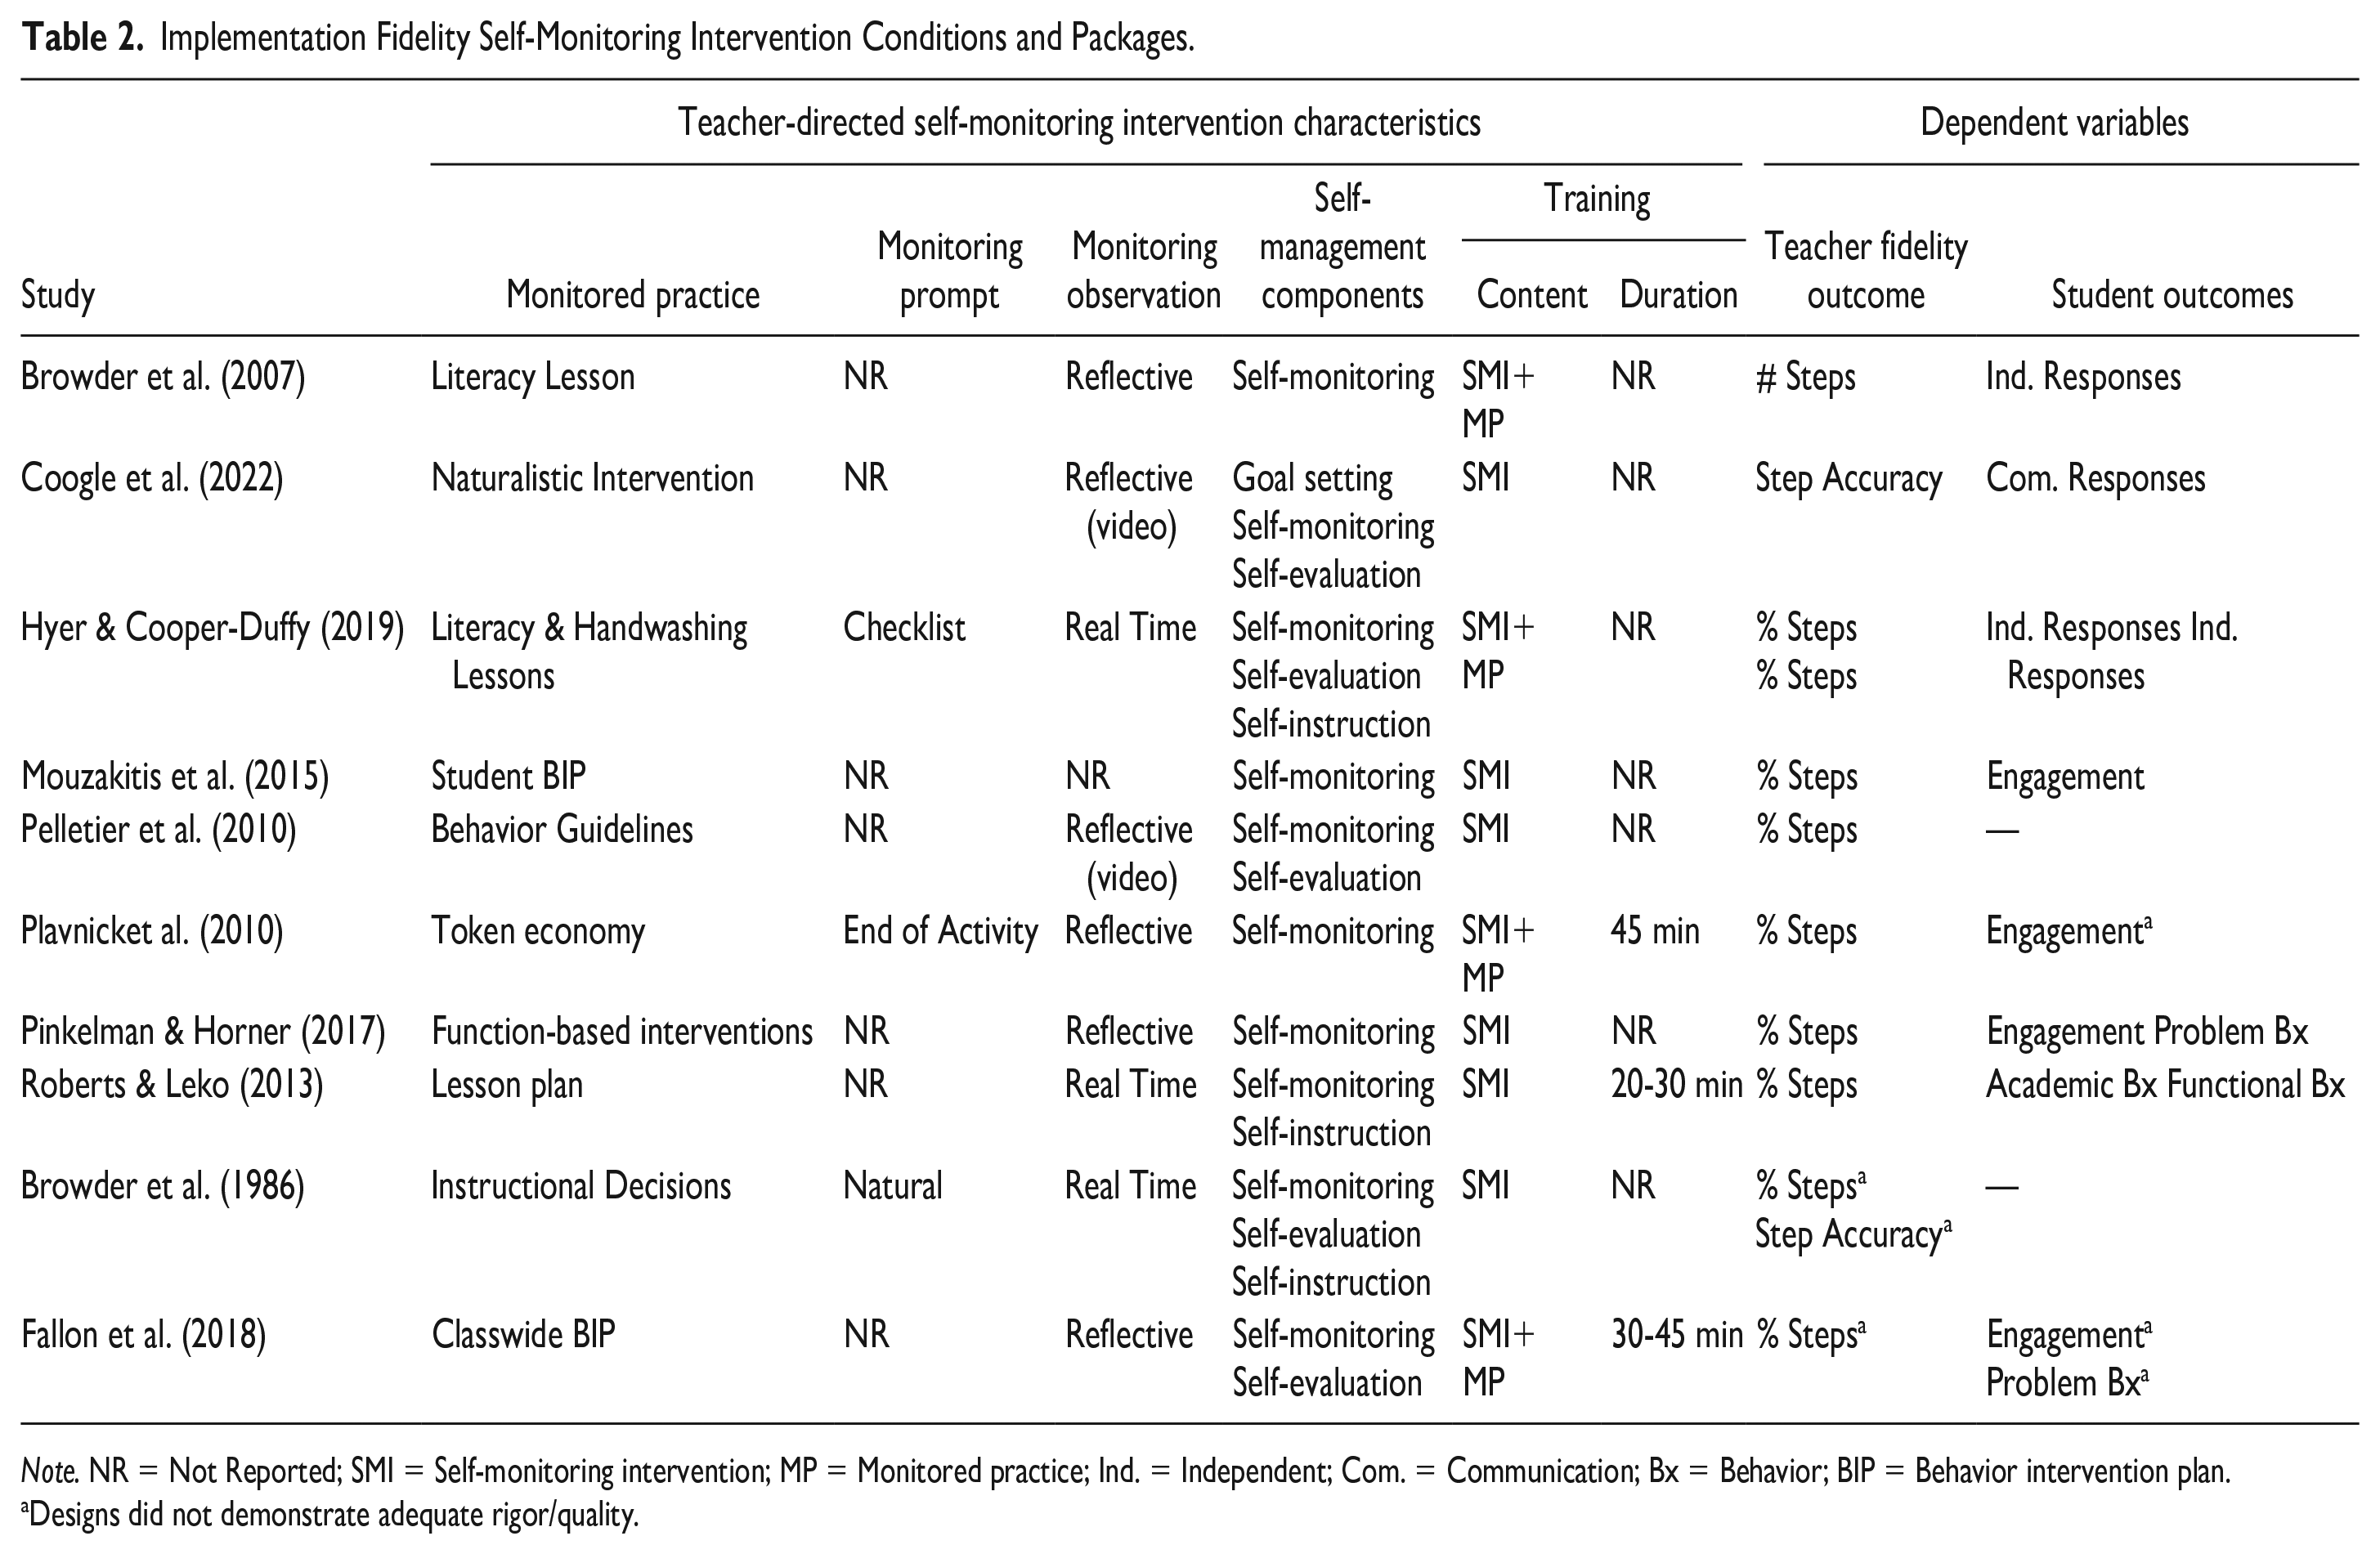
Note. NR = Not Reported; SMI = Self-monitoring intervention; MP = Monitored practice; Ind. = Independent; Com. = Communication; Bx = Behavior; BIP = Behavior intervention plan.
Designs did not demonstrate adequate rigor/quality.
Student outcomes
All but two studies (Browder et al., 1986; Pelletier et al., 2010) reported concurrent measurement of student outcomes associated with the monitored practice. Studies measuring implementation fidelity of instructional methods most often reported student outcomes associated with skill acquisition (e.g., independent or communication responses) targeted by the instructional method (Browder et al., 2007; Coogle et al., 2022; Hyer & Cooper-Duffy, 2019). One study (Roberts & Leko, 2013) reported measuring academic and functional behaviors related to Individualized Education Program goals. Free operant behavior (e.g., engagement or problem behavior) was reported for all four studies measuring the implementation fidelity of behavioral interventions. Two studies measured engagement and problem behaviors (Fallon et al., 2018; Pinkelman & Horner, 2017), while the remaining two measured only engagement (Mouzakitis et al., 2015; Plavnick et al., 2010). See Table 1 for study-level details.
Self-Monitoring Intervention Package Components
The TD-SM intervention package descriptions were coded at the component level to determine the uniformity of TD-SM across studies (an overview of packages can be found in Table 2 and a more detailed accounting of components can be found in Table 3). All studies included the use of a checklist, task analysis, or matrix to monitor implementation fidelity. The use of a prompt (i.e., signal or reminder to monitor at a pre-determined interval) was reported in three studies (Browder et al., 1986; Hyer & Cooper-Duffy, 2019; Plavnick et al., 2010). The remaining studies did not provide sufficient detail to determine the prompt form. All but one study (Mouzakitis et al., 2015) reported when participants monitored their behavior (i.e., the monitoring observation window). Three studies reported using real-time monitoring, meaning the participants monitored their behavior during implementation (Browder et al., 1986; Hyer & Cooper-Duffy, 2019; Roberts & Leko, 2013). Four studies reported using reflective monitoring, where participants reflected on their practice to report performing or engaging in intervention components (Browder et al., 2007; Fallon et al., 2018; Pinkelman & Horner, 2017; Plavnick et al., 2010). The two remaining studies (Coogle et al., 2022; Pelletier et al., 2010) reported teachers reviewed a video recording to monitor their behavior.
Implementation Fidelity Intervention Package and Outcomes Analysis.
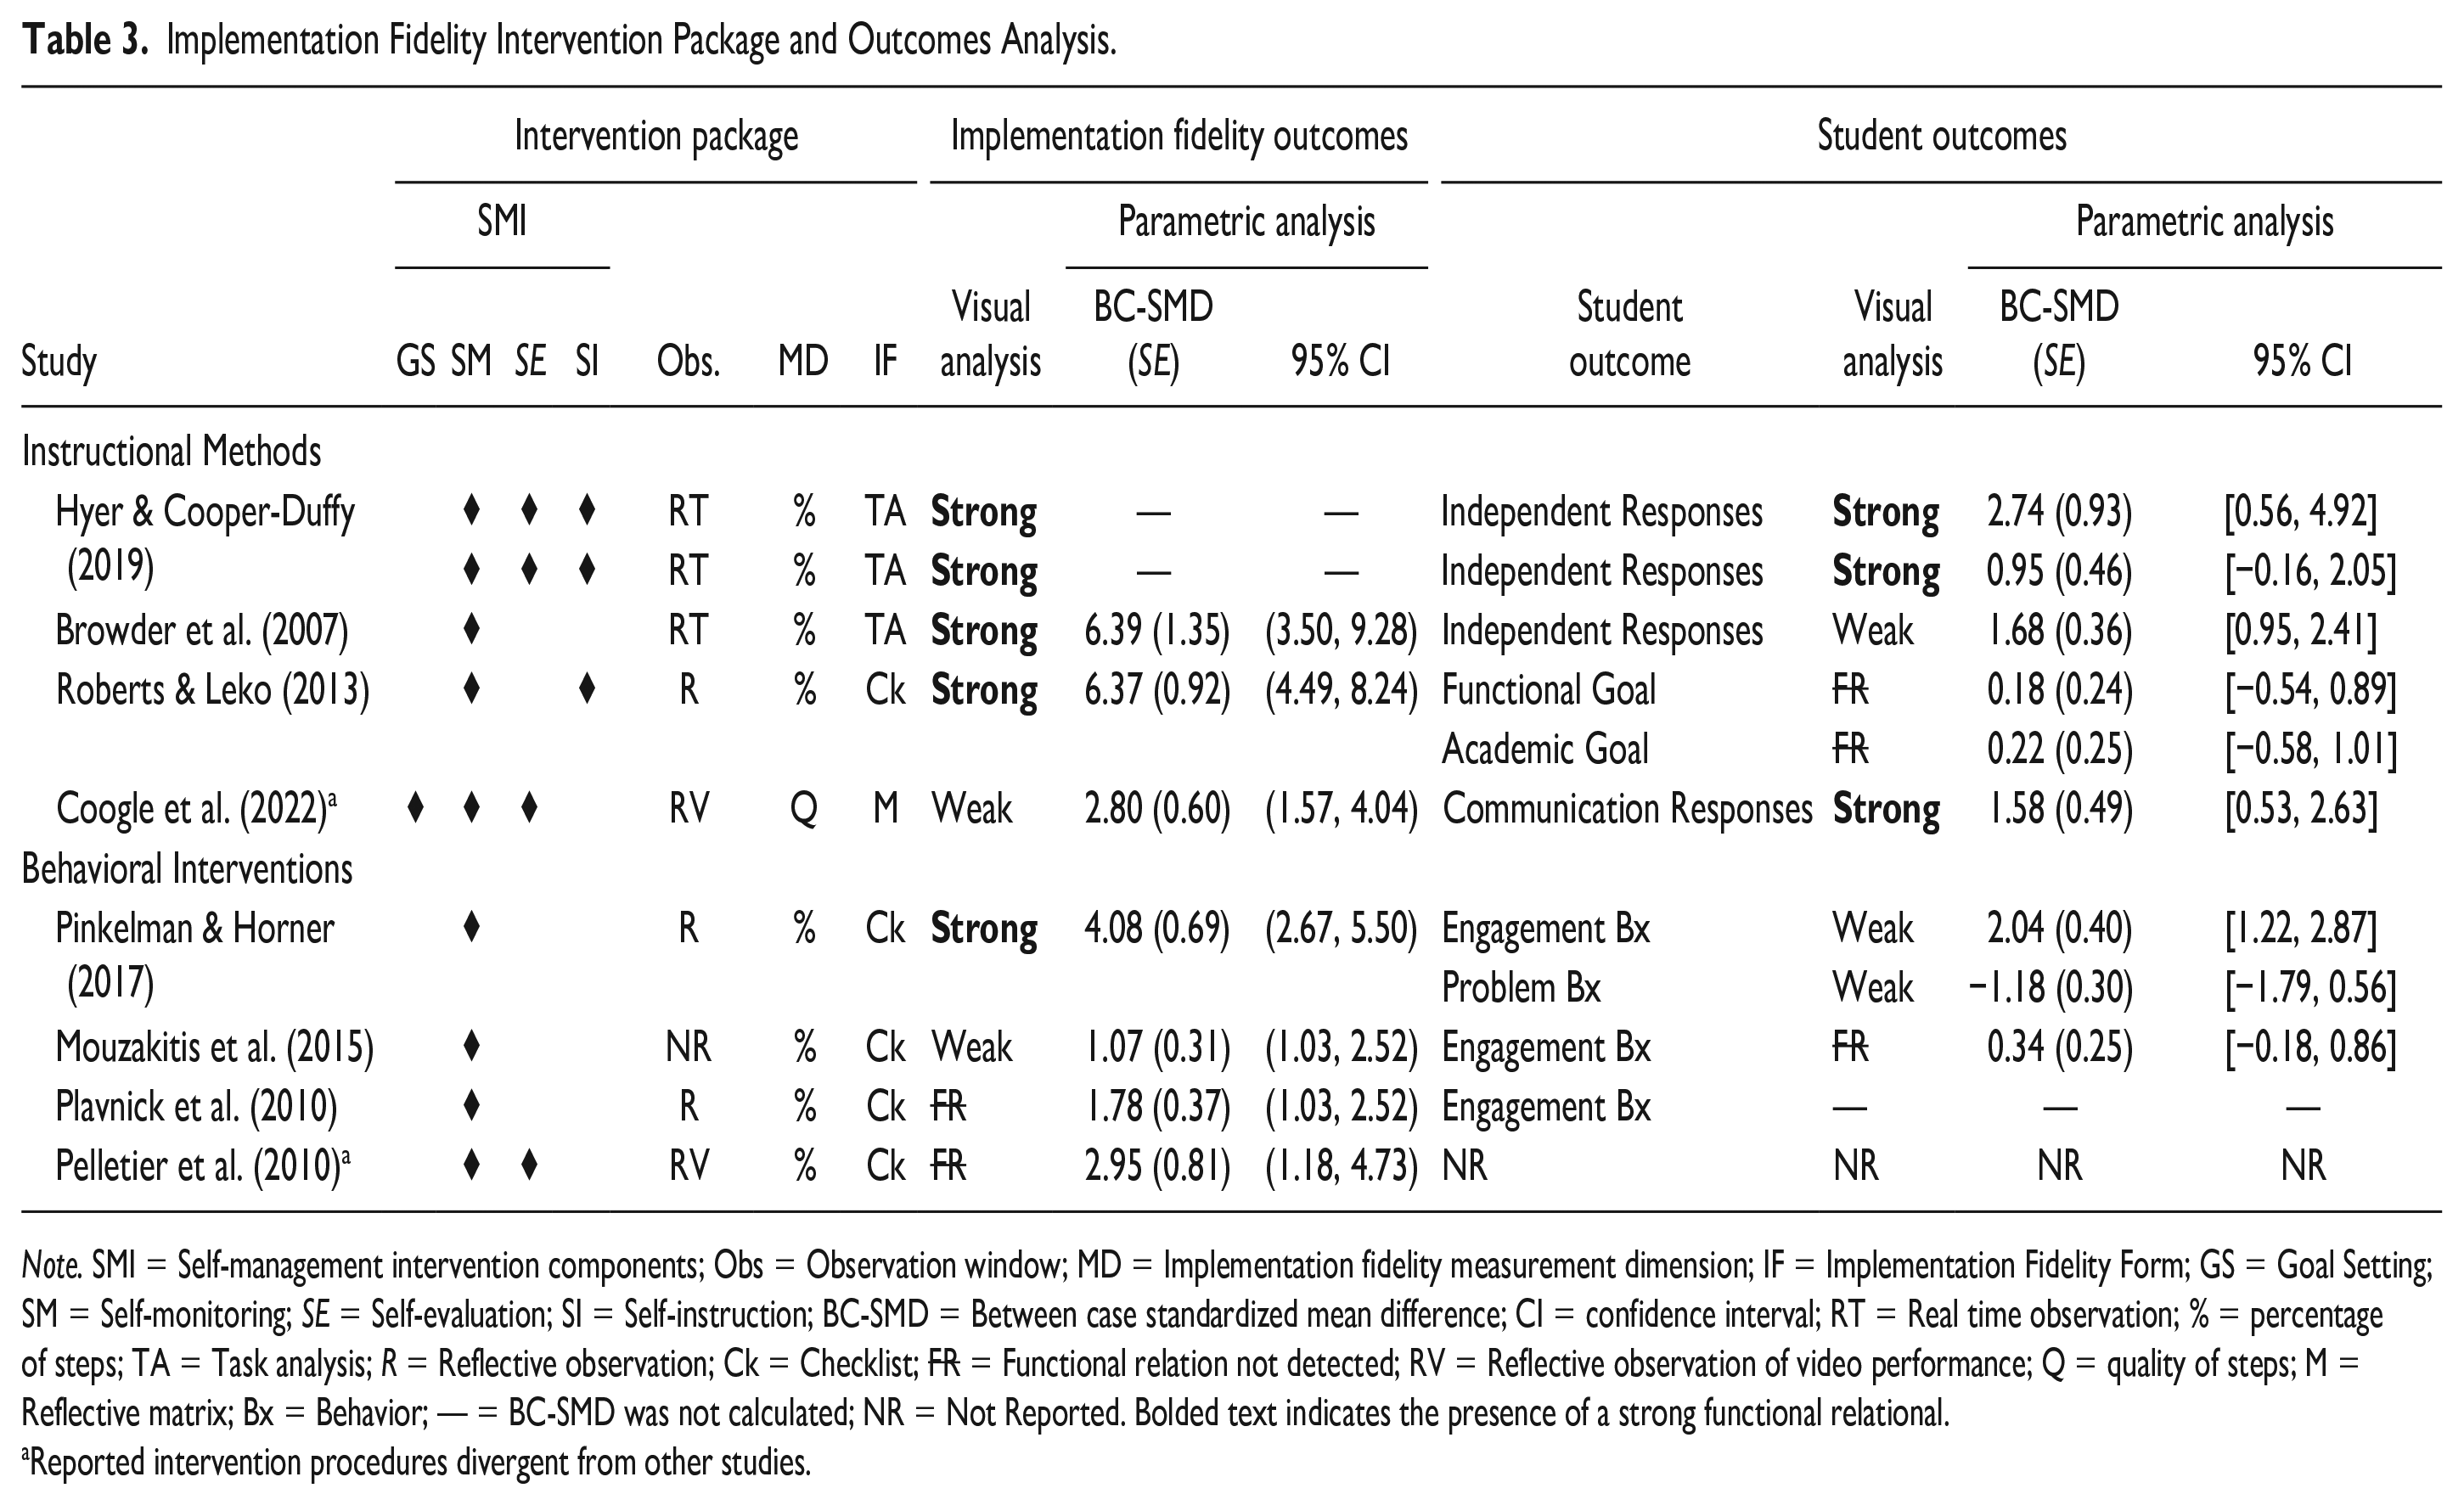
Note. SMI = Self-management intervention components; Obs = Observation window; MD = Implementation fidelity measurement dimension; IF = Implementation Fidelity Form; GS = Goal Setting; SM = Self-monitoring; SE = Self-evaluation; SI = Self-instruction; BC-SMD = Between case standardized mean difference; CI = confidence interval; RT = Real time observation; % = percentage of steps; TA = Task analysis; R = Reflective observation; Ck = Checklist; FR = Functional relation not detected; RV = Reflective observation of video performance; Q = quality of steps; M = Reflective matrix; Bx = Behavior; — = BC-SMD was not calculated; NR = Not Reported. Bolded text indicates the presence of a strong functional relational.
Reported intervention procedures divergent from other studies.
The majority of studies reported the use of a checklist or task analysis to monitor their behavior during implementation, or at the end of the task or school day. However, two studies reported distinct procedure variations from the others (Coogle et al., 2022; Pelletier et al., 2010). Coogle et al. (2022) employed video recording for teachers to monitor and reflect upon their implementation of a naturalistic intervention within 72 hours of implementing a lesson using a reflection matrix. The reflection matrix included describing, analyzing, judging, and applying insights into implementation focus items (i.e., steps; Coogle et al., 2022). Teachers in Pelletier et al. (2010) viewed a recording of their performance to monitor their implementation within 2 hr of reviewing the video. If observational data of implementation fidelity remained acceptable throughout the duration of the intervention condition, no further teacher monitoring occurred; only one of the three participants required additional monitoring (Pelletier et al., 2010).
All studies reported procedural descriptions meeting the initial inclusion criteria for self-monitoring and most studies described the independent variable as “self-monitoring.” However, the intervention procedures described in studies reflected the use of various self-management components. All studies included a description of the core features of self-monitoring (i.e., a teacher observing their own behavior at a predetermined interval and recording the occurrence of a target behavior). In addition to these features, studies reported the use of additional self-management components (n = 4). The most popular additional component reported was a comparison of one’s behavior to a previously determined standard (i.e., self-evaluation; n = 4). Two studies (Hyer & Cooper-Duffy, 2019; Roberts & Leko, 2013) included the use of self-instruction (i.e., the use of sequential cues to prompt engagement in a task), and one study (Coogle et al., 2022) included the use of goal setting (i.e., standard set for target behavior). In addition, three studies were found to include the use of additional teacher training strategies to supplemental TD-SM procedures, including performance feedback and video analysis of performance (Coogle et al., 2022; Mouzakitis et al., 2015; Pelletier et al., 2010).
Participants were trained in TD-SM procedures by research staff in all studies and received training in the school setting in most studies (n = 6). Training for TD-SM most often occurred independent of training for the practice monitored for fidelity (n = 6). Participants were provided with individual training using a variety of formats and most often included at least three of the following: discussion, modeling, role-play, and feedback. Discussion and modeling were included in half of the studies (n = 5). Three studies reported training duration, which ranged from 25 to 45 min in length (Fallon et al., 2018; Plavnick et al., 2010; Roberts & Leko, 2013).
Quality and Rigor Analysis
The pool of 10 included studies yielded 24 multiple-baseline or multiple-probe designs for rigor analysis. A student outcome design from Plavnick et al. (2010) was excluded from further analysis as it did not include three potential demonstrations of effect, reducing the number of designs at the rigor analysis level to 23. The average SCARF quality/rigor score across 21 designs in the 10 included studies was 2.8 for designs pertaining to implementation fidelity outcomes (possible SCARF quality/rigor scores 0–4; actual range: 1.5–3.4) and 2.9 for student outcome designs (actual range: 1.8–3.4). A total of 18 designs from eight studies (Browder et al., 2007; Coogle et al., 2022; Hyer & Cooper-Duffy, 2019; Mouzakitis et al., 2015; Pelletier et al., 2010; Pinkelman & Horner, 2017; Plavnick et al., 2010; Roberts et al., 2013) were of adequate quality and rigor. Few of these high-quality and rigorous studies reported generalization (n = 3) or maintenance measurement (n = 2). Of the 23 designs analyzed, five did not meet minimum rigor standards due to a lack of inclusion of independent variable reliability (n = 2; teacher outcomes, Browder et al., 1986), or a sufficient description of dependent variable reliability (n = 3; student and teacher outcomes, Fallon et al., 2018). SCARF Scatterplot figures can be found on OSF (“SCARF Scatterplot Figures”; https://tinyurl.com/2xjsancv).
Outcomes Analysis
All 24 designs were visually analyzed during the rigor analysis to complete the SCARF; however, only 18 designs showed adequate rigor (i.e., SCARF quality/rigor score above 2) and were further analyzed for response patterns and effect magnitude. Nine designs included “implementation fidelity outcomes” with a primary dependent variable related to implementation fidelity outcomes (i.e., outcomes measuring implementation fidelity targeted for change using self-monitoring). Nine designs reported data for secondary collateral student outcome dependent variables targeted by the practice being monitored (i.e., student outcomes produced by a practice implemented with strong fidelity; Browder et al., 1986; Pelletier et al., 2010).
The remaining 18 designs were further categorized by monitored practices related to instructional methods or behavioral interventions to yield four groups of interventions: IM-TF (n = 5), IM-SO (n = 6), BI-TF outcomes (n = 4), and BI-SO (n = 4; see Table 2 for an overview of these findings). Following visual analysis, A-B phase data were extracted for each tier of the design for all but one study (Roberts & Leko, 2013) where TD-SM was not introduced until the Phase 2 intervention condition following an initial practice training phase. Phase 1 intervention data were extracted for the first condition and Phase 2 intervention data for the second. Extracted data were used to calculate effect size estimates and meta-analytic statistics.
Visual analysis
A structured visual analysis worksheet (Ledford et al., 2018) was used to confirm the presence of functional relations for the 18 designs of sufficient quality/rigor (see Table 2). For implementation fidelity outcomes, data in seven designs indicated the presence of a functional relation (SCARF scores of 3 or 4); five of these designs demonstrated a strong functional relation. In the remaining two designs, a functional relation was not detected due to inconsistent effects across the tiers of a multiple baseline design (Pelletier et al., 2010; Plavnick et al., 2010). Four of the five IM-TF designs demonstrated a strong functional relation, while only one of the four BI-TF designs indicated the presence of a strong functional relation. For student outcomes, data in six of the nine designs demonstrated a functional relation, with half of these designs indicating the presence of a strong functional relation (n = 3). A functional relation was not detected in the three designs due to a lack of immediate change between baseline and intervention conditions (Functional and Academic Behavior, Mouzakitis et al., 2015; Roberts & Leko, 2013). Three of the six IM-SO designs demonstrated a strong functional relation, while a strong functional relation was not detected in any of the BI-SO designs.
Effect size estimates
The BC-SMD estimates for implementation fidelity outcomes ranged from 1.07 to 6.39 and student outcomes ranged from −1.18 to 2.74 (see Table 2). IM-TF effect size estimates indicate positive effects across all studies, with BC-SMD estimates ranging from 2.80 to 6.39. An effect size estimate was not calculated for two IM-TF designs (Hyer & Cooper-Duffy, 2019) as the data did not demonstrate adequate variability to meet the criteria for calculating BC-SMD (i.e., all baseline data were stable at zero and all intervention data were at ceiling levels across all three multiple baseline tiers; Valentine et al., 2016). BC-SMD estimates for IM-SO designs ranged from 0.18 to 2.74, indicating the presence of positive effects across all six designs, although three designs indicated confidence intervals crossing 0 (Handwashing Independent Responses, Hyer & Cooper-Duffy, 2019; Functional and Academic Behavior, Roberts et al., 2013). Positive effects were indicated in all four BI-TF designs, with BC-SMD estimates ranging from 1.07 to 4.08. BC-SMD estimates for BI-SO designs ranged from −1.18 to 2.04. One design yielded negative effects in the desired direction (BC-SMD= −1.18; Problem Behavior, Pinkelman & Horner, 2017). Another study indicated a confidence interval crossing zero (Engagement Behavior, Mouzakitis et al., 2015) suggesting the presence of negative or non-effects cannot be ruled out.
Meta-analysis
A meta-analysis was not conducted for any of the identified study groupings, due to a lack of sufficient implementation fidelity designs with comparable intervention package features to create meaningful outcomes groupings. For IM-TF designs, only two designs with calculable effect size estimates reported comparable self-management components (Browder et al., 2007; Roberts & Leko, 2013). Although six IM-SO designs were available, two designs reported disparate dependent Program [IEP] variable measurement (e.g., Individualized Education goals) than the remaining designs (e.g., independent or communication response). Of the BI-TF designs with effect size estimates, one design reported divergent implementation conditions (Pelletier et al., 2010), leaving only three BI-TF, and three collateral BI-SO designs for meta-analytic comparison.
Discussion
This review investigated for whom, in what settings and conditions, and with which intervention packages TD-SM has been investigated, and the effect of TD-SM on K–12 educator implementation fidelity and student outcomes. The TD-SM studies were of mostly sufficient quality/rigor and included a variety of educators, settings, and intervention packages to improve implementation across instructional methods and behavioral strategies. Outcomes analyses showed the use of TD-SM improved the implementation fidelity behavior for special education teachers, paraeducators, and interns in all instruction method designs and some behavioral intervention designs. Improvements in implementation fidelity resulted in more consistent collateral gains in student outcomes when implementation fidelity self-monitoring was applied to instructional methods than when used with behavioral intervention designs. However, the main outcomes and further implications from these findings were severely limited by a small sample of primary studies.
Teacher-Directed Self-Monitoring Participants, Settings, and Conditions
Inconsistent participant and setting reporting, and the relatively small pool of studies, limited in-depth analysis of the teachers and students who have benefited from the use of TD-SM under research conditions. Despite the small sample size, it is notable that the teachers selected for TD-SM investigation were practicing educators with varying roles and years of instructional experience. Findings bolster the practical guidance recommending the general use of TD-SM for teachers and paraprofessionals (Collier-Meek et al., 2013; King-Sears et al., 2018). Notably, the majority of these teachers were special education teachers who would likely be implementing TD-SM under different implementation conditions than their general education counterparts (e.g., smaller class sizes, single student-focused interventions). The small pool of studies prohibits further consideration but poses interesting future research questions regarding the feasibility of TD-SM across implementation conditions. These results indicate a need for increased participant, setting, and conditions reporting and broader sampling to better under who stands to benefit from TD-SM and what settings and implementation conditions are amenable to TD-SM to improve implementation fidelity.
Teacher-Directed Self-Monitoring Intervention Package Characteristics
Although all studies included self-monitoring, the intervention packages implemented across studies varied widely. Most notably, the timing of the monitoring observation occurred in real time in only three of the 10 included studies (Browder et al., 1986; Hyer & Cooper-Duffy, 2019; Roberts & Leko, 2013) and was not reported in another (Mouzakitis et al., 2015). The remaining studies reported using reflective monitoring, but variation was noted within this group as well. Two studies reported monitoring and evaluating past performance of behavior by reviewing a video recording of implementation (Coogle et al., 2022; Pelletier et al., 2010). Half of the studies used reflective monitoring where teachers recorded their behavior based on their memory of implementation at varying time points (e.g., at the end of the implementation period or school day). These variations indicate the monitoring observation window may be a useful adaptation feature to individualize TD-SM to fit the feasibility needs of teachers within their classroom or instructional context. Further variation of TD-SM intervention characteristics was noted in the inclusion of multiple self-management interventions; variation provides another potential adaptation point to tailor TD-SM to unique implementer needs. For example, implementers aiming to build fluid and consistent implementation may find self-monitoring and self-instruction to best meet their needs, while implementers seeking to boost the quality of implementation may consider the inclusion of self-evaluation.
Effect of TD-SM on Implementation Fidelity of Classroom Interventions
A summative comparison of intervention component packages, implementation fidelity, and student outcomes for designs of sufficient quality and rigor found in eight of the 10 included studies is presented in Table 3. From the pool of eight studies with adequate quality and rigor, four designs in four studies were reported to exclusively use self-monitoring and five designs in four studies included additional self-management components. In addition, a review of intervention procedures noted unique discrepancies in the reported intervention procedures from Coogle et al. (2022) and Pelletier et al. (2010). Although both designs from these two studies met inclusion criteria and were considered self-monitoring, noted procedural variations limited intervention package comparison to the other designs (e.g., use of reflection matrix or train to criterion self-monitoring). As a result, the two designs from these two studies were excluded from the following discussion, leaving four designs in four studies with exclusive use of self-monitoring and three designs in two studies employing additional components.
Strong functional relations were detected in all four designs investigating the use of TD-SM to improve the implementation fidelity of instructional methods (i.e., IM-TF). Comparatively, a functional relation was detected in two of three behavioral intervention designs (i.e., BI-TF). However, the consistently positive outcomes were found in IM-TF designs across varied implementation packages, while BI-TF designs demonstrated varied outcomes and consistent implementation packages. All three BI-TF designs used only self-monitoring and two of these designs reported use of reflective monitoring using an implementation checklist; however, only one of these designs produced a strong functional relation (Pinkelman & Horner, 2017), while a functional relation was not detected in the other (Plavnick et al., 2010). The third design (Mouzakitis et al., 2015) employed self-monitoring of an implementation checklist resulting in a weak functional relation but did not report enough detail to determine the monitoring observation window.
When the seven included designs with common intervention procedures were considered as a group (i.e., not differentiated by instructional method), additional patterns emerged. Real-time monitoring occurred in three designs, producing consistent strong functional relations. Reflective monitoring occurred in three designs, producing strong functional relations in two of the three. Of note, real-time monitoring was reported exclusively in instructional methods designs, while reflective monitoring was reported in both behavioral intervention designs with a monitoring observation window. One possible explanation for observed differentiation is instructional methods are typically designed as “follow along” steps or procedures (e.g., lesson plans) during instructional periods, while behavioral interventions are more often introduced in a training session and implemented in the moment or as needed. All three designs that included additional self-management components produced strong functional relations (Handwashing & Literacy Lessons, Hyer & Cooper-Duffy, 2019; Roberts & Leko, 2013) while only two of the four self-monitoring designs resulted in strong functional relations (Browder et al., 2007; Pinkelman & Horner, 2017).
The limited pool of studies prohibits a deeper analysis of emerging patterns; however, these findings suggest additional research may be warranted to investigate the differential effects of various self-management components on implementation fidelity and the conditions under which they should be individually employed. Specifically, further investigation into the use of real-time or reflective monitoring is necessary. Reflective monitoring is likely more feasible in practice settings, making this a valuable feature for the practical use of TD-SM in the classroom. However, findings from this review indicated only two of the three comparable designs using reflective monitoring with sufficient quality and rigor demonstrated a functional relation.
Effect of TD-SM Implementation Fidelity on Associated Student Outcomes
Summarized effects of TD-SM of implementation on associated outcomes can be found in Table 3. The findings indicate that reported increases in implementation fidelity for all five designs targeting instructional methods (i.e., IM-TF) did not result in a consistent collateral increase in skills for students (i.e., IM-SO). All three IM-SO designs which examined the effect of TD-SM implementation fidelity of instructional methods on independent student responses produced functional relations (Browder et al., 2007; Hyer & Cooper-Duffy, 2019) and when student communication responses were measured (Coogle et al., 2022). No functional relation was found when Roberts and Leko (2013) measured the effect of improved implementation fidelity on academic and functional IEP goals. Although limited by the small sample size, this finding has potential practical implications relevant to translating TD-SM outcomes into practice.
Independent responses, as reported in Hyer and Cooper-Duffy (2019) and Browder et al. (2007), were measured by scoring discrete behaviors encompassed within the steps of an academic or functional skill task analysis as correct or incorrect (e.g., “move to the sink” Hyer & Cooper-Duffy, 2019; “points to/says title” Browder et al., 2007). Alternatively, the academic or functional IEP goals measured in Roberts and Leko (2013) were measured by scoring correct or incorrect responses based upon the student’s IEP goal which included intact academic or functional skills, for example, matching targeted words or using a communication device or sign language in contextually appropriate social exchanges. Although no conclusion can be drawn from the single exemplar presented by Roberts and Leko (2013), it presents interesting potential implications for translational research.
Observational measurement of discrete behaviors as reported in Hyer and Cooper-Duffy (2019) and Browder et al. (2007) is common in tightly controlled research conditions. However, in-service teachers report experiencing significant barriers to data collection including a lack of time and trained data collectors likely to limit the quality, quantity, and frequency of observational data collection of discrete behaviors (Cooper et al., 2020; Swain et al., 2022). These barriers suggest many teachers are unlikely to have the resources for valid observational measurement of discrete behaviors that would also require further analysis and interpretation to apply toward IEP goal progress determinations (Robertson et al., 2020; Swain et al., 2022). If gains in student outcomes resulting from improved implementation fidelity are best observed when discrete behaviors are measured than under more practical measurement conditions, this outcome would have broad implications for the utility of implementation fidelity and practical measurement. What is the utility of implementation fidelity if student outcomes improve only when measured using highly sensitive measurement methods, infeasible to many teachers, but not when using the common measurement systems used to determine IEP goal progress? Although this preliminary finding is intriguing, no practical implication of this finding can be drawn beyond underscoring the need for additional investigation into TD-SM to better understand the utility and collateral effect of TD-SM under using data collection methods likely used by endogenous implementers. In addition, this finding suggests a need to examine the reliability between discrete observation measurement methods used under research conditions and the more practical measurement systems more commonly used by in-teacher teachers (e.g., curriculum-based measurement and direct behavior rating scales).
Collateral positive outcomes appeared less likely to occur in the student outcomes of behavioral interventions. A smaller number of designs for this outcome grouping was available; however, the available designs indicated only two weak effects and one non-effect. This limited pool of studies prohibits a more thorough interpretation of these results; however, these preliminary findings are of practical interest. Robertson et al. (2020) found teachers reported inconsistent behavior intervention plan (BIP) implementation across staff as the second most reported and impactful barrier to effective BIP implementation. Practical guidance suggests TD-SM is a potential solution to this barrier by boosting implementation fidelity across staff (Myers et al., 2017; Sanetti & Luh, 2020). However, the results of this review suggest additional research is needed to determine if the use of TD-SM to improve the implementation of the behavioral interventions included in a BIP is likely to translate into improved outcomes for students.
Limitations
A major limitation of this review is the relatively small pool of studies investigating the use of TD-SM to improve implementation fidelity. Although efforts were made to identify studies employing TD-SM, these interventions are sometimes ambiguously described, blended with other interventions, or described using inconsistent terminology (i.e., self-management vs. self-monitoring). These challenges allow for the possibility that not all relevant studies were captured within the systematic search process or contributed to the exclusion of several studies where a self-monitoring dependent variable could not be isolated. The limited pool of included studies greatly impacted the interpretation of the findings and in-depth discussion of the research questions and prohibited meta-analysis of implementation fidelity and student outcomes. Although TD-SM is frequently cited as a tool to improve implementation fidelity (e.g., Myers et al., 2017; Sanetti & Luh, 2020), implementation fidelity was rarely identified as the dependent variable in studies investigating the use of TD-SM. During the systematic search process, 36 TD-SM studies were excluded due to the inclusion of a dependent variable other than implementation fidelity. Excluded studies met all other inclusion criteria and the vast majority included a dependent variable pertaining to the frequent use of an intervention (i.e., studies investigated the use of TD-SM to increase the daily frequency of an intervention). This finding suggests there is a substantial body of TD-SM literature investigating a less popular practical use of TD-SM and a smaller body of literature pertaining to the more popular and recommended use of TD-SM.
Implications for Research
Limited participant and procedural description reporting further impacted analysis within this review. Future research syntheses would be improved by increased reporting of translational information at the primary study level, including more thorough intervention procedure descriptions pertaining to the monitoring observation window, prompt and recording method, duration of training procedures for teachers, and identification of critical steps or features of the monitored practice. In addition, these studies should include sufficient detail of secondary dependent variables related to student outcomes, the rationale for the assumed association between student outcomes and implementation fidelity outcomes, and potential threats to internal validity related to student outcomes. Research teams should consider the use of data repositories to allow the inclusion of translational data when page limitations may prohibit publication.
To better guide practitioners in the use of TD-SM, future research should investigate the impact of intervention package features (i.e., monitoring observation window and use of prompt), including the use of reflective and real-time monitoring, on implementation fidelity outcomes, as well as the effectiveness of TD-SM on the quality or accuracy of implementation beyond adherence to procedure. In addition, further research is needed to examine the relationship between implementation and student outcomes. Many studies employed TD-SM to improve implementation fidelity with the assumption that gains in fidelity would result in gains in student outcomes. Our findings confirm implementation fidelity only partially contributes to student outcomes. Previous studies indicate some but not all students experience skill gains with improved implementation fidelity and underscore previous calls for further investigation into the effect of implementation fidelity (Locke et al., 2019; Stahmer et al., 2015; Sterling-Turner et al., 2002; Zhang et al., 2022), especially when measured using measurement methods commonly employed in practical settings.
A final implication for researchers is noted in the comparison between visual analysis results and BC-SMD values. Eight designs indicated the presence of a strong functional relation—these studies demonstrated BC-SMD estimates ranging from 4.08 to 6.39 for implementation fidelity outcomes and 0.95 to 2.74 for student outcomes. Five designs indicated the presence of a weak function relation with BC-SMD estimates ranging from 1.07 to 2.80 for implementation fidelity outcomes, 1.68 and 2.04 for student outcomes anticipated to increase, and −1.18 for student outcomes anticipated to decrease. Finally, no functional relation was determined in five designs, with BC-SMD estimates ranging from 1.78 to 2.95 for implementation fidelity outcomes and 0.18 to 0.34 for student outcomes. The similarities in BC-SMD values for designs with disparate functional relation conclusions are difficult to interpret, as there is no formal guidance for BC-SMD interpretation. Further guidance into the interpretation of BC-SMD values and their correlation with visual analysis is warranted to contextualize analyses of the magnitude of outcomes in single-case research design syntheses.
Implications for Practitioners
The TD-SM has been examined with practitioners in varying settings and grade levels, and with practitioners with varying years of experience in education, suggesting the intervention may have wide applicability across practitioners. Positive effects were most consistently seen among practitioners with less than 15 years of experience, with most practitioners reporting less than 5 years of experience. The synthesis results suggest TD-SM may improve the fidelity of instructional methods (i.e., practices requiring student skill acquisition), and increased quality or adherence to the practice procedures is likely to result in an improvement in student outcomes when a discrete skill is measured. It is less clear if TD-SM is likely to improve behavioral intervention implementation fidelity and the related impact on student outcomes. Two intervention package components were noted to vary across studies, suggesting potential adaption points for practitioners. Practitioners may choose to monitor implementation fidelity in real time or reflectively, as well as select various self-management interventions to target their unique needs. However, caution is required as it is unclear how adaptations will impact the fidelity outcomes.
Conclusion
The TD-SM demonstrated varied outcomes for improving the implementation fidelity of instructional methods and behavioral interventions for teachers with varying roles, educational experiences, and classroom settings. Evidence suggests these positive effects may be more likely to occur when monitoring the implementation fidelity of instructional methods, than with behavioral interventions. The impact of improved implementation fidelity on associated student outcomes was less clear, thus requiring caution for practitioners relying solely on fidelity to translate to improved student outcomes. Instead, practitioners should continue to use data-based decision-making to monitor progress in real-time in addition to implementation fidelity and adjust, adapt, or discontinue an intervention when adequate progress is not achieved. Finally, to improve the translation into practice, future research into TD-SM for implementation fidelity should include detailed information about self-management components, monitored practices including reflective monitoring, and the impact of these decisions on associated student outcomes.
Supplemental Material
sj-docx-1-pbi-10.1177_10983007221137368 – Supplemental material for Improving Implementation Fidelity With Teacher-Directed Self-Monitoring Interventions: A Systematic Review
Supplemental material, sj-docx-1-pbi-10.1177_10983007221137368 for Improving Implementation Fidelity With Teacher-Directed Self-Monitoring Interventions: A Systematic Review by Gretchen Scheibel, Pei-Yu Chen, Lauren M. Zaeske, Howard P. Wills and Kathleen N. Zimmerman in Journal of Positive Behavior Interventions
Footnotes
Declaration of Conflicting Interests
The author(s) declared no potential conflicts of interest with respect to the research, authorship, and/or publication of this article.
Funding
The author(s) received no financial support for the research, authorship, and/or publication of this article.
Supplemental Material
Supplemental material for this article is available on the Journal of Positive Behavior Interventions website with the online version of this article.
References
Supplementary Material
Please find the following supplemental material available below.
For Open Access articles published under a Creative Commons License, all supplemental material carries the same license as the article it is associated with.
For non-Open Access articles published, all supplemental material carries a non-exclusive license, and permission requests for re-use of supplemental material or any part of supplemental material shall be sent directly to the copyright owner as specified in the copyright notice associated with the article.