
Abstract
School-wide positive behavior interventions and supports (SWPBIS) is widely implemented across the United States. Evidence suggests that SWPBIS, when implemented with fidelity, has a significant and positive impact on schools, including lower suspensions and higher reading and mathematics achievement. A critical component of this research is measuring fidelity of SWPBIS implementation in schools. In this study, we re-evaluated the reliability and validity of a widely used fidelity tool, the Tiered Fidelity Inventory (TFI), within a single-state sample. Using data from 693 schools in the U.S. state of California, we found a hierarchical factor structure based on subscales and tiers fit the data best when controlling for the multilevel nature of the data; however, there was no relation between the latent fidelity variables and changes in suspensions. Implications of these results are discussed, including different approaches to scoring and conceptualizing fidelity of implementation for SWPBIS, along with considerations for future research using the TFI.
Keywords
School-wide positive behavior interventions and supports (SWPBIS) is a multi-tiered framework for prevention and intervention delivery to reduce problem behavior and, subsequently, disciplinary actions in schools (Sugai & Horner, 2020). SWPBIS is currently implemented in more than 26,000 schools across the globe, and a recent meta-analysis found that schools using universal SWPBIS have significantly fewer disciplinary exclusions (e.g., out-of-school suspensions) and higher school-wide achievement than schools not using SWPBIS (Lee & Gage, 2020). Yet, research also suggests that a key moderator to actualizing these positive outcomes is implementing SWPBIS with fidelity, or doing SWPBIS as designed, described, and intended (Childs et al., 2016; Gage et al., 2019; Keller-Margulis, 2012; Pas et al., 2019). Several SWPBIS fidelity measures are widely used and evaluated; however, to date, most reliability and validity studies of those measures have been conducted by their developers. In this study, we conducted an independent evaluation of the reliability and validity of a widely used SWPBIS fidelity measure to provide additional evidence of integrity. The authors were not involved in the development or any prior psychometric study of the Tiered Fidelity Inventory (TFI). The authors have no affiliation with the Positive Behavior Intervention and Support (PBIS) Center and provide research support to the California PBIS Coalition at no charge as a service to the field. In the following, we describe (a) the importance of measuring fidelity, particularly fidelity of SWPBIS, (b) current measures of SWPBIS fidelity and their psychometric properties, (c) the relation between SWPBIS fidelity and discipline outcomes, and (d) the importance of independent evaluations and replication studies in education.
Fidelity of Implementation
Fidelity of implementation, also referred to as treatment integrity (Gresham, 2017), is an indication of how well a program was implemented. Fidelity includes multiple constructs, including adherence (i.e., implementing the program as designed), quality (i.e., how well the program was implemented), and dosage (i.e., how much of the program was delivered). Measuring fidelity is important for both practical and research purposes. Practitioners can use fidelity data to determine how well a program is implemented and to target professional development to increase fidelity. For researchers, fidelity helps to establish internal validity (Shadish et al., 2002) and identify mechanisms of multi-component interventions critical to achieving positive outcomes (van Dijk et al., 2022). When practices are implemented with poor fidelity, judgments of their effectiveness may be inaccurate (Sanetti et al., 2021). Fidelity also allows for more refined analyses of treatment effects in experimental and quasi-experimental design studies and supports estimation of treatment-on-the treated models and complier average effect models (Panayiotou et al., 2020).
Reviews examining fidelity of implementation suggest reporting fidelity in research studies has increased substantially across time. Between the 1960s and 1990s, only about 20% of researchers reported assessing fidelity with a quantitative indicator. Since 2000, that percentage has increased >68% (Swanson et al., 2019). Bruhn et al. (2015) examined fidelity reporting in studies of school-wide interventions, including SWPBIS, published between 1993 and 2012. The authors identified 79 studies and found only 46% reported a quantitative measure of fidelity. Of the 40 studies that focused on school-wide behavior prevention and intervention, such as SWPBIS, the authors found only 43% reported fidelity. However, a recent meta-analysis of 32 experimental and quasi-experimental studies of SWPBIS found that 78% reported a quantitative measure of SWPBIS fidelity (Lee & Gage, 2020).
School-Wide Positive Behavior Interventions and Supports
School-wide positive behavior interventions and supports is a three-tiered framework designed to promote effective behavior support for all students using prevention and intervention across a continuum of needs (Horner & Sugai, 2015). Tier 1 focuses on universal delivery of teaching and reinforcement of positively stated behavioral expectations, a continuum of responses for problem behaviors, and development of a data-based decision-making system. Tier 2 is implemented with students identified as at-risk for future behavior difficulties following Tier 1 implementation, and typically involves group-based (e.g., social skills lessons) or structured interventions (e.g., Check-In Check-Out; Crone et al., 2010) as well as increased progress monitoring data collection. Tier 3 supports are reserved for students with the most intense behavioral needs, and involve individualized, function-based interventions along with monitoring fidelity of intervention implementation (Horner & Sugai, 2015). Across all tiers, schools rely on structured data collection and data-based decision making to respond to individual and systems-level needs.
School-wide positive behavior interventions and supports is widely implemented across the United States and internationally and is an American Academy of Pediatrics–recommended practice for moving schools from reactive disciplinary procedures to proactive strategies (American Academy of Pediatrics, 2013). Broad scale-up is supported by a national technical assistance center funded by the U.S. Department of Education’s Office of Special Education Programs (OSEP) that develops and disseminates myriad resources for schools, districts, and state departments of education. However, SWPBIS implementation is often driven and supported by state-level initiatives and technical assistance centers that support districts and schools in building and implementing multi-tiered supports (Gage et al., 2014). As a result of these state-level initiatives, with the support of the national technical assistance center, thousands of schools and districts receive implementation support, including training and coaching, annually.
School-Wide Positive Behavior Interventions and Supports Fidelity
A critical component of most state-level initiatives is training and coaching schools to use a fidelity of implementation tool. Research has consistently demonstrated a high correlation between higher implementation fidelity and positive school outcomes. For example, Simonsen and colleagues (2012) examined longitudinal data from schools in Illinois and found that schools implementing Tier 1 with fidelity had lower office discipline referrals (ODR) and suspensions. In a similar study in Florida, Childs et al. (2016) found that schools implementing Tier 1 with higher fidelity had lower ODR and suspensions. Experimental research has also found consistent patterns of positive school-level effects on problem behavior and disciplinary exclusions. Gage and colleagues (2018) found that schools implementing SWPBIS Tier 1 with fidelity in Georgia had fewer ODR and suspensions compared with schools never trained to implement SWPBIS.
Most research has focused on the association of Tier 1 implementation fidelity and school-level outcomes. Recently, researchers have begun to examine the additive effects of fidelity at Tiers 2 and 3. Grasley-Boy et al. (2021) used TFI data to compare 350 schools implementing only Tier 1 with fidelity to 113 schools implementing Tiers 1 and 2 with fidelity, and 80 schools implementing Tiers 1, 2, and 3 with fidelity. The results suggest no difference between schools implementing only Tier 1 and schools implementing Tiers 1 and 2. Schools implementing all three tiers with fidelity, however, had significantly fewer out-of-school suspensions (OSS; g = −0.39) than schools implementing only Tier 1 with fidelity.
Measuring School-Wide Positive Behavior Interventions and Supports Fidelity
All the studies exploring the association between fidelity and school outcomes rely on a quantitative measure of fidelity of implementation. Several SWPBIS fidelity measures have been developed over the years; however, most of these tools largely focus on Tier 1 implementation. The Benchmarks of Quality (BoQ; Kincaid et al., 2005, 2010) is a comprehensive, 53-item self-assessment measure that teams complete with the guidance of a coach familiar with their system. The Team Implementation Checklist (TIC; Sugai et al., 2001) is a 22-item team-led self-assessment focused primarily on Tier 1 fidelity and is typically used to guide SWPBIS start-up and monitor progress. The PBIS Self-Assessment Survey (SAS; Sugai et al., 2000) is a 46-item self-assessment rated by the SWPBIS team or all school staff that is frequently used as a needs assessment in addition to assessing Tier 1 fidelity. The School-wide Evaluation Tool (SET; Sugai et al., 2005) is a 28-item external assessment, and the only measure that solely relies on external observers to review permanent products and interview staff and students to assess fidelity, but also only measures fidelity at the Tier 1 level.
Previously, the Benchmarks for Advanced Tiers (Anderson et al., 2012) and the Monitoring Advanced Tiers Tool (MATT; Horner et al., 2013) were the most common measures available to assess Tier 2 and 3 fidelity. Both the BAT and MATT relied on team self-assessment under the guidance of an external coach. That changed when Algozzine and colleagues (2014) developed the SWPBIS TFI to address the need for a tool to efficiently measure fidelity at all three tiers that could be scaled up and used across the country. The TFI contains 45 items that address each of the tiers (15 for Tier 1, 13 for Tier 2, and 17 for Tier 3) and subscales within the tiers. Like other measures, the TFI is a team self-assessment conducted with the guidance of an external coach.
Prior Psychometric Evaluations of the Tiered Fidelity Inventory
Across all available SWPBIS fidelity measures, the TFI is currently recommended by the OSEP National Technical Assistance Center on PBIS. It is also the only measure used to evaluate all three tiers individually or simultaneously at this time. Furthermore, the TFI’s psychometric properties have been studied, with evidence suggesting the TFI is an accurate and reliable assessment of SWPBIS fidelity (McIntosh et al., 2017). The American Educational Research Association (AERA), American Psychological Association (APA), and National Council on Measurement in Education (NCME, 2014) have established standards for evaluating the psychometric properties of educational measurement tools. These standards include quantitative evidence of reliability and validity, which we describe for the TFI below.
Reliability
Reliability is the consistency or stability of a test’s score across instances of the testing procedures (AERA, APA, & NCME, 2014). Specific approaches to reliability include interrater reliability, which involves two raters evaluating fidelity at the same time and then comparing the two sores; test–retest reliability, which involves collecting scores at one point in time and then again at an a priori-determined follow-up time and then the scores are compared for stability across the two measurement periods; and internal consistency, which is defined as the consistency with which the items of a test measure a single construct (Johnson & Christensen, 2019). McIntosh et al. (2017) evaluated reliability across a series of studies. First, the authors conducted interrater reliability between the coach’s independent TFI rating and the rating with the coach leading the team using two-way random consistency intraclass correlation (ICC). The authors found interrater reliability of .95, .96, and .89 at Tiers 1, 2, and 3 respectively, all considered acceptable values (Nunnally, 1978). Overall, interrater reliability was .96. McIntosh et al. also evaluated test–retest reliability of the TFI, with 2 weeks between administrations, finding a correlation of .99 overall, and .98, .99, and .99 for Tiers 1, 2, and 3, respectively, also considered acceptable values. Furthermore, McIntosh et al. calculated alpha from a sample of almost 800 schools, finding overall internal consistency of .96. Alpha coefficients for Tiers I, II, and III were .87, .96, and .98, respectively.
Construct validity
Construct validity refers to how well a test measures the latent construct(s) it is intended to measure (Netemeyer et al., 2003). Evidence of construct validity is usually established using exploratory and confirmatory factor analysis (CFA), which are statistical approaches for identifying and confirming individual items pool together to represent a latent construct. For example, do Tier 1 items pool together to measure the latent construct of Tier 1 fidelity? Massar et al. (2019) examined the factor structure of the TFI using CFA with 1,209 schools from 25 states. The authors examined two different factor structures: a model with three factors, one for each SWPBIS tier; and a 10-factor model with a latent factor for each hypothesized subscale based on the McIntosh et al. (2017) initial conception. The authors found both factor structures adequately fit the data based on their a priori model fit criteria, but the 10-factor model fit the data best.
It is worth noting, however, that the authors did not validate the factor structure of loading items on latent subscales loaded on latent tiers (i.e., hierarchical structure). In addition, the authors did not account for the lack of independence of schools and districts. Schools within districts were likely present, yet the models did not account for the nested structure of the data. Kim (2019) conducted a CFA of the TFI using the three-factor structure, with each factor representing a different SWPBIS tier. Unlike Massar et al. (2019), Kim (2019) controlled for the nested structure of schools within districts, finding acceptable model fit for the three-factor model. However, Kim did not use individual indicators to model the latent factor structure but instead used a subscale score as the observed indicator in the model.
Concurrent validity
McIntosh et al. (2017) also assessed the concurrent validity of each tier of the TFI. Concurrent validity is a type of criterion validity, which involves comparing a measure to another measure (AERA, APA, & NCME, 2014). For concurrent validity, a test is compared with other tests measuring the same constructs (Netemeyer et al., 2003). Collection of the tests should occur at or near the same point in time. McIntosh et al. (2017) compared the TFI to existing fidelity measures, including the BoQ, SAS, TIC, and BAT, using team TFI ratings both with and without external coach input in a sample of 789 schools across several states. Pearson correlations (r) ranged from .243 to .639 without a coach and .507 to .750 with a coach. In addition, Nelen and colleagues (2020) examined the concurrent validity of the TFI at Tier 1 and the SET with a sample of 117 schools in the Netherlands. SWPBIS professionals external to the schools translated each instrument into Dutch and collected the surveys. Overall, the authors found mean fidelity of 59% for the TFI and 70% for the SET, both below successful fidelity criteria. The correlation between the two measures was r = .71.
Predictive validity
Predictive validity, another form of criterion validity, is the ability of a test to predict a subsequent and temporally ordered criterion (Netemeyer et al., 2003). Evidence of predictive validity is often found using either correlation or regression analyses to demonstrate that an increase or decrease in fidelity, for example, is associated with an increase or decrease in an outcome hypothesized to be directly related to implementation fidelity. As noted previously, implementation fidelity is associated with more positive school outcomes, including disciplinary exclusions (e.g., Gage et al., 2018) and school-level academic achievement in reading and mathematics (e.g., Childs et al., 2016). However, many of these studies correlated outcomes with either the SET or the BoQ. Grasley-Boy et al. (2021) used the TFI to examine differential effects on school suspensions when schools implemented multiple tiers with fidelity but used the percentage of possible total scores within each of the tiers per the TFI developers.
Only one study has examined the relation between TFI scores and school outcomes by modeling the latent factor scores. An advantage to this approach is that the latent factor reduces measurement error and allows estimates of more complex relationships (e.g., higher order latent factors; Kline, 2015). Kim (2019) conducted a series of analyses using the Tier 1 latent factor and modeling the relation between Tier 1 fidelity and different school outcomes, controlling for covariates, including locale and percentage of students receiving free and reduced-price lunch. Tier 1 was significantly negatively correlated with ODR rates and risk differences in ODRs for Black and non-Black students in elementary schools. However, although statistically significant, the correlations between TFI and school outcomes were not large, with standardized mean difference effect sizes (d) <.01 standard deviation units.
Purpose
All prior validation research on the TFI has used multi-state samples. Yet, as mentioned, SWPBIS implementation is often driven and supported at the individual state level. Thus, how SWPBIS is supported and coached varies across states. None of the prior TFI psychometric studies controlled for state variation. Furthermore, only Kim (2019) controlled for the nesting of schools within districts, yet they did not model individual items and relied on a single-factor structure (three-factor model). Last, the test developers or their students at the same university conducted all prior validation studies. Replication research by independent groups is essential for knowledge development (Francis, 2012). Put simply, “When multiple researchers converge on similar findings, doubts are quelled about unavoidable error and bias associated with the search for knowledge” (Travers et al., 2016, p. 196) in an area, including measuring fidelity of implementation. Thus, replication of reliability and validity evidence increases the trustworthiness of the measure in both research and practice.
The purpose of this study was to re-evaluate the factor structure of the TFI using a different sample of schools in a single state, where all the schools received similar training, coaching, and support as part of an organized technical assistance system. Furthermore, we explored expansions of the prior factor structures (i.e., three-factor) using higher-order latent factors (i.e., latent factors that are themselves made up of latent factors). In addition, we followed recommendations by Massar et al. (2019) to explore the relation between latent fidelity constructs and discipline outcomes (e.g., suspensions) (i.e., predictive validity). The following research questions guided this study:
Method
Sample
We gathered 2018 to 2019 SWPBIS implementation fidelity data from the California PBIS Coalition. This group facilitates annual fidelity assessments as part of their training, technical assistance, and recognition program for schools implementing SWPBIS. According to the California Department of Education (2021), there are 10,545 schools in 1,029 school districts, 8,884 of which are K–12 public schools. Consistent with prior studies, we only included K–12 public schools, excluding alternative and non-traditional (e.g., vocational) schools. From January 2019 through the end of the school year, 703 schools provided TFI scores for all three tiers. There were no missing data at the TFI item-level given our inclusion criteria of reporting scores for all tiers; however, 693 schools were used for the analytic due to given missing demographic data. We created the final dataset using R 4.0.3 (R Core Team, 2020) by merging across common IDs from multiple data sources, as outlined below.
Measures
Tiered Fidelity Inventory
The TFI (Algozzine et al., 2014) is a 45-item self-report tool that measures the fidelity of SWPBIS implementation at each of the three tiers. Working with an external SWPBIS coach, school SWPBIS teams rate their school on 15 items for Tier 1, 13 items for Tier 2, and 17 items for Tier 3 using a 3-point scale (0 = not implemented, 1 = partially implemented, 2 = fully implemented). The California PBIS Coalition currently uses the TFI to track implementation fidelity across their regional technical assistance centers and annually recognize schools that reach and maintain fidelity. We did not collect information about the specific interactions between the regional external SWPBIS coaches and the schools. An external coach is required for the CA PBIS recognition, but the role of the external coach and their interactions with the schools is not collected. During 2018 to 2019, some schools completed the TFI multiple times (e.g., fall and spring), thus we only included the most recent score reported from January 2019 through the end of the school year as these later assessments were most likely used for recognition and represent fidelity after most of a year’s implementation.
Demographic data
We gathered demographic data for public schools in California for the 2018 to 2019 school year from the National Center for Education Statistics (NCES, 2021) Common Core of Data (https://necs.ed.gov/ccd/) and the California School Accountability Report Card (SARC, https://www.cde.ca.gov/ta/ac/sa/), which are both publicly accessible. Public and nonpublic schools in California submit SARC data annually, including discipline and academic outcomes, school resources, and demographics. We used three demographic covariates from NCES: (a) total enrollment, (b) urbanicity (i.e., city, suburb, town, rural), (c) Title I eligibility (i.e., yes/no). We used an additional four continuous demographic covariates from SARC: the percentages of (a) White students, (b) socially disadvantaged students, (c) English language learners, and (d) students with disabilities. Furthermore, we obtained categorical information on school grade type (e.g., elementary) from California PBIS Coalition TFI data. Demographic data for all schools are provided in Table 1.
Demographics for Sample from California Public Schools.
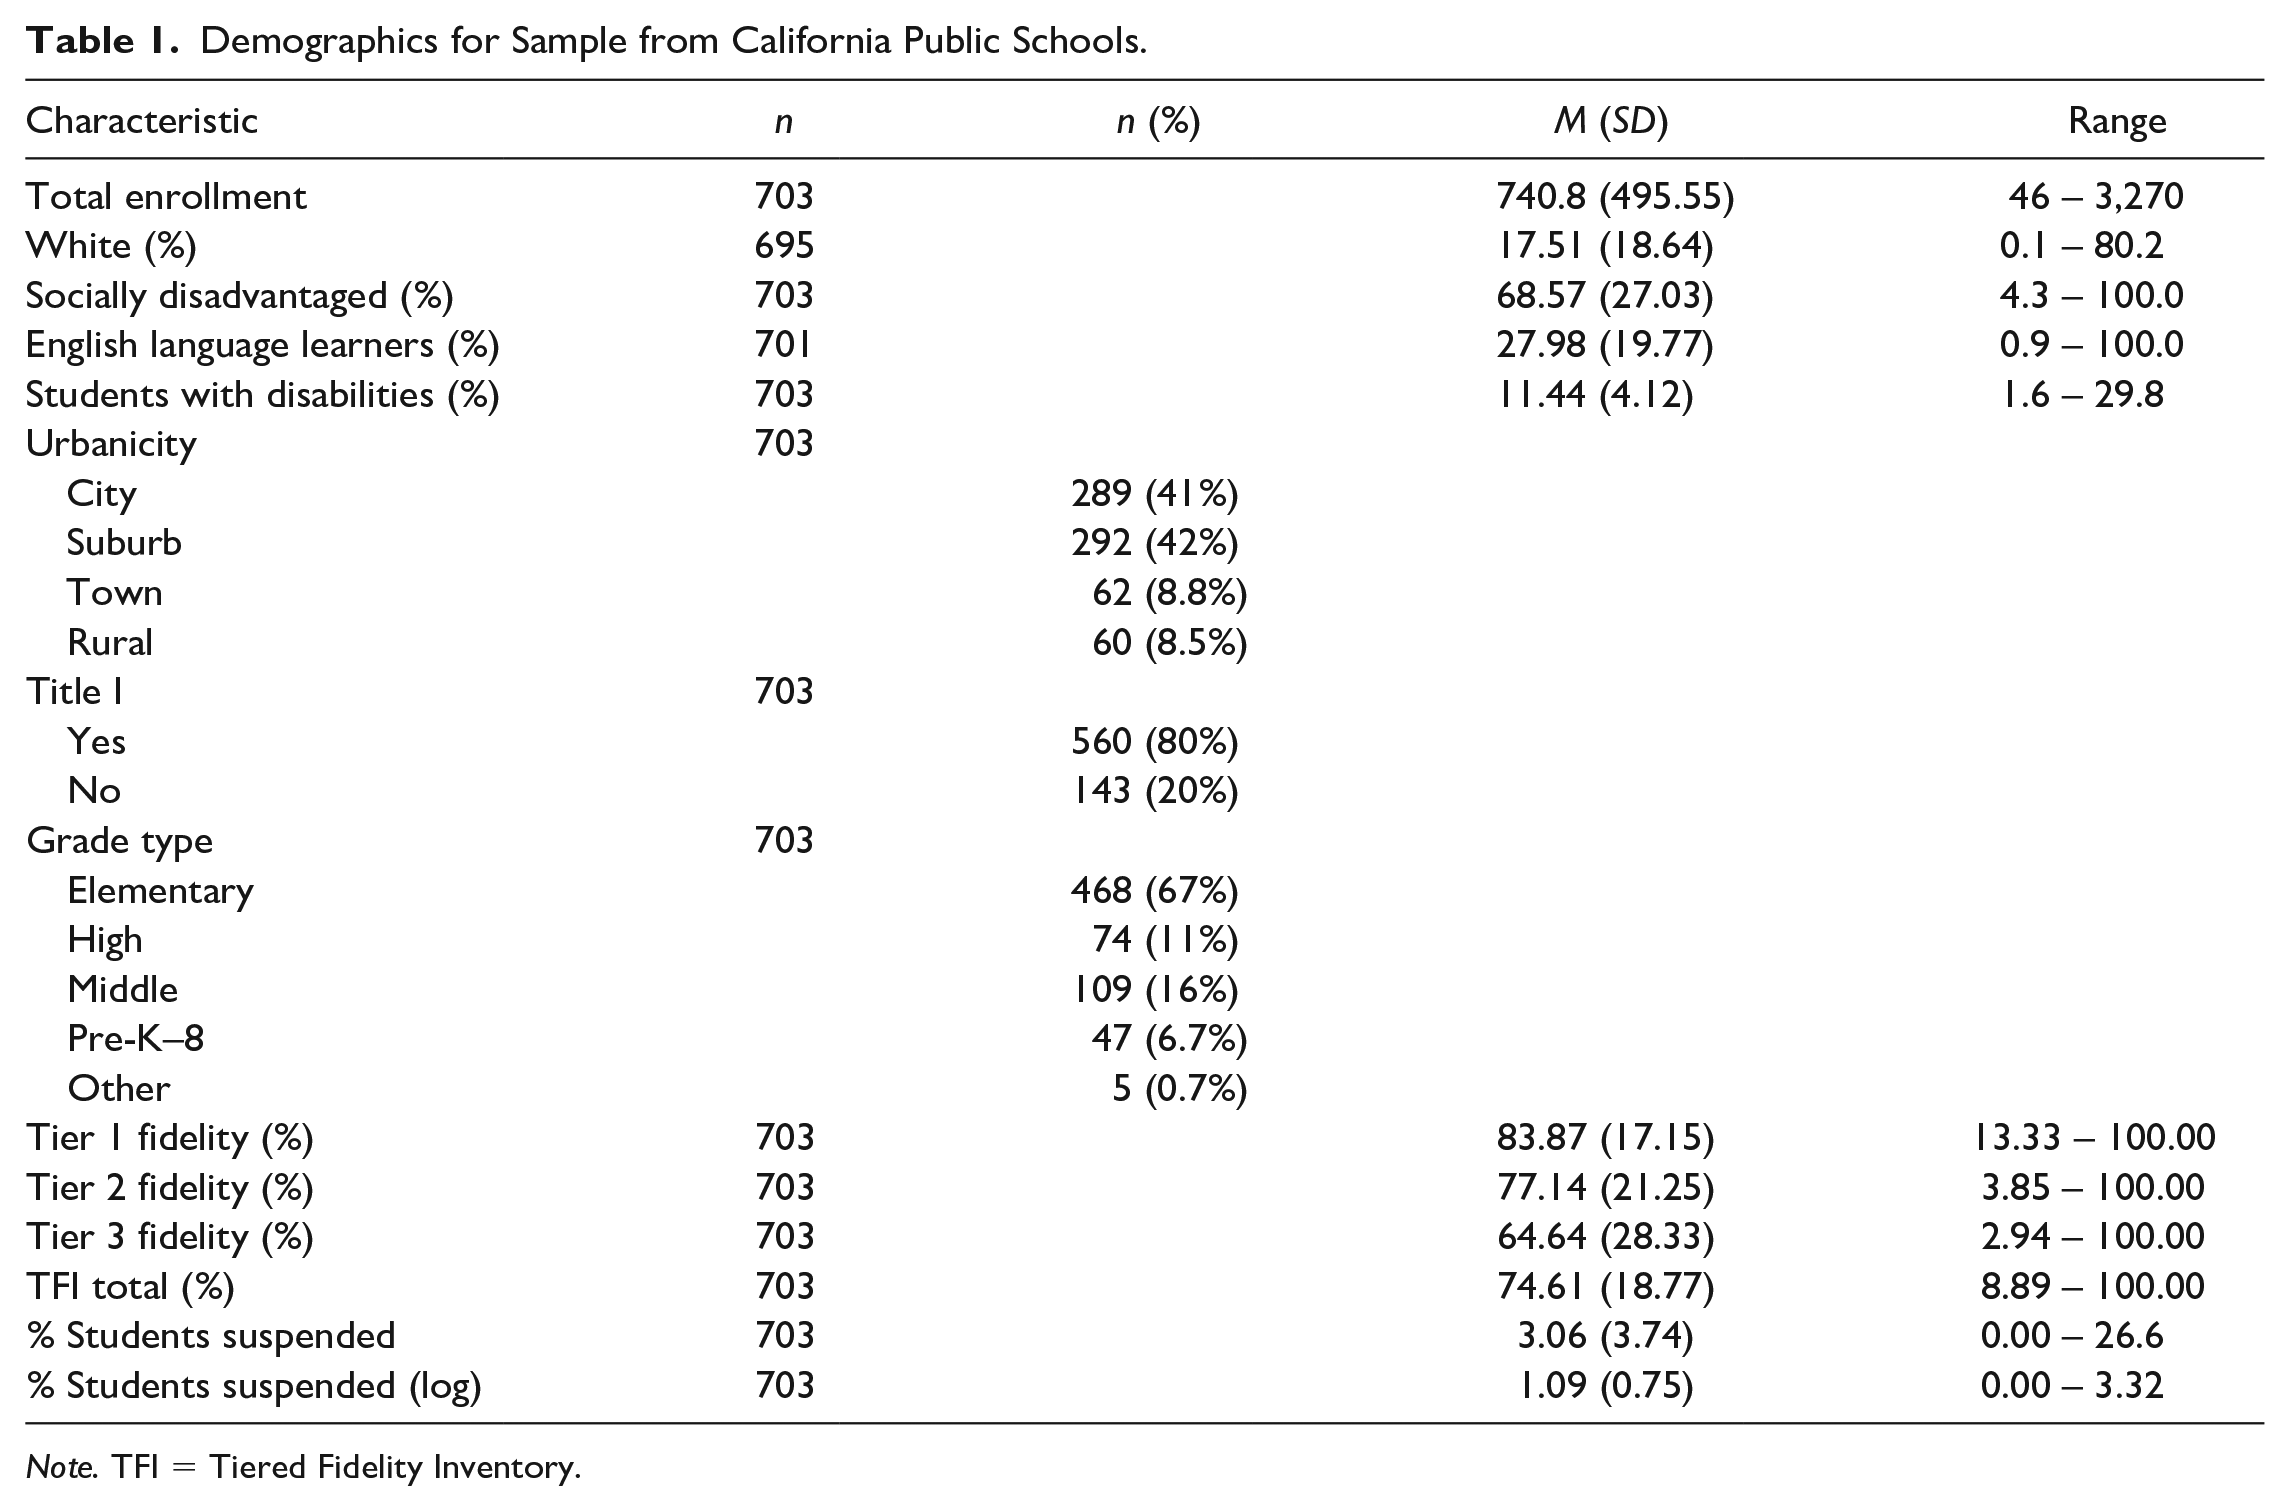
Note. TFI = Tiered Fidelity Inventory.
Suspensions
We obtained suspension data from the SARC. In this dataset, suspensions were reported as the percentage of students receiving at least one suspension during the 2018 to 2019 school year. Specifically, this rate was calculated as the number of students receiving at least one suspension divided by the school’s total enrollment for 2018 to 2019. Typically, districts or state departments of education define criteria for the use of suspensions in schools, providing a more accurate measure of discipline than school-defined measures (e.g., office discipline referrals).
Outcome transformation
Given the positive skew of the percentage of students suspended in this sample, we assessed skew and kurtosis values for three transformations of this variable (i.e., log, square root, and cube root) compared with those for the original scaling (Manikandan, 2010). The log-transformed percentage of students suspended most closely approximated the normal distribution and was thus used for predictive validity analyses.
Data Analysis
Reliability
We conducted internal consistency reliability analyses using both Cronbach’s alpha and McDonald’s ω in R 4.0.3 (R Core Team, 2020) using the psych 2.0.9 package (Revelle, 2020). Cronbach’s alpha is the most reported reliability estimate in psychological sciences (McNeish, 2018); however, this calculation assumes equal loadings across items making up each factor (i.e., tau-equivalence). Each item contributes an equal amount to the latent factor, which is often not an accurate assumption (McNeish, 2018). McDonald’s (1999) ω accounts for unequal factor loadings (i.e., congeneric model) and is thus more flexible and realistic for estimating reliability. For estimating both alpha and omega, we used polychoric correlation matrices given the ordinal nature of TFI items (Gadermann et al., 2012).
Construct validity
All validity analyses were conducted using Mplus Version 8 (Muthén & Muthén, 1998–2017). To test the factor structure of the TFI in this sample, we first used a CFA process in which we specified multiple nested models and tested model fit to establish which model the data most closely resembled. Models increased in complexity, beginning with the original three-factor model established by Massar et al. (2019), then adding latent subscale variables loading onto their respective latent tier variables (see Figure 1). We estimated all models using weighted least squares with adjusted means and variances (WLSMV) given the categorical indicators, and we used theta parameterization to constrain latent response variables to 1. Furthermore, we used cluster robust standard errors to account for nesting of schools within districts using the TYPE = COMPLEX function within Mplus. The ICC for suspensions was 0.26, indicating 26% of variance in suspensions was at the district level and that this correction was warranted.
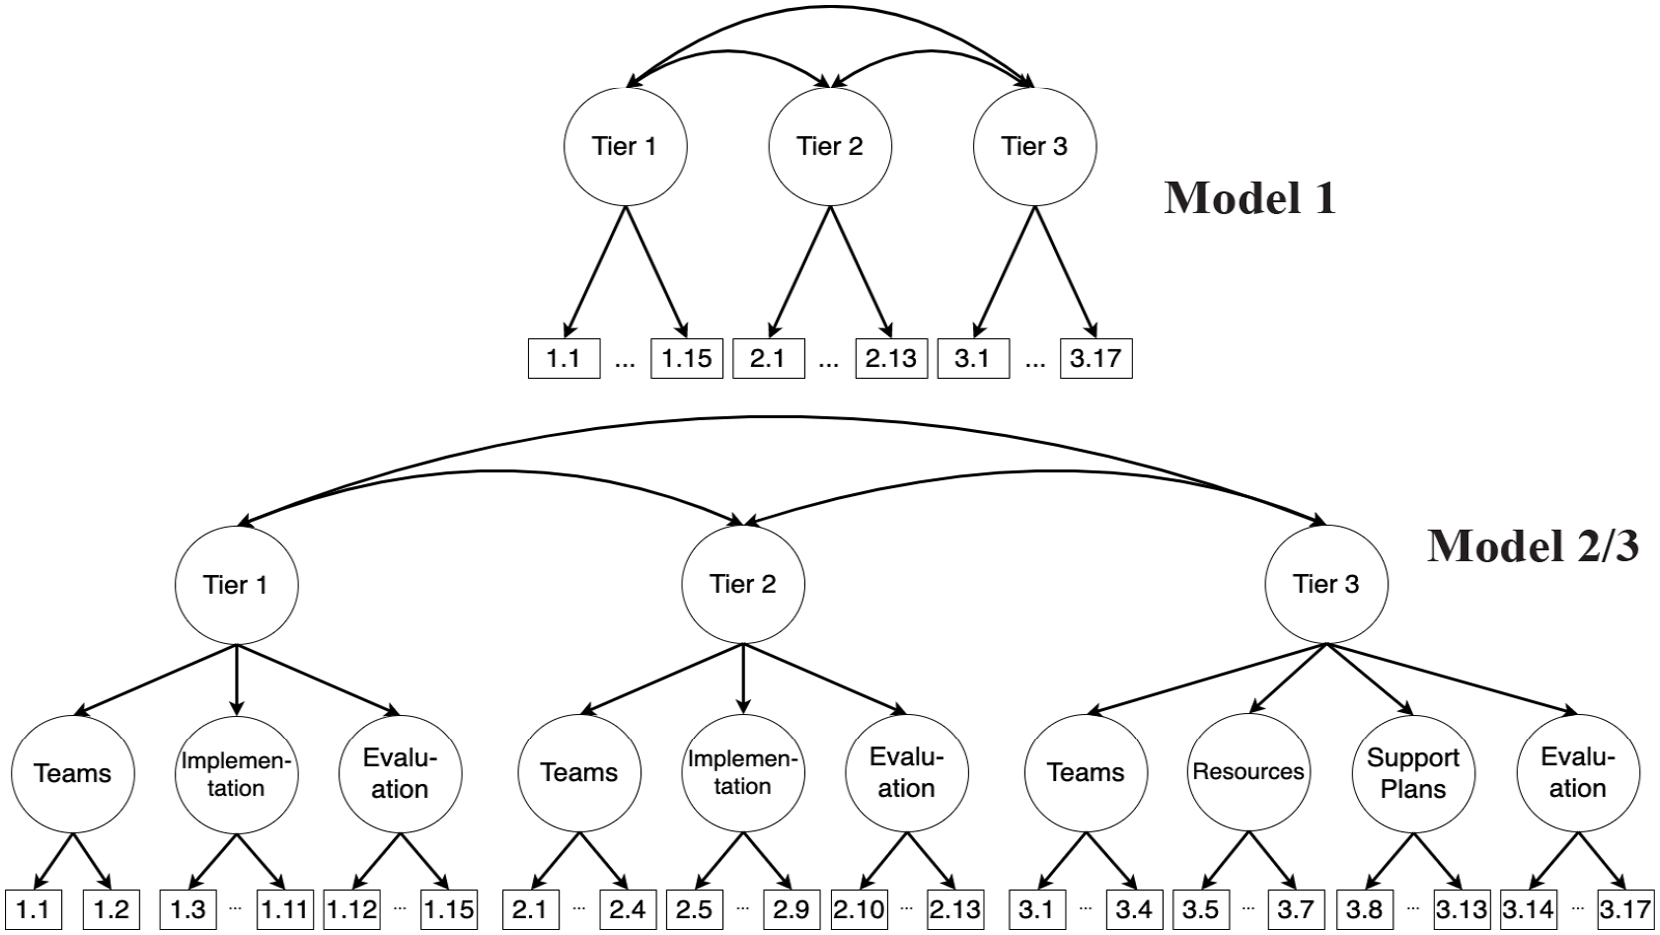
Confirmatory Factor Analysis Models.
We assessed model fit using common criteria proposed by Hu and Bentler (1999). Specifically, we determined sufficient fit using comparative fit index (CFI) and Tucker–Lewis index ≥ .96, root mean squared error of approximation ≤ .06, and standardized root mean squared residual ≤ .09. There are known issues with the performance of these criteria when using WLSMV; however, there are currently no other guidelines for this estimator (Xia & Yang, 2019). After determining adequate model fit, we used the chi-square difference test to compare alternative models and determine the best-fitting model to use for assessing predictive validity.
Predictive validity
Following identification of the best-fitting model, we used structural equation modeling (SEM) techniques to examine the relation between each of the latent variables representing fidelity in Tiers 1 through 3 and the log percentage of students suspended during the 2018 to 2019 school year (see Figure 2). We also used the WLSMV estimator and cluster robust standard errors in the SEM, and included school-level demographic characteristics in the final model. We must note that suspensions are used to explore correlations between constructs that are hypothesized to be related. Thus, we explored the correlation between suspensions and the TFI, not the impact or effectiveness of SWPBIS. Finally, to test the robustness of the results, we conducted a sensitivity analysis by rerunning the model using only secondary (i.e., middle and high) schools (n = 182) as they are more likely to engage in student suspensions than elementary schools.
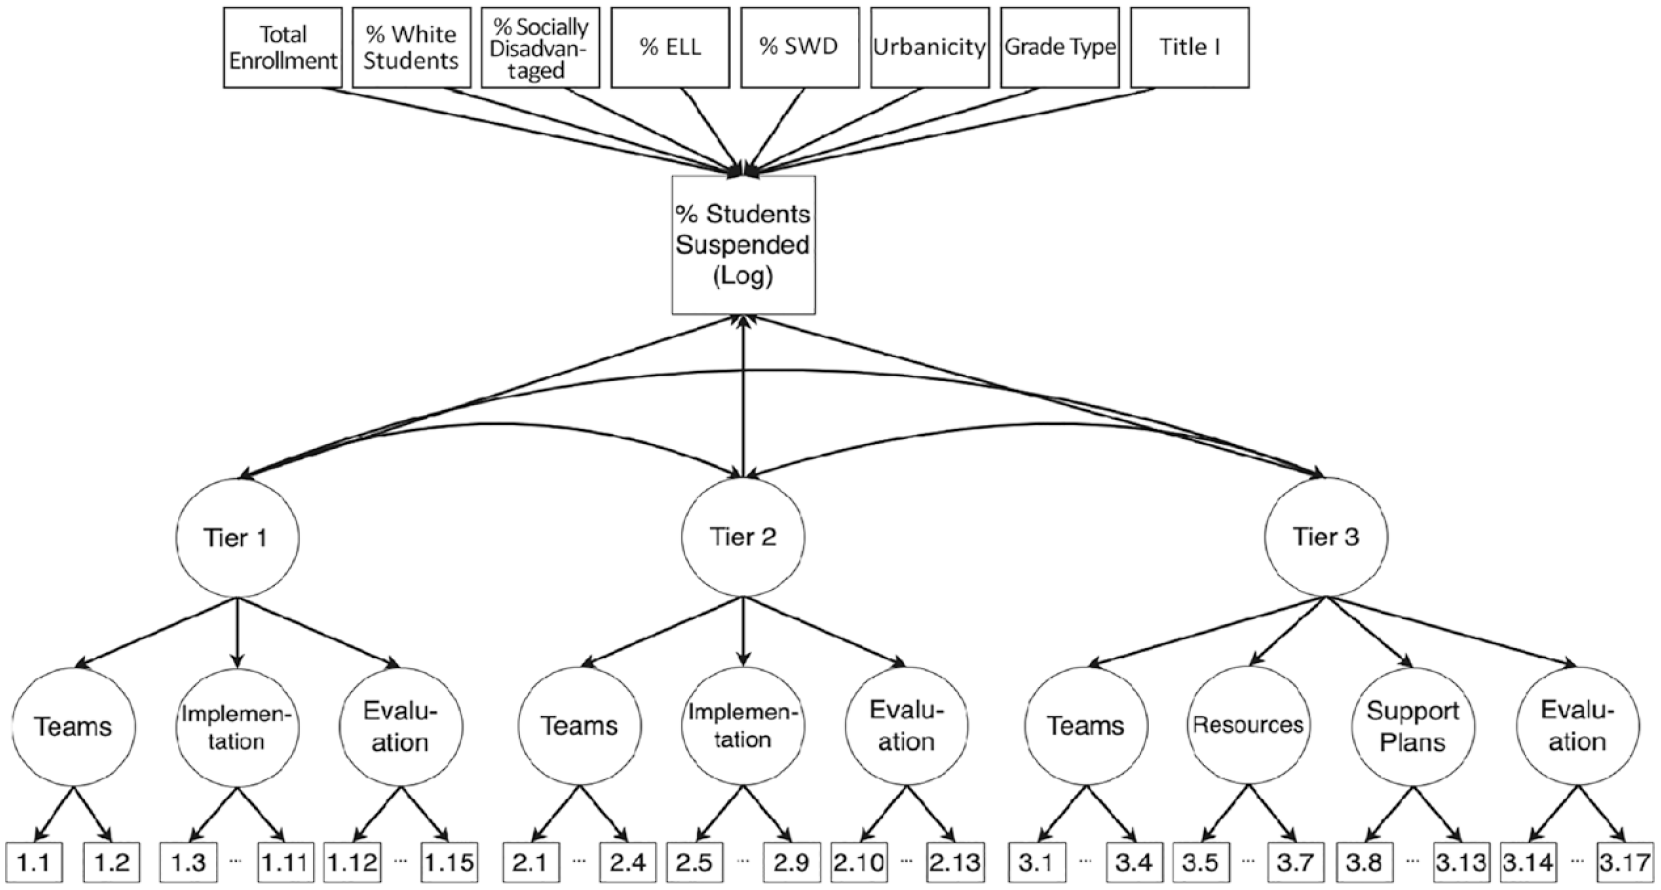
Structural Equation Model.
Results
Reliability
Reliability estimates for this single-state sample were high and like those reported by McIntosh et al. (2017) across multiple states. Ordinal Cronbach’s alpha was 0.94 (95% confidence interval [CI] = [0.934, 0.946]) for Tier 1, 0.95 (95% CI = [0.945, 0.955] for Tier 2, 0.97 (95% CI = [0.967, 0.973]) for Tier 3, and 0.97 (95% CI = [0.967, 0.973]) overall. McDonald’s ω was 0.95 (95% CI = [0.95, 0.96]) for Tier 1, 0.96 (95% CI = [0.95, 0.97]) for Tier 2, 0.98 (95% CI = [0.97, 0.98]) for Tier 3, and 0.98 (95% CI = [0.97, 0.98]) overall.
Construct Validity
Model fit indices are provided in Table 2. All models show good fit per standard conventions, with the likelihood ratio test indicating significantly better fit for the more complex, hierarchical Model 2 compared with Model 1 (χ2(10) = 130.395, p = <.001); however, Model 2 contained a latent variable with a negative residual variance (i.e., Heywood case) and thus should not be used (Chen et al., 2001). Given the negative variance was near 0, we modified the model to manually constrain that residual variance to 0.001 (Model 3) then again compared model fit to Model 1, resulting in better fit for Model 3, χ2(9) = 125.373, p = < .001. Correlations between latent tier factors were as follows: Tier 1 and Tier 2 r = 0.787 (SE = 0.029, p < .001); Tier 1 and Tier 3 r = 0.477 (SE = 0.056, p < .001); Tier 2 and Tier 3 r = 0.707 (SE = 0.035, p < .001).
Model Fit Indices.
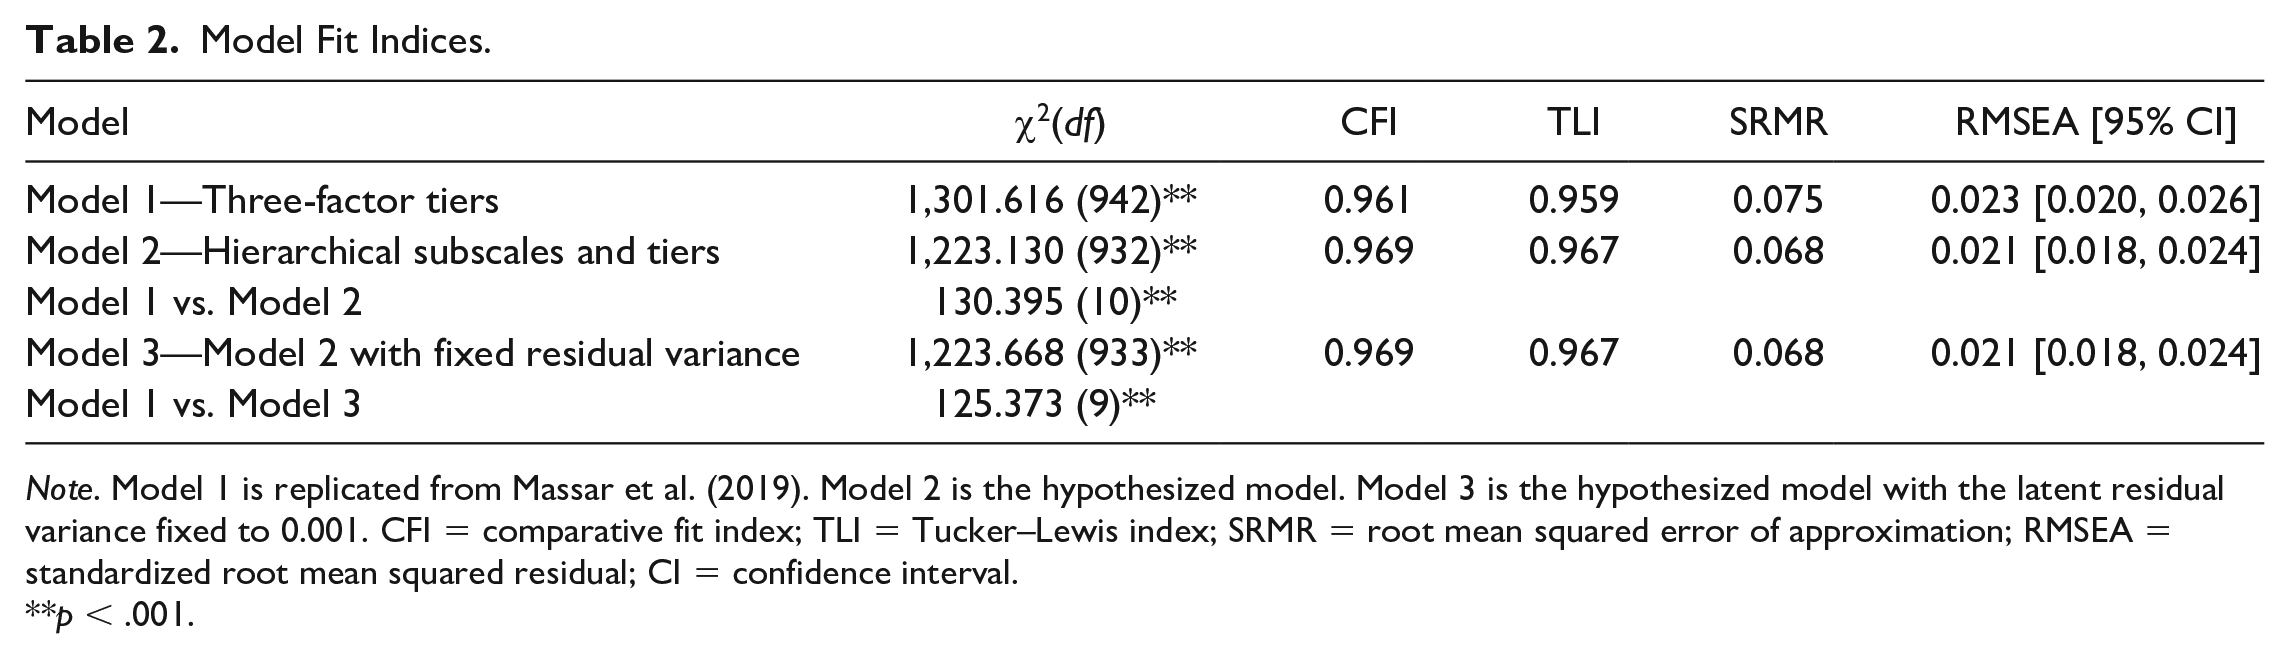
Note. Model 1 is replicated from Massar et al. (2019). Model 2 is the hypothesized model. Model 3 is the hypothesized model with the latent residual variance fixed to 0.001. CFI = comparative fit index; TLI = Tucker–Lewis index; SRMR = root mean squared error of approximation; RMSEA = standardized root mean squared residual; CI = confidence interval.
p < .001.
Predictive Validity
Parameter estimates for the SEM are presented in Table 3. Despite strong model fit, there were no statistically significant relations between any latent tier fidelity variables and changes in the log percentages of students suspended, indicating no observed relation between latent fidelity and changes in suspensions in this sample. Furthermore, the sensitivity analysis suggests that, while the directionality changed on the latent tier fidelity variables, the results are robust and hold for the secondary schools’ subsample, with no statistically significant relations between any latent tier fidelity and log percentages of students suspended. SEM parameter estimates for secondary schools only are available in Supplemental Table 1.
Structural Equation Model Standardized Parameter Estimates.
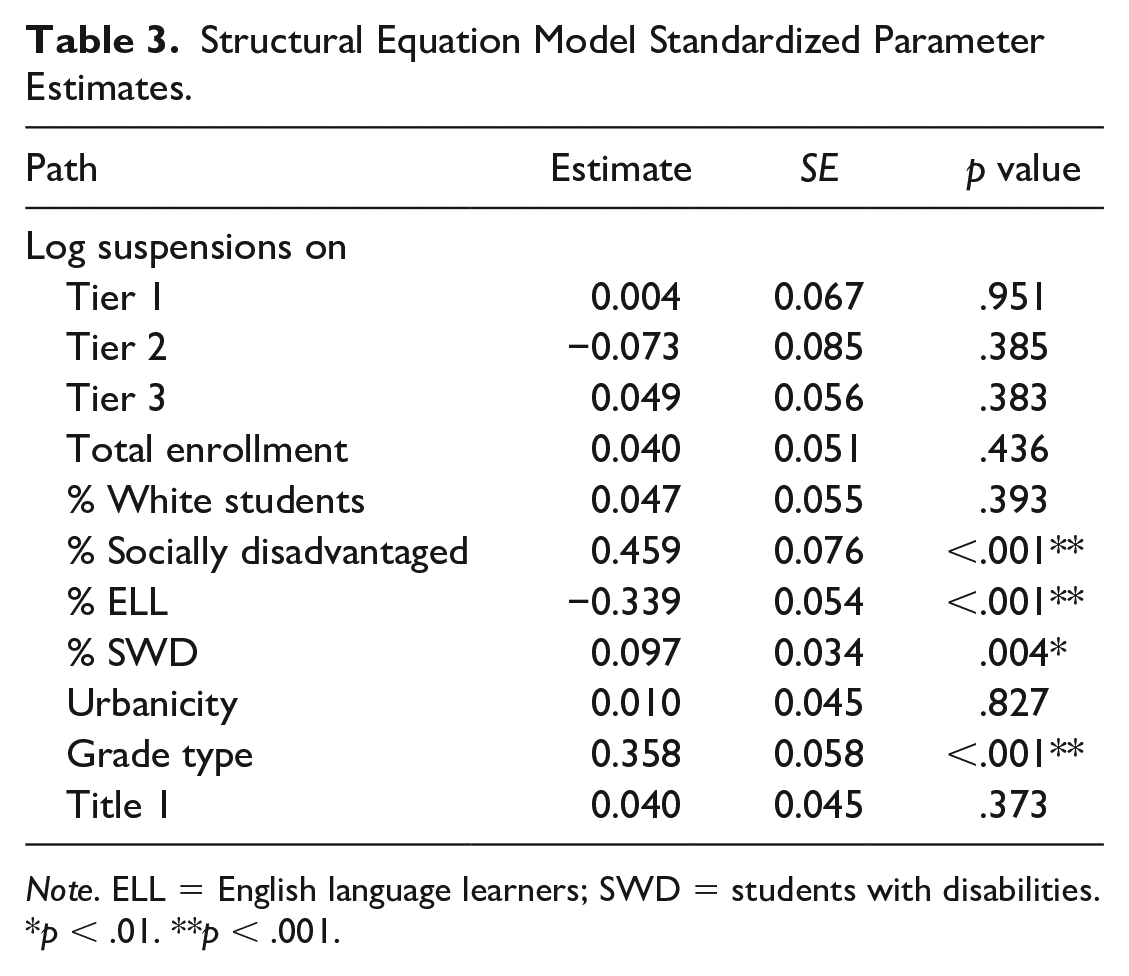
Note. ELL = English language learners; SWD = students with disabilities.
p < .01. **p < .001.
Discussion
School-wide positive behavior interventions and supports is one multi-tiered framework for supporting student behavior outcomes. Research suggests SWPBIS, when implemented with fidelity, is associated with decreases in disciplinary exclusions (Lee & Gage, 2020). Although many fidelity tools exist, the TFI is currently recommended by the Center on PBIS and was developed to measure all three tiers. This study re-evaluated the reliability and validity of the TFI using an independent sample of 693 California schools in 2018 to 2019 and determined if there was a relation between fidelity as measured by the TFI and the percentage of students suspended.
Results of this study suggest the TFI maintained strong reliability in this large, single-state sample. Furthermore, reliability estimates were similar to those originally observed by McIntosh et al. (2017) and followed the same order of magnitude (i.e., Tier 1 had the lowest reliability estimate and Tier 3 had the highest).
The CFA also suggests the TFI maintained the content validity reported by Massar et al. (2019), with good model fit observed when we replicated their proposed factor structure in this sample. Merging Massar et al.’s two proposed factor structures into a hierarchical model resulted in even better model fit. This suggests the latent constructs of fidelity at each tier are made up of latent constructs based on the tier’s subscales. These results indicate the need for further theoretical discussion of construct of fidelity within SWPBIS. For example, the results of this study suggest that different approaches to scoring may provide a more accurate representation of subscale and overall fidelity.
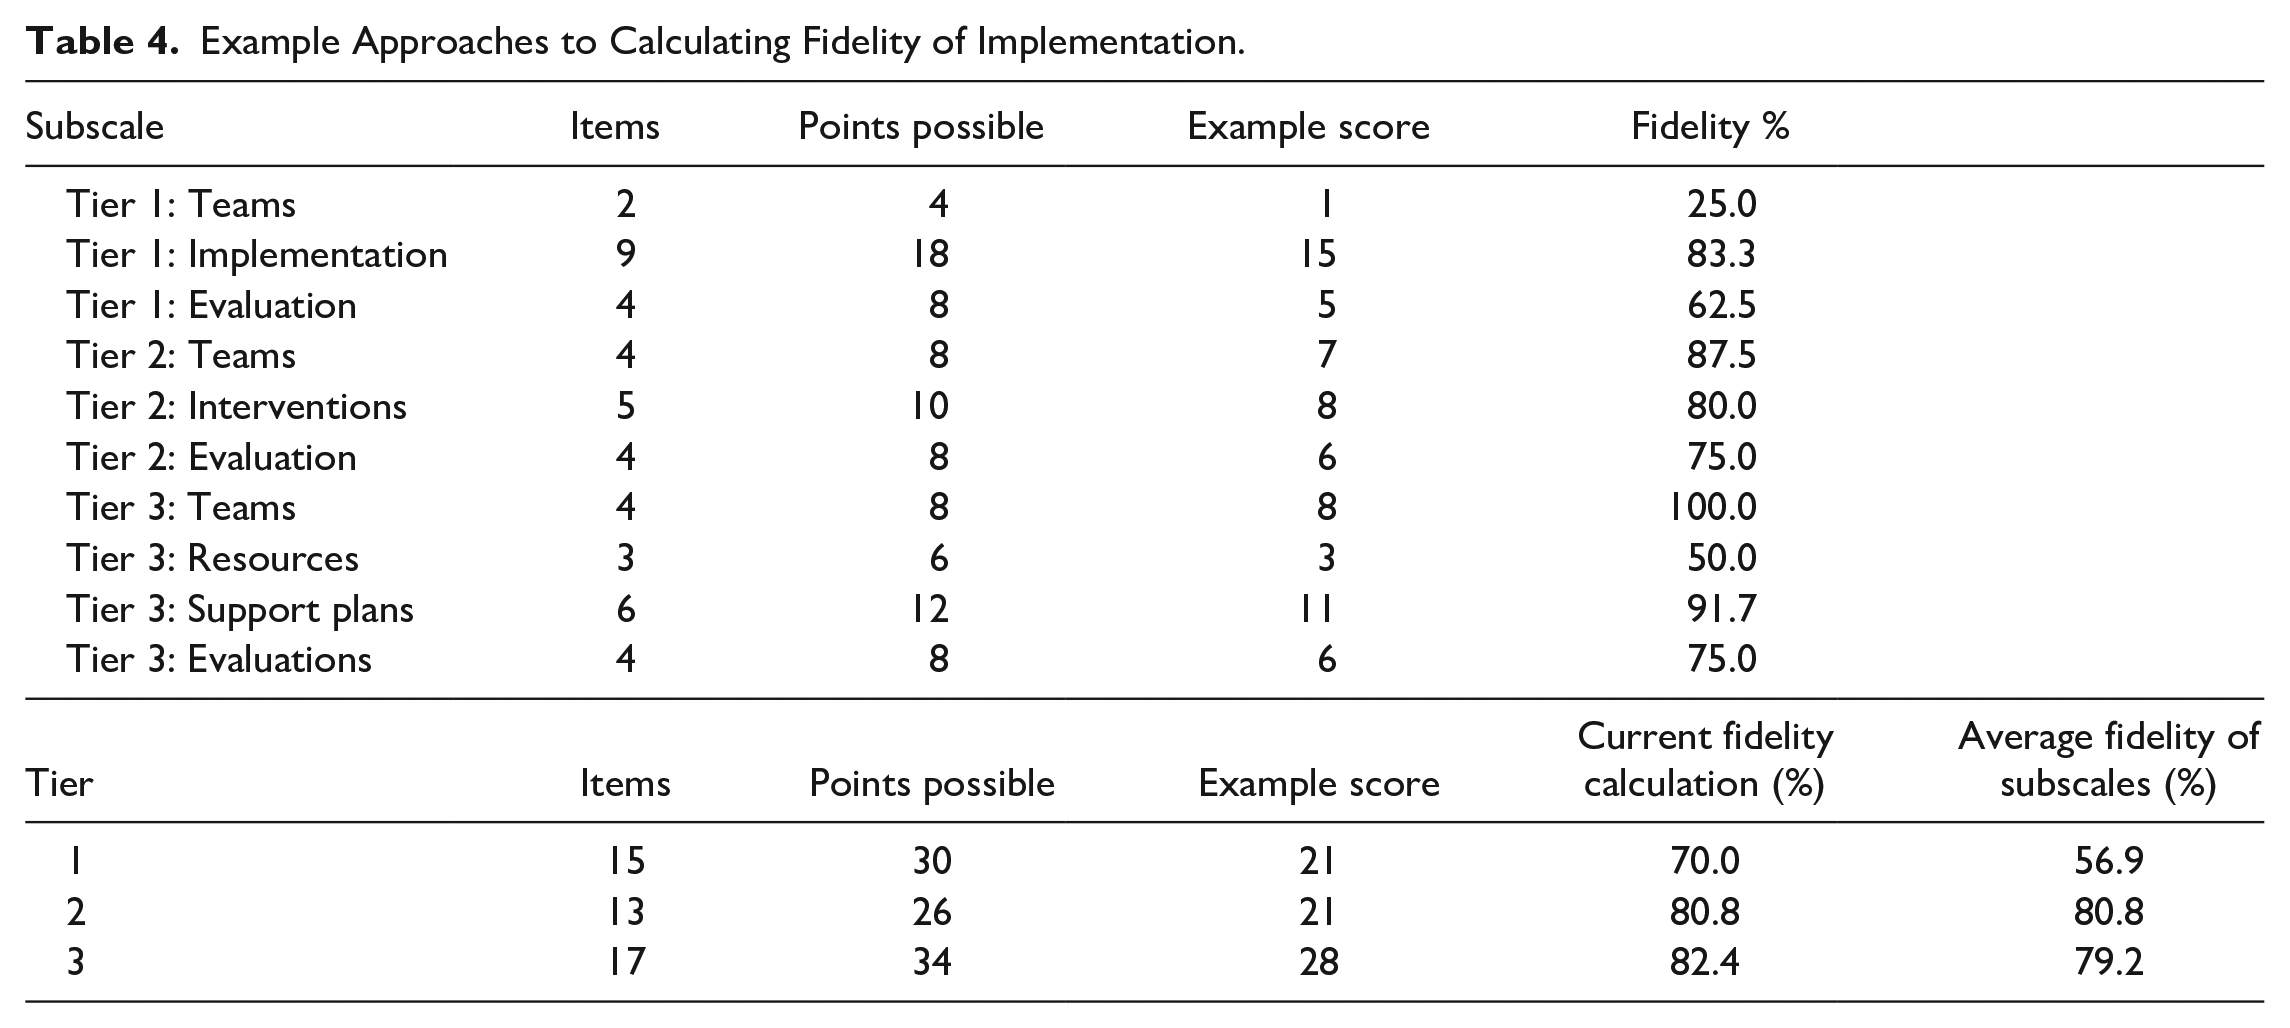
Currently, the total score within each subscale and then within each tier is used to calculate the percentage of implementation items met. Each item is worth up to two points, and then the total points earned are divided by the total number of points available at either the subscale or tier. Yet, given the findings here, the assumption that items contribute or “load” equivalently to the construct does not hold. A model with subscales loading onto tiers fits better than items loading onto tiers. Thus, instead of treating each individual item as equal at the tier level, the item’s contribution to the subscale and then to the tier should be considered. This does not require a complex weighting procedure, although future research could explore that option. Instead, fidelity at the tier level may be better represented as the average fidelity of the subscales representing that tier. Specifically, each subscale could be scored as a percentage (i.e., total subscale points divided by possible subscale points multiplied by 100), but then the percentages for each subscale within a tier would be averaged (i.e., sum the percentages and divide by the number of subscales in that tier). Using the subscale percentages allows each subscale to contribute more or less to the overall tier fidelity score depending on the number of items within the subscale. An example of randomly generated data is presented in Table 4. At Tier 1, the average fidelity assuming each item contributes equally is 70%. However, the average fidelity at Tier 1 using the fidelity at the subscale level would be 57%, primarily because the Tier 1 Teaming subscale score is so low. Much more research is needed, but considerations about scoring are necessary given the hierarchical model results.
Example Approaches to Calculating Fidelity of Implementation.
We were unable to confirm the predictive validity of the TFI on changes in the percentage of students suspended in this sample, along with a subsample estimating this effect for only secondary schools. Importantly, prior studies have found the effects of SWPBIS fidelity as a dichotomous variable (i.e., fidelity or no fidelity). In this study, the latent fidelity variables in the structural equation model are on a continuous scale. Thus, the model estimates whether an increase in latent variable scale scores is associated with a decrease in the percentage of students suspended. Given this scaling, it is unsurprising that there was no statistically significant relation between the latent tier fidelity variables and changes in suspensions as the differences in a few scale points may not be indicative of implementing each tier with fidelity. This finding should drive further discussion and research on the construct of SWPBIS fidelity with respect to benchmarks assigned by measurement developers and whether fidelity is a dichotomous or continuous construct. There is a need to further explore fidelity cut scores and the cut scores association with related constructs. For example, is there a cut score that accurately predicts fidelity on a related scale, or, perhaps more interesting, a cut score that predicts fewer suspensions? This research could include receiver operating characteristic (ROC) curve analysis and other cut-score psychometric approaches. Future research could also consider analyzing TFI data using item response theory and Rasch models for item calibration and new scoring methods.
Limitations
Several limitations in this study warrant discussion. First, we relied on administrative data for both TFI scores and suspension data. As such, we were unable to confirm the reliability between reported data and actual implementation or outcomes. Given both TFI data and suspensions were reported for state-level programs, there is a higher likelihood of their accuracy, but this cannot be evaluated currently. Second, our exploratory SEM analyses were limited by the use of a single dependent variable (i.e., suspensions) and the scaling of the latent fidelity variable. We found no change in suspensions given a 1% increase in the latent TFI fidelity variable; however, most prior research has dichotomized implementation as with or without fidelity rather than on a continuous scale. As such, this result is not unexpected. Future research using an SEM framework should further explore the dichotomized fidelity outcome to determine if results are similar to prior studies or consider latent class modeling to create categories of implementers. We also suggest exploring the predictive validity of the TFI using other outcomes previously associated with SWPBIS fidelity. Finally, we acknowledge that the TFI is a self-report measure, and the scores may not truly represent fidelity, but instead school staff perceptions of fidelity. Future research should continue to explore the accuracy of the TFI.
Conclusion
There is a strong evidence base suggesting schools use less punitive discipline when implementing SWPBIS with fidelity (Lee & Gage, 2020). It is critical to measure fidelity of implementation for SWPBIS implementation to inform research and practice (e.g., strategic systemic action planning). In this study, we found evidence that the TFI, currently recommended by the Center on PBIS, maintains internal consistency reliability and construct validity within a large, single-state sample of schools. The results of this study suggest further discussion of the construct of fidelity of implementation with regard to SWPBIS is warranted to better understand the general and underlying constructs.
Supplemental Material
sj-docx-1-pbi-10.1177_10983007231167606 – Supplemental material for Re-Examining the Reliability and Validity of the SWPBIS Tiered Fidelity Inventory
Supplemental material, sj-docx-1-pbi-10.1177_10983007231167606 for Re-Examining the Reliability and Validity of the SWPBIS Tiered Fidelity Inventory by Nicolette M. Grasley-Boy, Nicholas A. Gage, Michael Lombardo and Lucas Anderson in Journal of Positive Behavior Interventions
Footnotes
Declaration of Conflicting Interests
The author(s) declared no potential conflicts of interest with respect to the research, authorship, and/or publication of this article.
Funding
The author(s) received no financial support for the research, authorship, and/or publication of this article.
Supplemental Material
Supplemental material for this article is available on the Journal of Positive Behavior Interventions website with the online version of this article.
References
Supplementary Material
Please find the following supplemental material available below.
For Open Access articles published under a Creative Commons License, all supplemental material carries the same license as the article it is associated with.
For non-Open Access articles published, all supplemental material carries a non-exclusive license, and permission requests for re-use of supplemental material or any part of supplemental material shall be sent directly to the copyright owner as specified in the copyright notice associated with the article.