
Abstract
The Mystery Motivator intervention has been shown to increase prosocial behavior among school-age children by capitalizing on the anticipation afforded by reward concealment or randomization. Although numerous evaluations have supported the effectiveness of the Mystery Motivator, the overall status of this intervention is still unknown. The purpose of the current meta-analysis was to quantify the effects of the Mystery Motivator for improving behavior outcomes in school-age children and determine if participant, setting, and intervention components moderate intervention effects. A systematic review of academic databases was conducted that yielded a total of 24 studies. These studies were evaluated for methodological rigor and analyzed for effects using Tau-U. Results indicate a strong overall effect for this intervention (Tau-U = .77 (CI95 [.73 to .80]). The results discussed and practical issues are considered for future research on the use of the Mystery Motivator to promote the academic and social-emotional development of children and adolescents.
Challenging behavior in children and youth can significantly hinder their access to academic curriculum and opportunities for social-emotional development (Fox et al., 2009). Previous research has shown that persistent social and academic difficulties have potential to result in a more restrictive educational placement and exclusion from social and academic activities (Jull, 2008; Lamport et al., 2012). Fortunately, a literature has been established supporting the effectiveness of various behavioral interventions for improving the academic abilities and social-emotional skills of school-age children (Freeman et al., 2019; Korpershoek et al., 2016). Furthermore, it is important that established behavioral interventions be highly efficient to promote their adoption in a variety of settings (Garwood et al., 2020).
The Mystery Motivator (MM) is one such strategy with a long research history supporting its usefulness for improving behavioral and academic outcomes in school-age children (Rhode et al., 1992). From its original publication, the MM intervention was structured to randomize the delivery of reinforcement to increase anticipation for and interest in the reward (Rhode et al., 1992). A unique aspect of this intervention relates to the presentation of the reward; specifically, the ability to access the reward is unknown to the child by way of randomizing rewards and their scheduled delivery, or physically concealing the MM. An interventionist establishes a reward criterion which, when met, provides the child with an opportunity to access the MM, which may or may not occur.
Since the introduction of the MM roughly 30 years ago, numerous empirical evaluations of the intervention lend to its ability to engender positive outcomes in various child populations and within distinct treatment settings (Kowalewicz & Coffee, 2014; Madaus et al., 2003). Notwithstanding the positive outcomes associated with the MM intervention, the structure of its implementation has shown to vary considerably within the literature, leaving much to be said in terms of the overall status of the MM literature base. Synthesizing the variable methodology of published literature on the MM is important as current evidence-based practice evaluation paradigms (e.g., What Works Clearinghouse [WWC], 2020) call for consideration of specific characteristics of individuals who benefit from specific intervention modalities. To date, no systematic reviews or meta-analyses have been conducted on the MM intervention.
The MM Intervention
Participant Characteristics, Settings, and Outcomes
Previous studies have demonstrated efficacy of the MM intervention with a variety of participants. Specifically, MM is effective in increasing supporting outcomes in early childhood (Pre-K; Ling & Barnett, 2013), elementary (Kraemer et al., 2012; Mottram et al., 2002), and secondary (Theodore et al., 2001) educational settings. In addition, a dichotomous version of participant gender will be evaluated, consistent with reporting in previous studies. Despite compelling evidence of positive behavioral outcomes in individual studies, to date, results have not been aggregated to determine differential effects by participant characteristics. The current study will serve to direct future use of this intervention with attention to the characteristics of participants that are best served and under what conditions.
MMs have been implemented in several settings, such as schools (Theodore et al., 2001), homes (Lasecki et al., 2008), and residential programs (Goldman, 2004). A majority of studies reporting on the use of the MM occurred in school settings and with neurotypical (Madaus et al., 2003) and neurodiverse students (Whitney et al., 2018). While it is important to determine the settings most amendable to the MM, consideration should also be given to the specific behaviors the intervention has shown to effectively address. For instance, previous research has found the MM intervention to result in improved instruction following with educator requests, and academic work completion and accuracy (Lasecki et al., 2008; Lynch et al., 2009; Reinhardt et al., 2009). Additionally, the MM has been shown to decrease disruptive behaviors, such as inappropriate verbalizations (Coogan et al., 2007) and off-task behavior (De Martini-Scully et al., 2000). Nonetheless, the widespread application of the MM signals more information is needed to identify the populations and behaviors that are most receptive to the intervention.
In addition to participant characteristics, the structure of the MM intervention has a central role in determining the feasibility of its implementation. Within this analysis, we also compare intervention components (e.g., specific procedures followed) that vary among published studies to inform educators and researchers on how to optimize intervention-related procedures. These components include various schedules of reinforcement, types of reinforcement, materials used for the intervention, and reinforcer choice.
Intervention Components
The MM system capitalizes on the stable responding characteristic of variable schedules of reinforcement, where an individual is unaware of when and if they will access the reward after meeting a specific behavioral criterion. For example, in the initial MM intervention (described by Rhode et al., 1992), the behavioral criterion (e.g., staying on task) may require that a child earn five tokens before being allowed to remove a sticky note from the current day on a weekly or monthly chart to see whether “MM” was present. If MM was present on that day (i.e., reward delivery), the interventionist would provide the child with the mystery envelope and the specific MM concealed within (i.e., reward access). In this fashion, there are three schedules that must be met before the child is granted access to the reward: (a) fixed ratio behavior criteria to access the weekly or monthly chart, (b) variable interval reward delivery, and (c) continuous reward access.
Although children are notified of the specific behavior they must demonstrate in order to earn the reward, the reward itself remains a mystery (Jenson et al., 1994). When a child’s behavior meets the criteria for reinforcement, the intervention requires material (e.g., envelopes, jars, reward spinners, or charts with invisible ink) to randomize reward delivery and access. There are several ways in which the reinforcement system can be randomized to promote motivation and anticipation. In many cases, it is the actual reinforcer (i.e., the “MM”) that is randomized (Lasecki et al., 2008). While some studies randomized the days on which reinforcement is available (Madaus et al., 2003; Moore et al., 1994; Robichaux et al., 2013), others randomized the behavioral criterion children must meet in order to earn reinforcement (e.g., turning in 70%, 80%, or 90% of homework assignments; Coogan et al., 2007; Hawkins et al., 2009; Kelshaw-Levering et al., 2000).
In addition to schedules of reinforcement, reward choice may also serve as a key role in the potential effect of the MM intervention. Previous research has found that reinforcers that are carefully and systematically selected are most effective (Mason et al., 1989). These findings signify the importance of employing socially valid procedures when determining reinforcers to be used during intervention. Indeed, a wealth of research investigating methods for identifying reinforcer preferences has shown that interventionist-determined and child-determined methods are the two most commonly implemented procedures for identifying putative reinforcers (Lohrmann-O’Rourke & Browder, 1998).
The interventionist-determined method involves the interventionist selecting rewards to be used during intervention without child input. Decisions for reinforcement are often based on perceived child interests and interventionist perceptions of acceptable rewards. Conversely, the child-choice method entails a discussion between the interventionist and child to identify desired rewards to be used during the intervention (Mintz et al., 2007). Substantial evidence lends to the positive effects of involving the child in the decision-making process during intervention planning (Patall et al., 2010). In an effort to illustrate this influence, studies that compared the effectiveness of interventionist- versus child-determined rewards found that higher rates of desired outcomes may be achieved in interventions that incorporate child involvement in reward decision-making (Cosden et al., 1995; Graff et al., 1998). Due to the potential significance of this involvement, the current study investigated the impact of child participation in the decision of the reward.
Given the widespread, and variable, use of this intervention, a quantitative synthesis is needed. The purpose of this meta-analysis was to aggregate effect sizes (ESs) of the MM intervention for behavioral outcomes and examine differences across several moderator variables that may impact implementation decisions. Information on the existing state of the literature can be used to design studies, extend knowledge, and confirm findings from previous studies. Thus, this meta-analysis aimed to create such a knowledge base related to the MM intervention.
Research Questions
What is the aggregate effect of MM interventions that focus on the improvement of behavior in school-age students?
Are there differential effects based on variables related to participant characteristics (i.e., age, gender), setting, and dependent variables?
Do intervention components (e.g., behavioral criteria; reinforcement delivery; reward access; reward variation; reward decision; and reward awareness) impact the degree of improvement?
Method
Search Procedures
This review followed the Preferred Reporting Items for Systematic Reviews and Meta-Analyses (PRISMA) guidelines (Liberati et al., 2009). A search of the behavioral and education literature base was conducted across ten academic bibliographic databases, including Academic Search Premier, Education Full Text (H.W. Wilson), ERIC, MasterFILE Complete, Primary Search, PsycARTICLES, PsycINFO, and Psychology and Behavioral Sciences Collection. A total of six search terms were developed in order to identify behavioral interventions that had been implemented across any setting: (a) MM, (b) mystery reward, (c) mystery AND behavioral intervention, (d) mystery AND academic intervention, (e) group contingency AND reward, and (f) group contingency AND random*. The primary search included both peer-reviewed and non-peer-reviewed literature published from January 1992 to May 2023, which yielded a total of 7,519 unique records after removing duplicates. In addition, nine records were identified from a hand search of the literature. In total, our initial search procedures resulted in 7,528 records.
Inclusion Criteria
To be included in this review, articles had to meet the following six inclusion criteria: (a) the article had to be an empirical intervention study utilizing single case design (SCD) methodology; (b) the article had to display results in an SCD graph; (c) the article had to describe the use of “MM” or reference Rhode et al. (1992) in the description of its intervention procedures; (d) the article had to report the use of a single-component intervention (i.e., not a packaged intervention); (e) the article had to include a behavioral outcome (as described in the coding section below); and (f) the article had to meet WWC SCD standards (WWC, 2020). The decision to include only SCDs was made to assure continuity in the expression of effect.
Figure 1 displays the PRISMA article screening process. Three graduate students independently reviewed one-third of the articles at each stage of the screening process. First, the title and abstract of 7,528 articles were screened for content related to the use of the MM. Following this stage, a full-text review of the remaining 155 articles (140 from bibliographic databases and nine from hand search) was conducted; each study was assessed for continued eligibility during the full-text review. At this stage, 20% of articles were reviewed by two reviewers. Initial agreement was 92%, and all disagreements were reconciled through discussion with the research team to 100%. All included studies were reviewed by the research team with 100% agreement. Ultimately, a total of 24 articles were included in the analytic sample. Once articles were selected, each SCD and participant within the article was evaluated.
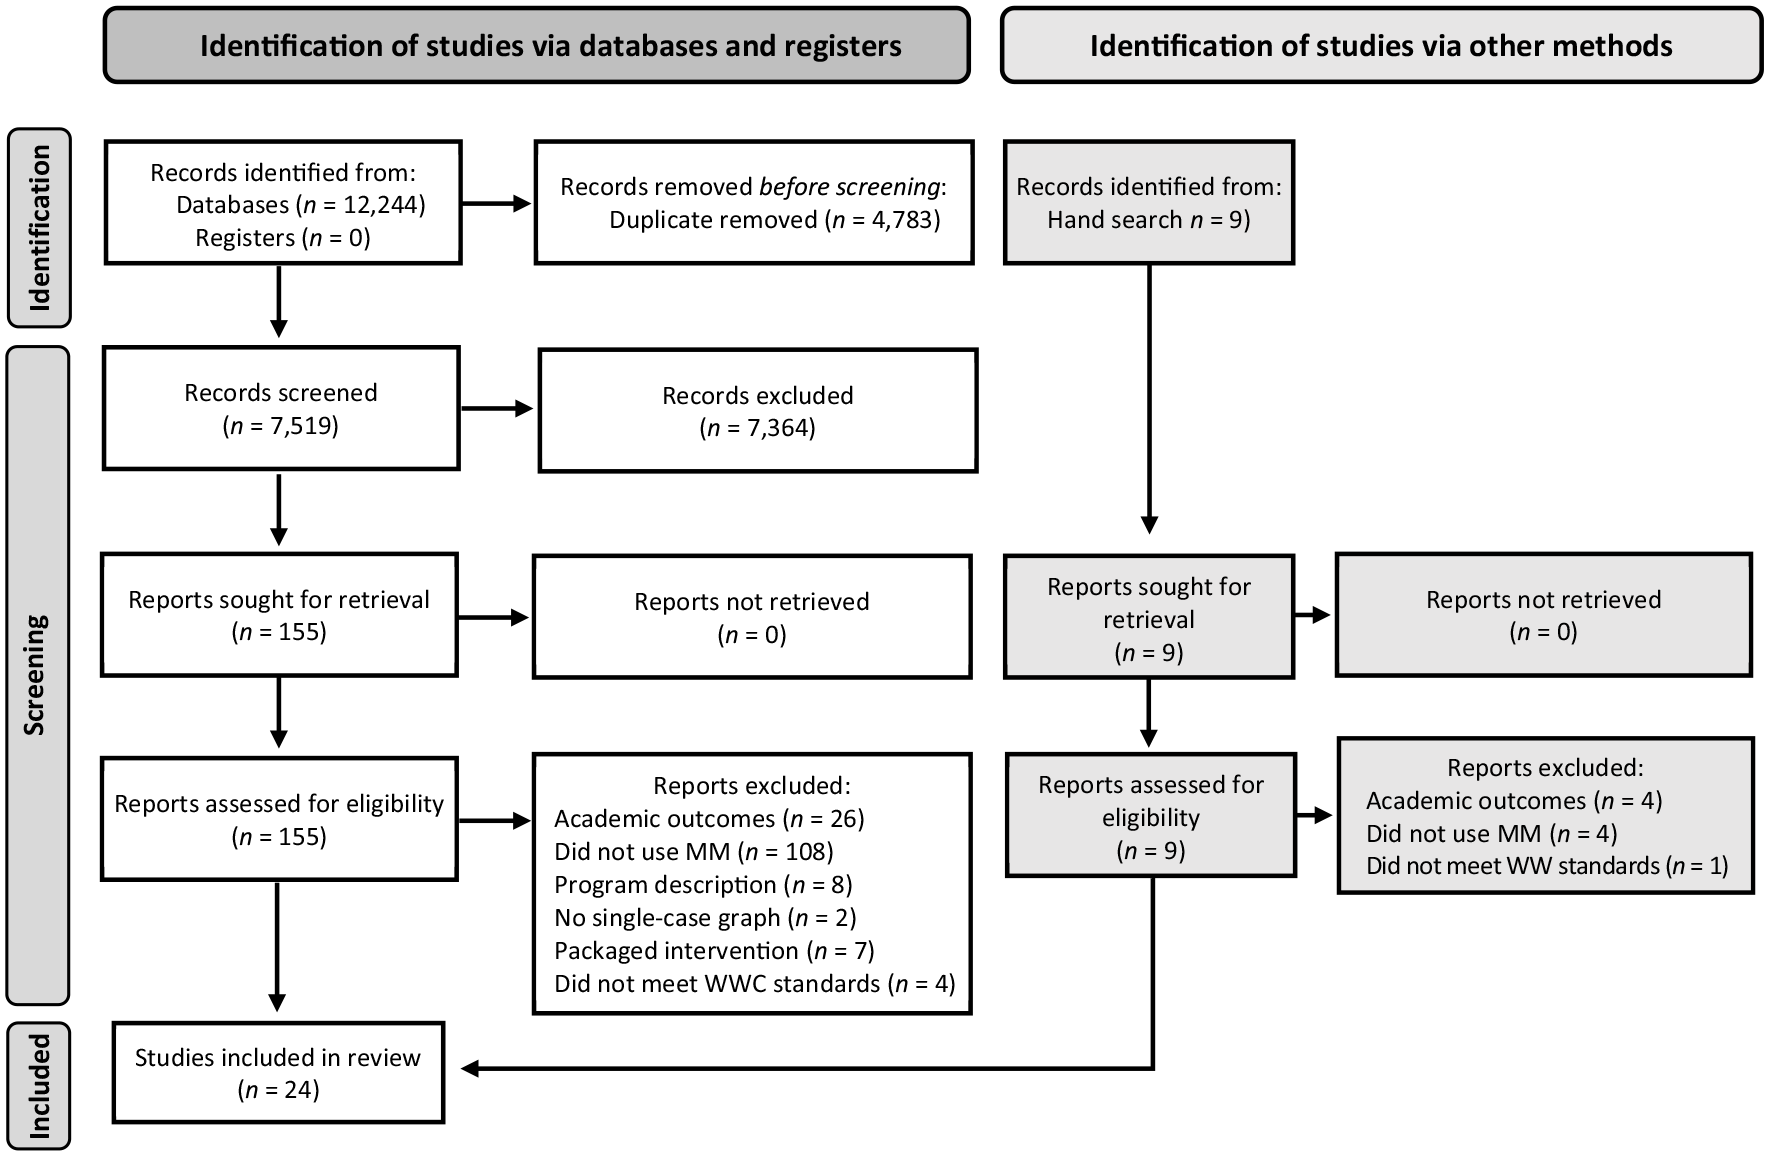
PRISMA article screening process.
Data Extraction
Researchers used the WebPlotDigitizer program (Rohatgi, 2017) to extract graphical data from each of the 24 included articles. Within this graphic analysis program, the scale of each graph was marked based on the x and y axes. An exact numerical value was derived for each data point to the whole number, and the values were organized by phase (e.g., baseline or intervention). Following the data extraction, each study was coded for intervention and participant characteristics. To ensure that the data obtained in the present study were reliable, we calculated inter-rater reliability (IRR) for 70% of the included studies. IRR was calculated by dividing the number of agreements by the total number of agreements and disagreements and multiplied by 100. Initial IRR was 94.5%. Variables that were discrepant between coders were discussed until 100% agreement was achieved.
Article Coding
Ten nominal variables were coded related to characteristics of the MM intervention, dependent variables, participant characteristics, and setting. Each variable was divided into salient levels for purposes of analysis. The unit of analysis for each of these variables was conducted at the participant level. The specific coding rationale is described below.
Participant Characteristics
The participant characteristic variables in the current analysis consisted of student grade and sex. The grade variable had three levels: Pre-K, elementary, and secondary. The information provided for this variable was inconsistent among the studies, where some studies reported only grade, while others reported ages. Therefore, students in the Grade Pre-K category were defined as grade prekindergarten or 3–4 years old. The grade elementary category was defined as Grades Kindergarten through 6 or 5–12 years old. The secondary category was defined as students in Grades 7–12 or 13–21 years old. Gender was defined as male or female. No studies reported non-binary gender terms.
Setting
The setting variable was coded according to the location in which the intervention was implemented. Studies were categorized as representing the MM intervention in one of three settings: home, school, and residential treatment.
Outcome Variables
Outcome variables pertained to behavior targets. During our initial coding procedures, we consolidated the specific outcome variables described in each study into one of three categories, which are described below.
Disruptive Behavior
Disruptive behavior was defined in various ways across studies. These definitions included: orienting away from the teacher or an expected task; talking to others, moving around, or being out of one’s seat without permission; playing or engaging with materials in ways that were unrelated to classroom expectations; aggression (e.g., included hitting, kicking, biting, or other actions which harmed another individual); and inappropriately vocalizing or touching others.
Prosocial Behavior
Instances of prosocial behavior were operationally defined as moments in which participants voluntarily engaged in a behavior in order to benefit or help someone else.
Academic Engagement
Academic engagement was operationally defined as any instance during which a participant was in their assigned area, attending to the teacher or current task, and appropriately engaging with classroom materials.
Adaptive Behaviors
Adaptive behaviors were conceptualized as behavioral goals related to practical skills of daily living. This may include health care goals, personal care goals, and/or any goals related to routines or schedule compliance. This definition follows the practical skills conceptualization of the American Association of Intellectual and Developmental Disorders (Schalock et al., 2021).
Intervention Components
Behavioral Criteria
Behavioral criteria were defined as the first step toward reward access. We coded behavioral criteria schedules across the included studies, which included fixed ratio (FR) and variable ratio (VR) schedules, and fixed duration (FD) and variable duration (VD) schedules. Studies were coded as FR if the behavior criterion required the student to display a fixed number of behaviors (e.g., student earns one token every time they turn in their class assignment), whereas VR was coded if the number of responses varied (e.g., student earns one token for turning in, on average, every third completed assignment). Some of the included studies used a FD behavioral criterion, in which a student or child received a token or points for displaying a target behavior for a fixed amount of time (e.g., student earns one token for obeying classroom expectations every 10 min). VD was coded if the amount of time varied, such a remaining on-task for variable periods of time over the course of a school day or week.
Reward Delivery
For most studies, reward delivery was defined as the second step toward reward access. We coded three schedules of reinforcement across the included studies, which included continuous schedule, as well as variable and FD schedules. We coded continuous if the instructor provided the student or child access to the MM immediately after they met their behavioral criterion (e.g., five tokens resulted in access to the MM). Consistent with the traditional use of the weekly or monthly chart, studies were coded as FD if the number of MM days on the chart were held constant (e.g., every square on a chart has “MM”), whereas VD was coded if the number of days varied (e.g., on average, every third square has “MM” on a chart).
Reward Access
Reward access was defined as the likelihood of contacting the MM, which was coded in terms of guaranteed access (i.e., 1:1) and probabilistic access. Studies were coded as 1:1 if it was guaranteed that an instructor would provide a student the MM after they met their behavior criterion (e.g., 5 tokens) or if the calendar day indicated MM. We coded probabilistic if there was any possibility that reward access would not take place after meeting a prespecified criterion, such as a reward spinner with one “no reward” section or if the MM envelope indicated “try again tomorrow.”
Reward Value
This code refers to the number of rewards that were available to participants in a study. Rewards were coded as varied if there were multiple rewards available (e.g., pencils, stickers, gift cards, or a class field trip). If there was a single reward available to participants, rewards were coded as “similar,” such as if the only available reward was a class field trip. Studies that did not identify the types of rewards used were not included in this analysis.
Reward Decision
Included studies were coded in terms of who was involved in the reward selection process. The reviewers identified four separate codes: (a) assessed with student, (b) assessed with student and teacher determined, (c) parent–teacher–researcher determined, and (d) teacher determined. Situations in which the reward decision was determined by the parent or teacher usually entailed identifying putative rewards they presumed would be acceptable and interesting to participants (Kowalewicz & Coffee, 2014). Conversely, studies utilizing student/participant input in the reward decision process included direct conversations with participants to determine the desired reward (Collins et al., 2018; Weiner et al., 1998). One additional study used a suggestion box method to obtain participant input on rewards (Popkin & Skinner, 2003). Studies that did not include information regarding how rewards were determined were not included in this analysis.
Reward Awareness
The reward awareness variable focused on the effect of participant knowledge of the reward within the intervention. Studies were coded using three variables related to participant or teacher knowledge of the reward prior to participation. The “Known by student and teacher” code was used for studies that exposed both the teacher and the participant to the reward before implementation. Studies that exposed the teacher but not the student to the reward prior to implementation were coded as “Known by teacher not by student.” Finally, studies that concealed the reward from both the teacher and the participant were coded as “Unknown by student and teacher.”
Data Analyses
Phase Contrast Selection
Selecting which phase contrasts to evaluate is an important consideration to protecting the integrity of results. Only phase contrasts that represented independent manipulation of the independent variable were evaluated with an effect size. Intervention phases that combined the MM intervention with other treatment packages were omitted from the analysis. This resulted in the forward evaluation of any adjacent baseline-to-intervention phases. Data from subsequent intervention phases were not aggregated with a prior intervention phase. Each phase and phase combination in the design was only evaluated once to preserve the independence of all contrasts. For example, for designs that employed reversal logic, separate ESs were calculated for each baseline/intervention combination. Each of the separate ESs in this case was aggregated to reflect the overall outcome on the dependent variable. Therefore, an ABABAB design produced three separate ESs, which were then aggregated into one omnibus effect size for the design.
Multiple baseline designs (MBD) were treated with similar logic. In the current application, given an appropriate baseline and intervention phase, each tier of the MBD was evaluated separately for effect, and then these ESs were aggregated using the methods described below.
Assessment of Methodological Quality
When conducting meta-analyses, it is important to use only studies that demonstrate experimental control of the dependent variable (Lipsey & Wilson, 2001). The current study followed guidance from the WWC (2020), to determine whether each study adhered to methodological standards, three graduate students with experience and training in SCD research methodology reviewed the methods and data section of each of the included articles and designs within those articles. Each of the students coded the results separately and then compared assessment results. When the students disagreed on a particular design, both would review the design a second time and discuss to consensus. The unit of analysis for this assessment was determined at the design level. Each design within a study was evaluated separately.
Within the pool of studies targeted, three design paradigms were used most often: MBD between subjects or behaviors, (b) single baseline designs (SBD), such as reversal designs, and (c) changing criteria(ion) designs. Evaluation procedures for each of these designs are as follows. The “points” of change were evaluated in MBDs as a phase change within a single participant. Therefore, a MBD across three participants with a single-phase change (A-B) would be counted as having one point of change for each participant, giving the design a total of three. Within this criterion, the number of participants was an important consideration for determining the level of experimental control. Thus, MBDs with three points of change were included in the analysis because the design was sufficient to demonstrate experimental control according to criteria set by WWC (2020). For studies with an SBD or changing criteria, the number of phase changes was also used to determine the level of experimental control. Therefore, reversal and changing-criteria designs were evaluated to determine if three experimental “points” of control were present. Only designs with three points of control were included in further analysis.
In addition to the assessment of internal validity, the presence of sufficient data and reliability were evaluated. The researcher counted the number of data points in each phase analyzed. Designs that included phases with less than three data points were excluded from the analysis. Reliability was coded, and only studies with acceptable levels of reliability were included in the analysis. Acceptable reliability was set at a minimum of .80 for percent agreement and .60 for Cohen’s Kappa (WWC, 2020).
Effect Size
In selecting an analysis method for this study we ascribe to traditional statistical logic by selecting the single best model for the analysis (Agresti, 2012). While multiple ESs may be appropriate given research questions that require multi-dimensional treatment. Data typically found in single case research are limited in the analytical approaches that can be applied because study data typically do not meet parametric assumptions (Jones et al., 1978; Parker et al., 2005; Solomon, 2014). Given concerns about the qualities of data and the appropriateness of applying parametric analysis methods, the current data set was analyzed for suitability for parametric analysis. Only 98 of the 188 data sets analyzed met the assumption for normality. Normality was assessed on each data set using Kolmogorov-Smirnov test in SPSS (v 29). Given, these findings, a non-parametric approach was determined to be most appropriate. That approach is Tau-U (Parker et al., 2011). The formula for Tau-U follows the original algorithm (Parker et al., 2011), and data aggregation was conducted on a web-based calculator (singlecasedesigns.com)
Tau-U is an index that quantifies nonoverlapping data between phases. Tau-U compares each data point in the baseline phase to each data point in the intervention phase. The proportion of total improvement (or non-improvement) between each pair of data points across baseline and intervention phases represent the effect. Tau-U is conceptualized as the proportion of improvement between phases. As such, the scores fall between −1.0 and 1.0, with a score of 0 indicating no difference between phases (Parker et al., 2011). Given that the goal of this study is to document participant improvement across phases Tau-U comparing the A versus B phase was selected (Fingerhut et al., 2021)
Tau-U was originally proposed as a method that could control for baseline trend, in addition to a measure of effect. It has been noted that there are flaws in the baseline correct procedures separate from the measure of effect (Brossart et al., 2018; Pustejovsky, 2016). This approach to application follows methods in recently published meta-analyses (Bross et al., 2021; David et al., 2023). For this reason, the current analytic plan does not include baseline correction in the measure of effect. To allow for continuity, directionality of the intended effect was accounted for in the analysis. Downward data trends in negatively worded outcomes (e.g., “off-task”) were analyzed as positive outcomes, just as upward trends in positively worded outcomes (e.g., “on-task”) were programmed to be analyzed as positive. In addition to effect size estimates, a baseline median was provided for each aggregate effect. To facilitate comparable median baseline estimates, the scale of each data series (i.e., the Y-axis value) was recalibrated to a 0–100 scale. This was done by dividing 100 by the maximum scale (y-axis) value, and then multiplying that product by each data point value. This technique is appropriate for the current analysis plan as scale differences will not impact a proportion-based effect size (Tau-U). The median baseline estimate is an important indicator as it gives the starting point to judge improvement. For example, if one is measuring on task behavior on a percentage interval scale, Tau-U = .75 with a median baseline of 50. This can be expressed as a 75% improvement from 50% on task behavior. The baseline starting point is a key indicator to understand the extent of improvement.
Effect Size Aggregation
Omnibus effects for each coded variable were obtained by combining the effects of included studies. Tau-U was aggregated for a given variable utilizing accepted methods for aggregating proportions. Specifically, each effect size was then weighted by the inverse of the variance and averaged. Coded variables were evaluated to determine if statistically significant differences were present between categories. If the variable had two categories, the Wilcoxon rank sum test (Wilcoxon, 1945) was used to calculate the difference between the groups. The Wilcoxon two-sample statistic provides a normal approximation for two unequal sample sizes. If the variable contained three or more categories, the Kruskal–Wallis one-way analysis of variance (Kruskal & Wallis, 1952) was used. The Kruskal–Wallis test statistic provides approximated probabilities based on χ2. If a significant difference was found among the groups, the Dunn (1964) post hoc test was used to further determine if each pairwise combination of groups showed significant differences. The Dunn post hoc test is appropriate as a nonparametric test of unequal groups (Hollander et al., 2013).
Results
Data from this study yielded 188 separate ESs from the 24 unique studies with 100 participants. The omnibus Tau-U across all studies was .77 (CI95 [.73 to .80]). Within these studies, a broad range of Tau-U values were identified as summarized in. ESs for participant characteristics and intervention components are displayed in Tables 1 and 2, respectively. Table 3 summarizes ESs across the included studies.
Aggregated Results by Participant Characteristics, Dependent Variables, and Setting.
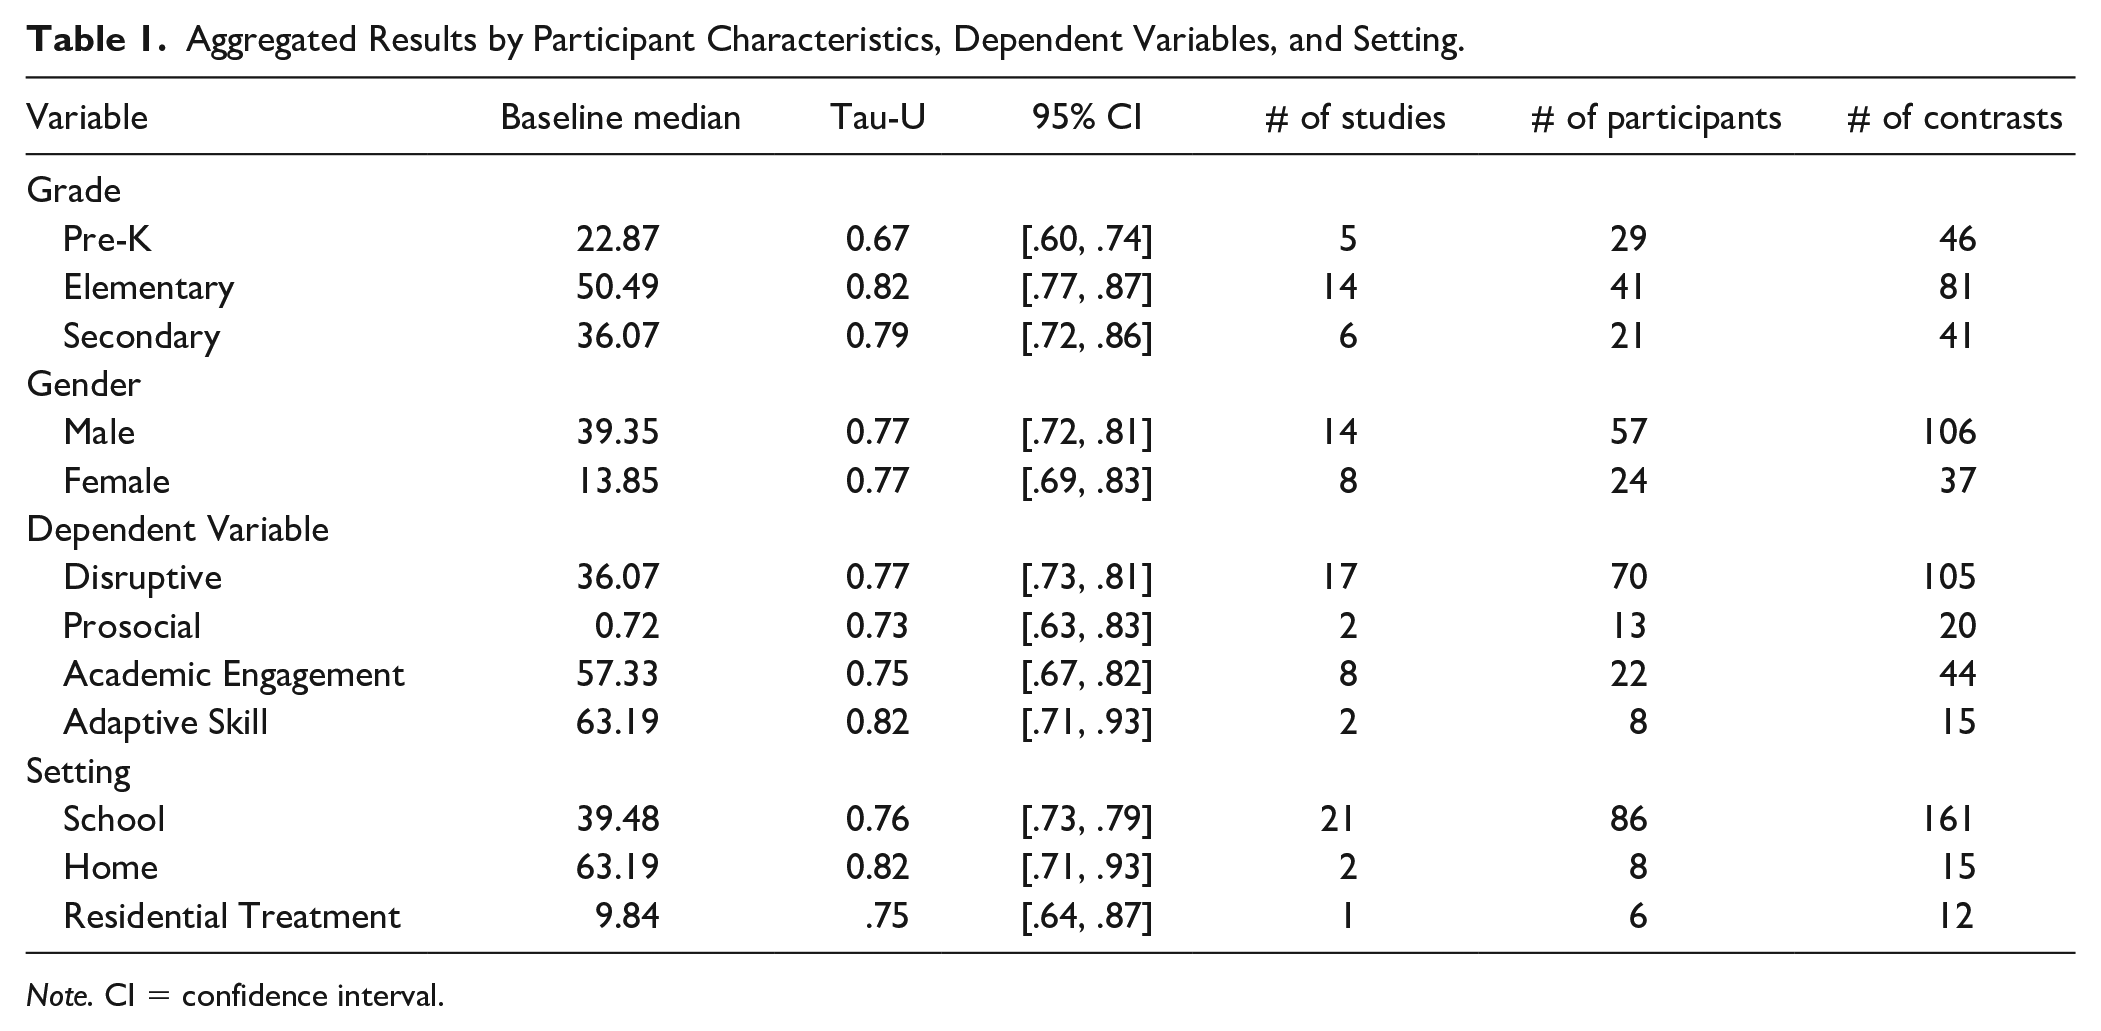
Note. CI = confidence interval.
Aggregated Results by Implementation Components.
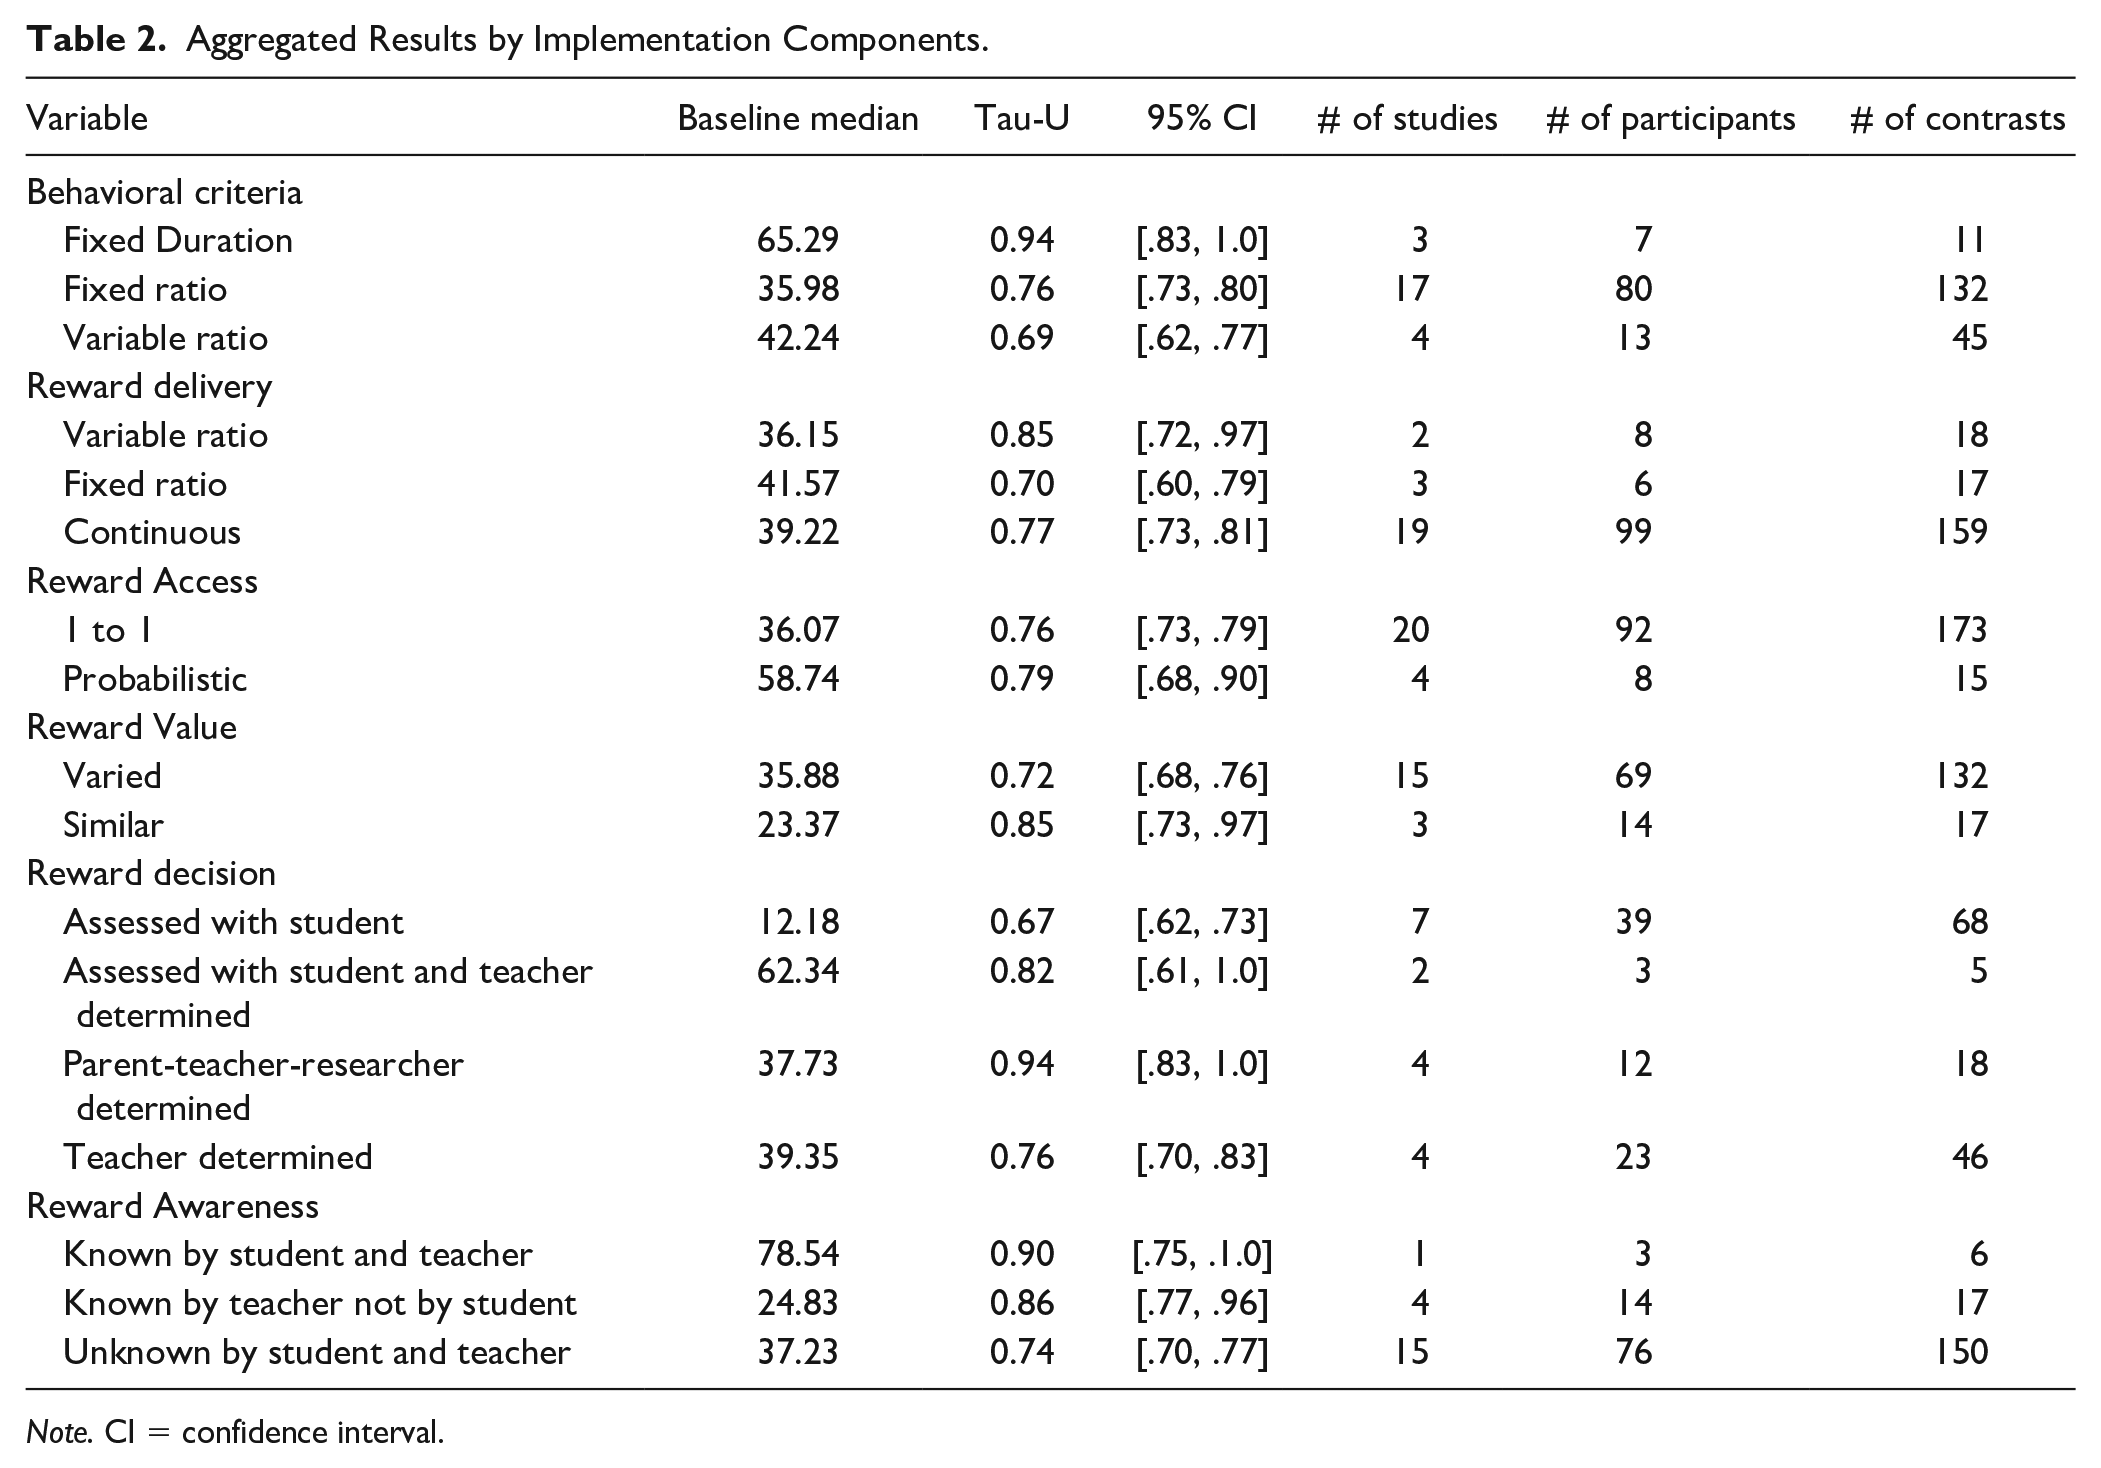
Note. CI = confidence interval.
Effect Size Table.
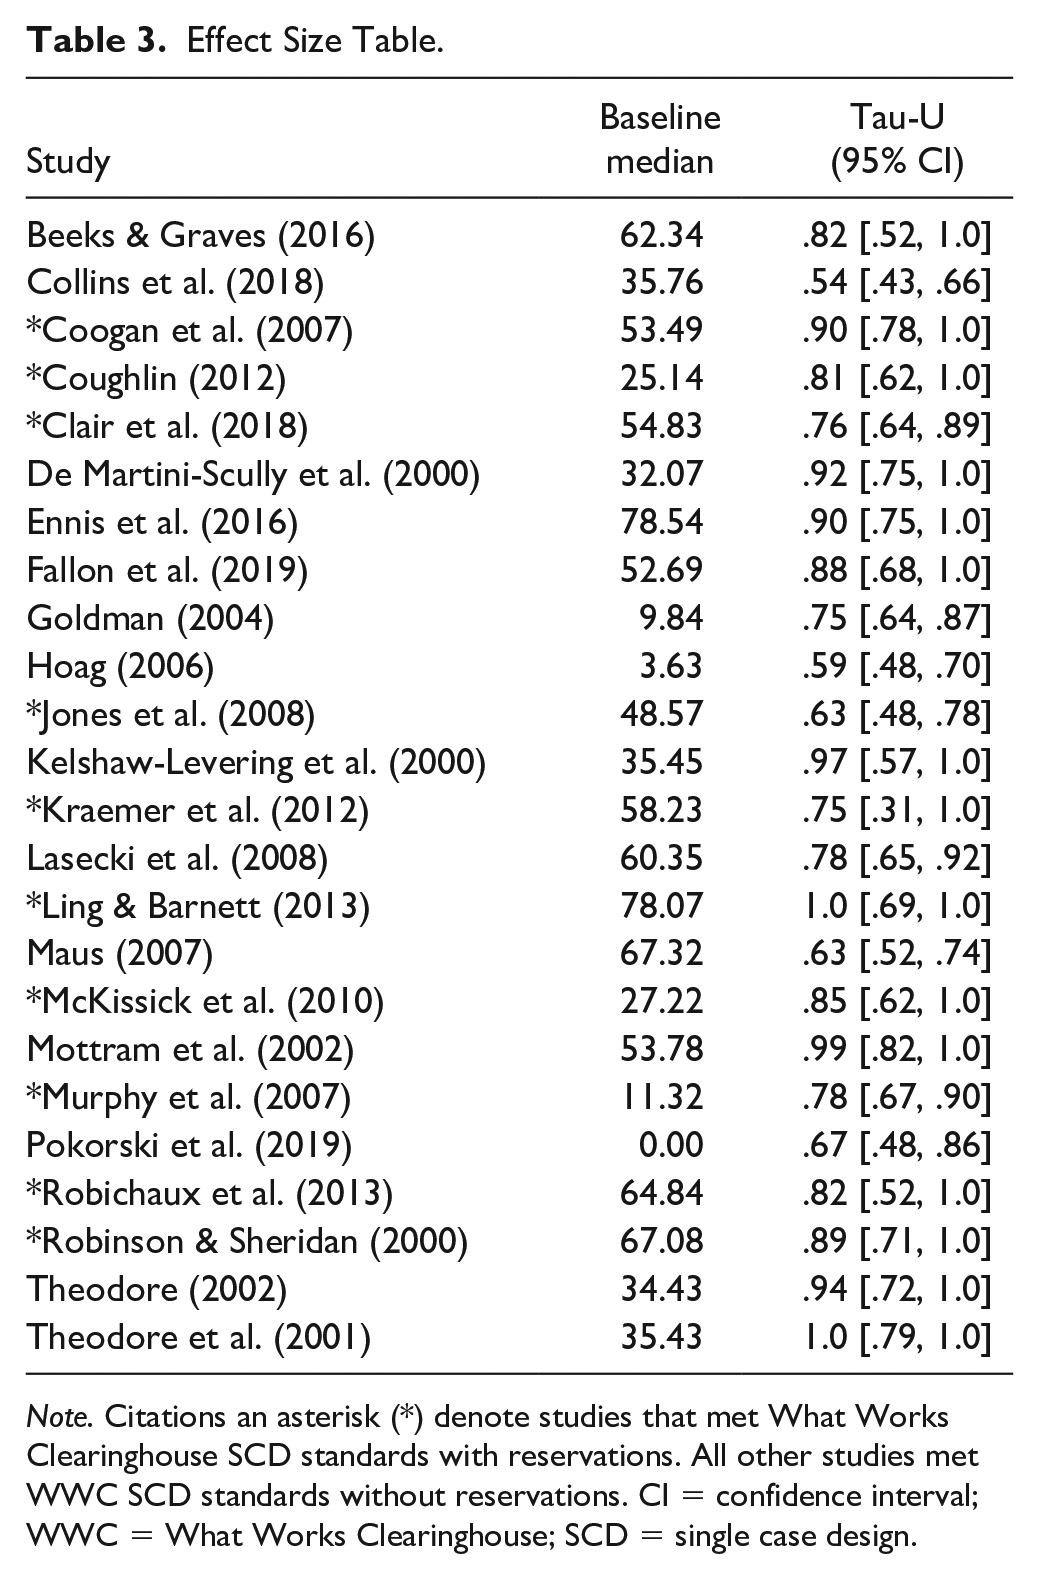
Note. Citations an asterisk (*) denote studies that met What Works Clearinghouse SCD standards with reservations. All other studies met WWC SCD standards without reservations. CI = confidence interval; WWC = What Works Clearinghouse; SCD = single case design.
Participant Characteristics and Dependent Variables
Grade
This study examined participant characteristics (see Table 4), specifically grade and sex, to determine if these variables impacted the level of improvement (see Table 1). With respect to grade, there were 29 preschool-age participants and 46 unique contrasts, 41 elementary-age (81 contrasts), and 21 secondary-age participants (41 contrasts). The obtained Tau-U ESs for preschool-age participants was 0.67 (CI95 [.61, .74]) with a median baseline of 22.87 out of 100, suggesting a 67% improvement from a median baseline starting point of 22.87. Elementary-age participants had an aggregate Tau-U of 0.82 (CI95 [.75, 84]) with a median baseline of 50.49, showing a 67% improvement from a higher baseline starting point. Finally, secondary-age participants showed a similar aggregate Tau-U value as elementary students (Tau-U = .79; CI95 [.72, .85]), from a lower median starting point (M = 36.07). The Kruskal–Wallis test showed no statistically significant difference between participants on this variable (χ2= 2.01, df = 2, p = .35).
Participant Characteristics and Treatment Designs.
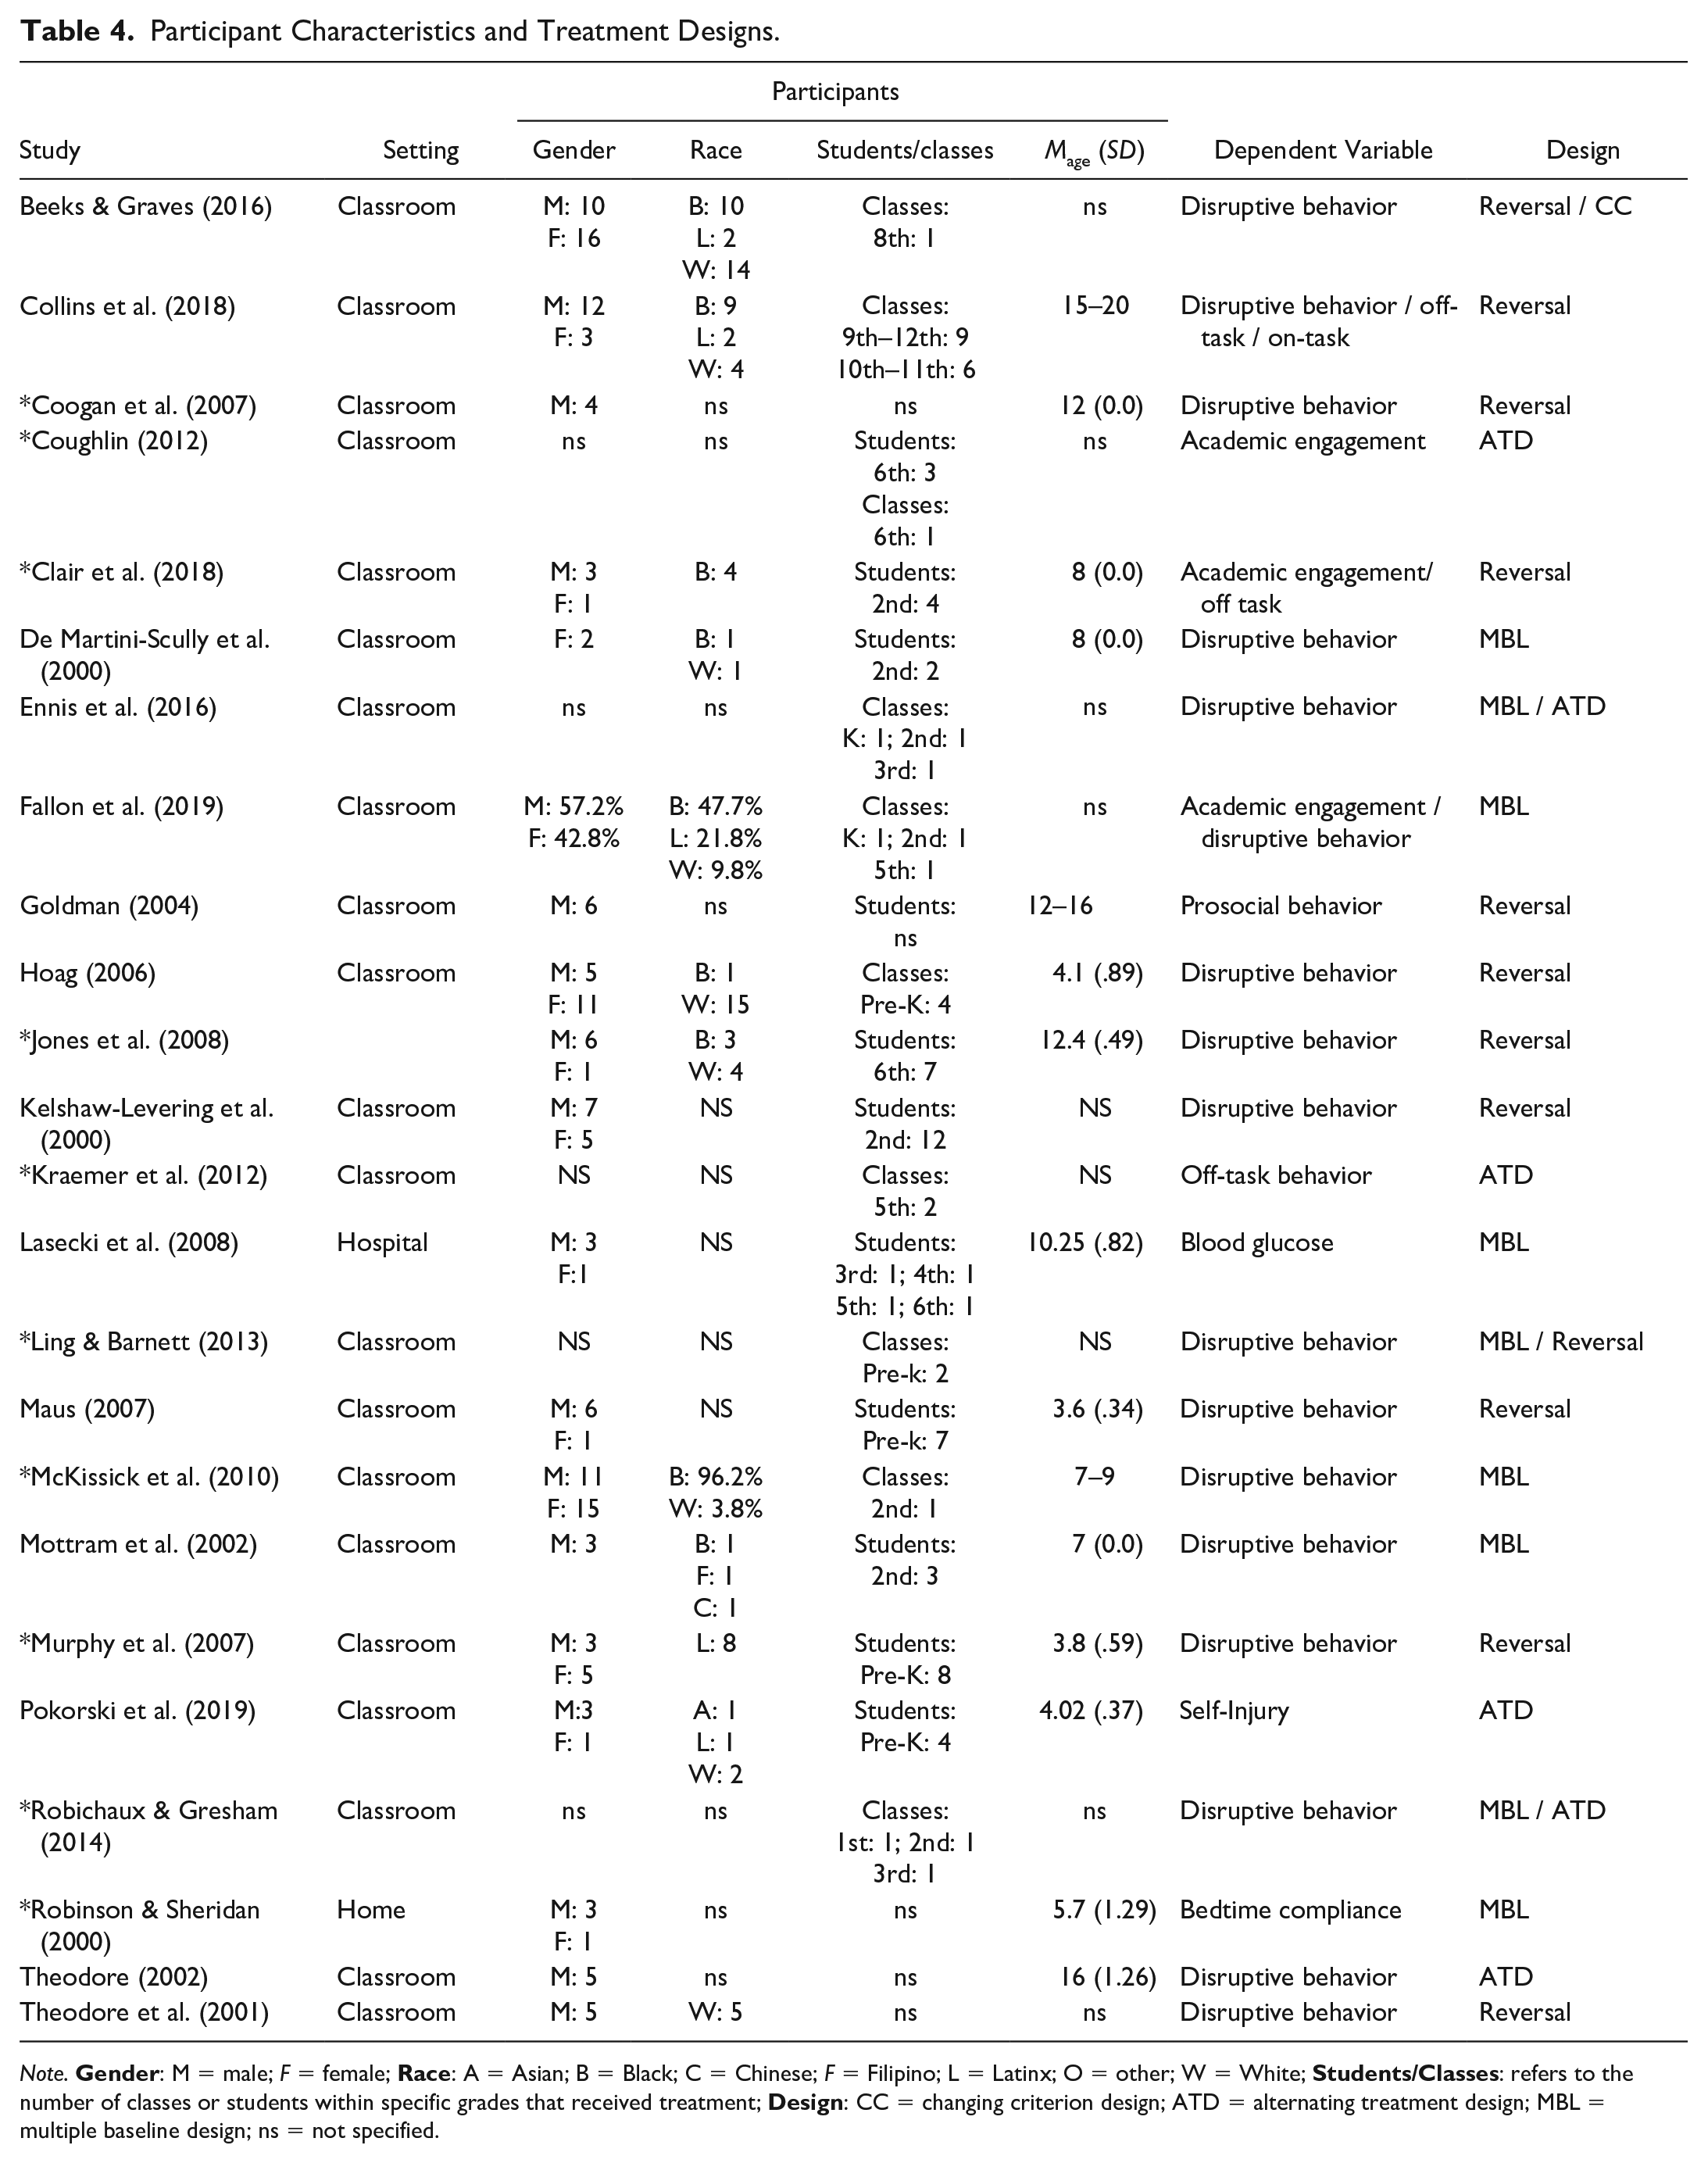
Note.
Gender
Within this analysis, studies reported participant gender. Within those studies, 57 participants identified as male (106 contrasts) and 24 participants as female (37 contrasts). The aggregate Tau-U effect size for male participants was 0.77 (CI95 [.72, .81]) and had a median baseline of 39.35, suggesting a 77% improvement from a median baseline starting point of 39.35. Similarly, female participants had a near identical aggregate effect size (Tau-U = 0.77, CI95 [.69, .83]); however, females had a much lower median starting point on aggregate (M = 13.85). Wilcoxon signed ranks test showed no statistically significant difference between participants on this variable (Z = 0.53, p = .88).
Outcome Variable
Across all studies, behavioral outcomes fit into four discrete categories. The disruptive category had an aggregate Tau-U of .77 (CI95 [.73, .81]) with a baseline median of 36.07. Academic engagement had an aggregate Tau-U of .75 (CI95 [.67, .82]) with baseline median of 57.33. Adaptive skills showed the highest Tau-U of .82 (CI95 [.65, .80]) with median baseline of 63.19. Finally, prosocial behavior had an aggregate Tau-U of .73 (CI95 [.63, .83]) with a very low baseline median of 0.72. The Kruskal–Wallis test showed no statistically significant differences between categories on this variable (χ2= 3.73, df = 3, p = .29).
Setting
The setting variable was reported in all studies. These variables were coded into one of three discrete categories. The school setting category represented the largest number of studies on this topic (N = 21). Interventions implemented in the school setting showed an aggregate Tau-U value of .76 (CI95 [.73, .79]) with a baseline median of 39.48, indicating that one can anticipate a 76% improvement in behavior in this setting. The home category had a high aggregate Tau-U of .82 CI95 [.71, 1.93]) with a higher baseline median of 63.19. Finally, the residential category had an aggregate Tau-U of .75 (CI95 [.64, .87]) and a low baseline median of 9.84. The Kruskal–Wallis test showed no statistically significant difference between categories on this variable (χ2= 3.10, df = 2, p = .21).
Implementation Components
In addition to participant and setting variables, the current study examined specific implementation components to determine if these variables impacted the degree of improvement. First, the current study examined the behavioral criterion, or the schedule used for participants to contact reinforcement. This variable had three categories (see Table 1). MM interventions implemented with FD criterion generated the largest Tau-U of .94 (CI95 [.83–1.0]), whereas MM interventions implemented with a VR criterion yielded the smallest Tau-U of .69 (CI95 [.59–.74]). Most studies (n = 17) in this review implemented a FR behavioral criterion, which yielded an aggregate Tau-U of .76 (CI95 [.73–.80]). Despite a range of scores, no statistically significant differences were detected (Kruskal–Wallis χ2 = 4.01, df = 2, p = .13).
Reinforcement delivery practices were analyzed across three categories. Tau-U ESs within this variable ranged from .85 (CI95 [. 72–.97]) for studies that employed VR methods to .70 (CI95 [.71–.78]) for continuous delivery methods. Similarly, no statistically significant differences were detected between these variables (Kruskal–Wallis χ2 = 5.18, df = 2, p = .08). This is likely due to the lack of variation in implementation across studies, or low numbers of studies that implement reinforcement delivery on variable of FR schedules
With respect to reinforcement procedures, the current study examined several discrete variables. One such method was the protocol for participant access to reinforcement. This variable had two categories (probabilistic access versus 1-to-1 access). Statistically significant differences were not found between variables (Wilcoxon Z = .57, p = .57), showing probabilistic reinforcement (Tau-U = .80, CI95 [.70–.90]) was not significantly different compared to 1-to-1 (Tau-U = .76, CI95 [.72–.79]) reinforcement approaches. Reward value was also examined. Studies that varied the reward had a lower Tau-U (.72, CI95 [.68–.76]) than studies that included similar rewards (Tau-U = .85 (CI95 [.73–.97]). This difference was statistically significant (Wilcoxon Z = 2.22, p = .03). Methods for determining the reward showed higher levels of improvement for studies that used a multidisciplinary approach (e.g., including teachers, parents, and researchers: Tau-U = .94, CI95 [.83–1.0]). This is in comparison to studies that involved the student in the reward selection process (Tau-U = .67, CI95 [.61–.73]) and studies that allowed the teacher to determine the reward (Tau-U = .76, CI95 [.70–.83]). Statistically significant differences were found in this variable (Kruskal–Wallis χ2 = 16.14, df = 3, p = .001). The Dunn post hoc procedure indicated statistically significant differences between studies that assessed Rewards with the student and studies that used the parent, teachers, and researchers to determine the rewards (p < .05). In addition, statistically significant differences were found between studies that had teachers determine the reward versus studies that had parents, teachers, and researchers involved in determining the reward (p < .05).
Finally, we examined different methods of reward exposure, termed here as reward awareness. This variable had three categories. Tau-U ESs were .86 (CI95 [.75–1.0]) for “Rewards that were known by the teacher and not by the student,” .90 (CI95 [.69–.77]) for “Rewards that were known by both the teacher and the student,” and .75 (CI95 [.70–.77]) for “Rewards that were known by both the teacher and student.” Statistical significance testing showed no statistically significant differences between studies (χ2 = 1.73, df = 2, p = .42).
Discussion
The current meta-analysis examined the effects of the MM intervention on the reduction of challenging behavior among school-age children. With this analysis, we sought to quantify the level of improvement for this intervention and provide guidance for future implementation. In this section, we offer interpretations of the omnibus effects and differentiated effects based on variables pertinent to intervention feasibility and effectiveness and discuss implications for practice.
Omnibus Effects
Recognizing the need for effective interventions that support the prosocial behavior of school-age children, the current study synthesized the effectiveness of the MM intervention across 24 unique studies with 100 participants. Overall, strong effects emerged from these studies with an average improvement rate of 77% (Tau-U = .77 CI95 [.73–.80]) for behavior targets. Given the need for effective strategies to remediate behavior in classrooms and other natural settings, the MM intervention can provide a means for educators, caregivers, and clinicians to significantly improve behavior in children and adolescents. Recent federal education legislation (Every Student Succeeds Act, 2015) requires educators to utilize evidence-based practices to extend services for all students across settings in schools. The MM intervention, with large effects, is validated as a robust method for addressing children’s challenging behavior. While the overall effects of this intervention were strong across studies, key variables related to participants and intervention components were also examined in an attempt to optimize intervention efforts.
Participant Characteristics, Settings, and Outcomes
There are several important points to consider when choosing an appropriate intervention. Specifically, it is helpful to understand what types of children will likely respond to the intervention, whether the intervention is feasible and appropriate for the setting, and what types of behaviors are likely to be impacted by the intervention. Remarkably, the current analyses showed that the MM intervention is flexible with comparable positive effects across all grades (PK-12), suggesting the behavioral principles utilized in this intervention are appropriate and effective across ages. This provides interventionists with the ability to implement these procedures with assurance of their effect regardless of the age or grade of the child. These effects also held for each of the other participant level variables examined in this analysis, where no significant differences were observed between genders or across settings. Finally, the current analysis substantiated previous findings of robust and strong effects across a variety of behaviors. Notably, the MM was effective in both decreasing disruptive behavior and improving prosocial behavior, academic engagement, and adaptive behaviors. The functional implications of these findings show that the MM intervention is an effective method to improve a variety of behaviors for school-age children.
Intervention Components
Schedules of Reinforcement
Within this category of our analysis, several intervention components were examined to better understand the practices associated with the effectiveness of the MM intervention. First, we examined the behavioral criteria or schedule of reinforcement. While effects were not significant, we did find higher levels of improvement for studies that utilized a fixed ratio/duration criterion rather than variable ratio/duration. These findings were not anticipated and are contrary to long-held behavioral principles that promote variable schedules of reinforcement over fixed schedules in terms of behavior change impact (Schoenfeld et al., 1956). While important to note that this difference was not significant, the differences found in this examination may indicate that educators have some flexibility in the reinforcement schedule used, as comparable effects were found across each of the behavior criteria examined. Specifically, similar results were found concerning reinforcement delivery schedules, with non-significant differences found between continuous, FR, and VR reinforcement delivery schedules. In sum, the current findings show no superior method concerning the schedule of reinforcement which allows for discretion among implementers to choose the behavior criteria or schedule of reinforcement.
Reinforcement Procedures
Concerning reinforcement procedures, the current study examined several discrete variables and identified some notable findings that may inform future implementation of the MM intervention. First, we examined reinforcement access and compared studies with probabilistic reinforcement procedures to studies with guaranteed access to the reinforcement (i.e., 1 to 1). We found a non-significant difference favoring the probabilistic reinforcement method. This finding would indicate that motivating principals does not lead to significantly different outcomes when reinforcement is assured. Second, we investigated the value of putative rewards by comparing studies with similar rewards utilized through the implementation of this intervention to studies with more varied rewards. In this analysis, higher effects were found for studies with similar rewards as opposed to varied ones. This finding is likely due to the reinforcement desirability that is associated with a single reward, that value is likely not maintained across a variety of reinforcement items. More research may be needed to better understand the relationship between these intervention variables.
Third, we examined the reward decision by coding the individuals involved in deciding which reward(s) would be utilized. Interestingly, we found a significant effect favoring a multidisciplinary approach that involved multiple stakeholders (e.g., parents, teachers, and researchers). Studies that utilized this procedure had higher effects than studies that allowed the child/student or teacher to decide the reward autonomously. This finding underscores the need to involve multiple stakeholders in the reinforcement determination process. Finally, we examined a variable related to the target student’s knowledge of the reward before engagement in the MM activities. Interestingly, we found higher effects in studies in which children were made aware of the reward. This effect is not surprising, given that motivation is likely tied to the value placed on the reward by the child. However, differences between studies were not significant, and this may be due to the low number of studies that allowed the student to know the reward. It seems that too much “mystery” within the MM, particularly in reference to the student’s knowledge of the reward, may lead to less effective results.
Limitations and Future Directions
The current study employed a broad examination of various factors related to the MM intervention that required a substantial amount of statistical power in the study and participant unit. In several cases, some variables (e.g., Adaptive behavior outcomes) were underpowered to determine statistical significance. Findings within the current analysis should be viewed in terms of this consideration, and more research is necessary to substantiate the findings that compared variables with low numbers of studies. In addition, statistical summaries for single-case data are still evolving. The Tau-U effect size, although appropriate for analysis of data typically found in SCD studies, is not analogous to mean-based ESs (e.g., Hedges’ g or Cohen’s d) typically used in meta-analytical work with group designs. The ESs reported in this analysis should be viewed as a proportion of improvement rather than a magnitude of mean difference. Furthermore, the restriction in range of the Tau-U effect size limits its interpretability as all effects higher than +1 are treated as equivalent; this is the same for effects at or below −1. This limitation is necessary, as we chose an ES that allowed for the inclusion of all SCD studies of the MM intervention. Only 2 of the 24 included studies had an effect size of +1 and none of the moderators had an aggregate effect size of +1, thus limiting the impact of this issue. While a single effect size was chosen in the current analysis, multiple ESs may be appropriate when the data meet assumptions for those methods and the research questions call for a multi-dimensional treatment of the data (e.g., magnitude of difference and correlation). Tau-U does have limitations (Brossart et al., 2018); however, these limitations can be alleviated when this statistic is applied properly and the effect is expressed appropriately.
In single-case research, there is the potential for bias or dependence on ESs (Van den Noortgate et al., 2013). Dependence may come from a variety of sources, including, but not limited to homogeneous author groups, design similarities, or clustering issues due to multiple ESs gathered on the same participant. No apparent sources of bias emerged through these analyses; however, this was not an explicit goal of this manuscript and should be explored in future work on the MM intervention. Concerns regarding clustering of ESs and potentially spurious statistical significance values are alleviated by the distribution (S distribution) used to calculate variance. The Tau-U effect size employs an extremely conservative approach for calculating variance (Parker et al., 2011).
Future research should continue to evaluate the MM intervention to further explicate the factors underlying its effectiveness across settings and populations. Doing so has the potential to support the findings of this analysis and instill greater confidence in its use for encouraging prosocial behavior in school-age children. As future researchers continue to evaluate the MM intervention, consideration should be directed to the overall effectiveness of the MM intervention and the relative impact of specific components for broader populations, including children and adolescents with intellectual and developmental disabilities. Additionally, a broader examination of outcome variables (including academic outcomes), and other implementation considerations would represent a fruitful addition to the literature on the MM, and, more broadly, the motivational properties of random rewards.
Supplemental Material
sj-docx-1-pbi-10.1177_10983007231224048 – Supplemental material for The Mystery Motivator Intervention for Challenging Behavior: A Meta-Analysis
Supplemental material, sj-docx-1-pbi-10.1177_10983007231224048 for The Mystery Motivator Intervention for Challenging Behavior: A Meta-Analysis by John L. Davis, Hunter C. King, Keith C. Radley, Cambria M. Corsi, Hilary J. Jensen and William R. Jenson in Journal of Positive Behavior Interventions
Footnotes
Hunter C. King is now affiliated with the Department of Behavior Psychology, Kennedy Krieger Institute, Johns Hopkins School of Medicine, Baltimore, MD, USA. Cambri M. Corsi is now affiliated with Boys Town, Omaha, NE, USA. Hilary J. Jensen is now affiliated to Davis School District, Davis County, UT, USA.
Declaration of Conflicting Interests
The author(s) declared no potential conflicts of interest with respect to the research, authorship, and/or publication of this article.
Funding
The author(s) received no financial support for the research, authorship, and/or publication of this article.
Supplemental Material
Supplemental material for this article is available on the Journal of Positive Behavior Interventions website with the online version of this article.
References
Supplementary Material
Please find the following supplemental material available below.
For Open Access articles published under a Creative Commons License, all supplemental material carries the same license as the article it is associated with.
For non-Open Access articles published, all supplemental material carries a non-exclusive license, and permission requests for re-use of supplemental material or any part of supplemental material shall be sent directly to the copyright owner as specified in the copyright notice associated with the article.