
Abstract
The use of technology-based self monitoring (SM) interventions is becoming more popular, increasing the likelihood that SM interventions will have greater contextual fit within classrooms. SM has resulted in increases in desired school behaviors, such as increases in on task behavior, academic performance, and task completion for students diagnosed with disabilities. The purpose of this study was to extend the findings from Clemons et al. and examine student and teacher use of a web based SM application, I-Connect, and reinforcement to increase on task behavior for three U.S. elementary school students with or at risk for an emotional behavioral disorder using extended SM intervals. All three participants demonstrated significant increases in on task behavior with the use of the I-Connect application plus reinforcement intervention in the classroom.
Students with emotional and behavioral disorders (EBD) have been classified as having adverse emotional, behavioral, social, and academic outcomes (Bradley et al., 2004) and being at greater risk of disciplinary removal (e.g., suspension, expulsion) compared to students with other disabilities (U.S. Department of Education, 2020). These students tend to have difficulty in self regulation (Popham et al., 2018) and emotional expression (Bradley et al., 2008), leading to problematic behavior (e.g., aggression, low self control) and placement in more restrictive settings (Bradley et al., 2008; Estrapala et al., 2018). Displacement from inclusive classrooms to exclusionary settings has been correlated with negative effects on peer interaction and social development, in turn, negatively impacting academic performance (Strain et al., 2011). Long term effects of low academic performance for students with EBD are associated with deficits in maintaining employment and interpersonal relationships, obtaining postsecondary education, and an increased likelihood of involvement with the justice system (Bradley et al., 2008).
Self Monitoring
The use of self management strategies for students with EBD has produced notable improvements in academic outcomes (Popham et al., 2018) and decreases in disruptive behavior (Bruhn et al., 2022). Self monitoring (SM) is the most common self management strategy implemented with students with EBD (Mooney et al., 2005) and facilitates immediate and impactful behavior change (Bruhn et al., 2022). SM is an antecedent-based strategy that involves teaching students to discriminate whether a particular behavior has occurred and self-record the occurrence or nonoccurrence of that behavior (Bruhn et al., 2022; Mooney et al., 2005). Advantages of SM include the decreased dependence on external change agents (e.g., teachers, caregivers; McLaughlin et al., 1985) which leads to the generalization and maintenance of self regulation skills over time (Freeman & Dexter-Mazza, 2004). The absence of an external change agent is an important benefit of SM interventions as it allows the individual to monitor and change their behavior without relying on the behavior of another individual (Cooper et al., 2020). Thus, SM is a highly acceptable intervention for teachers due to the relatively unobtrusive nature and feasibility of the intervention (Bruhn et al., 2015), minimal demands on teacher time (Witt et al., 1984), and adaptability to students’ needs (Bruhn et al., 2022).
Self Monitoring With Reinforcement
A review by Bruhn et al. (2015) found that SM improved academic performance and/or decreased levels of problem behavior for students with behavioral problems across 41 studies. They reported over half (n = 25) of the studies incorporated reinforcement for accurate recording or goal achievement as an additional treatment component. Another recent review of the literature found that the addition of reinforcement to an SM intervention resulted in the strongest treatment effects on academic engagement (Bruhn et al., 2022). Studies conducted by Graham-Day et al. (2010) and Otero and Haut (2016) demonstrated the effectiveness of an SM intervention with contingent reinforcement. Graham-Day et al. (2010) evaluated the level to which students’ on task behavior increased based on the availability of contingent reinforcement for accurate self recording. SM was most effective in increasing students’ on task behavior when contingent reinforcement was provided compared to baseline and SM alone. Otero and Haut (2016) reported that when feedback and reinforcement were delivered contingent on accurate recording for students at risk for academic failure, the percentage of intervals of accuracy and on task behavior was the highest for two of the three participants, compared to the no reinforcement condition. In addition, they found that as the level of accurate behavior ratings increased, the students’ time on task increased as well (Otero & Haut, 2016). The results from these studies support the notion that SM should be considered a multicomponent package, as most interventions include additional key treatment components that enhance treatment outcomes (Bruhn et al., 2015, 2022).
Contextual Fit
Few studies have investigated the use and implementation of self management procedures, including SM strategies, by teachers or other school staff members to address classroom behaviors for students with EBD (Popham et al., 2018). Out of 35 studies, Popham et al. (2018) identified that 42% (n = 15) incorporated teacher implemented self management procedures, compared to 58% (n = 21) investigator implemented. Zhang et al. (2022) found that teachers’ implementation fidelity of evidence-based practices is often below the threshold associated with positive treatment effects, which may be one reason research does not include school personnel as primary interventionists. However, Benazzi et al. (2006) suggest that adequate treatment fidelity may not be solely responsible for positive treatment effects, and rather the acceptability and contextual fit of interventions may largely contribute to the success of an intervention. When treatments are complex and require copious amounts of teacher time, low levels of treatment fidelity are likely to result (Sanetti et al., 2016). One way to address this issue is to involve educators in intervention development and implementation and include them in data collection processes (Benazzi et al., 2006). Integrating teachers’ perceptions, knowledge, and expertise has been reported to increase contextual fit (Benazzi et al., 2006), improve student outcomes, and bridge the research-to-practice gap (Cook & Cook, 2013). Thus, more research that includes the involvement of teachers in intervention design and implementation is needed (Popham et al., 2018).
Extended Self Monitoring Intervals
SM research has used relatively short time-sampling intervals (e.g., 30 s and 1 min) as a measurement of the target behavior (e.g., Otero & Haut, 2016; Rosenbloom et al., 2019) but may not be contextually fit in the classroom. Sanetti et al. (2016) suggest that it is unlikely that teachers would implement interventions with short time-sampling intervals with fidelity due to the time requirement and complexity of the recording system. To date, seven studies have explored the use of extended SM intervals to address the feasibility of SM interventions in the classroom (i.e., Amato-Zech et al., 2006; Bedesem, 2012; Ennis et al., 2018; Gulchak, 2008; Hunter et al., 2017; Rock, 2005; Wills & Mason, 2014). Consultation with the teacher regarding feasible prompting intervals (e.g., 2 and 3 min) resulted in positive effects in on task behavior (Amato-Zech et al., 2006) and academic engagement (Ennis et al., 2018) for all participants. Ennis et al. (2018) suggest the involvement of the teacher ultimately led to the success of their SM intervention. Furthermore, Wills and Mason (2014) used 5 min SM intervals in a 15 min observation session to increase the on task behavior of two high school students with attention-deficit/hyperactivity disorder (ADHD) and emotional disturbance. The participants’ level of on task behavior drastically increased during the intervention compared to baseline level despite having only three opportunities to self record their behavior (Wills & Mason, 2014). Additional research that has incorporated extended SM intervals (e.g., 5 min, Bedesem, 2012; and 10 min, Gulchak, 2008; Hunter et al., 2017; Rock, 2005) have resulted in increases in academic engagement (Rock, 2005) and on task behavior (Bedesem, 2012; Hunter et al., 2017). When extended SM intervals were used, researchers also conducted more stringent secondary measurement systems such as 30 s whole interval recording (Gulchak, 2008), 20 s (Hunter et al., 2017), or 1 min momentary time sampling (MTS; Bedesem, 2012; Rock, 2005) to address the limitations associated with participants’ limited response opportunities during observation sessions. In addition to addressing the contextual fit of SM interventions using extended intervals, Bruhn et al. (2016) suggest that longer SM intervals may aid in the maintenance and generalization of target behaviors.
Technology Based Self Monitoring
To further address concerns of treatment fidelity, acceptability, and contextual fit of SM interventions in the classroom, pre-existing resources should be used for school based interventions to prevent stigma associated with obtrusive intervention delivery (Clemons et al., 2016) and to increase time- and cost-efficiency (Bedesem, 2012). Compared to paper/pencil SM methods, electronic data collection may increase the efficiency of data collection, storage, and analysis as many applications can automatically calculate data and generate graphs and reports for evaluation (Bruhn et al., 2016). Thus, technology based SM interventions may require less time and demands for teachers compared to traditional methods, further promoting contextual fit in a school-based setting. Hunter et al. (2017) evaluated the treatment effects of three modal variations of SM interventions (i.e., paper/pencil, My Mood Tracker© application on an iPod Touch, paper/pencil with teacher prompts) with three middle school students with EBD. For each modal variation of the SM intervention, students responded to six, 5 min prompts within a 30 min observation period. They found that each modal variation resulted in similar, decreased levels of off task behavior compared to baseline levels. Bedesem (2012) used a technology-based SM intervention, CellF-Monitoring, to increase the on task behavior of two students who received special education services. On task behavior increased from an average of 28% and 53% in baseline to 64% and 85% in intervention for Participants 1 and 2, respectively. Bouck et al. (2014) used an alternating treatments design to evaluate the differential effectiveness of paper/pencil SM and technology based SM (Upad lite app) to increase task independence for three students in a self contained classroom. Each student performed highest in the technology based SM condition compared to paper/pencil SM and baseline conditions (Bouck et al., 2014). These findings support the claim that technology based SM interventions produce similar or better outcomes than traditional SM interventions.
Self Monitoring With I-Connect
I-Connect is a technology based SM application that offers the use of tactile and/or audible prompts, capitalizes on available resources (e.g., smartphone and tablet), is freely available, and can be individualized across students (Scheibel et al., 2023). Scheibel et al. (2023) conducted a meta-analysis to evaluate the effectiveness of I-Connect to increase on task behavior. The use of I-Connect resulted in increased on task behavior for all 14 participants across all six studies. Of the six studies, two (i.e., Romans et al., 2020; Rosenbloom et al., 2019) included a reinforcement component for accurate self recording and goal achievement (Scheibel et al., 2023). I-Connect was reported to have strong social validity for both students and teachers (Clemons et al., 2016) and has been implemented in general (e.g., Wills & Mason, 2014) and special education (e.g., Rosenbloom et al., 2019), elementary (e.g., Rosenbloom et al., 2016) and high school (e.g., Clemons et al., 2016) classrooms (Scheibel et al., 2023).
Purpose
Although research has demonstrated the effectiveness of I-Connect, more research is needed. Most of the I-Connect research has been conducted with students with autism and used SM intervals of 1 min or less (Scheibel et al., 2023). These limitations call for further evaluation of the contextual fit and effectiveness of the intervention with novel populations (e.g., students with EBD) in exclusionary classrooms. In addition, no evidence-based guidance toward determining effective SM interval length currently exists within the literature (Bruhn et al., 2022). It is important to consider the assertions made by Cook and Cook (2013) and Benazzi et al. (2006) to promote the effective use of school-based interventions, enhance contextual fit, and encourage teacher buy-in. Therefore, the purpose of this study was to evaluate the effectiveness of I-Connect and reinforcement using extended SM intervals to improve the on task behavior of elementary school students with or at risk for EBD. Additional data on the students’ self recording accuracy were also collected to ensure appropriate SM intervention implementation.
Method
Participants and Setting
Before participant recruitment, school district and university institutional review board (IRB) approval was obtained. Student participants were included if they were identified with or were at risk for an EBD due to problem behaviors that were occurring within their self contained classroom, as demonstrated in their Individualized Education Program (IEP) plans, and teacher reported challenges with the student’s on task behavior. Participants were considered for this study if they displayed off task behavior that inhibited academic performance, leaving them at risk for retention. Due to confidentiality concerns, the school district IRB did not allow researchers to conduct record reviews for student participants. We relied on teacher and school personnel’s reports to identify if students met the inclusion criteria for this study. We confirmed if students met inclusion criteria based on their level of on task behavior during baseline data collection. If students were on task for at least 80% of intervals for three consecutive sessions, they would have been excluded from the study; however, this did not occur. Students with severe problem behavior and students with chronic absences (i.e., greater than six in the past calendar month) were excluded from study participation. Following identification of eligibility, teacher consent, guardian consent, and student assent were obtained. To obtain student assent, the researcher thoroughly explained the process of the preference assessment, I-Connect training, and how they would be observed during the baseline and intervention phases. The students were asked to briefly repeat the steps of the process to ensure understanding and were allowed to ask questions.
Three student participants were included in this study. Participant names are represented as pseudonyms. Participant 1, Cayson, was an 11-year-old White male student in fifth grade. Cayson was diagnosed with a language and speech impairment, specific learning disability, attention-deficit-hyperactivity disorder (ADHD), and disruptive mood dysregulation disorder, and was identified as being at risk for an EBD. Cayson was referred for this study due to consistent task refusal and disruptive off-task behavior throughout the entirety of the school day. Participant 2, Juan, was a 10-year-old Hispanic male student in fourth grade. Juan had a diagnosis of EBD and ADHD. Juan was recommended for participation in this study due to low task completion and disruptive off-task behavior that occurred throughout the entirety of the school day. Participant 3, Michael, was an 11-year-old White male student in fifth grade. Michael was diagnosed with EBD, impulse control disorder, intermittent explosive disorder, oppositional defiant disorder, and ADHD. Michael was identified as a candidate for this study due to disruptive off-task behavior throughout the school day.
All three students were in the same self contained exceptional student education (ESE) classroom at a public elementary school in the United States that served students from kindergarten to fifth grade. The classroom contained a total of 12 students in the fourth and fifth grades along with the teacher and two instructional assistants (IAs). All students remained in the same ESE classroom for the duration of the school day except recess and extracurricular periods (e.g., art, physical education, and music). Students in this classroom had IEPs and exhibited problem behavior consistent with those behaviors associated with EBD.
The teacher was a 69-year-old White male working in the same classroom for the school district for 12 years. Before working in the current school district, he had earned a bachelor’s degree and had a business career. After he retired from his business career, he served as a substitute teacher for students with EBD and other developmental and intellectual disabilities and obtained a teaching certificate. No incentives were provided for participation in this study.
Materials
Similar to the materials used in Clemons et al. (2016), a reinforcer menu, iPad, iPhone, and the I-Connect application were used in this study. The iPad and iPhone were equipped with speakers that permitted the delivery of an audible prompt emitted by the I-Connect application. In addition, the MultiTimer application installed on an iPhone was used to collect duration data by the researcher. The MultiTimer application permitted various timers to be set simultaneously, allowing for a “countdown timer” (i.e., interval timer) and a “count up timer” (i.e., duration timer) to be used at the same time. A reinforcement menu was created for each student following a preference assessment using a word processor software program that displayed a hierarchy of 10 preferred items in the form of picture icons (Clemons et al., 2016) for each participant. Reinforcers included chips, candy, juice boxes, a computer, and headphones.
Target Behaviors and Data Collection
The primary dependent variable in this study was on task behavior recorded as both percentage of intervals and total duration throughout one instructional 30 min class period. On task behavior was defined as any time the student attended to and engaged with the class materials and/or teacher, sat upright at their desk with limited motor movement, accurately completed work during independent tasks, remained quiet during instructional or independent work time, ignored other peers’ disruptions, did not engage with their peers unless directed to do so or permission was provided by the teacher or IAs and made comments and/or answered or asked questions relevant to the instructional material. Any time in which on task behavior was not present was considered off task behavior.
Prior to baseline, the researcher was present during the students’ morning classroom routine for 2 weeks. Students were told that the researcher was observing the teacher during this time to reduce the likelihood of reactivity. Following this period, the teacher and researcher used MTS with 5 min intervals throughout one 30 min instructional class period for each participant. If the student was engaged in on task behavior at the end of the interval, the teacher responded “yes” to the I-Connect prompt and the researcher marked a “+” on the datasheet. Conversely, if the student was not engaged in on task behavior at the end of the interval, the teacher responded “no” to the I-Connect prompt and the researcher marked a “−” on the datasheet. The teacher was primarily responsible for collecting the percentage of intervals the student was on task, and decisions for the delivery of reinforcement were based on corresponding behavior ratings to that of the student and teacher. The researcher collected these data on days that the teacher was absent or was called out of the room due to an emergency or other circumstance. The student, teacher, and researcher recorded the presence or absence of on task behavior following the end of the same synchronous 5 min MTS interval within the 30 min observation session.
As a secondary dependent measure, the researcher recorded the total duration in which each student was engaged in on task behavior throughout the 30 min instructional period. The duration secondary measure was added to provide a more accurate representation of students’ on task and off task behavior during the entire instructional period to account for the possible misrepresentation of on task behavior as measured by MTS.
Interobserver Agreement
To calculate interobserver agreement (IOA), two observers (i.e., the researcher and a research assistant) independently recorded the duration of on task behavior each participant engaged in throughout the instructional period and used MTS with 5 min intervals to record the presence of on task behavior. A thorough definition of on task behavior was provided to each observer. Similar to the IOA training conducted by Clemons et al. (2016), the two observers viewed video recordings of observational sessions found on YouTube and recorded duration of on task behavior. Observers began collecting data with participants once they reached 90% agreement during training. IOA for percentage of intervals on task was calculated by the total number of agreements divided by the total number of agreements plus disagreements. IOA for duration was calculated by converting each duration number into seconds, dividing the smaller duration by the larger duration for each session, and multiplying by 100.
IOA was calculated for 48% of sessions for Michael, 50% of sessions for Juan and 42% of sessions for Cayson across baseline and intervention phases. IOA for percentage of intervals on task was 100% across all participants during each session. Average IOA for duration for Cayson was 99.89%, with a range of 100%–99.5%. Average duration IOA for Juan was 99.5%, with a range of 100%–98.81%. Average duration IOA for Michael was 98.34%, with a range of 100%–84.5%. IOA was calculated for 48% of sessions for Michael, 50% of sessions for Juan, and 42% of sessions for Cayson across baseline and intervention phases. IOA for percentage of intervals on task was 100% across all participants during each session. Average IOA for duration for Cayson was 99.89%, with a range of 100%–99.5%. Average duration IOA for Juan was 99.5%, with a range of 100%–98.81%. Average duration IOA for Michael was 98.34%, with a range of 100%–84.5%.
Treatment Integrity
Treatment integrity (TI) data were scored based on accurate implementation of each step within the intervention. Table 1 describes the TI checklist steps and the mean percentage TI for each participant. TI was calculated in three ways (i.e., procedural, data collection, and overall), by dividing the number of steps performed correctly by the total number of steps in the implementation of the intervention and then multiplying by 100. TI data were collected by a research assistant who acted as a secondary observer for 26%, 36%, and 29% of intervention sessions for Cayson, Juan, and Michael, respectively. Overall TI was 99% and 100% for procedural integrity for all participants. TI for data collection was 96%, 96%, and 97% for Cayson, Juan and Michael, respectively. When the teacher was absent from class the researcher acted in the teacher’s role as a substitute for the teacher’s responsibility in the treatment integrity task analysis, which is why TI of procedural implementation is still considered to have been 100%.
Mean Percentage Treatment Integrity for Procedures and Data Collection Across Participants.
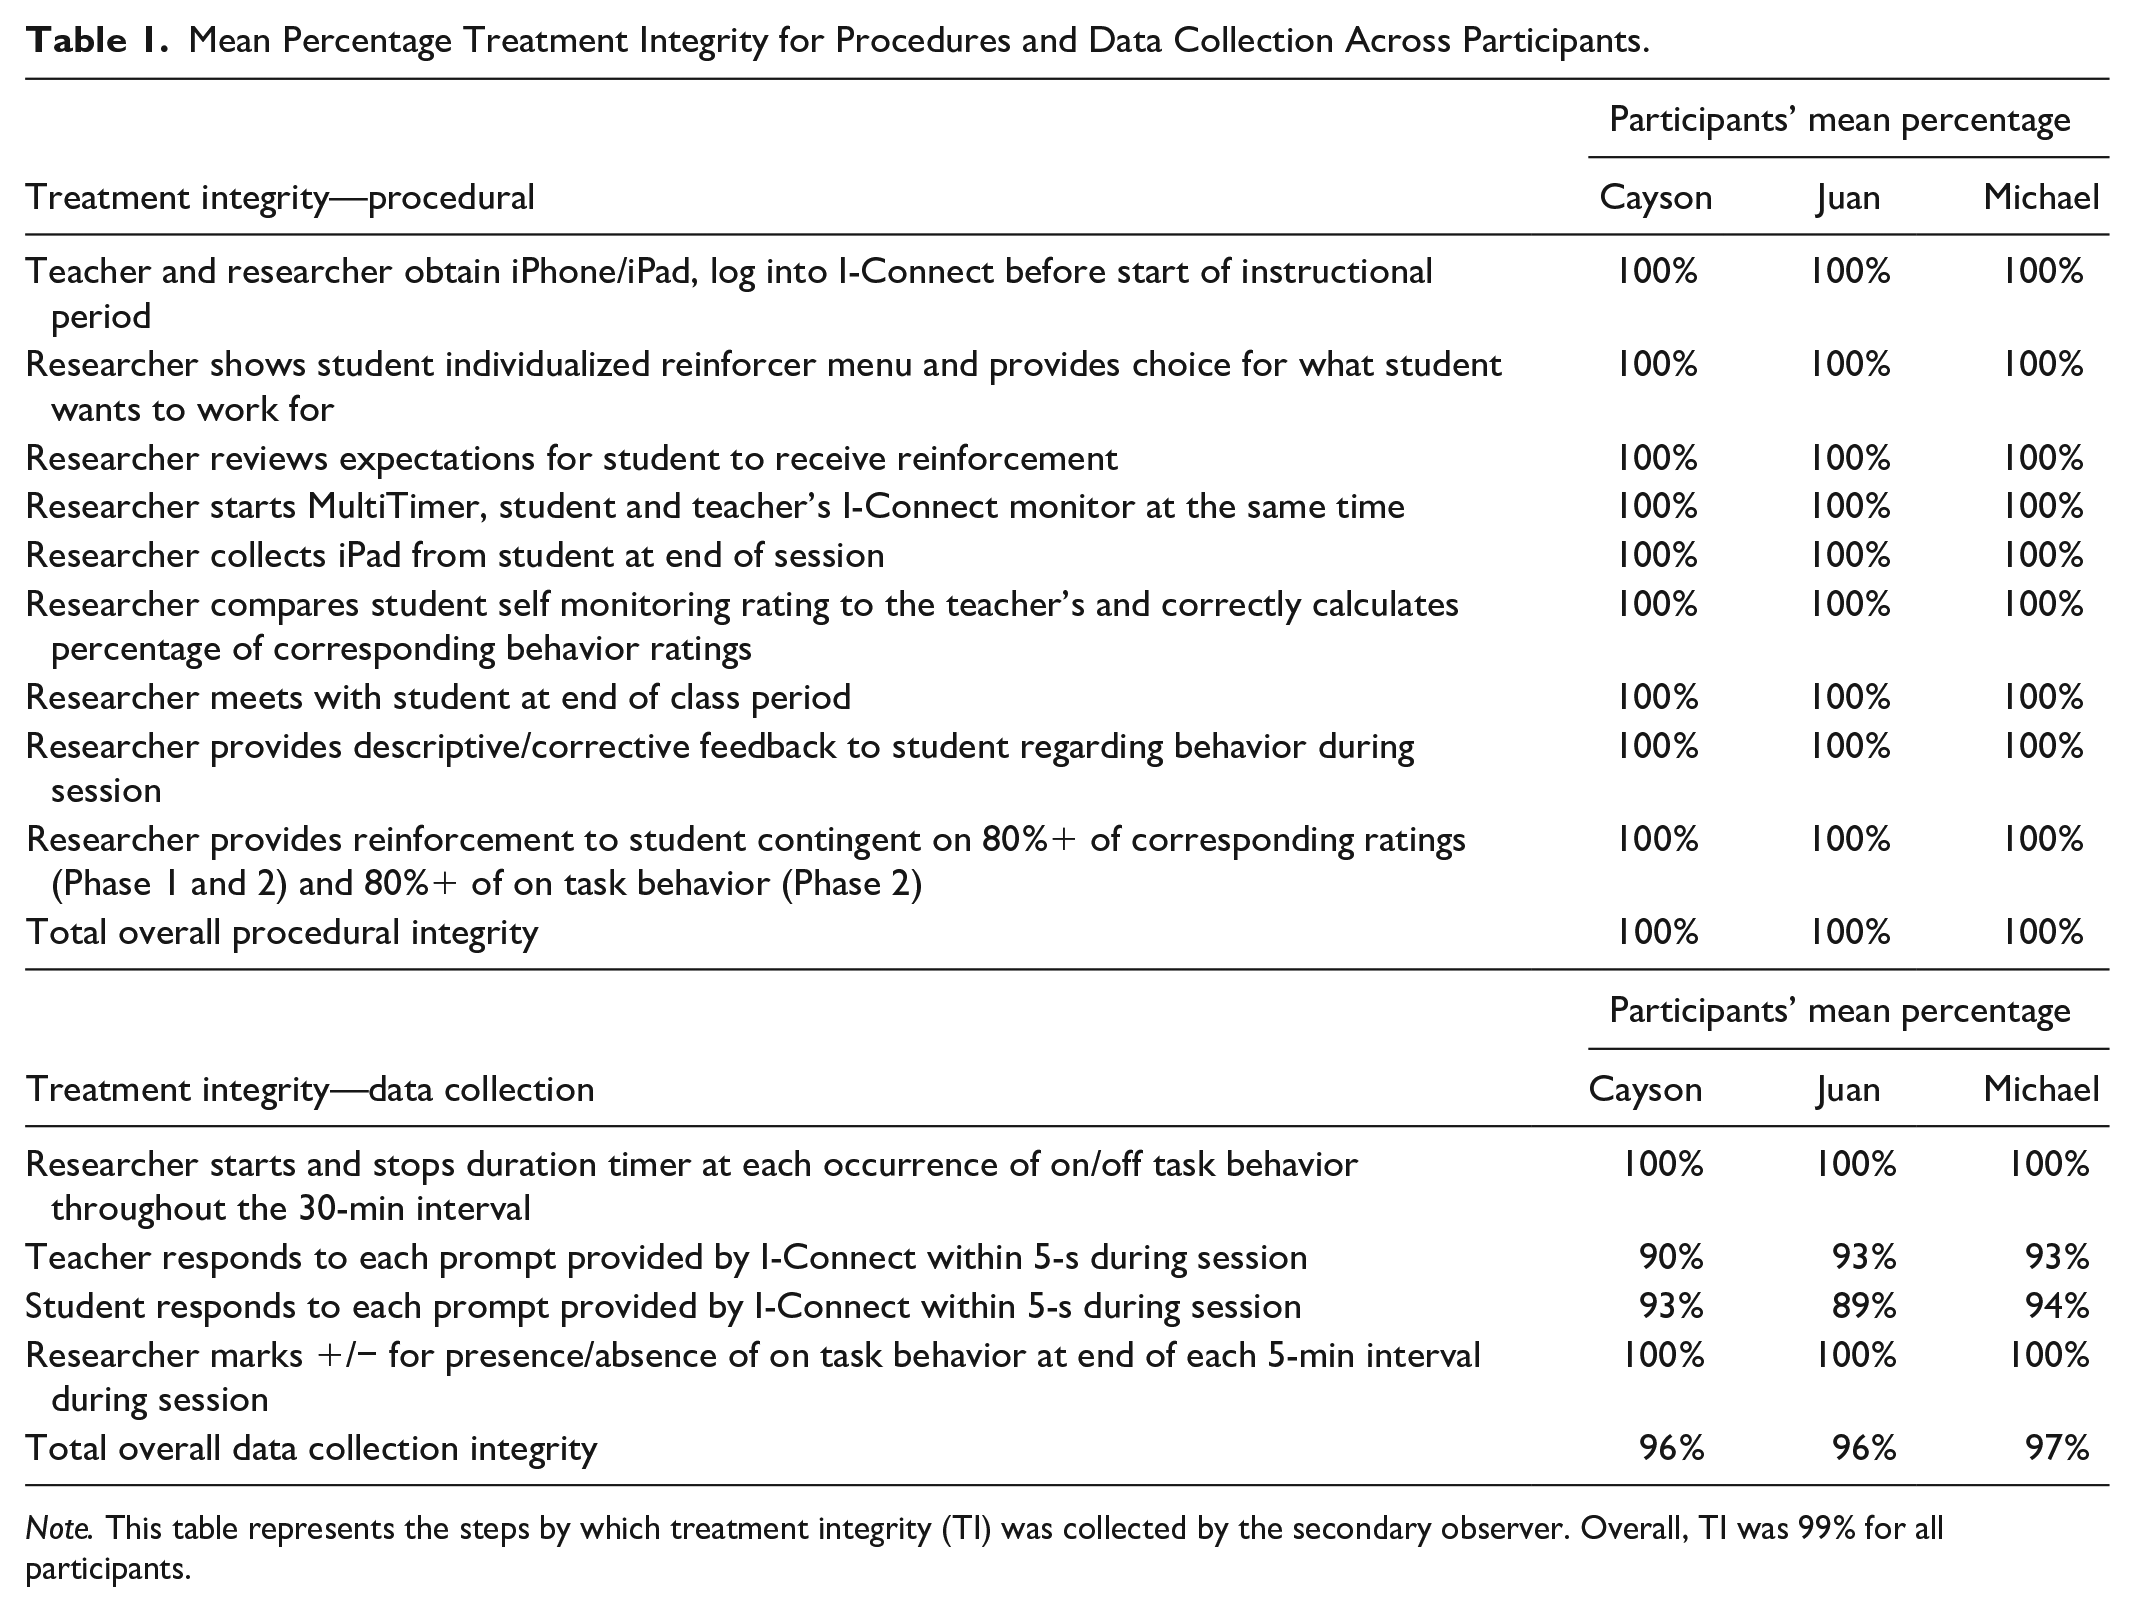
Note. This table represents the steps by which treatment integrity (TI) was collected by the secondary observer. Overall, TI was 99% for all participants.
Social Validity Assessment
The same social validity and consumer satisfaction rating scales used by Clemons et al. (2016) were used in this study to assess the acceptance of the intervention and procedures by students and teachers (see Table 2). The teacher rated student productivity in class, assignment completion, grades, and accuracy of work using a 5-point Likert-type scale with 1 representing no improvement noted to 5 being great improvement. The three students completed a similar rating scale to evaluate their classroom performance.
Teacher and Student Social Validity Rating Scales and Results.
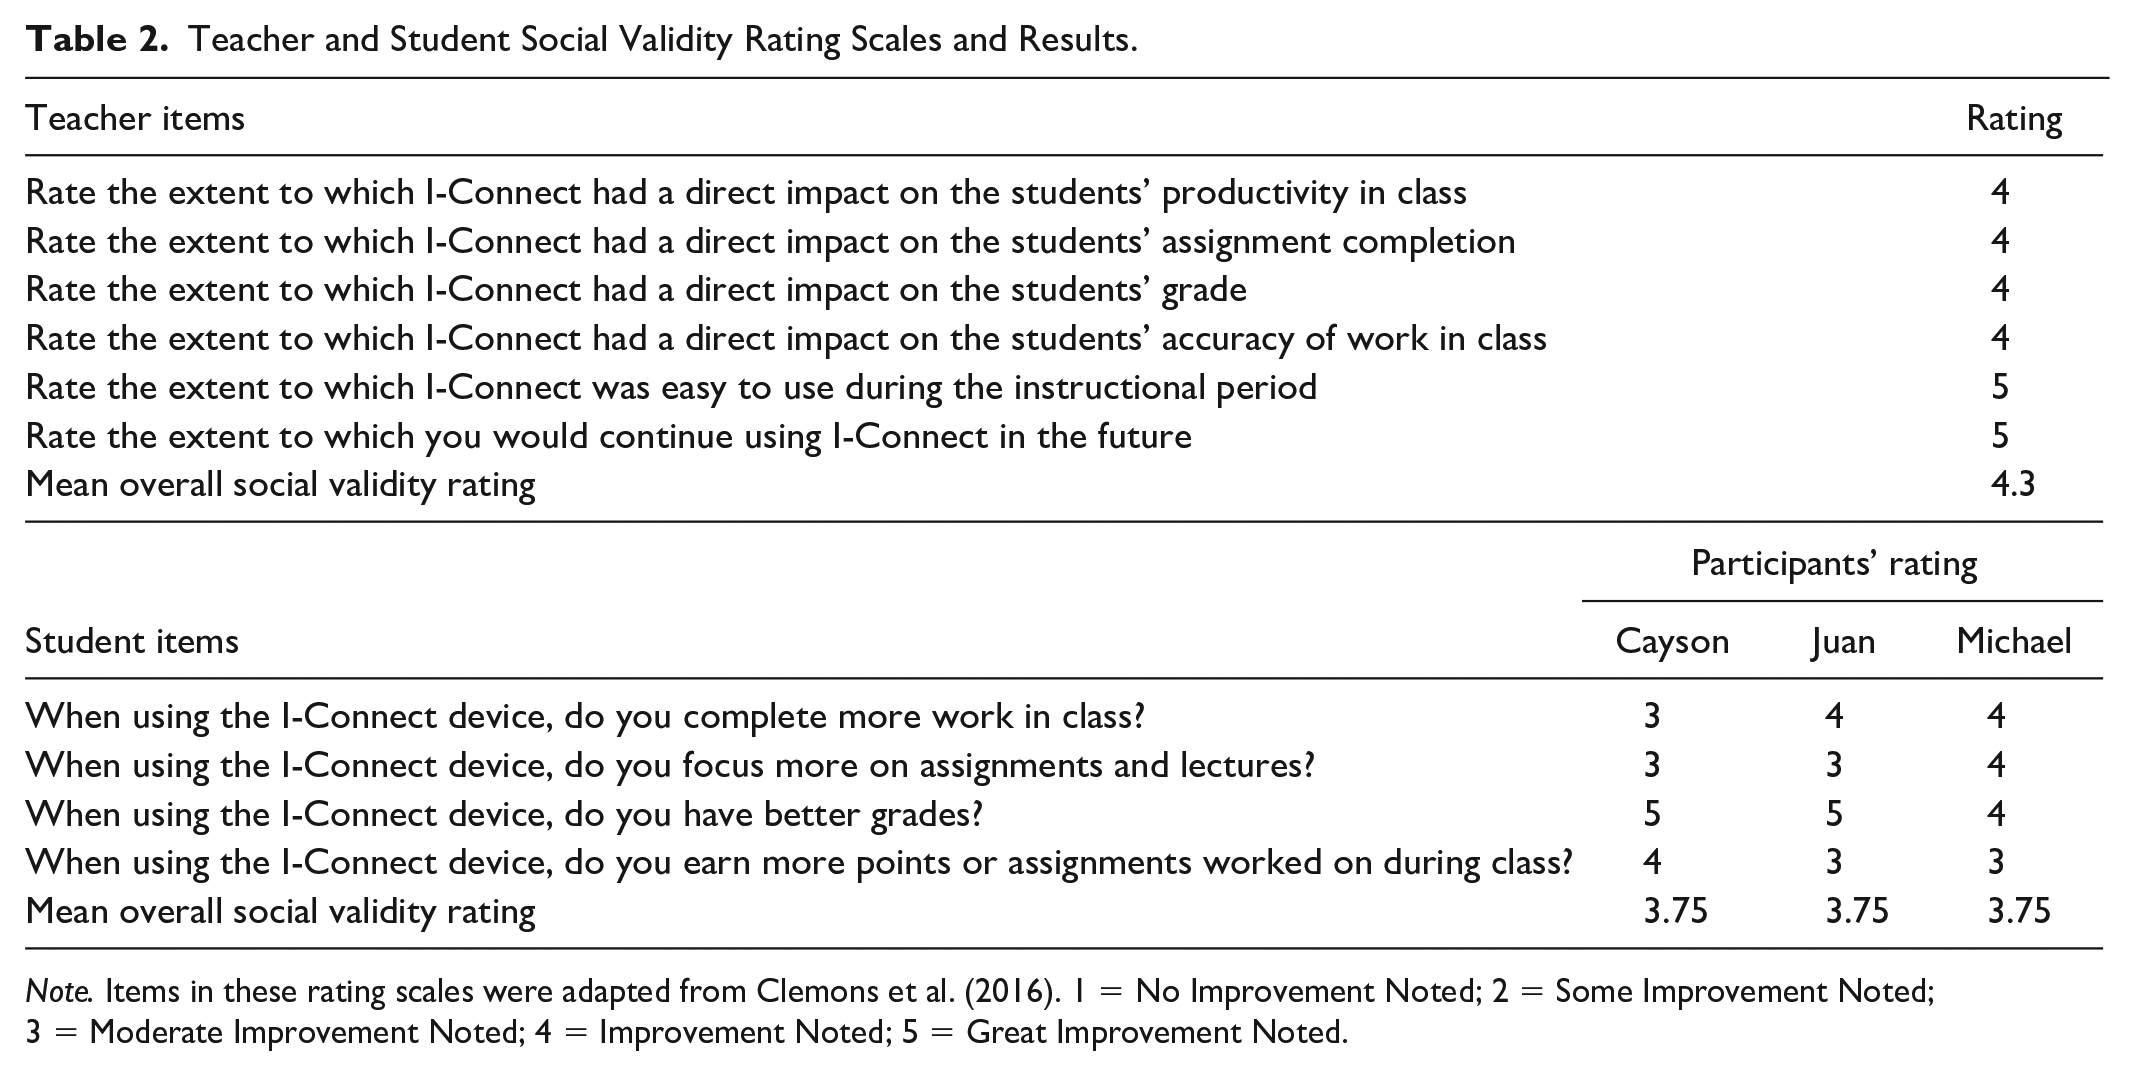
Note. Items in these rating scales were adapted from Clemons et al. (2016). 1 = No Improvement Noted; 2 = Some Improvement Noted; 3 = Moderate Improvement Noted; 4 = Improvement Noted; 5 = Great Improvement Noted.
Procedures
All data were collected during 30 min observation periods in the morning before the students’ lunch period. The teacher indicated that all three students engaged in off task behavior across the entire day and that there was not one particular class period that was more difficult or resulted in increased levels of off task behavior. This was concurred based on observations by the researcher throughout each instructional period that occurred in the first half of the school day. The structure of the classroom schedule and routine varied slightly from day to day, but the same academic subjects (math, language arts, science, social studies, and vocabulary) were taught during observations with each participant that occurred in the morning before lunchtime. All subjects were taught in the same classroom. If teacher absenteeism occurred, student ratings were compared to that of the researcher, instead of comparisons to teacher ratings; however, no other deviations from the procedures were made when this occurred. Throughout all baseline and intervention sessions, each participant was observed in the same classroom for 30-min and fixed SM intervals of 5 min were used.
Baseline
The teacher was instructed to conduct class and respond to students’ behavior as he normally would. Examples of typical responses to problem behavior by the teacher included vocal redirection to the task, relocation of the student away from a peer or to a closer proximity to a classroom adult, or a reduction in points within the class-wide level system. The class-wide level system functioned as a token economy in which students moved up and/or down a hierarchy of tiers contingent on meeting specific performance criteria. Each tier consisted of a set of privileges accessible to the student; more privileges were associated with higher levels and fewer privileges with lower levels.
Preference Assessment
Preference assessment data were collected using an open-ended questionnaire in which the students marked items they preferred from a list of possible reinforcers that the teacher indicated would be feasible for his classroom. Options such as breaks, a positive note sent home, free time on the iPad or computer, and items such as candy, chips, or a juice box were listed on the questionnaire for the students to choose as potential reinforcers. The students also had the opportunity to specify and/or list additional items they wanted to receive upon attaining their goal within the questionnaire. Following the completion of the questionnaire, an individualized reinforcer menu was created for each student.
I-Connect Training
The I-Connect training was adapted from the training implemented by Clemons et al. (2016). Training consisted of three separate sessions that occurred in 1 day for a total duration of about 30 min. All parts of the training were provided in a 1:1 setting with the researcher using behavior skills training (BST; Miltenberger et al., 2004), and each training session ranged from approximately 8- to 10-min. The teacher was trained by the researcher before the baseline for all participants, as he was required to respond to the I-Connect prompts during all phases of this study. Each student was trained individually by the researcher, in a staggered fashion, as they each entered the first intervention phase.
I-Connect Teacher Training
During Training Part 1, the researcher used direct instruction and modeling to explain the topography of on task behavior. The researcher provided the teacher with examples of the student engaging in on task behavior (e.g., student engaged in their work, student looking at the teacher during instruction, and writing answers to a worksheet) and examples of off task behavior (e.g., looking around the classroom, conversing with peers, tapping school supplies on a desk). Following an explanation of on task and off task behavior, the researcher defined and explained the use of MTS. The teacher viewed three different 1- to 3-min videos of a student engaging in various on task and off task behaviors (obtained from YouTube). Using paper and pencil data collection, the teacher scored the presence or absence of on task behavior using MTS with 20 s intervals. To conclude Training Part 1, the teacher had to accurately identify on task behavior for five consecutive trials (Clemons et al., 2016).
Training Part 2 consisted of teaching the use of the I-Connect application. First, the teacher was instructed on how to start and navigate the I-Connect SM program. The researcher modeled this step and offered the teacher the opportunity to rehearse the skill with the use of verbal prompts. Following accurate completion, the teacher was presented with the same three video recordings from Part 1. The teacher monitored student behavior from the video just as he would during an intervention session. To decrease the amount of training time, the teacher practiced responding to the I-Connect prompts using 10 s intervals. The researcher monitored his responses and provided praise for accurate recordings and corrective feedback for inaccurate recordings of student on task behavior. The teacher was required to correctly score student on task behavior for a minimum of five consecutive intervals (Clemons et al., 2016).
Training Part 3 consisted of teacher use of the application during a mock intervention session. During this time, the researcher took the role of the student while the teacher recorded the hypothetical student’s behavior for a session that is typical to that of an instructional class period using the I-Connect application. The researcher provided feedback based on the teacher’s performance during the observation and the accuracy of his scoring. To conclude training, the teacher was required to exhibit the skills necessary to turn on the device, navigate to the I-Connect program, and accurately monitor student behavior with the application for a minimum of five intervals (Clemons et al., 2016).
I-Connect Student Training
Similar procedures used to train the teacher on the I-Connect application were used to train the student participants. For Training Part 1, the researcher provided direct instruction and modeling of the topography of on task behavior using examples and non examples. The researcher asked the students to provide examples of what they considered on task and off task behavior. The researcher provided the student with video recordings of other students engaging in on task and off task behavior. The behaviors on the video recordings were similar to the topography of the on task and off task behavior the participant exhibited during baseline. The researcher paused the video and asked the student to identify if the behavior exhibited by the student in the recording would be considered on task at that time. Following accurate identification of on task behavior for five consecutive presentations of the behaviors, Training Part 1 concluded.
Training Part 2 was conducted using the same protocol as teacher training (i.e., navigation and utilization of the app using the same YouTube videos from Part 1). Part 2 concluded upon five consecutive intervals of accurate scoring. In Training Part 3, a mock intervention session was conducted, where students were required to correctly match their behavior rating to that of the researcher for four of the five 30 s intervals (i.e., 80%).
Intervention
Following the conclusion of training, the intervention was implemented in the classroom. The two components of the intervention included SM and reinforcement. The researcher prepared the I-Connect application on an iPad for the student before the start of the session, while the teacher prepared the I-Connect application on his iPhone. During intervention, students always used an iPad provided by the researcher, while the researcher and teacher responded to I-Connect prompts using their personal iPhones. The researcher and the teacher simultaneously clicked “start” on the SM timer to begin the data collection session. Once the timer was set on the student’s I-Connect monitor, the researcher immediately placed the iPad on their desk or table and reminded the student to respond to the prompts honestly. Each participant monitored their on task behavior for six 5 min intervals (30 min total). The I-Connect application prompted the students at the end of each 5 min interval with the question, “Are you on task?” and presented the student with the option of “yes” or “no” (Clemons et al., 2016). The teacher also responded to the prompt, “Is (student’s name) on task?” provided by the I-Connect application on his device at the end of each 5 min interval. The teacher responded to this prompt by clicking “yes” or “no.”
Students selected an item from their individualized reinforcement menus before the start of the session (Clemons et al., 2016). Initially, students who solely engaged in a minimum of 80% accurate matches to that of teacher ratings received their chosen reinforcer. Following the completion of the 30 min session, the researcher met briefly with the student to review the data obtained from the I-Connect application, calculated the total number of matching intervals between the teacher and student, and discussed the results with the student. If teacher absences occurred, the students’ rating was compared to that of the researcher and all other procedures remained the same. This occurred nine times within the intervention phases of the study.
By providing the reinforcer for accurate matches only during the first intervention phase, students contacted the reinforcement contingency (i.e., scoring their behavior correctly resulted in access to a reinforcer). Following three consecutive days of accurate matches between the student’s and teacher’s on task behavior rating (Intervention Phase 1), reinforcement continued to be contingent on the student having a minimum of 80% accurate matching with the teacher plus the student also had to be engaged in on task behavior for a minimum of 80% of intervals throughout the instructional period (Intervention Phase 2). Like Clemons et al. (2016), during Intervention Phase 2, reinforcement was only provided to the student upon meeting the dual criteria discussed above.
Follow Up
Two maintenance probes (1 week and 2 weeks following the completion of the intervention phase) were administered to assess the effectiveness of the intervention over time. During the follow up sessions, the I-Connect application was used during the same morning class time, and the reinforcement contingencies from Intervention Phase 2 remained in place.
Experimental Design and Analysis
A nonconcurrent multiple baseline across participants design was used to examine the effects of SM and reinforcement for on task behavior with each participant. The rationale for using the nonconcurrent multiple baselines across participants design was due to frequent school absences by one participant (see Online Supplemental Table). The What Works Clearinghouse (WWC, 2017) 4.0 standards for meeting guidelines with reservations for multiple baseline designs were employed. In addition, effect size estimates were calculated for the duration data with Tau-U (Parker et al., 2011). Tau-U effect size estimates were used to compare the aggregate baseline duration of on task behavior to aggregate intervention duration of on task behavior across all three participants (Pustejovsky et al., 2023). The Tau-U statistic can range from 0, indicating no differentiation between baseline and intervention durations of on task behavior, to 1, indicating complete differentiation between baseline and intervention durations of on task behavior (Parker et al., 2011). Tau-U does not represent the magnitude of change from baseline to intervention and, as such, should be examined in conjunction with visual analysis (Dowdy et al., 2021).
Results
Figure 1 represents the corresponding matches between student and teacher ratings and the presence of on task behavior at the end of each 5 min interval across phases using MTS. Figure 2 represents duration data collected by the researcher and shows increases in the duration of on task behavior with the implementation of Intervention Phase 1 and some additional increases in Intervention Phase 2. Visual analysis of the data in Figures 1 and 2 included the examination of the (a) within- and across-phase level, trend, and variability of the data, (b) across-phase overlap of data, (c) immediacy of intervention effects, (d) consistency of data patterns, and (e) vertical analysis and staggered intervention across participants per the Wolfe et al. (2019) visual analysis of multiple baseline designs guidelines. Due to the consistent changes in level, trend, and variability across phases, there is evidence to infer a causal relation between the independent variable and the outcome variables that would suggest a functional relation exists. In both Figures 1 and 2, all participants showed a change in the dependent variables only when the intervention was implemented. The change occurred immediately after intervention implementation and very little overlap between phases was observed. Table 3 displays the percentage of intervals on task and duration on task for all participants across all phases.
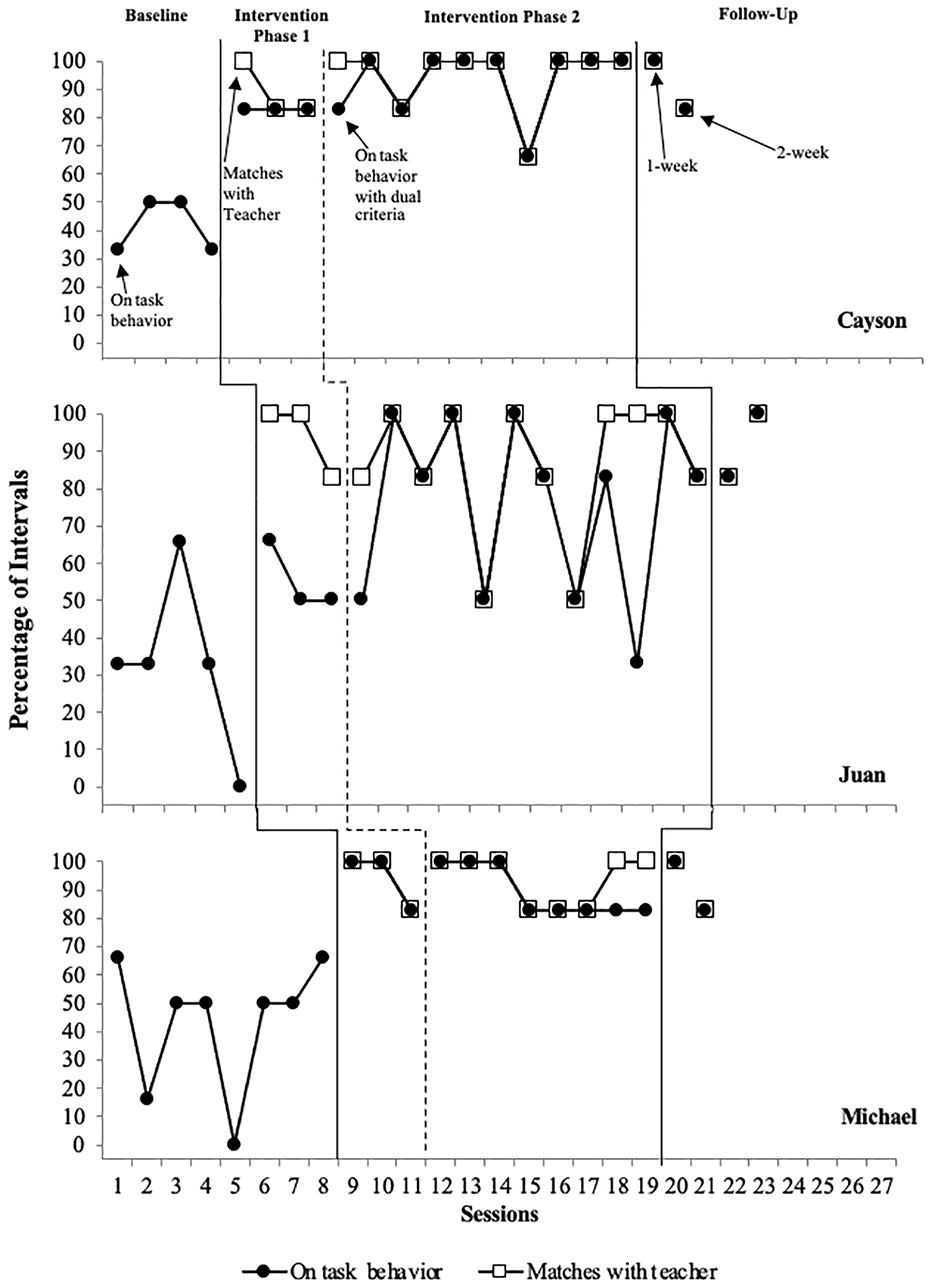
Percentage of Intervals of On Task Behavior and Behavior Rating Correspondence.
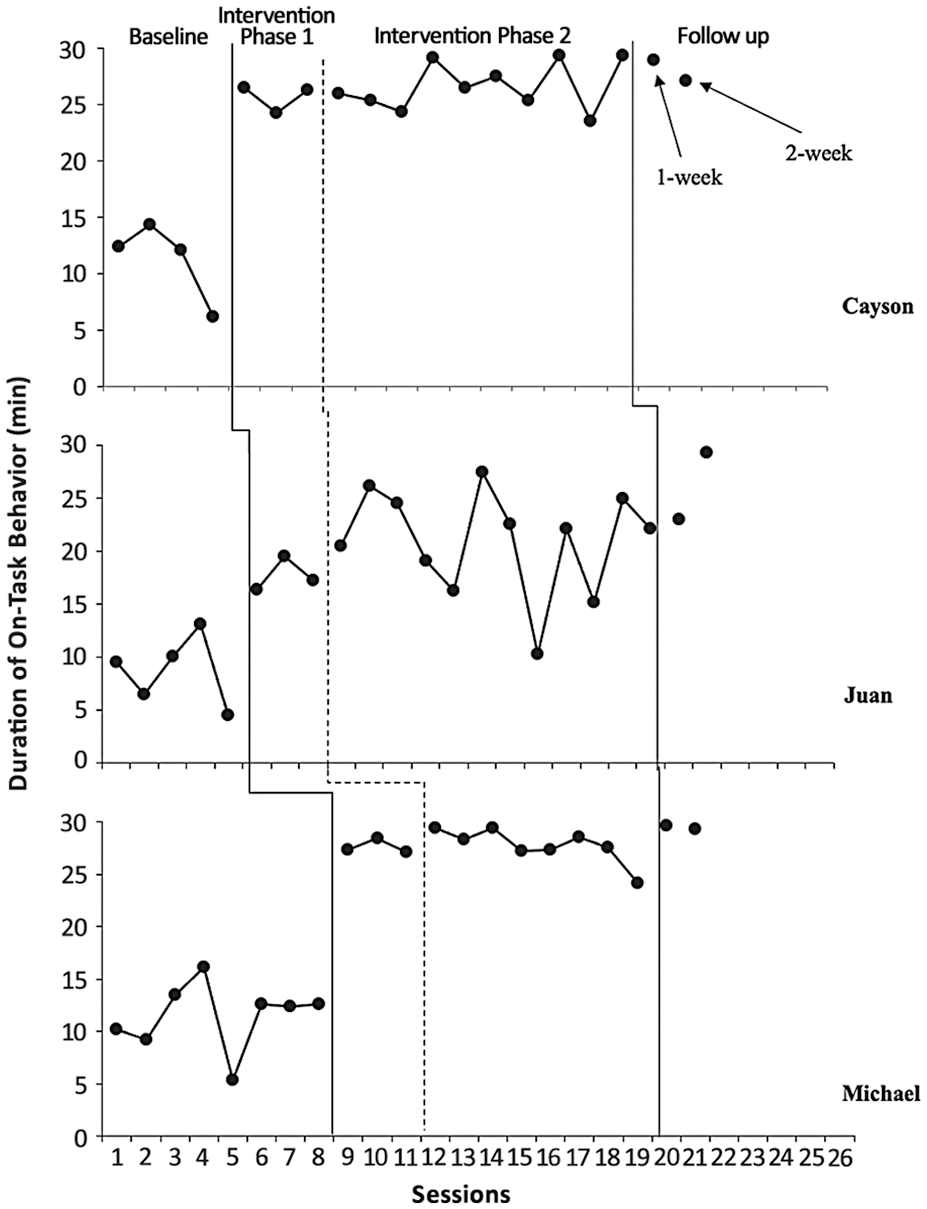
Duration of On Task Behavior.
Percentage of Intervals and Duration On Task across Participants and Experimental Phases.
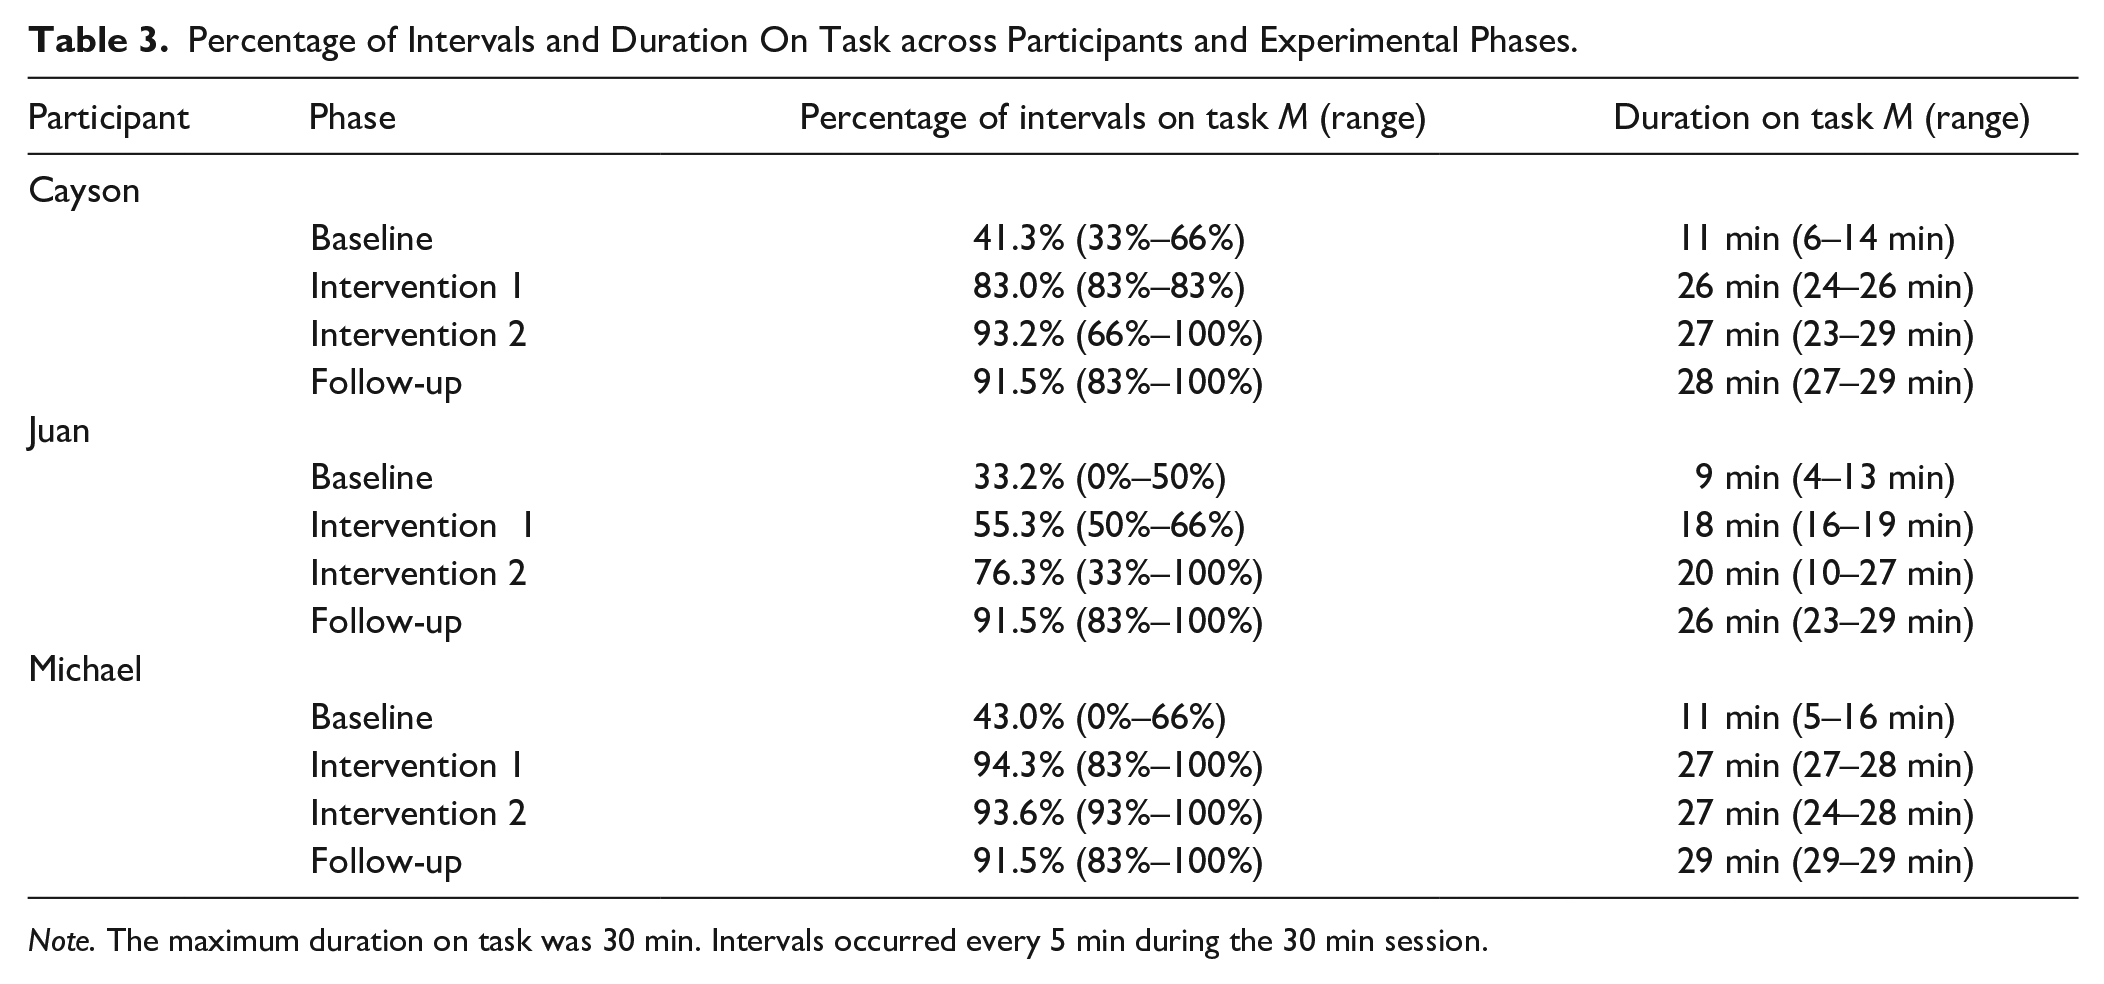
Note. The maximum duration on task was 30 min. Intervals occurred every 5 min during the 30 min session.
Immediate effects were observed when Intervention Phase 1 was implemented. Cayson, Juan, and Michael’s levels of on task behavior either decreased in trend or remained stable. When Intervention Phase 1 was implemented with Juan, Michael’s level of on task behavior remained stable. This pattern of subsequent tiers within the multiple baseline design remaining stable or demonstrating a decreasing trend was also displayed with the staggered implementation of Intervention Phase 2 across all participants. This reduces the likelihood of carryover effects; although all three students were in the same classroom, each student’s on task behavior only increased when each student began intervention, not as a result of their classmate’s intervention.
Cayson
While baseline levels of intervals on task were moderately low, Cayson increased to moderately high levels immediately from baseline to the implementation of Intervention Phase 1. In addition, Cayson had a high and moderately stable level of corresponding matches to his teacher’s rating of his behavior (M = 89%, range = 83%–100%), indicating accurate SM within Intervention Phase 1. During Intervention Phase 2, Cayson displayed a high level of on task behavior and correspondence rating to that of his teacher for a mean of 94.9% (range = 66%–100%), with low variability across sessions. During follow up, Cayson maintained a high level of on task behavior and correspondence on his on task behavior ratings with the teacher for an average of 91.5% (range = 83%–100%).
Juan
Juan displayed low levels of on task behavior in baseline. In Phase 1, Juan had a moderate level of on task behavior and a high level of correspondence between his SM rating of his behavior and his teacher’s rating of his behavior, with an average of 94.3% of matching intervals (range = 83%–100%), demonstrating an immediate effect from baseline. Juan’s on task behavior was variable in Phase 2 but increased to a moderately high level. Juan had a high level of corresponding matches to his teacher for an average of 86% of intervals on task (range = 50%–100%). In follow up, Juan engaged in a high level of on task behavior and his correspondence on SM ratings of his behavior and the teacher’s ratings of Juan’s behavior maintained at a high level during follow up (M = 91.5%, range = 83%–100%).
Michael
Michael’s on task behavior was variable in baseline, with most sessions having a low to moderate level. Michael displayed an immediate, high level of on task behavior and had a high level of correspondence with his SM rating of his behavior and the teacher’s rating of his behavior in Phase 1, with an average of 94.3% correspondence (range = 83%–100%). During Phase 2, Michael maintained a high and stable level of on task behavior and maintained a high level of correspondence on his behavior ratings in Phase 2 for an average of 89.4% of intervals (range = 83%–100%). In follow up, Michael maintained a high level of on task behavior and displayed a high level of correspondence with the teacher for an average of 91.5% of intervals (range = 83%–100%) matched.
Effect Sizes
Tau-U effect size estimates for the duration of on task behavior from baseline to Intervention Phase 1 are displayed in Table 4. The Tau-U effect size for each participant was 1, indicating a large effect size and no overlapping data from baseline to Intervention Phase 1 for all participants.
Tau-U Effect Size Estimates for the Duration of On Task Behavior From Baseline to Intervention Phase 1 for Each Participant.
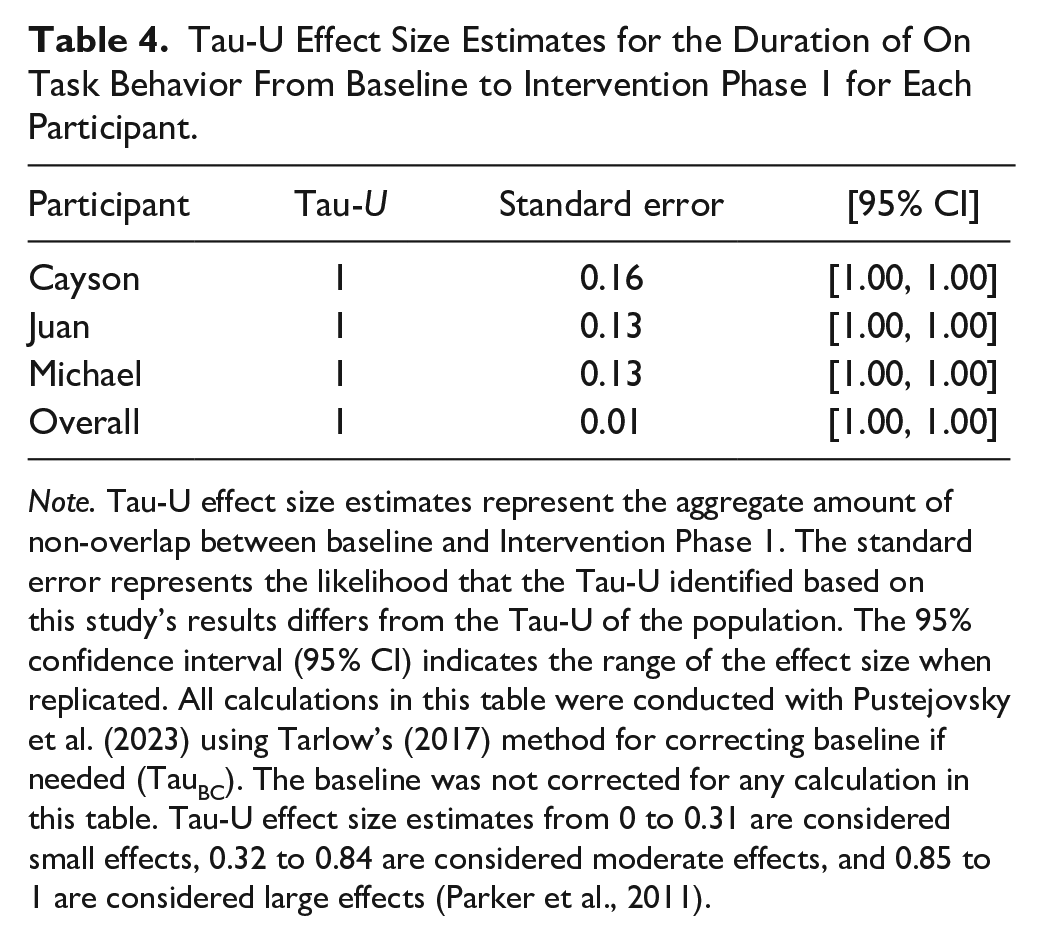
Note. Tau-U effect size estimates represent the aggregate amount of non-overlap between baseline and Intervention Phase 1. The standard error represents the likelihood that the Tau-U identified based on this study’s results differs from the Tau-U of the population. The 95% confidence interval (95% CI) indicates the range of the effect size when replicated. All calculations in this table were conducted with Pustejovsky et al. (2023) using Tarlow’s (2017) method for correcting baseline if needed (TauBC). The baseline was not corrected for any calculation in this table. Tau-U effect size estimates from 0 to 0.31 are considered small effects, 0.32 to 0.84 are considered moderate effects, and 0.85 to 1 are considered large effects (Parker et al., 2011).
Social Validity
The average ratings for both teacher and student social validity ratings were positive (see Table 2). The mean overall social validity rating from the teacher was 4.3 out of 5. He indicated that he saw improvement in his students’ productivity, assignment completion, task accuracy, and overall grades. He identified I-Connect as being exceptionally easy to use during the academic period and indicated a strong likelihood of using I-Connect again in the future. Similarly, social validity ratings for student participants were high with a mean overall rating of 3.75 out of 4 for all three participants. Students reported improvements in grades, assignment completion, and focus on work tasks and instruction delivery as a result of the intervention.
Discussion
This study aimed to extend the research on the use of the I-Connect SM application with contingent reinforcement for students with EBD to increase classroom on task behavior. An additional goal of this study was to examine the effectiveness of using longer SM intervals from previously used 30 s intervals (Clemons et al., 2016) to 5 min intervals to enhance contextual fit within a classroom environment. The data collected from this study indicated that the I-Connect SM intervention resulted in increased on task behavior for all participants during both intervention phases compared to baseline levels.
This study extends the SM literature and research using the I-Connect application in various, notable ways. Primarily, this study showed that I-Connect was effective with a different population—elementary school students with or at risk for EBD. The intervention resulted in increased levels of on task behaviors for all three participants who initially engaged in low rates of on task behavior before the intervention. Much of the literature using I-Connect to increase on task behavior has assessed middle and high school students compared to elementary school students (e.g., Clemons et al., 2016; Wills & Mason, 2014; exceptions are one participant in Rosenbloom et al., 2016 and two participants in Rosenbloom et al., 2019). In addition, most research using I-Connect has previously been conducted with students with autism (e.g., Rosenbloom et al., 2016, 2019) or students with intellectual or learning disabilities (e.g., Clemons et al., 2016). This study extends the I-Connect SM literature by including participants with or at risk of EBD.
Prior research on SM interventions within school settings often uses brief SM intervals (e.g., 30 s or 1 min intervals, Clemons et al., 2016; or 3 min intervals, Amato-Zech et al., 2006), while this study utilized 5 min SM intervals. The results of this study and the use of extended intervals may add to the dearth of literature regarding the determination of effective SM intervals (Bruhn et al., 2022) and support for optimal interval length and frequency to capitalize on classroom productivity and reduce SM task demands (Wills & Mason, 2014). Longer SM intervals may be more socially acceptable and more feasible for teachers which may lead to increased implementation fidelity (Benazzi et al., 2006; Sanetti et al., 2016). The teacher in this study reported that prompts delivered by the I-Connect application were easy to respond to without straying away from the instructional lesson or causing distraction. Finally, this study adds to the growing support of technology based interventions within the school system. Technology based interventions can be more efficient, as they reduce the time spent on data collection, storage, and analysis (Bruhn et al., 2022; Clemons et al., 2016).
Despite low baseline levels of on task behavior for all participants, three noteworthy observations were made. First, there was an immediate increase in the duration of Cayson and Michael’s on task behavior upon the introduction of Intervention Phase 1. The length in which both participants remained on task during the 30 min session almost doubled in time compared to baseline. The participants were immediately able to accurately rate their behavior and remain on task for a majority of the instructional period following the implementation of I-Connect. Juan’s average duration of on task behavior increased from baseline levels, despite the variability of the data in Intervention Phase 1. Juan was able to accurately score his behavior compared to the teacher’s rating to meet the criteria necessary to receive reinforcement in both phases. However, upon the introduction of Phase 2, Juan did not always meet the dual criteria to receive reinforcement as his percentage of intervals on task was occasionally below 80%. When Juan’s percentage of on task behavior fell below the 80% criteria, he still accurately scored his behavior as being off task to match that of his teacher’s most of the time.
This study employed a nonconcurrent multiple baseline design; therefore, it may not be possible to rule out threats related to maturation or history since one cannot visually evaluate whether changes in one tier are related directly to changes in other tiers during the same timeframe (Ledford & Zimmerman, 2023). However, it has been argued that nonconcurrent multiple baseline designs might enhance external validity as they can assess if intervention effects generalize across different times (Kratochwill et al., 2021; Levin & Ferron, 2021; Morin et al., 2023; Slocum et al., 2022). From a logistical and feasibility standpoint, a nonconcurrent design allowed the teacher to work with one student at a time when starting to implement the SM intervention. In addition, collecting data with multiple students would have required several data collectors in the classroom at the same time which was not reasonable in a school setting. Students in this study were enrolled approximately 1- to 2-weeks apart in time. This enrollment gap between students also contributed to high IOA scores, since the researcher and research assistant were only taking data on one student participant at a time. In addition to high IOA, in this study, there was also a high level of TI. TI may have been high due to the training provided to the teacher before baseline and the feasibility of intervention implementation (please see Table 1 for a copy of the TI checklist).
Several limitations were present in this study. First, phase changes were based on the data obtained from the duration measure collected by the researcher, as it was believed to be a more accurate representation of participant on task behavior due to continuous measurement. MTS can over- or underestimate the occurrence of behavior when intervals are greater than 2 min (Cooper et al., 2020); hence, why the duration measure was used for decision-making. Second, teacher absenteeism throughout intervention implementation led to slight modifications to reinforcement delivery and resulted in an increased role of the researcher in maintaining consistency of intervention for all participants. However, the level to which participants remained on task did not differ when the researcher took on this role. Teacher absenteeism occurred once (i.e., 20%) during baseline and nine times (i.e., 52%) during intervention phases. On a few occasions, the teacher was absent from the class due to other job responsibilities such as attending IEP meetings, assisting with problem behavior management, or administering testing to other students; however, the teacher experienced severe health concerns toward the end of intervention resulting in additional absences. Due to these absences, the accuracy of teacher collected data compared to researcher collected data was not evaluated. Thus, a comparison of teacher and researcher collected data should be conducted in future research. Additionally, future research should minimize researcher involvement and should consider increasing the length of the SM interval to be more feasible for the teacher to implement the intervention independently and with high fidelity.
Due to classroom schedules and activity variability, participants occasionally missed a prompt provided by the application. The teacher may have missed prompts due to emergencies (e.g., was called for assistance with behavior management), which is not uncommon, due to the nature of these classrooms. Student participants were sometimes asked to hand out textbooks or worksheets, resulting in them being out of their seat and missing the opportunity to respond to the I-Connect prompt. The researcher and teacher still recorded this as the student being on task. If the end of an interval occurred while the student was out of their seat with the permission of the teacher, the researcher noted it on their datasheet to use as a reference when student and teacher ratings were compared. If the student was identified as being on task for 80% or more intervals per the comparison between the researcher, teacher, and/or secondary observer ratings, reinforcement was provided. Future studies might evaluate a way for students to move about the classroom with the iPad or use a smaller device such as a watch to avoid missing prompts.
Finally, it is possible that the audible prompt used in this study could have been distracting to other students within the classroom. Some students looked up or made comments about phones not being allowed in school due to the similarity between the audible prompt delivered by I-Connect to a commonly used text tone on the iPhone. The teacher briefly explained it was not a cellular device and was part of an intervention. Redirection of these students to the original task occurred swiftly.
This study used the I-Connect application with a novel population (i.e., elementary school students with or at risk for EBD) to measure on task behavior. Future studies could assess the use of I-Connect with students with EBD in middle and/or high school to increase task completion and/or task accuracy. Future research could also assess the use of the intervention throughout the entirety of the school day for high school students as they navigate through different class periods and locations throughout the school building. The use of I-Connect might foster increased on task behavior for students in all class periods and can be systematically faded out upon reaching specified criteria. I-Connect might also be useful in increasing class wide task completion, class attendance for high school students, or positive teacher–student interactions. In addition, I-Connect could be used to prompt teachers to increase their rate of positive interactions with their students.
Conclusion
Technology driven interventions that use SM could help practitioners and school personnel more easily obtain various types of data on student behaviors, as data collection can be collected by the participants themselves without the consistent oversight of behavioral or school professionals. I-Connect is effective and has strong social validity across the literature (e.g., Clemons et al., 2016; Rosenbloom et al., 2016). Contributing to the growing research, this study offered further support for the use of interventions to promote desired student behavior and can result in high levels of contextual fit within the school environment.
Supplemental Material
sj-docx-1-pbi-10.1177_10983007241268784 – Supplemental material for The Effects of Self Monitoring With I-Connect to Increase On Task Behavior of Students With or at Risk for Emotional and Behavioral Disorders
Supplemental material, sj-docx-1-pbi-10.1177_10983007241268784 for The Effects of Self Monitoring With I-Connect to Increase On Task Behavior of Students With or at Risk for Emotional and Behavioral Disorders by Marissa L. Del Vecchio, Kimberly Crosland and Asha Fuller in Journal of Positive Behavior Interventions
Footnotes
Declaration of Conflicting Interests
The authors declared no potential conflicts of interest with respect to the research, authorship, and/or publication of this article.
Funding
The authors received no financial support for the research, authorship, and/or publication of this article.
References
Supplementary Material
Please find the following supplemental material available below.
For Open Access articles published under a Creative Commons License, all supplemental material carries the same license as the article it is associated with.
For non-Open Access articles published, all supplemental material carries a non-exclusive license, and permission requests for re-use of supplemental material or any part of supplemental material shall be sent directly to the copyright owner as specified in the copyright notice associated with the article.