
Abstract
The present study was designed to examine the incidence, impact, and perception of sexual harassment in law enforcement by utilizing a mixed methods approach and two data sources. In Study 1, quantitative data were provided by 679 male and female personnel in a large law enforcement agency. In Study 2, 531 female police officers provided qualitative responses to a national survey addressing a range of professional experiences. Most respondents from these two studies experienced behaviors that could potentially be sexually harassing. Very few were reported with a formal complaint, but retaliation was common and often severe. Regression analyses demonstrate that such experiences have a negative impact on both personal and professional outcomes. Yet narrative responses reveal that respondents do not typically appraise them negatively. Patterns are explored for the various types of behavior, the organizational status of those involved, the response strategy employed, and the outcome of the situation.
A considerable body of research demonstrates that sexual harassment is more common in professions that are nontraditional for women (i.e., where the majority of employees are male and the duties are traditionally defined as masculine)—as compared with fields where women are traditionally employed (Berdahl, 2007; Fitzgerald, Drasgow, Hulin, Gelfand, & Magley, 1997; Glomb, Munson, Hulin, Bergman, & Drasgow, 1999; Gruber, 1998; Mansfield et al., 1991). The present study was designed to examine the incidence, impact, and perception of sexual harassment in law enforcement utilizing a mixed methods approach and two data sources. Using both quantitative and qualitative methods, we offer a detailed picture of the phenomenon and capture some underlying factors that influence the perceptions, responses, and outcomes.
Definitions of Sexual Harassment
Sexual harassment is defined by the U.S. Equal Employment Opportunity Commission (EEOC) as follows: Unwelcome sexual advances, requests for sexual favors, and other verbal or physical conduct of a sexual nature constitute sexual harassment when this conduct explicitly or implicitly affects an individual’s employment, unreasonably interferes with an individual’s work performance, or creates an intimidating, hostile, or offensive work environment (EEOC, 1980, p. 74677).
Yet the legal definition is not the only one available. Sexual harassment has also been defined empirically, based on decades of social-psychological research. For example, Fitzgerald, Swan, and Magley (1997) defined the construct as “unwanted sex-related behavior at work that is appraised by the recipient as offensive, exceeding her resources, or threatening her well-being” (p. 15). This definition was used to develop the Sexual Experiences Questionnaire (SEQ), which is “the most widely-used and validated measure of sexual harassment to date” (Cortina & Berdahl, 2008, p. 471). Items on the SEQ tap three dimensions of sexual harassment. Unwanted sexual attention includes sexually suggestive comments that are made to or about a person as well as inappropriate touching. Gender harassment includes behaviors such as dirty jokes or stories that are told in the workplace, or comments that put women down. Finally, quid pro quo literally translates to “this for that.” The term is therefore used to describe situations where an employee is forced to submit to unwanted sexual advances as a condition of employment, either with a tangible job reward for complying or punishment for refusing.
Outcomes of Sexual Harassment
Sexual harassment has a range of well-documented negative effects on the psychological and professional well-being of victims (for a comprehensive review, please see Cortina & Berdahl, 2008). These outcomes are seen across a wide variety of workplace contexts, and they remain significant even when controlling for the experience of other stressors (e.g., general job stress, trauma outside of the workplace), other features of the job (occupational level, organizational tenure, workload), personality (negative affectivity, neuroticism, narcissism), and other demographic factors (age, education level, race). (Cortina & Berdahl, 2008, p. 477)
Not surprisingly, this negative impact is typically more severe when the sexually harassing behaviors are experienced with greater frequency (Langhout et al., 2005; Schneider, Swan, & Fitzgerald, 1997). On the other hand, it is apparently not affected by how it is labeled. Rather, the negative impact that victims experience in terms of their physical, psychological, and professional well-being appear to be the same, regardless of whether or not they identify the behavior as sexual harassment (Magley, Hulin, Fitzgerald, & DeNardo, 1999; Munson, Miner, & Hulin, 2001). This is particularly noteworthy, because most victims do not label their experience. Research estimates suggest that fewer than 20% will do so (Magley et al., 1999).
Reporting Behaviors
There is little doubt that most sexually harassing behavior remains unreported. Estimates suggest that fewer than 25% of women file a formal complaint after experiencing sexual harassment, regardless of the specific workplace context (Cochran, Frazier, & Olson, 1997; Cortina, 2004; Culbertson & Rosenfeld, 1994; Schneider et al., 1997). This is true even for women who are sexually assaulted by a coworker. One study of women who experienced an attempted or completed workplace rape found that only 21% filed a formal report and 19% quit (Schneider, 1991). The reasons for nonreporting of sexual harassment are numerous, and they include concern that nothing will be done or that reporting may even make the situation worse (Cortina, 2004; Fitzgerald, Swan, & Fischer, 1995; Wasti & Cortina, 2002).
Sexual Harassment in Law Enforcement
Estimates range widely for the incidence and prevalence of sexually harassing behaviors within law enforcement. On one hand, 24% of the police women in one study said that they experience a “constant atmosphere” of offensive remarks (Timmins & Hainsworth, 1989). Yet 100% of the female officers who were interviewed in a second study described experiencing at least one sexually harassing behavior during the course of their career (Haar, 1997). Most estimates fall somewhere in between, converging on a range from 53% to 77% (Bartol, Bergen, Volckens, & Knoras, 1992; Christopher et al., 1991; Martin, 1994; Nichols, 1995; Robinson, 1993). This suggests that one half to three quarters of the American women who work in law enforcement will be subjected to some form of sexually harassing behavior in their workplace, with sexual and/or sexist remarks being the most common by far. However, most of these studies have utilized only a single item to assess the frequency of such experiences and/or explicitly asked respondents whether they have been “sexually harassed.” Both of these practices are problematic. First, any single item will fail to reliably assess the full range of possible experiences with such behavior. Second, questions that explicitly ask about sexual harassment are actually assessing the labeling of these behaviors rather than their objectively defined experiences (Fitzgerald, Magley, Drasgow, & Waldo, 1999).
One exception is the study conducted by Robinson (1993), who surveyed 1,269 female police officers throughout the state of Florida and found that 61% had experienced at least one of the specific behaviors listed on the questionnaire during the last 6 months. Yet very few formally complained, either to someone within their agencies (23%) or outside (15%). One explanation may be that women in law enforcement are less likely than those in other fields to label their experiences as sexual harassment. For example, only 21% of the women in Robinson’s study who had experienced one of the behaviors suggested that they had been “sexually harassed.” However, little is known about the specific impact of such behavior on police officers and how it might differ by gender. In addition, very little work has sought to explore whether police officers will label such experiences as sexual harassment, and if not, what their process is for appraising such behavior. The present study was conducted to fill this void, using a mixed methods research design. As described in Brent and Kraska (2010), such a design allows for a more comprehensive understanding—in this case, by documenting the wide range of sexually harassing behaviors that women in policing have experienced and offering a rich and nuanced description of their perceptions of those experiences.
Method
Two studies were conducted to explore these issues. Study 1 involved surveying sworn personnel within a single large law enforcement agency. The survey in Study 2 was then conducted with a national sample of female police officers.
Study 1
Sampling procedure
The initial sample was created using the roster of 2,602 enlisted personnel within the law enforcement agency. An initial sample of 797 sworn personnel was designed to include all of the women (n = 82), all of the minority men (n = 369), and a random sample of the White men (n = 346). At the time of the survey administration, the agency employed only 2.7% women among their sworn personnel, which was considerably lower than the national average of 12.7% for large agencies and 8.1% for small and rural agencies (Lonsway, 2007).
An effort was also made to oversample respondents with the rank of Captain or higher. This increased the initial sample size from 797 to 807. A letter from the agency head was sent to these 807 personnel, informing them of the survey’s purpose and procedures. The study was described as a work environment survey, with questions to address “the challenges, rewards, and concerns” associated with their jobs and coworkers. Participants were explicitly informed that the focus was “to determine whether women and minorities experience different issues than their colleagues,” and they were told that their responses would be used to guide policy reforms in this area.
Survey administration
Those with the rank of Captain or above received their survey questionnaire in the mail. Sworn personnel of the rank of Lieutenant or below were directed to report in groups of approximately 50 to the survey administration site at a specified date and time. On reporting to the site, they were welcomed by a member of the research team and provided a brief introduction regarding the purpose and procedure for the survey. Their rights and roles as research participants were then described, and they were reminded that the survey effort was conducted to assist in improving the working conditions at the agency.
Final response rate
Usable surveys were returned from 69 of the 82 women, 293 of the 369 minority men, 301 of the 346 randomly sampled White men, and 16 respondents who did not indicate their gender and/or racial identification. An agency report identified a number of reasons for nonparticipation by the remainder of the sample, which included required court appearances, vacation days, training, emergency responsibilities at the duty station, and extended sick leave. The following survey results are therefore based on the 679 usable surveys returned from the original sample of 807 individuals invited to participate. This represents an excellent response rate of 84.1%.
Sample demographics
Of the 679 officers completing a usable survey questionnaire, 69 (10.2%) were women, 607 (89.4%) were men, and 3 (0.4%) did not indicate their gender. Their breakdown by racial/ethnic identification was 53.8% European American/White, 24.3% African American/Black, 11.5% Hispanic, and 10.5% who indicated another category or provided no response to the question.
Respondents ranged in age from 24 to 54, with an average of 38.8. They reported being with the agency for an average of 14.1 years (with a range from 2 to 32 years) and in their current assignments for an average of 5.7 years (with a range from 1 to 29 years). All but 5 of the 679 survey respondents provided information on their rank. Of these, most were either in line operations (e.g., patrol) or Detectives (62.4%), with an additional 30.3% who were Sergeants, 5.0% Lieutenants, and 2.2% with the rank of Captain, Major, or above.
Survey instrument
After providing background information, respondents in Study 1 were asked to complete a number of measures tapping Work Attitudes and Behaviors, Health and Well-Being, and Individual Tolerance of Sexual Harassment. Measures were selected based on their well-established psychometric properties and prior association with sexual harassment.
Work attitudes and behaviors
Briefly, Work Withdrawal and Job Withdrawal were assessed with scales developed by Hanisch and Hulin (1990). An abbreviated version of the Job Descriptive Index (originally developed by Smith, Kendall, & Hulin, 1969 and revised by Roznowski, 1989) was used to measure satisfaction with various aspects of the job: work, coworkers, and supervisors. Job Stress was then evaluated using a shortened version of the Stress in General Scale (Stanton, Balzer, Smith, Parra, & Ironson, 2001). For both the Job Descriptive Index and Job Stress Scale, several new items were developed for the present study and added to address unique aspects of the law enforcement context. (For more information, see Lonsway, 2007).
Health and well-being
Next, respondents were asked to complete two measures of their physical and psychological well-being. First was the Satisfaction With Life Scale (Diener, Emmons, Larsen, & Griffin, 1985). Second was the Brief Symptom Inventory (Derogatis, & Spencer, 1983), which taps depression, anxiety, and physical somatization (i.e., symptoms).
Experiences
Respondents were also asked about the frequency of their experiences (within the past year) of 16 behaviors drawn from the Sexual Experiences Questionnaire (SEQ). This measure was originally developed by Fitzgerald, Drasgow, Hulin, and Gelfand (1993) and revised for use in the present study. Responses were provided on a frequency scale ranging from “never” to “most of the time.” For each respondent, scores were computed for the three SEQ subscales: unwanted sexual attention, quid pro quo sexual harassment, and gender harassment.
For each individual behavior, respondents were then asked to indicate who perpetrated the behavior: a “coworker,” “supervisor,” “command staff,” or “other.” They were also asked whether the behavior was reported to a supervisor or command staff. Options were “not reported,” “discussed informally,” or “filed a formal complaint.” As a follow-up question, respondents were asked whether they had filed a formal complaint and, if so, whether they experienced retaliation. If they had not filed a formal complaint, they were asked to indicate their reasons.
Labeling
Although SEQ items were written in purely behavioral terms, a question in both studies asked respondents whether they had been “sexually harassed” to determine whether they labeled any situation as such. For a more detailed description of the method and measures used in Study 1, please see Lonsway (2007).
Study 2
Sampling procedure
For Study 2, a systematic random selection design was employed to identify a national sample of female officers. First, a list of law enforcement agencies was drawn from the National Directory of Law Enforcement Administrators, Correctional Institutions, and Related Agencies published by the Public Safety Information Bureau (2002). The number 30 was then randomly chosen from a table, and every 30th agency on the list was selected to receive surveys for their female officers. Agencies were contacted to determine the actual number of female officers they employed and to gain permission from the person in the agency with authority to grant it. Once permission was granted, surveys were sent to a contact person within the agency for distribution to all their female officers.
On nearing the end of the listed agencies, it was discovered that the target sampling frame of 2,000 female officers was not going to be met for the sample. This happened both because some agencies employed few (or no) female officers (often because they were small agencies) and/or because they denied permission to send the surveys. Therefore, a new random number was selected (29) and contacts were made with every 29th agency listed in the directory until the target number of 2,000 female officers was met.
Survey administration and response rate
Surveys were mailed to sampled female officers, and they were returned using a preaddressed, postage paid envelope that was included with the mailed survey. Approximately 2,000 surveys were mailed out, and 531 were returned. This represents a final response rate of approximately 26.6% from the sample of female officers who were identified. For a more detailed description of the method and measures used in Study 2, please see Seklecki and Paynich (2007).
Sample demographics
All respondents in Study 2 were female. Most were White (75.0%), with the remaining 14.3% African American, 6.4% Hispanic, 0.6% Native American, and 1.7% representing other racial/ethnic groups. Only 11 respondents failed to indicate their racial/ethnic identification.
Most women indicated that they were line officers (69.3%), although 16.0% held the rank of Sergeant, and approximately 3% had achieved the position of Chief or other equivalent rank. Respondents typically worked for a municipal police department (73.6%) or sheriff’s office (24.7%). Only two respondents worked for a state police agency, and one for a campus agency.
On average, respondents had been employed in law enforcement for 11.25 years, and they had held their current rank for 5.35 years. The average number of sworn officers in their agencies was around 489 (with a median of 120), and the average population served was about 254,057 (with a median of 70,000). The most common assignment for survey respondents was patrol (55.4%), and the next most frequent was investigations (20.7%). The rest of the survey respondents were divided between several other assignments within their agencies.
Survey instrument
Background information
As in Study 1, the female officers responding to the survey in Study 2 were first asked to provide some background information and beliefs and attitudes regarding their employment.
Experiences
Respondents were also asked to indicate how frequently they experienced 15 behaviors during the course of their career in law enforcement. As in Study 1, these items were drawn from the SEQ but slightly revised for the present study. Response options included “never,” “once or twice,” and “three or more times.” They were then asked to provide more detailed information about their experiences with each of the behaviors: “Please describe the situation in more detail (who was involved, did you file a complaint, if so, what was the outcome of the complaint . . .).” Narrative responses were submitted to a process of thematic coding to identify patterns. (For more detailed information about the methods and measures used in Study 2, please see Seklecki & Paynich, 2007).
Thematic coding
To conduct the qualitative research, the research team began by examining the data and identifying themes that appeared to best represent narrative responses. Through collaborative interaction, final coding categories were clarified by adding, removing, or modifying these thematic descriptors. Two independent raters then coded responses for two of the 15 SEQ items, and their initial agreement was calculated (84.6% for one item and 87.4% for the other). Next, they engaged in a process of discussion and debate to clarify the category definitions, and recoded the responses that produced initial disagreements. Their level of agreement was recalculated, and it increased to 91.6% and 94.0%.
The raters then coded responses to four additional SEQ items, and engaged in the same process of calculating initial level of agreement, clarifying the category definitions, and recoding responses with disagreements. As a result, the final level of agreement for these four items ranged from 91.6% to 100%. The coding definitions were thus finalized, and the raters independently coded the remaining SEQ items. Final agreement levels ranged from 91.6% to 100% for the 15 items, with an average of 96.65%.
Results
Incidence of Behaviors
Overall, 83.5% of the sample in Study 1 indicated that they had experienced at least one of the behaviors on the SEQ during the past year. This included 82.6% of the men and 92.5% of the women. In Study 2, an even higher percentage (93.8%) of the female officers indicated that they experienced at least one of the behaviors during the course of their law enforcement career. Table 1 summarizes the percentage of respondents in both studies who experienced each behavior at least once. Please note that for Study 1, respondents were only asked about their experiences during the last year. For Study 2, it was during the course of their law enforcement career. Thus it makes sense that the percentage in Study 2 is higher than in Study 1. Table 1 also includes the most common perpetrator for each behavior and the percentage of respondents who filed a formal complaint (from Study 1).
Incidence of Behaviors, Most Common Perpetrators, and Percentage of Behaviors Reported.
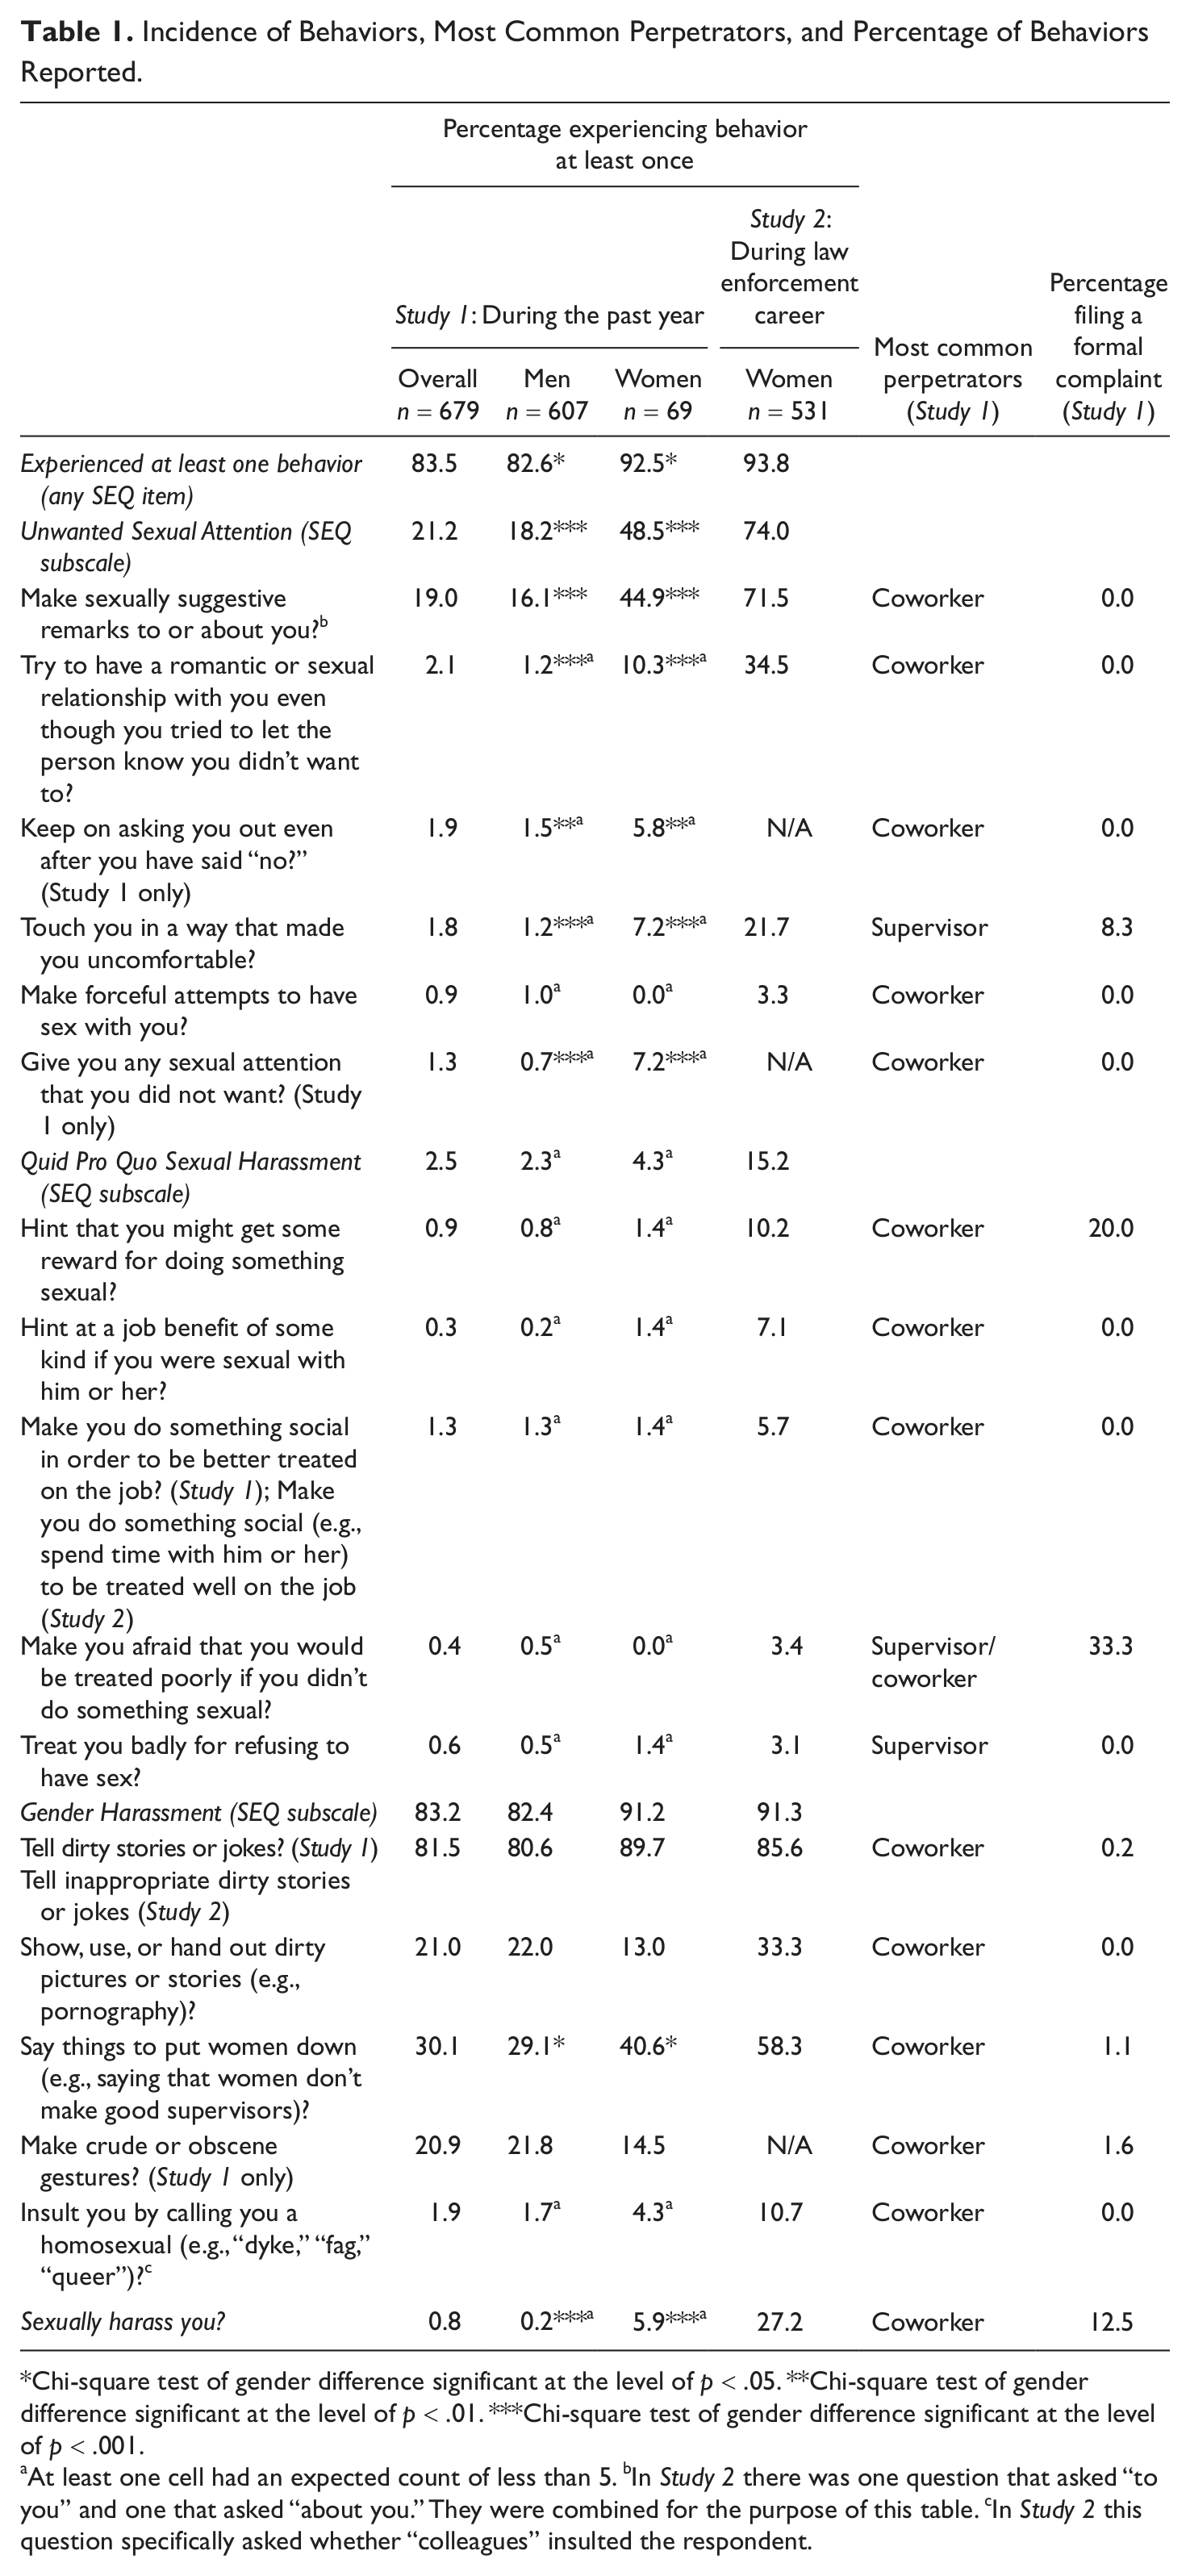
Chi-square test of gender difference significant at the level of p < .05. **Chi-square test of gender difference significant at the level of p < .01. ***Chi-square test of gender difference significant at the level of p < .001.
At least one cell had an expected count of less than 5. bIn Study 2 there was one question that asked “to you” and one that asked “about you.” They were combined for the purpose of this table. cIn Study 2 this question specifically asked whether “colleagues” insulted the respondent.
The Appendix presents descriptive statistics for all quantitative measures, and it therefore offers another view of the frequency of SEQ behaviors. Overall, the mean score of 19.2 on the 16-item SEQ suggests that behaviors were not experienced very often in the past year, with an average item frequency only slightly higher than “never” (1.2). The average item-level score for two of the three subscales was similarly low: 1.1 for unwanted sexual attention, 1.0 for quid pro quo harassment. Only gender harassment was experienced more frequently, with an average item score of 1.5, suggesting a frequency between “once or twice” and “sometimes” in the past year.
Most Frequent Behaviors
As Table 1 reveals, a few behaviors were experienced more frequently than others, by respondents in both samples. Most of these behaviors constituted gender harassment or unwanted sexual attention that was verbal in nature. For example, more than three quarters of the sworn personnel in both studies had heard “dirty stories or jokes” in the workplace during the past year. Other common behaviors in both studies were statements that “put women down,” exposure to “dirty pictures or stories (e.g., pornography),” and “sexually suggestive remarks.” In Study 1, another common behavior was “crude and obscene gestures” (this behavior was not included in Study 2). For participants in Study 1, these five most common behaviors were all typically committed by a coworker, and they were very rarely reported. The percentage of such behaviors that resulted in a formal complaint ranged from zero to a high of 1.6% (for “crude and obscene gestures”).
Unwanted sexual attention that was physical in nature and quid pro quo sexual harassment were experienced less frequently by respondents in both studies. However, they were more likely to be committed by a supervisor and more likely to be reported. As revealed in Study 1, the percentage of these behaviors resulting in a formal complaint ranged from zero to 8.3% for unwanted physical touching and 33.3% for quid pro quo behaviors (fear of being treated badly for not engaging in sexual behavior). Almost 1% of the respondents in Study 1 and more than 3% of the women in Study 2 indicated that they had experienced forceful attempts to have sex with them. In Study 1, all of these respondents were men.
Labeling Sexual Harassment
Only five respondents in Study 1 (0.7% of the sample) said they had been “sexually harassed” during the past year (four women and one man). In Study 2, however, as many as 27.2% of the female officers said they had been “sexually harassed” during their career.
Study 1: Quantitative Analyses
Gender comparisons
Next, gender comparisons were conducted with the three SEQ subscales in Study 1, using a Bonferroni correction to control for accumulated error rate (α = .02). The only significant effect was found for unwanted sexual attention, t(74.40) = −3.62 (equal variances not assumed), p < .001. 1 Mean scores suggested that the effect was due to a greater frequency of behaviors being experienced by women as compared to men. Cohen’s (1977) d-statistic was computed as .53, suggesting a moderate effect size. 2 No gender differences were seen for the SEQ subscales tapping gender harassment or quid pro quo sexual harassment.
Outcome measures
Study 1 responses were also examined to explore whether behaviors on the SEQ had an impact on a range of personal and professional outcomes (specifically, the 10 measures described in the Appendix under Work Attitudes and Behaviors as well as Health and Well-Being). A series of regression equations were run with two predictor variables: the number of years that respondents had worked for their agencies (i.e., tenure) and their current rank. 3 These two variables were first tested alone, and then a total score on the SEQ was added to determine whether it accounted for unique variance in each of the outcomes. A Bonferroni correction was again used for the 10 outcome variables, so alpha was set at .005. Results are presented in Table 2, and they reveal that SEQ total scores explained unique variance for every single one of these 10 outcome measures—even when controlling for the variables of tenure and rank (p < .005). Across the 10 outcome measures, R2 for the original model (with only tenure and rank) ranged from less than .01 to .05. The change in R2 for this step then ranged from .02 to .06, so the models with SEQ scores predicted a total of 3% to 8% of the variance in the 10 outcome measures.
Regression Analyses Predicting Personal and Professional Outcomes (Study 1).
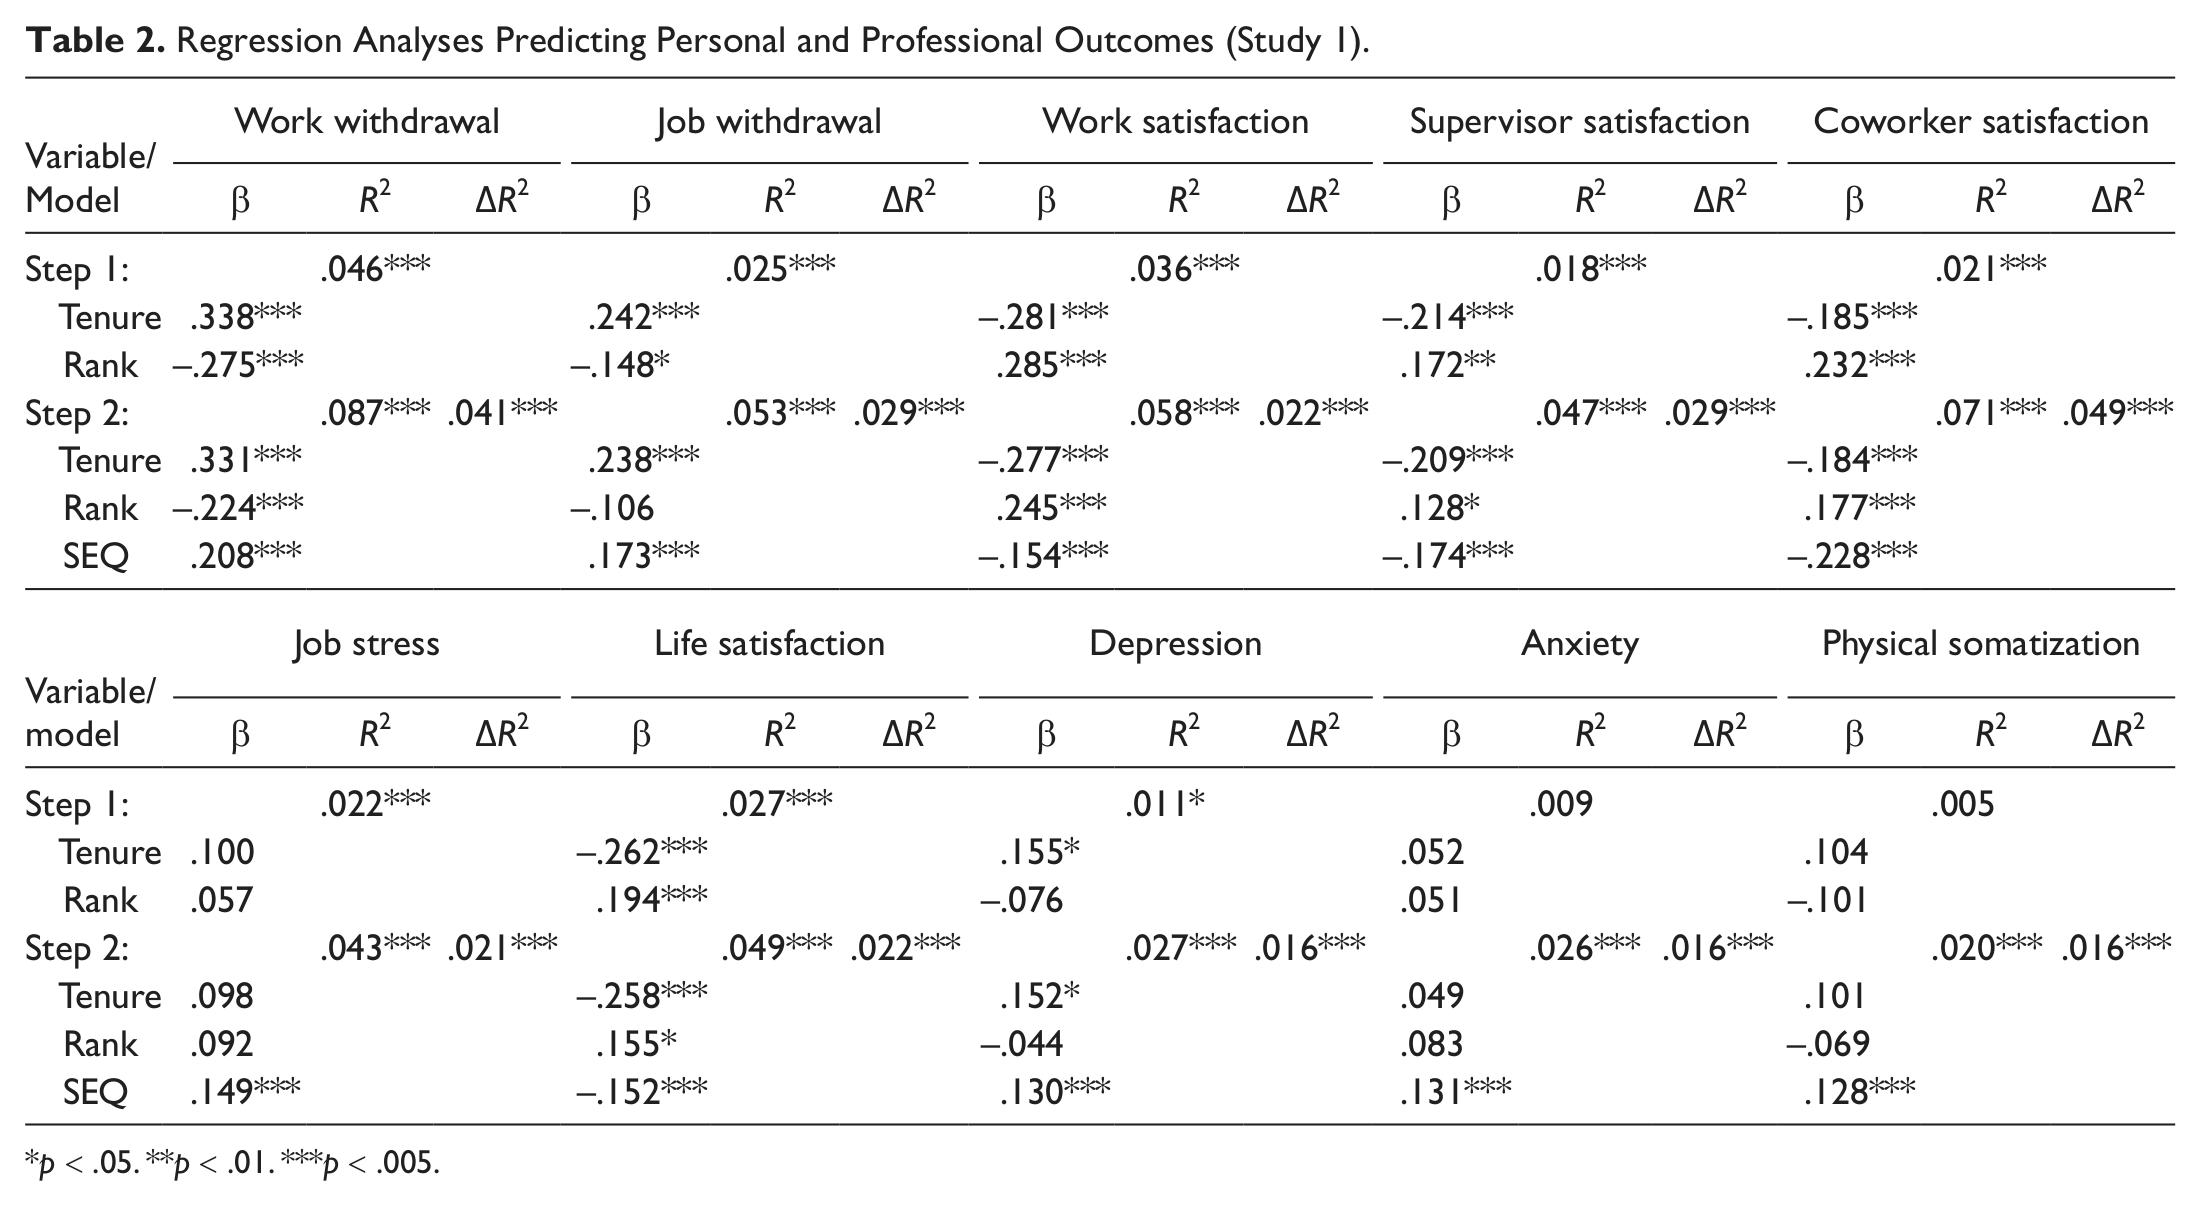
p < .05. **p < .01. ***p < .005.
Reporting and retaliation
Respondents in Study 1 were next asked to select from a range of options indicating whether they had ever filed a formal complaint in their agency and whether they experienced retaliation as a result. As seen in Table 3, most (89.0%) had never filed such a formal complaint. Only 5.3% of the sample indicated that they had “filed at least one formal complaint, but never experienced retaliation as a result.” Smaller percentages said they had experienced retaliation as a result of filing a complaint for sexual harassment, sex discrimination other than sexual harassment, race discrimination, or some behavior other than race or sex discrimination. In other words, almost half (47.8%) of those who had filed a formal complaint for any such behavior stated that they had experienced retaliation as a result. Interestingly, only female respondents experienced retaliation after reporting sex discrimination, and only male respondents experienced retaliation after reporting race discrimination.
Reporting and Retaliation (Study 1).
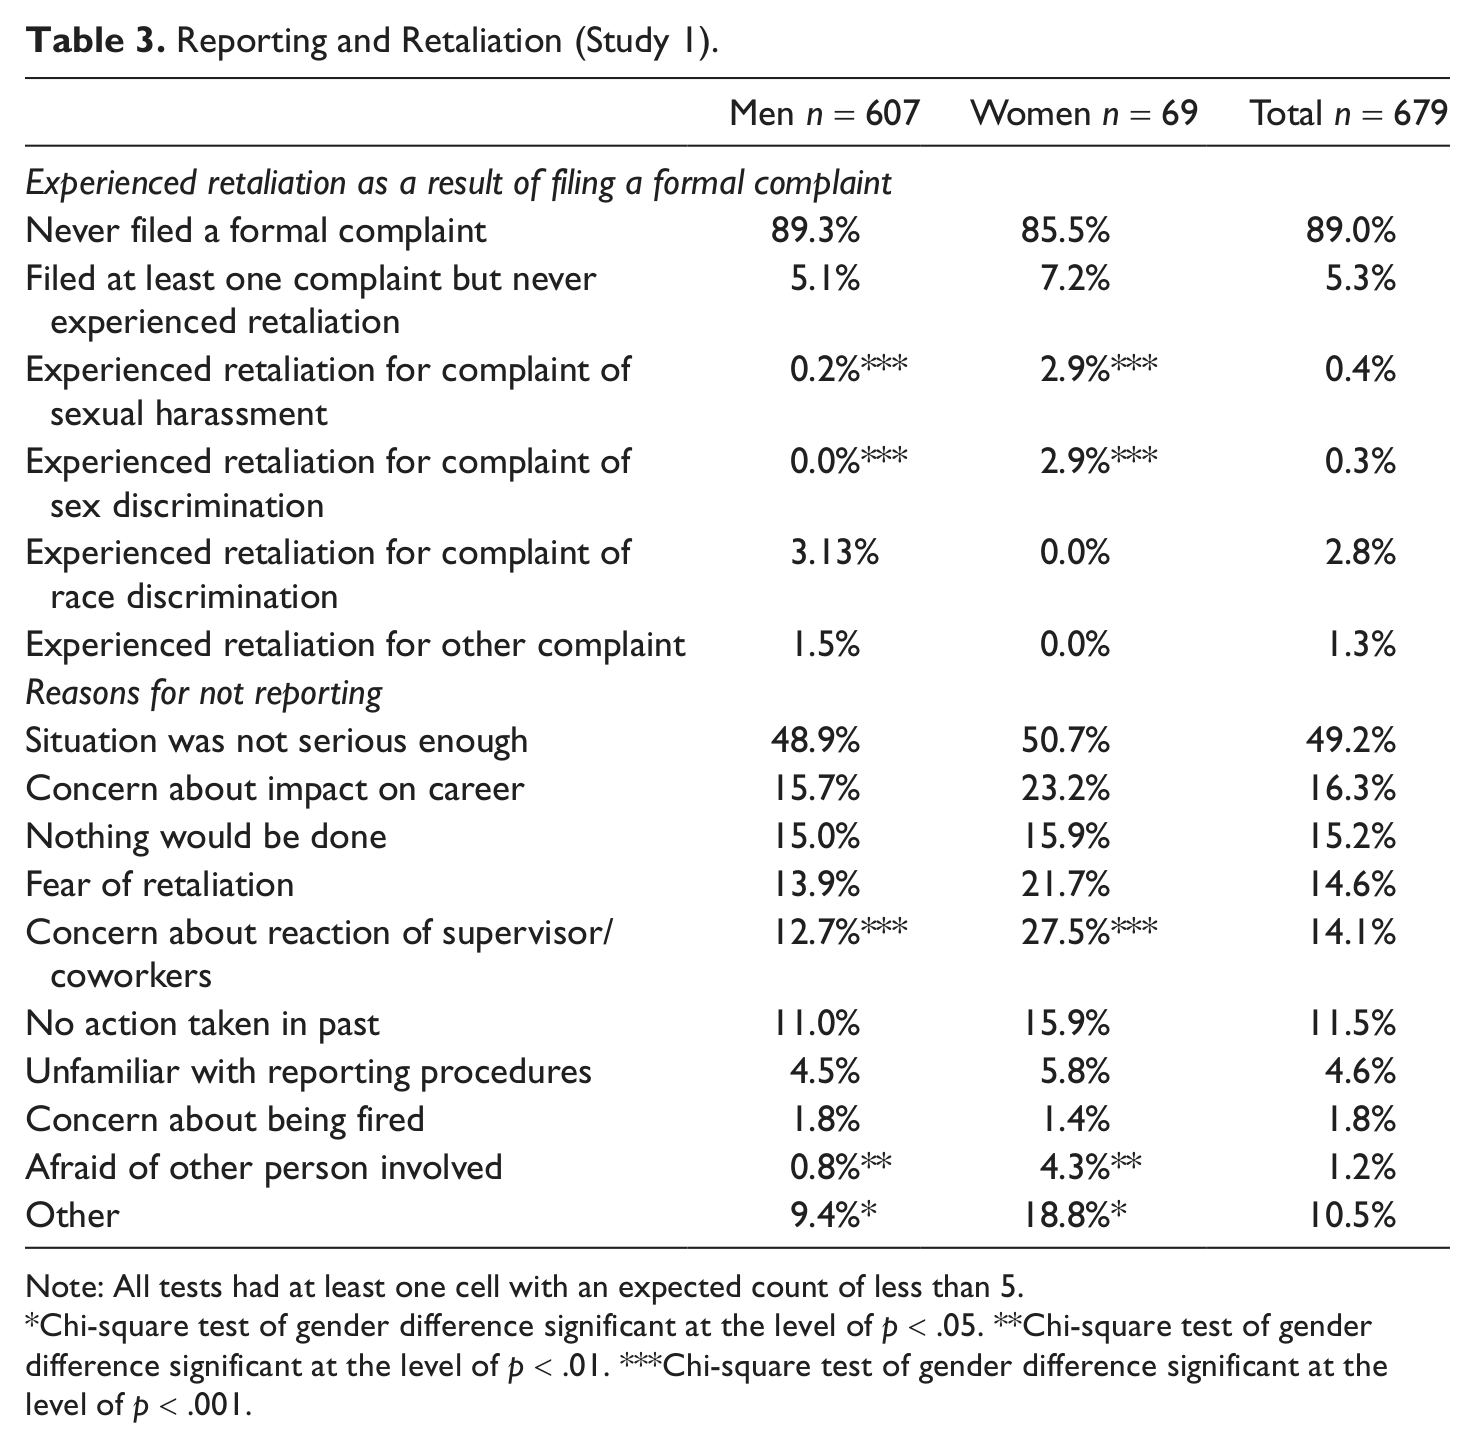
Note: All tests had at least one cell with an expected count of less than 5.
Chi-square test of gender difference significant at the level of p < .05. **Chi-square test of gender difference significant at the level of p < .01. ***Chi-square test of gender difference significant at the level of p < .001.
Reasons for not reporting
As seen in Table 1, very few Study 1 respondents reported any of the behaviors included on the SEQ using a formal complaint process. They were therefore provided with the following prompt: “If you decided NOT to file a formal complaint in any of the situations described above, please indicate your reasons for not doing so.”
By far, the most common response to this question was that the “situation was not serious enough to warrant a formal complaint”; this option was endorsed by 49.2% of the sample. Other common responses included “concern about the impact of reporting on my career,” concern that “nothing would be done if a complaint were filed,” “fear of retaliation by supervisors and/or coworkers,” “concern regarding the reaction of supervisors and/or coworkers,” and “similar situations have been reported and no action was taken.” Table 3 shows the gender differences for these responses. For example, women were more likely than men to indicate that they did not report because of “fear of retaliation” or “concern regarding the reaction of supervisors and/or coworkers.” A smaller percentage of respondents indicated that they were unfamiliar with reporting procedures, they were concerned about being fired because of their probationary employment status, or they were afraid of the person involved in the situation.
Study 1 respondents were also given space in which to write their “other” reasons for not filing a report. By far, most of these open-ended comments indicated that the situation was either not a problem or something that respondents felt they should handle personally. Many emphasized that the incidents were “just joking,” “not hostile,” and “all in fun.” However, others were concerned that nothing would be done or they wouldn’t be able to take the matter further. One respondent stated that the situations were “just part of the job—deal with it,” and another suggested that “some things aren’t believed.” Finally, one man stated that the experience made him a “better officer.” Similar themes were echoed in the qualitative data from Study 2.
Study 2: Thematic Coding
Study 2 respondents were asked to provide narrative responses describing their experiences with behaviors that were drawn from the SEQ. Responses were categorized based on their SEQ subscale and then assigned codes to capture the response strategies officers used as well as outcomes.
Gender harassment
As previously noted, gender harassment was the type of SEQ behavior that was most commonly experienced by the female officers in Study 2. The vast majority (91.3%) indicated they had experienced at least one behavior in this category during the course of their career. Responses in this category were also assigned 1,260 of the 2,544 thematic codes in the Study 2 analysis (49.6%)—the most codes for any of the SEQ subscales.
In this category, women described incidents where “dirty jokes or stories” were told, pornography was displayed, statements were made to put down women, and respondents were insulted based on their gender or sexual orientation. Respondents also described situations where coworkers questioned their sexual orientation, spread rumors that they were lesbian, or called them derogatory names referring to their (supposed) homosexual orientation. Some noted that this happened after declining romantic offers from coworkers. Others described hearing comments that women do not belong in law enforcement. For example, one woman recalled having a Captain who always said “why don’t you go home and be a normal woman barefoot and pregnant in the kitchen?”
Several women indicated that this type of behavior occurred during “roll call,” the beginning of each shift where officers are oriented and given assignments and information they will need for the day. This is significant, because roll call will almost always be attended by a supervisor (typically the Sergeant in charge of the unit/shift).
Roll call seemed to be the time that this activity took place. Everything from officers exposing their genitalia to bringing sex aid objects to roll call . . .
With respect to gender harassment, some respondents emphasized that women participate in this behavior as well as men and/or stated that they had personally engaged in such behavior.
Unwanted sexual attention
The second most common type of behavior was in the category of unwanted sexual attention. Almost three quarters of the female officers (74.0%) indicated they had experienced at least one behavior in this category during the course of their law enforcement career. Responses in this category were assigned 1,151 of the 2,544 thematic codes (45.2%). Within this category, respondents described situations where someone made sexually suggestive remarks to or about them. Several described this type of behavior as very common.
I was the undercover officer for a high profile prostitution escort service. An Assistant Chief and Lieutenant said “I’d pay to fuck that.” Over 20 years the number of times is too long to list. I have never filed a complaint. Co-workers and supervisors alike elude [sic] to sexual situations or jokes [on a] nearly daily basis. I would not file a complaint and typically am not offended—if you do complain this would make you an outcast/untouchable.
Several officers also mentioned that they received unwanted sexual attention from citizens, including drunks and male citizens who get too close as if they are my friend. As with gender harassment, some noted that women, as well as men, engage in this behavior.
Believe it or not most female officers are more sexually suggestive towards men than men are towards females (in the police setting).
This category also included situations where someone tried to establish a romantic or sexual relationship with the respondent or touched them in a way that made them uncomfortable. This often included grabbing women’s breast or buttocks, patting them on the buttocks, or rubbing their shoulders to give them an unwanted “massage.” Some examples were particularly disturbing, with behaviors that constituted attempted or completed sexual assault.
My Lieutenant slapped me across my ass after he told me that he likes women on their knees in front of him. I was mad. Everybody in the P.D. knew what happened, but no one said a thing. [I] was drunk at a party and if it wasn’t for fellow officers I would have been raped by a supervisor.
On the other hand, some women stated that they liked the sexual attention at work.
Sometimes it is the normal part of male/female relationships . . . That’s how I met my husband (also a police officer) it was welcome then! Now that I’m old (53) no one ever makes remarks like that anymore! How sad.
Quid pro quo sexual harassment
While quid pro quo situations may be the most widely recognized form of sexual harassment, they were the least commonly experienced by female officers participating in Study 2. Responses in this category were assigned 102 of the 2,544 thematic codes (4.9%), and 15.2% of Study 2 respondents indicated that they had experienced this type of behavior during the course of their law enforcement career. Those who did went on to describe situations where someone tried to coerce them into engaging in sexual behavior, hinted that they might get a reward for such behavior, or made them feel afraid they would be treated badly for not complying.
Once a Captain told me that my life could be real simple or it can be quite difficult and grabbed my breast when he shut the door (closing me in his office) I walked out and my career has been HELL.
In another situation, a female officer indicated that she had applied to teach in the police academy and was told by the person in charge, If you give me some head, I will give you the position.
Perhaps not surprisingly, these behaviors appeared to be more likely to involve a supervisor, rather than a peer, subordinate, or someone else (e.g., citizen, suspect). They also appeared to be more likely to involve a male perpetrator, rather than a woman.
Response Strategies
The women then went on to describe how they responded to such situations. Across all three categories of behavior, the most frequent response was “no complaint filed” (47.6%). While Study 2 respondents were not required to provide a reason why they did not file a complaint, some indicated that they did not believe it would be productive.
Making a complaint to the Chief or Assistant Chief would do absolutely no good (I know from prior experience).
Others did not report because they were afraid of retaliation (5.9%). For example, one female officer described her concerns about reporting dirty stories and jokes: I hear this a lot being the only female detective. Some make me feel uncomfortable but I just laugh it off. I am afraid to make a complaint because it would be worse for me. This is still a good old boys department.
Another described similar fears in a more serious situation involving physical assault.
A Captain that was well known for this. He physically assaulted me my first year in law enforcement. I spoke with several people. I decided I wanted to continue working in law enforcement. I would have been labeled if I had complained.
A third officer described fears that kept her from reporting the sexually suggestive comments made at her agency: Fear of “black sheep” status, fear of retribution, and the possibility of not getting promoted if caused internal conflict.
The second most common theme across the three categories of behavior was that respondents considered it to be “no big deal” (21.3%). Rather, they frequently described sexually suggestive comments, pictures, and stories as “just joking” or “part of the job.” This is the world of law enforcement, it’s not for the weak at heart or the prudence of a princess.
Others seemed to characterize this behavior as inevitable in a workplace with mostly men. In fact, many women felt a need to participate in such behavior (especially “dirty jokes or stories”), to be accepted within their law enforcement agencies.
Dark humor, dirty humor, are part of police work. A woman entering police work needs to recognize that and accept it if they wish to be accepted by male peers.
A few even appeared to enjoy the attention that can sometimes accompany this behavior.
A coworker showed me a picture in playboy and said he thought I looked like her. He didn’t mean it as derogatory and I didn’t take it that way.
However, respondents appeared to be less likely to view a behavior as “no big deal” if it involved statements that put women down or physical touching (rather than jokes or stories).
The third most common strategy was for respondents to handle the situation on their own (15.5%), usually by talking to the person themselves and sometimes enlisting the help of peers.
The officer started to put his hands places he shouldn’t. I told him to “knock it off.” He did.
Another common theme was the use of humor. For example, in response to a pornographic image shown by a coworker, one woman responded, It looks like a penis—only smaller. Another reportedly told [a] coworker [that if] his own wife didn’t want anything to do with him, why should I?
Sometimes, however, women handled the situation using more dramatic and/or physical actions. This appeared to be more likely in response to more severe behaviors.
An officer drove me behind a building and attempted to unbutton my shirt. I threatened to shoot him. No complaint filed. A road officer who was continuously asking to have sex and grabbing me. I told him to stop several times and finally kneed him in the crotch. It didn’t happen again. He is no longer with this department. Also, other officers physically threatened him if he continued. When I was a rookie officer, a male officer approached me in the parking lot and tried to kiss me. I had to physically restrain him and threaten to file a complaint.
Differences in common response patterns
While these general responses were most common across the three categories of behavior, some variation was also seen. For example, respondents appeared to be less likely to view quid pro quo behavior as “no big deal” or see it as “part of the job.” The percentage of codes for “no big deal” was only 8.8% for quid pro quo sexual harassment versus 18.8% for unwanted sexual attention and 24.5% for gender harassment. Similarly, respondents appeared to be more likely to file a formal complaint for quid pro quo sexual harassment than unwanted sexual attention or gender harassment. The percentages were 10.8% versus 5.4% or 3.0%, respectively. They may also have been more likely to handle a situation themselves if it involved unwanted sexual attention or quid pro quo sexual harassment, rather than gender harassment (19.6% and 18.6%, vs. 11.8%).
Less frequent responses
Taken together, 6.6% of codes across all three categories of behavior suggested that an officer either reported the situation informally to a supervisor or filed a formal complaint. In some situations, this did not lead to any satisfactory resolution.
A supervisor consistently made sexually explicit remarks. I filed a complaint and was told by the city administrator that I would never get promoted if I followed through. I dropped the complaint. The supervisor was later fired for sexual harassment of another female employee.
In fact, some women described how a negative response to one complaint deterred them from filing another when similar behavior was experienced again—even if took place in another agency. For example, one officer described two situations where a coworker tried to establish a romantic or sexual relationship that was unwanted: Both were Sergeants. First time (he was married) a complaint was filed—nothing done. It was suggested to me that I not file a complaint. Second, I just started with a new agency and there was no way I would.
In other situations, the complaint process appeared to successfully resolve the situation. In fact, at least one officer described how the complaint may have even deterred others from engaging in similar behavior in the future.
Filed a complaint in my first year in law enforcement. Being the new girl in a district brings on a lot of unwanted attention from other male officers. Since then I have had no problems but the reputation follows me that I will make a complaint so I think people watch what they do and say.
The remaining codes were divided between several response strategies. For example, 5.7% of the responses suggested that the officer simply tried to ignore or tolerate the situation. As one wrote, I will tolerate it rather than subject myself to the stigma of being a female who filed (cried) sexual harassment. The remaining 2.7% of responses indicated that the officer chose to walk away from the situation, avoid the person or people involved, refuse to participate in the behavior, or talk to someone else about the incident. Less than 1% of the codes suggested that respondents filed a lawsuit or quit their jobs. Some of these individuals moved to another agency, while others left the field of law enforcement entirely.
A cop (another department) broke into my apartment and went through my things—they categorize this as sexual harassment. Guy was fired, rehired, put on my shift, I sued (hostile work environment). Left department—the guy remained employed.
Outcomes
Finally, participants described the outcome of the situation. Across all three categories of behavior, the most common theme was that the behavior stopped (42.8%). However, the second most common theme was that they experienced retaliation (12.9%).
A coworker called me a “stupid bitch” [on] several occasions. I eventually had to file a written complaint. The male officer was given a transfer to a “preferred” unit while I was sent back to routine patrol. This was even though the complaint was determined “founded” by our supervisor. In short, I was punished and he was rewarded.
In fact, many officers described situations where the original behavior stopped as a result of their response, but they experienced retaliation nonetheless. As one woman described, the behavior stopped after filing a complaint, but she was still paying for it. Retaliation appeared to be particularly common in situations involving quid pro quo sexual harassment rather than other types of behavior (38.7% vs. 11.3% for unwanted sexual attention and 10.6% for gender harassment). To illustrate, one officer recalled that after filing a complaint with the Equal Employment Opportunity Commission (EEOC) No action [was] taken, [and] they recommended I go somewhere else to work. Another recounted, [A] Sergeant would make comments about how good I looked. He would try and talk to me about the problems he was having with his wife. I would tell him I am not the one he should talk to about this. He would then hold me back in the roll call room after others left to discuss my reports. He would lean over me or sit close, constantly touching my arms, shoulders, etc. I would move away or tell him to stop, I’m uncomfortable. He would retaliate by criticizing my reports or judgment.
The third most common outcome across all three categories of behavior was that the person involved was reprimanded (12.7%). Some officers said that this resolved the situation.
A supervisor made some remarks that could be taken as off color about another female officer. A complaint was filed and the supervisor was reprimanded. This situation took place more than once with different supervisors and female officers and the outcome was the same.
However, others noted that they experienced retaliation as a result. To illustrate, one woman described a situation where a fellow officer tried to establish a romantic relationship with her.
[I] went to a female officer (Sgt) for advice. I was ordered to file another written complaint. He was verbally reprimanded. I got no support, was talked about. Back-up on calls slow. I was transferred to CP [community policing].
The fourth most common outcome was that nothing happened at all (11.6%). As in other situations, the officer may have experienced retaliation despite the lack of disciplinary response to her complaint.
Scantily clad pictures/posters of females [were] hanging in roll call rooms. [I] complained. I was laughed at. [The] pictures remain. “Other females don’t care” was what I was told. I give up.
In a smaller percentage of responses, officers noted that the person involved in the behavior was either fired, demoted, moved, transferred, resigned, or retired (7.1% of codes).
An instructor at an academy repeatedly asked me “how I like it” while motioning his fingers; in front of a classroom of all male officers. I filed a complaint—(along with other male officers)—and the instructor lost his certification as an instructor.
As in other responses, this does not necessarily mean that the situation was completely resolved. One officer described a situation where an instructor showed pornographic images in class. A complaint was filed and the instructor was dismissed. However, the man in charge of the program told her that, If I had a class full of men, there wouldn’t have been a complaint.
Of the remaining codes, 6.2% involved situations where the person involved in the behavior apologized to the respondent, and 5.8% were handled by someone other than the respondent (e.g., coworker). One officer recounted the following situation: A supervisor made a remark about my breasts and I informed if it did not stop a formal complaint would be filed. The supervisor apologized and the remarks stopped.
Less than 1% of the codes involved a lawsuit being settled and/or the person involved in the behavior receiving counseling or being arrested.
Labeling
As previously indicated, about one quarter of the female officers (27.2%) in Study 2 indicated that they had been “sexually harassed” at some point during their law enforcement career. As one woman said, Using the legal definition of sexual harassment the situations I have previously described are sexual harassment. I did not file a complaint in any of the incidents.
Therefore, most did not characterize the SEQ behaviors they had personally experienced as sexual harassment. In fact, many respondents appeared to contrast their experiences with a narrow definition for sexual harassment; for example, by including only quid pro quo situations in their conceptualization or focusing on other forms of discrimination.
I wouldn’t say I was “sexually harassed” because no threats or promises were ever made. I define sexual harassment probably in a different sphere, I see it when blatant preference is shown to a male. Sexual harassment must be an unwelcome remark, etc. In that regard I have always been able to take a joke and can give it right back. Ask me about discrimination! That’s another story.
Discussion
The present study makes a number of contributions to the existing literature on sexual harassment, particularly with respect to law enforcement. First, Study 1 and 2 both document a high incidence of behaviors that could potentially be sexually harassing even in comparison with other studies in policing and fields that are nontraditional for women. This difference may be due to the increased methodological rigor with which these behaviors were measured in comparison with past efforts. In both of our studies, we used a modified version of the Sexual Experiences Questionnaire (SEQ), which is the most well-established measure for this purpose.
Higher rates were seen in Study 1 than Study 2, which could be due to differences in the representation of women in the agencies involved in the two studies. As previously noted, the agency involved in Study 1 had a particularly low representation of women. The divergence could also be related to differences in organizational culture and practices, selectivity bias, or a host of other factors that could have varied between the agencies and officers participating in Study 1 versus 2. Perhaps a more likely explanation is found, however, in the different time frames used for describing behaviors in the two studies. Study 2 asked respondents to describe experiences throughout the course of their entire law enforcement career, whereas Study 1 asked only about the past year.
Experiences, Reporting, and Retaliation
The results also provide a detailed picture of the types of behaviors that were experienced by survey participants and their strategies for responding. Many of the findings replicate prior research, regarding the relative frequency of various types of behavior, the most common perpetrator of each type, the fact that very few behaviors were reported, the reasons that respondents gave for not reporting them, and the frequency with which respondents experienced retaliation as a result of their response.
For example, both studies document that the most frequent behaviors were found on the gender harassment subscale of the SEQ, including comments and behavior that are sexualized in nature even if they are not targeted toward sexual engagement with a particular individual. This is consistent with recent work demonstrating that women in nontraditional fields are more likely to face gender harassment without the purpose of sexual engagement, rather than targeted sexual behavior such as unwanted sexual attention or quid pro quo sexual harassment (Leskinen, Cortina, & Kabat, 2011). Analyzing responses from women in the military and federal legal practice, these researchers documented that “nine out of every ten victims had experienced primarily gender harassment, with virtually no unwanted sexual overtures” (p. 25). Such dramatic differences were not seen in our data, but the results of both our studies support their contention that the purpose of such behavior has more to do with gender and power, rather than sexual engagement with a particular individual: This conduct is not about misguided attempts to draw women into sexual relationships; quite the contrary, it rejects women and attempts to drive them out of jobs where they are seen to have no place. (Leskinen et al., 2011, p. 25-26)
On this basis, Leskin and colleagues proposed that the more inclusive term sex-based harassment should be used in place of the more conventional—and comparatively narrow—phrase sexual harassment. Not only does this alternative terminology more accurately convey the reality of most situations that are experienced by female employees but it also maps more closely on the language originally used by the EEOC (Leskinen et al., 2011).
Returning to the Study 1 results, the typical perpetrator of most behaviors on the SEQ was a coworker, rather than a supervisor, subordinate, or other person (e.g., citizen, suspect). This pattern is also seen in prior work demonstrating that coworkers, customers, and clients are a common source of such behavior (Berdahl, 2003; Konik & Cortina, 2008). In fact, this dynamic may be particularly characteristic of gender harassment that does not include a targeted sexual component. In Study 1, for example, the gender harassment subscale was the only one with coworkers as the most common perpetrators for every single behavior. Whether this pattern holds in other contexts could be a question for future research, as could the potential implications for employees in a range of different workplace settings (including other nontraditional fields for women).
Also consistent with prior research, reporting was more likely for behaviors that involved physical touching or quid pro quo situations. Perhaps not surprisingly, these behaviors were also more likely to be perpetrated by a supervisor, rather than a coworker or subordinate (in Study 1). This pattern thus supports previous findings indicating that sexual harassment is more likely to be reported if it is viewed as more severe, and some of the factors that increase the perceived severity include physical touching, quid pro quo situations, and/or behaviors that are perpetrated by a supervisor (Bergman, Langhout, Palmieri, Cortina, & Fitzgerald, 2002; Cochran et al., 1997; Cortina, 2004; Cortina, Fitzgerald, & Drasgow, 2002; DuBois, Faley, Kustis, & Knapp, 1999; Hesson-McInnis & Fitzgerald, 1997; Langhout et al., 2005; Malamut & Offermann, 2001; Wasti & Cortina, 2002).
In this context, it is worth noting that some of the low frequency behaviors (e.g., quid pro quo situations, unwanted physical touching, and forceful attempts to have sex) were experienced by a small but not insignificant number of respondents in both studies. Some of these situations were then described in disturbing detail in the narrative responses of Study 2 respondents. That such behaviors occur at all should be cause for alarm. Yet this concern is exacerbated by the fact that even such severe behaviors were not typically reported. Prior research suggests that women in nontraditional professions are less likely than those in other fields to file a complaint when they have been sexually harassed (Ilies, Hauserman, Schwochau, & Stibal, 2003).
Our results also document both how frequently officers experience retaliation as a result of their response to these situations and how severe these retaliatory behaviors can be. In Study 1, fear of retaliation was one of the most common reasons that officers gave for not reporting SEQ behaviors, and the women in Study 2 frequently described experiencing retaliation in response to these situations, particularly for those involving quid pro quo sexual harassment. Many women noted that they experience retaliation, regardless of the outcome of the original behavior. For instance, many women described how the retaliation continued even when the original behavior stopped and/or the person involved in the situation was reprimanded or received some other form of discipline. Some women mentioned that this retaliation included a delay or denial of backup, which is particularly troubling.
The most dangerous form of work retaliation in both law enforcement and firefighting is the failure to provide immediate backup or other assistance in emergency situations. In firefighting, it also includes stealing or tampering with necessary safety equipment. Such acts represent the ultimate form of retaliation unique to the kind of workplace where emergency situations can easily become life-threatening. For many complainants, this is the point at which they begin to fear for their lives and consequently leave the organization. (Harrington & Lonsway, 2007, p. 54)
Our findings thus highlight the work that remains for law enforcement administrators—to ensure that sexually harassing behaviors are not committed or tolerated within their organizations, that they are reported when they occur, and that retaliation does not result.
Gender comparisons
In Study 1, quantitative analysis revealed that female officers were more likely than their male colleagues to experience unwanted sexual attention. No gender difference was found for the other SEQ subscales (quid pro quo sexual harassment or gender harassment). This may be partly explained by the fact that the number of women in the Study 1 sample was considerably smaller than the number of men (69 vs. 594). This difference represents a proportion 1 to 10. Moreover, item-level data in Table 1 suggest that almost all of the behaviors were experienced at a higher rate by female as compared to male participants in Study 1. With a larger sample size of women, therefore, other subscale differences may have emerged as statistically significant.
The lack of gender differences for two of the three subscales may also be explained by the low frequency of behaviors constituting quid pro quo sexual harassment and the high frequency of gender harassment (particularly for the item regarding “dirty stories or jokes”). Floor effects for the former and ceiling effects for the latter could have played a significant role. The results from Study 1 thus fit within the larger context of mixed findings regarding gender. As previously reviewed, most research has historically found that female employees experience sexually harassing behaviors with far greater frequency than their male colleagues. On the other hand, some more recent studies report that men and women have such experiences with comparable frequency, but they are experienced as more upsetting for women than men.
The present results shed light on this issue by suggesting that the gender comparison in law enforcement may depend on the type of behavior being assessed. Many behaviors—particularly those within the category of gender harassment—are common within policing and thus equally likely to be experienced by male and female officers. However, women are still more likely than men to be targeted with unwanted sexual attention. This again highlights the need to tease apart how the dynamics of sex-based harassment might differ for the various types of behavior on the SEQ subscales (i.e., those that do vs. do not include targeted sexual engagement).
These findings also raise the question of whether the specific behaviors experienced by men and women might differ. In their pioneering work, Berdahl, Magley, and Waldo (1996) found that men’s experiences with gender harassment can be categorized into three types of behavior: lewd comments, negative remarks about men, and enforcement of the heterosexual male gender role. While the present research was not designed to specifically tap these subdimensions of men’s experiences with gender harassment, this could prove to be an interesting direction for future research conducted within law enforcement organizations.
Past research also documents that the impact of such behavior may vary by gender and that it is determined in large part by whether the experience is appraised as a negative one. The survey instrument used in Study 1 did not include a measure of how the SEQ behaviors were appraised; therefore we do not have this information for Study 1 respondents. However, judging by the narrative responses in Study 2, it is reasonable to suggest that many respondents did not view these behaviors very negatively. In the category of responses for Study 2, the two most common themes were that “no complaint was filed” and the behavior was seen as “no big deal.” Based on the existing research literature, it is also likely that the behaviors were viewed as more bothersome, stressful, or upsetting by the women as compared with the men in Study 1.
Nonetheless, experience with the SEQ behaviors exerted a negative impact on a range of personal and professional outcomes for Study 1 respondents, and this was true for men as well as women. In fact, this finding is consistently reported in the literature, and the message is therefore important for law enforcement administrators who are seeking to eliminate sexual harassment and improve their organization’s response. It may be that such behaviors are not typically viewed as a problem by law enforcement personnel, or that their appraisal differs for men versus women. (Unfortunately, the small number of women officers in Study 1 prevented us from testing the outcome model separately by gender.) Yet such behaviors clearly represent a threat to the well-being of officers, regardless of their personal views or the larger organizational context.
Labeling sexual harassment
As previously noted, most people who experience behaviors on the SEQ do not describe themselves as having been “sexually harassed” (Fitzgerald, Swan, et al., 1997; Magley et al., 1999). Women in nontraditional professions are particularly unlikely to do so (Ilies et al., 2003). Even so, the percentage of Study 1 respondents who said that they had been sexually harassed is strikingly low (less than 1%), especially given the frequency with which they experienced SEQ behaviors. It is possible that the climate of the particular agency involved in Study 1 made officers reluctant to label their experiences as sexual harassment. However, this reluctance may also be explained by the more general context of law enforcement and the characteristics of the people who choose to work there: Women in law enforcement and firefighting may be especially reluctant to see themselves—or to be seen by others—as “victims”; they typically see themselves as problem-solvers who can manage the situation informally, without filing a formal complaint; they are often unaware of either their right to a workplace environment free of sexual harassment or the policies for reporting and investigating such problems; and they often view sexual harassment as “part of the job” and not a reason to complain. (Harrington & Lonsway, 2007, p. 21)
In contrast, far more respondents in Study 2 labeled the SEQ behaviors they experienced as sexual harassment, which may be due to some of the same factors that explained their higher incidence rates as compared with Study 1 (e.g., differences in the agencies and officers involved in the two studies, unknown differences in selectivity bias, and the different timeframes for describing behaviors from throughout the course of their career vs. during the past year).
As with reporting behavior, research finds that employees are more likely to label an experience as sexual harassment if it includes physical touching, quid pro quo situations, and/or behaviors that are perpetrated by a supervisor (Fitzgerald, Swan, et al., 1997). This may explain why so few respondents labeled their experiences as sexual harassment; the most common behaviors were from the gender harassment subscale of the SEQ, which does not include the targeted sexual engagement that many people tend to think of as constituting sexual harassment.
While this pattern was not tested in the present study, it is important to keep in mind that labeling does not appear to determine the impact of an experience. Rather, negative outcomes result from experiencing SEQ behaviors, regardless of whether or not the target views them as constituting sexual harassment (Magley et al., 1999; Munson et al., 2001). Therefore, our findings highlight the importance of sexual harassment prevention programs for employees, including those in law enforcement organizations. One of the goals can be to properly identify sexually harassment. If the professional context of law enforcement—or the unique context of any particular agency—serves to discourage employees from identifying behaviors as sexual harassment, it is difficult to imagine how it could encourage them to report such behaviors when they are experienced.
Prior research demonstrates that sexual harassment is less common in organizations that have proactive policies and rigorous enforcement (Gruber, 1998; Hesson-McInnis & Fitzgerald, 1997; Pryor, LaVite, & Stoller, 1993). Reporting is also more likely in such an organizational climate, and victims have better outcomes (Fitzgerald, Drasgow, et al., 1997; Hulin, Fitzgerald, & Drasgow, 1996; Zickar, Munson, & Hulin, 1997). Therefore, we hope that the present findings will inform policies and programs to help decrease the frequency of sexual harassment in law enforcement, increase reporting, and reduce the negative impact on all police officers—both male and female.
Limitations
While the current study was conducted with greater methodological rigor than many of its predecessors, some concerns do limit the confidence with which the findings can be generalized. Among these is the small number of women in the Study 1 sample, particularly for women of color (who are virtually absent). Concern is also warranted by the selectivity of the sampling procedure used for Study 2. However, because of the different methodologies used in the two studies, the limitations of one study are counterbalanced to some extent by the strengths of the other. For example, while Study 1 involved a relatively large sample with an excellent response rate, it was drawn from a single agency. The sampling procedure for Study 2 involved a greater degree of selectivity, yet respondents came from a large number of agencies. Thus any cost in terms of the internal validity may have bought gains in external validity.
Taking this point further, male and female respondents in Study 1 provided a wide range of information, both about their own personal experiences and also about their perceptions of individual and organizational impacts. To that extent, the breadth of information provided in Study 1 was complemented by the depth of detail offered in the narrative responses from Study 2. Similarly, the large number of women in the Study 2 sample may have helped to offset the relatively small number of women in Study 1—yet the lack of male participants in Study 2 precluded any gender comparisons, which we were able to do in Study 1. Finally, no outcome measures were included in Study 2, so any conclusions about the impact of such experiences must be made on the basis of Study 1 data. As in any study combining the use of two methods, we hope that the rich and nuanced descriptions offered in the qualitative data may help to explain some of the complex relationships underlying statistical results in the quantitative analysis.
Future Research
In sum, results of the present study converge with many of the conclusions from past research on sexual harassment in a wide variety of organizational settings. However, some findings diverge and it is unclear the extent to which these different patterns can be attributed to the general context of the law enforcement profession, the unique context of particular agencies, or other factors. For example, future research could explore whether the rather high incidence of SEQ behaviors seen in this study also applies to other law enforcement agencies as well as organizations in other fields that are nontraditional for women. Finally, future research could also explore whether gender differences are seen in the frequency of unwanted sexual attention versus other forms of sexually harassing behavior—and whether the behaviors are appraised and/or labeled differently by men versus women in law enforcement. Such research could prove invaluable in designing and evaluating workplace programs to eliminate such behavior. As one female officer in Study 2 concluded, I have to say we have come a long way in 21 years but a long way to go. I think newer officers will never experience some of the horrible things that went on and that is a good thing.
Footnotes
Appendix
Descriptive Statistics for Measures (Study 1)
| Scale name | Response scale | Coefficient alpha | Mean (SD) |
||
|---|---|---|---|---|---|
| Overall | Men | Women | |||
| Work Attitudes and Behaviors | |||||
| Work Withdrawal (10 items) | 1 = “never” to 5 = “many times” | .77 | 1.62 (.44) | 1.62 (.44) | 1.64 (.45) |
| Job Withdrawal (3 items) | 1 = “never” to 5 = “many times” | .76 | 1.50 (.73) | 1.51* (.76) | 1.39* (.40) |
| Work Satisfaction (5 items) | 0 = “no,” 1 = “?,” and 3 = “yes” | .83 | 2.54 (.72) | 2.53* (.73) | 2.70* (.59) |
| Supervisor Satisfaction (7 items) | 0 = “no,” 1 = “?,” and 3 = “yes” | .87 | 2.33 (.82) | 2.33 (.82) | 2.33 (.82) |
| Co-worker Satisfaction (9 items) | 0 = “no,” 1 = “?,” and 3 = “yes” | .81 | 2.53 (.54) | 2.53 (.53) | 2.50 (.57) |
| Job Stress (12 items) | 0 = “no,” 1.5 = “?,” and 3 = “yes” | .87 | 1.40 (.80) | 1.40 (.80) | 1.41 (.89) |
| Health and Well-Being | |||||
| Satisfaction With Life Scale (5 items) | 1 = “strongly disagree” to 5 = “strongly agree” | .88 | 3.58 (.82) | 3.58 (.83) | 3.64 (.72) |
| Depression (5 items) | 1 = “not at all” to 5 = “extremely” | .85 | 1.25 (.53) | 1.26 (.54) | 1.23 (.44) |
| Anxiety (6 items) | 1 = “not at all” to 5 = “extremely” | .68 | 1.17 (.34) | 1.16* (.33) | 1.27* (.42) |
| Physical Somatization (7 items) | 1 = “not at all” to 5 = “extremely” | .71 | 1.24 (.29) | 1.24 (.30) | 1.25 (.25) |
| Sexual Experiences Questionnaire (SEQ) | |||||
| Total score on SEQ (16 items) | 1 = “never” to 5 = “most of the time” | .67 | 19.22 (3.11) | 19.16 (3.06) | 19.91 (3.52) |
| Unwanted Sexual Attention (6 items) | 1 = “never” to 5 = “most of the time” | .41 | 6.44 (1.07) | 6.37*** (0.99) | 7.03*** (1.46) |
| Quid Pro Quo Harassment (5 items) | 1 = “never” to 5 = “most of the time” | .60 | 5.05 (.37) | 5.05 (.38) | 5.06 (.29) |
| Gender Harassment (5 items) | 1 = “never” to 5 = “most of the time” | .65 | 7.74 (2.40) | 7.74 (2.40) | 7.81 (2.44) |
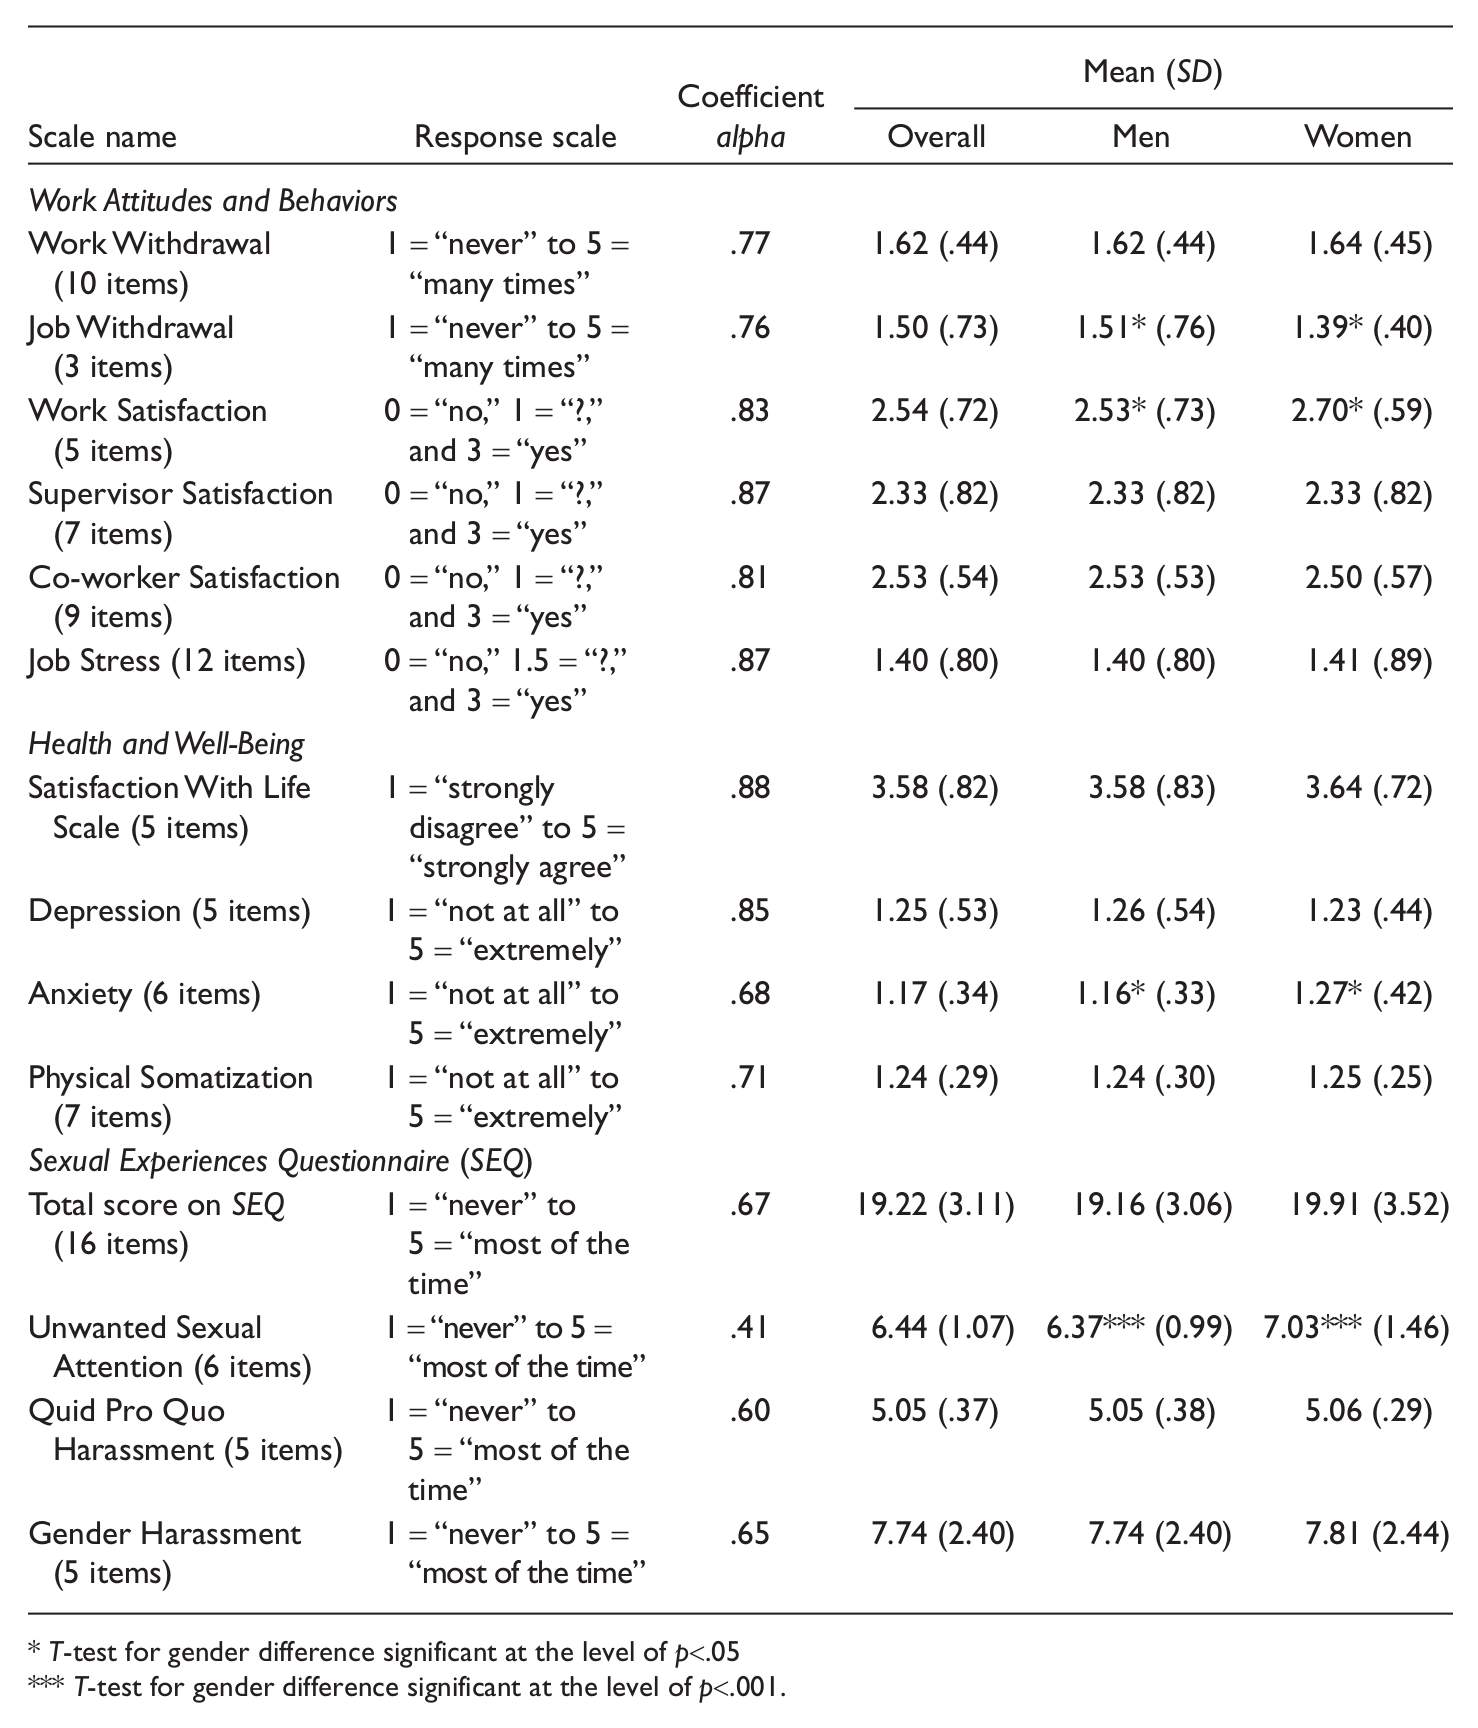
T-test for gender difference significant at the level of p<.05 *** T-test for gender difference significant at the level of p<.001.
Acknowledgements
The authors would like to gratefully acknowledge the contributions of Christine Moberg, Chief Penny Harrington, Katherine Spillar, Margaret Moore, Patricia Aguirre, Elizabeth Koenig, Vicki Magley, Lilia Cortina, and the sworn personnel who completed surveys in both studies.
Authors’ Note
Kimberly A. Lonsway, Research Director; Rebecca Paynich, Department of Sociology and Criminal Justice, Curry College; Jennifer N. Hall, Research Assistant, San Luis Obispo, CA.
Declaration of Conflicting Interests
The authors declared no potential conflicts of interest with respect to the research, authorship, and/or publication of this article.
Funding
The authors disclosed receipt of the following financial support for the research, authorship, and/or publication of this article: Support for Study 1 was provided by the National Center for Women & Policing and the law enforcement agency that participated in the survey. Some of the work was completed while the first author worked as Research Director for the National Center for Women & Policing.