
Abstract
This research investigates the fairness and effectiveness of making a large number of bicycle stops as a proactive policing strategy designed to reduce unsafe riding and crime in Tampa, Florida. Public concern about the fairness and effectiveness of this tactic was magnified by a 2015 newspaper article that noted racial disparities in bicycle stops by the Tampa Police Department (TPD). Our analyses found that there are large racial disparities in bicycle stops, which cannot be explained by differences in ridership as measured by our benchmark, bicycle crashes with injury. The observed racial disparities in bicycle stops appear to be attributable to TPD’s crime control efforts, though we cannot rule out some racial bias. Given that crime control was a motivating factor for TPD’s use of bicycle stops, we assessed the effect of bicycle stops on crime using a natural experiment. We found that bicycle stops did not have a meaningful effect on crime.
Introduction
Proactive policing often provokes the tensions described in Packer’s (1964) two models of criminal justice. Consistent with Packer’s crime control model, proactive policing strategies typically aimed at various forms of low-level criminal activity (e.g., traffic infractions, loitering, smoking marijuana in public, turnstile jumping, misdemeanor offenses generally) have been empirically demonstrated to reduce criminal activity in some contexts (see, e.g., Braga & Bond, 2008; Corman & Mocan, 2005; Kubrin, Messner, Deane, McGeever, & Stucky, 2010; J. M. MacDonald, 2002; Messner et al., 2007). On the other hand, proactive policing potentially undermine the values expressed in Packer’s due process model of criminal justice, as such tactics run a substantial risk of infringing upon citizens’ civil rights, particularly the rights of minority citizens who proactive policing practices disproportionately affect (Glaser, 2014; Harris, 2003; D. M. Kennedy, 2011; R. Kennedy, 1997). In fact, a frequent criticism of proactive policing is that such practices racially profile minorities by using race or ethnicity as a marker of suspicion or by concentrating proactive police activities in minority communities, which in turn leads to minorities having higher rates of contact with the police.
The current research investigates both the fairness and effectiveness of a proactive policing practice utilized by the Tampa Police Department (TPD). The proactive strategy of interest is TPD’s practice of making large numbers of bicycle stops for minor infractions, particularly in high-crime neighborhoods. A 2015 Tampa Bay Times (TBT ) article exposed the practice, noting an unusually large number of bicycle stops TPD officers made in comparison to other police agencies in Florida and the stark racial disparities in these stops (Zayas & Stanley, 2015). TPD’s then Chief of Police Jane Castor responded to the story by stating that the practice of stopping bicyclists for traffic infractions is a part of TPD’s proactive strategies to suppress crime in the city in high-crime areas, reduce bicycle accidents, and reduce bicycle theft (Castor, 2015). To help quell the controversy generated by the TBT article, Chief Castor and Tampa’s Mayor, Bob Buckhorn, requested the assistance of the U.S. Department of Justice, Office of Community Oriented Policing Services (COPS Office) to assess racial disparities in bicycle stops and the reason for those disparities.
This research describes the methods we used to assess the fairness and effectiveness of bicycle stops in Tampa and presents the key findings. The current research expands the knowledge base by assessing allegations of racial profiling in bicycle stops, which generates new issues not present in the existing empirical literature that has tended to focus on traffic and pedestrian stops. Notably, racial disparities and allegations of racial profiling in bicycle stops are not isolated to Tampa, similar allegations have recently emerged in Chicago and New York City (Wisniewski, 2017). 1 This research also extends the existing knowledge base by examining the effectiveness of bicycle stops on crime by using a natural experiment. Together, these two distinct components of this research provide a broad picture of TPD’s use of bicycle stops in that these two components address the extent to which bicycle stops potentially burdened Black Tampa residents and the extent to which TPD’s use of bicycle stops potentially benefited Black, high-crime neighborhoods in Tampa.
This research is organized into four sections. The first section provides background on crime in Tampa, the use of bicycle stops, and the controversy initiated by TBT ’s article on this practice. This section also discusses prior research assessing the racial fairness and effectiveness of proactive policing strategies. The second section summarizes the data and methods used in the current research. The third and fourth sections, respectively, discuss the results and conclusions of this research.
Background
On April 17, 2015, the TBT published an article entitle “How riding your bike can land you in trouble with the cops—If you’re black” (Zayas & Stanley, 2015). The article notes that TPD wrote 2,504 bicycle citations—a total more than the cities of Jacksonville, Miami, St. Petersburg, and Orlando combined—and of those ticketed, approximately 80% were Black; yet, only about a quarter of Tampa’s population is Black. According to the TBT, . . . Tampa police are targeting poor, Black neighborhoods with obscure subsections of a Florida statute that outlaws things most people have tried on a bike, like riding with no light or carrying a friend on the handlebars. Officers use these minor violations as an excuse to stop, question, and search almost anyone on wheels. The Department doesn’t just condone these stops, it encourages them, pushing offices who patrol high-crime neighborhoods to do as many as possible . . . Police are targeting certain high-crime neighborhoods and nitpicking cyclists as a way to curb crime. (Zayas & Stanley, 2015, para. 6–7)
TPD officials acknowledged several aspects of the article but vigorously denied racially profiling or discriminating against Black bicyclists. Indeed, TPD made more bicycle stops than other major Florida cities because the other cities essentially do not enforce bicycle laws. Jacksonville, for example, issued one bicycle citation in 2014. Notably, the relatively large number of bicycle stops made by TPD was not part of a formal initiative to crack down on bicycle infractions or investigate suspicious bicyclists, rather these stops were a component of a broader proactive policing philosophy. TPD also agreed that they use a “red-grid strategy,” a hot spot policing approach in which high-crime areas of the city receive increased proactive police activities in an effort to reduce crime in these areas. TPD divides Tampa into three police districts, each of which they further divide into many, smaller police grids. They color-code each grid based on the number of Part 1 crimes reported in each grid. Grids with the highest number of Part 1 crimes are color coded as red grids, grids with the next highest number are coded orange, the next lower color code is yellow, and grids with the lowest crime are not color coded. During the time period of interest, there were seven red grids and these seven red grids are heavily populated by African Americans, are relatively poor, and a large proportion of these grids are located in TPD’s District 3.
TPD also noted the success of its proactive policing strategies in controlling crime. In the 10 years prior to the publication of the TBT article on bicycle stops, the rate of Part 1 crimes reported in Tampa dropped in every year from approximately 7,600 in 2005 to 3,010 per 100,000 residents in 2014—a 60% decrease in the city’s Part 1 crime rate (Federal Bureau of Investigation, 2008–2014). While the same downward trend is evident nationally and in the neighboring cities of St. Petersburg and Clearwater, Part 1 crimes in these neighboring cities did not drop each and every year in the period of interest, and the total decline in the Part 1 crime rates was less than 20% in both neighboring cities (Federal Bureau of Investigation, 2008–2014). TPD believes that Tampa’s sizable and sustained reduction in crime is due in no small part to its proactive policing strategies including the use of bicycle stops. In fact, TPD claimed that bicycle stops are an essential part of its crime control strategy and that crime would increase, if the use of bicycle stops were curtailed.
According to TPD officials, the racial disparities in bicycle stops are not due to racial discrimination against Black bicyclists; instead, these disparities are due to a combination of factors. First, bicycle stops are used to discourage unsafe bicycling. This is important because bicycle accidents, injuries, and fatalities are perceived to be markedly higher in Tampa in comparison to other cities. 2 Second, TPD uses bicycle stops to reduce bicycle thefts, which are common in Tampa. For example, in 2014, 1,372 bicycles were reported stolen—a figure that represents 13% of Tampa’s Part 1 crimes. Bicycle stops are an important part of TPD’s specific strategy to reduce bicycle theft in the Tampa; this strategy also includes an aggressive campaign to encourage bicycle registration, which is salient because checking each bicycle’s identification number is a standard part of bicycle stops. Third, TPD uses bicycle stops to reduce crime generally, especially in high-crime areas, as bicycles appear to be a common means of transportation among those involved in crime in these areas. Chief Castor claimed that bikes have “become the most common mode of transportation for criminals” and “[m]any individuals receiving bike citations are involved in criminal activity” (Zayas & Stanley, 2015, para. 16). From TPD’s perspective, bicycle stops are a reasonable proactive policing strategy, as these stops are believed to decrease unsafe bicycling, bicycle thefts, and crime generally. TPD’s multipurpose use of bicycle stops combined with the racial demographics of communities with highest levels of bicycle ridership as a mode of transportation and with the highest crime rates lead to many of the bicyclists stopped by TPD to be Black. From TPD’s perspective, the observed racial disparities in bicycle stops are not a sign of racial discrimination against Black bicyclists; rather, these disparities are a manifestation of TPD’s commitment to drive down crime in high crime, largely Black neighborhoods. It is important to note that racial profiling and a crime control focus are not mutually exclusive, as it is possible for law enforcement to engage in racial profiling believing it would reduce crime.
Prior Research on Police Racial Profiling and Its Effectiveness
Many existing studies assess racial disparities and allegations of racial profiling in police initiated stops. This body of research has two distinct streams. The first stream examines disparities in traffic stops, and the second stream evaluates racial imbalances in pedestrian stops made as part of stop, question, and frisk (SQF) police strategies. To our knowledge, none of the existing research examines these issues in bicycle stop. Our purpose here is to sketch key findings from these two streams of research; a full review of this voluminous body of research is beyond the scope of the current project.
Both streams of research face a common methodological problem—estimating the relative rate at which each racial or ethnic group should be stopped if police are unbiased (see, e.g., Alpert, Smith, & Dunham, 2004; Glaser, 2014; Harris, 2003; Ridgeway & MacDonald, 2010; Withrow, 2006). That is, racial profiling studies typically use a benchmark against which the observed racial or ethnic distribution of those stopped by police can be compared. 3 Many benchmarks have been utilized. These benchmarks fall into two broad categories: population and violator benchmarks. Population benchmarks attempt to estimate the racial or ethnic distribution of the population of interest in the area of interest (e.g., racial or ethnic distribution of drivers). Despite the popularity of population benchmarks, the broad consensus among social scientists is that they are invalid as the racial distribution of the population of interest is often difficult to estimate accurately, and population benchmarks implicitly assume that everyone in the population of interest has an equal likelihood of a police encounter. This latter concern is particularly problematic as police encounters are not random events; instead, individuals who flagrantly violate the law are much more likely to be stopped than other individuals. To remedy this issue, violator benchmarks attempt to estimate the racial distribution of individuals involved in law violations in the area of interest (e.g., racial distribution of speeders). The existing research is largely premised on the idea that if the observed proportion of stops involving racial or ethnic minorities exceeds their proportion based on the benchmark, then this disparity is an indication of racial or ethnic profiling or racial discrimination in police stops.
To be clear, racial disparity, a difference across racial groups on some outcome of interest, and illegal racial discrimination (i.e., racial profiling), a racial disparity caused by bias against a particular racial group, are not the same. Racial disparity may be explained by any number of nonracial factors including seemingly race-neutral decisions that disproportionately affect a particular racial group. In the present context, for example, racial disparities in bicycles stops may be attributable to differences across racial groups in bicycle ridership, time of day when bicycles are ridden, the manner in which bicycles are ridden, citizen calls for service involving suspects on bicycles, and the demographics of areas where bicycle stops are most heavily used as a form of proactive policing, among many other possible factors—not racial profiling. Further, it is also important to note that racial profiling does not need to be rooted in conscious racial animus, as a growing body of research finds that implicit racial biases inculcated by pervasive cultural stereotypes linking certain racial or ethnic minorities to crime can and often do cause individuals who do not hold conscious racial animus to make racially biased decisions (see, e.g., Correll, Park, Judd, & Wittenbrink, 2007; Devine, 1989, 2001; Dovidio & Gaertner, 2000; Glaser, 2014; Rudman & Ashmore, 2007). Thus, not only is discerning racial discrimination from racial disparity extremely difficult but also concluding that police racial profiling does not necessarily mean that police officers are intentionally biased against minorities.
Dozens of studies examining racial disparities in traffic stops have been conducted. This body of research proliferated in the mid-1990s when a chorus of Black motorists alleged police had stopped them due, at least in part, to their race. These studies most often find that Blacks and to a lesser extent Latinos are stopped at rates that exceed population benchmarks (Glaser, 2014; M. R. Smith, Rojek, Petrocelli, & Withrow, 2017; Withrow, 2006; Withrow & Williams, 2014). As an example, Withrow’s (2006) review of research concerning racial profiling in traffic enforcement found that 18 of the 23 (78%) relevant studies reported Blacks were stopped at rates exceeding their benchmark (overwhelmingly, the benchmarks used were population benchmarks) and 40% of such studies found Latinos were stopped at elevated rates. More recent studies continue to find that minorities are stopped for traffic violations at rates greater than their population proportions (see, e.g., Alexander Weiss Consulting, 2016; Lamberth & Clayton, 2017; Withrow & Williams, 2014). Yet, evidence of racial disparities in traffic stops is weaker when violator benchmarks are applied. For instance, several studies have found that while Blacks were overrepresented among drivers stopped in comparison to population estimates, Blacks were stopped at rates comparable or lower than their proportions among law violators, typically measured by having observers tabulate the race distribution of drivers committing traffic infractions such as making illegal turns, running red lights, or speeding (e.g., Alpert, Dunham, & Smith, 2007; Greenwald, 2001; Lamberth, 2008; Thomas, 2002).
Recently, racial profiling research has shifted its focus toward allegations of police bias in SQF encounters. While racial disparities in SQF long have been a concern (e.g., Boydstun, 1975), this issue burst back onto the scene when New York City Police Department expanded its use of SQF in the late-1990s, and then other large cities followed suit. Like the traffic stop research, SQF research almost uniformly finds that Blacks and Latinos are stopped at rates higher than population benchmarks (see, e.g., Gelman, Fagan, & Kiss, 2007; Ridgeway, 2007). Unlike the research on traffic stops, SQF research using violator benchmarks predominantly finds that Blacks are stopped disproportionately but the evidence concerning Latinos is more ambiguous (see, e.g., Fagan, Geller, Davies, & West, 2010; Gelman et al., 2007; but also see Ridgeway, 2007).
Taken together, the existing research establishes that Blacks, and to a lesser extent Latinos, are stopped by police in traffic, and SQF encounters at rates exceeding commonly used benchmarks. Police officials frequently claim that the observed racial disparities are caused by police efforts to combat crime in high-crime, minority neighborhoods. In other words, police officials argue that the racial imbalances in police initiated encounters are the result of police trying to help Black communities become safer and to respond to citizens’ concerns about criminal activity in high-crime neighborhoods—not the result of intentional police harassment of Black citizens and rarely, if ever, acknowledge the risk of implicit bias. Further, police officials maintain that these police initiated activities are effective in combatting crime. For instance, Commissioner Kelly asserted: “No question about it, violent crime will go up if SQF is abandoned by the NYPD . . . [and] this is not just a New York City issue, it’s an issue throughout America” (Terkel, 2013, para. 2). 4 Thus, it becomes vital to address whether police practices that rely on the kinds of police activities discussed here are effective in controlling crime.
Several studies focus on estimating the effect of traffic stops and SQF encounters on crime. Assessments of the effectiveness of traffic stops typically examine the rate at which these stops reveal contraband or lead to the arrest of wanted criminals (i.e., hit rates) and the relative hit rates by race. The most common findings of such studies are that traffic stops have low hit rates overall and hit rates among Black citizens is no more and often less than those of Whites (see, e.g., Chanin, Welsh, Nurge, & Henry, 2016; Childers, 2012; Gaines, 2006; Seguino & Brooks, 2014; Withrow, 2006). These results call into question the effectiveness of both the use of traffic stops as a means to uncover contraband and the use of race or ethnicity to increase the efficiency of such stops in detecting those in possession of contraband. However, examining the size of hit rates does not address the effect of traffic stops on crime.
The literature evaluating the effects of SQF on crime is more complex and contradictory. An early study by D. C. Smith and Purtell (2008) found that areas of New York City with more SQF encounters exhibited lower rates of violent crime but not property crime. However, a follow-up study by Rosenfeld and Fornango (2017) that attempted to address methodological shortcomings in Smith and Purtell’s work found a weak relationship between the number of SQF encounters and area crime but could not conclude that this relationship was causal. A third study by Weisburd, Wooditch, Weisburd, and Yang (2016) also investigated the effects of New York City Police Department’s use of SQF but focused on microareas and short-time periods. These authors found that SQF had modest but meaningful crime suppressing effects in the short term. J. MacDonald, Fagan, and Geller (2016) used abrupt increases in SQF after the establishment of impact zones in New York to study whether crime reduction follows those increases in SQF. They found that an increase in probable cause stops was associated with crime reductions, but the vast majority of stops did not influence crime.
The Current Study
The current research expands and extends the extant research in several ways. Most fundamentally, we explore allegations of racial profiling in bicycle stops; this focus on bicycle stops is unique. Focusing on bicycle stops is not only novel, it is also important as such stops walk the line between traffic stops and SQF encounters. Bicycle infractions are literally violations of traffic statutes; yet, the use of these stops (allegedly) as a pretext to SQF minority bicyclists in high-crime areas bears a remarkable resemblance to use of SQF in New York and other large cities. This research also contributes to the knowledge base by using a relatively rarely used benchmark, namely the racial distribution of those involved in bicycle crashes with injury, which mixes elements of population and violator benchmarks. Notably, similar benchmarks were employed in Withrow and Howard (2014), which used local vehicle collision data as a benchmark, and Alpert et al. (2007), which used not-at-fault drivers as a benchmark. Last, we capitalize on the precipitous drop in TPD’s use of bicycle stops, caused by the publication of the TBT article, to isolate exogenous variation in bicycle stops, which allows us to conduct a natural experiment concerning the effect of bicycle stops on crime in Tampa.
Methods
Data
To address the fairness and effectiveness of TPD’s use of bicycle stops, we requested and received data from TPD concerning bicycle stops, bicycle citations, bicycle thefts, Part I crimes, and bicycle crashes with injury between January 1, 2014, and August 15, 2015. 5 The bicycle stops, citation, crash, and thefts data included information about the time and location of these events. The bicycle stops and crashes data also indicated the demographic characteristics of the bicyclists involved. In this research, we focus on bicycle stops, which were much more numerous than bicycle citations, to gain a broader understanding of TPD’s use of bicycle enforcement. This focus on bicycle stops is notable as the TBT article analyzed data on bicycle citations.
These administrative data were relatively complete; however, two significant limitations were evident in the data we received from TPD. First, TPD records bicycle stops as street checks and, prior to the publication of the TBT article, TPD did not require officers to record every street check. As a result, the bicycle stops data we received are missing an unknown number of such stops. Second, the data we received indicate race but not the ethnicity of those involved in bicycle stops and crashes; this is a significant shortcoming, as a large proportion of Tampa residents are Latino. 6
We supplemented these administrative data with qualitative data. We interviewed police officers at various ranks in each of the three police districts. We also interviewed business owners and citizens from each police district. Last, we conducted ride-alongs in each police district.
Analyses
We used these data to address the fairness of TPD’s bicycle stops. We began by assessing the magnitude of racial disparities in bicycle stops and then tried to explain these disparities using the factors identified by TPD as causing them, local racial demographics, concerns about bicycle safety, bicycle thefts, and crime.
We first compared within each policing district the race distribution of stops to the local racial demographics. We do this to document the racial disparity when compared with the residential population but recognize that the inadequacy of residential demographics as a benchmark to measure racial bias is well established (Fridell, 2004).
Instead, TPD is focusing bicycle enforcement to improve bicycle safety, then data on bicycle crashes with injury are a reasonable benchmark. Bicycle crashes are largely random events and therefore are likely to be reflective of the racial distribution of bicyclists in a particular area as bicyclists do not typically travel great distances. To the extent that bicycle crashes are nonrandom, bicyclists who ride unsafely are at greater risk of a bicycle crash (e.g., riding against traffic, running stop signs and control signals, riding at night without lights); consequently, the bicycle crash benchmark also has an element of a violator benchmark. Thus, in the present context using bicycle crashes with injuries as a benchmark contains elements of both population and violator benchmarks. To be clear, we believe that bicycle crashes with injury is a reasonable and the best available benchmark, but it is not a perfect benchmark. Differences in reporting of crashes by race or differences in how bicycles are used by race (e.g., minorities use bicycles as a means of transportation and Whites use bicycles for recreational purposes) would generate some imperfections in the crash benchmark for the purposes of measuring racial bias.
Last, to assess the extent to which TPD uses bicycle stops as a general crime control strategy, we examined variation in the number of bicycle stops by grid color (i.e., TPD’s method of denoting areas with higher crime rates) and racial disparities in bicycle stops by grid color.
Furthermore, if in fact TPD’s bicycle stop strategy had a crime reduction focus, then we should evaluate the policy in terms of its effect on crime reduction. To examine the relationship between bicycle stops and crime in Tampa, we compared Part I crime before and after the publication of TBT ’s article on bicycle citations relative to Part I crime trends in the prior year. Notably, after the publication of TBT ’s new story, there was an abrupt and sizable reduction in the number of bicycle stops in each of the three police districts. The number of bicycle citations dropped by at least 45% in the 6 months after the publication of TBT ’s initial bicycle citation article (May–October 2015) in comparison to the 6 months preceding the story and 67% reduction in comparison to the same 6-month period in the 2014 (see Figure 1). Recall that TPD did not record every bicycle stop prior to the publication of the TBT story, so the actual reduction in the number of bicycle stops is in all likelihood considerably greater than these figures. This drop in bicycle stops was not the result of TPD administration ordering patrol officers to reduce their use of bicycle stops; instead, this marked decline in bicycle stops appears to be the result of a chilling effect caused by the article. Simply stated, TPD officers apparently reduced the number of bicycle stops in order to protect themselves against the possibility of receiving unwanted scrutiny for making numerous bicycle stops.
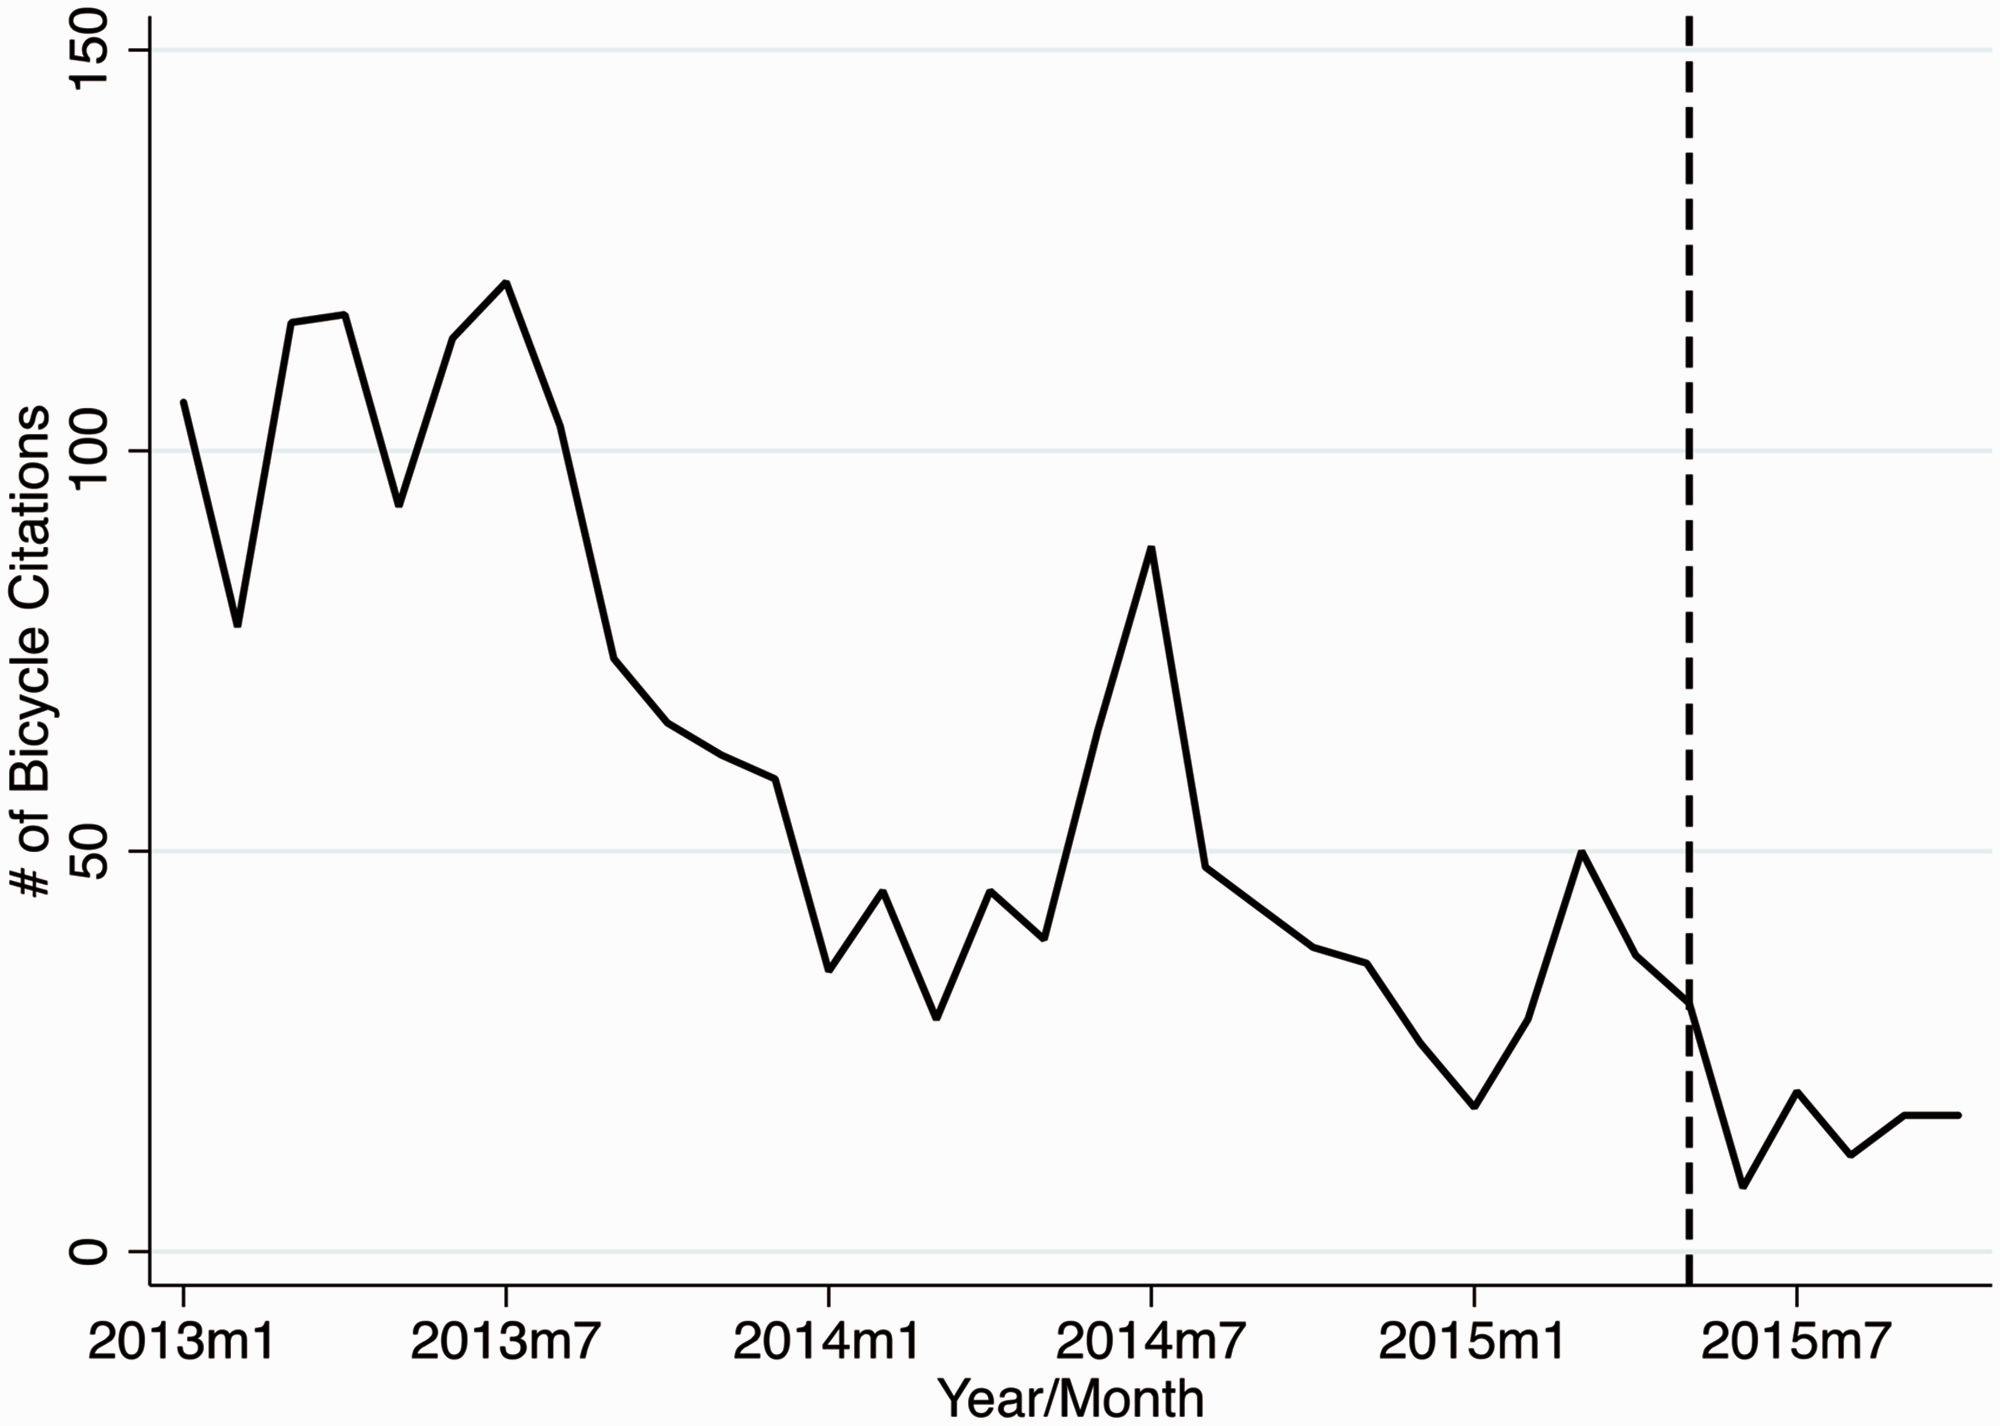
TPD bicycle citations 2013–2015.
The story’s publication is suitable for a natural experiment, because the publication of TBT ’s news story was beyond the control of TPD and was unrelated to the contemporaneous level of crime in Tampa. We compare the crime levels before and after the TBT article with the crime trends in the same period in the prior year in order to adjust for season trends in crime. Logically, if bicycle stops are an essential part of TPD’s efforts to reduce crime, then crime should increase after the publication of the news story due to the large reduction in the number of bicycle stops. It is important to note that this natural experimental design does not rely on accurately counting the number of bicycle stops made, it simply asks the question: Did crime change after the publication of TBT news story concerning bicycle enforcement?
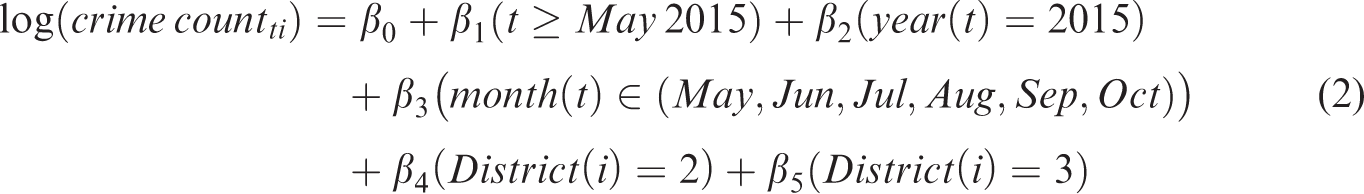
In more detail, we compared reported Part I crime before and after the publication of the news story using a difference-in-difference approach (for a discussion of this approach see Murnane & Willett, 2011), which assessed whether Part I crime after the article (first difference) is meaningfully different than what we would have expected from seasonal changes and the overall decreasing trend in Tampa crime from 2014 to 2015 (second difference). The difference-in-difference estimator of the effect of the drop in bicycle stops is as follows:
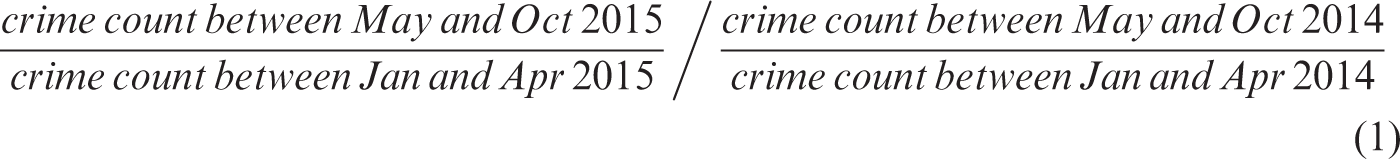
The denominator involving 2014 crime counts computes the relative change in the number of crimes from May to October 2014 compared with January to April 2014. If the TBT article had no effect than we would expect a similar relative change in crime levels in 2015. The numerator involving 2015 crime counts computes the relative change in crime before and after the TBT article. The estimator describes how much greater the crime change was after the TBT article compared with what we would have expected based on 2014 seasonal crime trends. We estimated the difference-in-difference estimate and its standard error using a Poisson regression model for the crime count in month t in district i.
Of primary interest is
Results
Stops Show a Racial Disparity Relative to Census Data
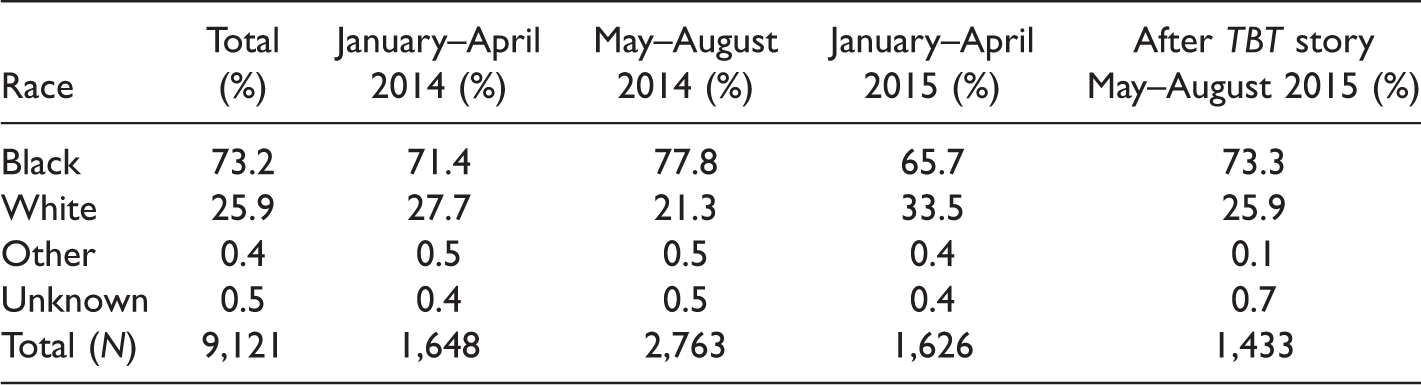
The bicycle stop data as documented by TPD street checks clearly demonstrate stark racial disparities in bicycle stops (Table 1). In the full period of observation (January 2014–August 2015), 73.2% of stopped bicyclists were Black, which is nearly 3 times as large as the percentage of stopped bicyclists who were White (25.9%). The same pattern of racial disparities in bicycle stops is apparent in each of the four periods shown in Table 1, and even after the publication of the TBT news story alleging racial profiling. Thus, the racial disparities noted in the TBT article concerning bicycle citations are also apparent in bicycle stops, and these racial disparities are relatively stable over the approximately two-year period of interest.
Race Distribution of Bicyclists Stopped by TPD.
Source: Tampa Police Department.
Note. TBT = Tampa Bay Times.
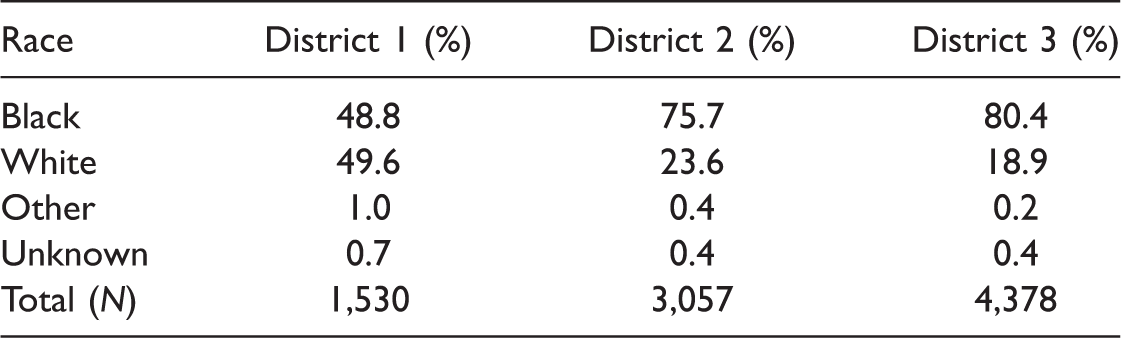
While the observed racial disparities do not vary substantially over time, there is considerable variation by place. Table 2 displays the percentage of stopped bicycles of each racial group by TPD district. In District 1, the White percentage of stopped bicyclists (49.6%) slightly exceeded the Black percentage (48.8%). However, in Districts 2 and 3, the Black percentage of stopped bicyclists markedly outpaced the White percentage. In District 3, the district with the largest number of bicycle stops, the Black percentage of stopped bicyclists was 80.4% in comparison to 18.9% for Whites; and, in District 2, these percentages were 75.7% versus 23.6% for Blacks and Whites, respectively. The race distributions do not always comport with the racial demographics of Tampa. For example, according to the 2010 U.S. Census data, East Tampa, the area TPD’s District 3 serves, is 84% Black and 10% White, similar to the race distribution of stops. However, West Tampa, the area TPD’s District 1 serves, is 74% White and 11% Black, strikingly different from the race distribution of stops. These numbers clearly illustrate that place plays a prominent role in the likelihood of a bicycle stop, and therefore the analyses that follow take place into account.
Race Distribution of Stopped Bicyclists by TPD District.
Source: Tampa Police Department.
Note. Bicycle stops recorded by TPD from January 2014 to August 2015 excluding 156 stops that did not record location of stop.
Stops Show a Racial Disparity Relative to Bicycle Crash Data
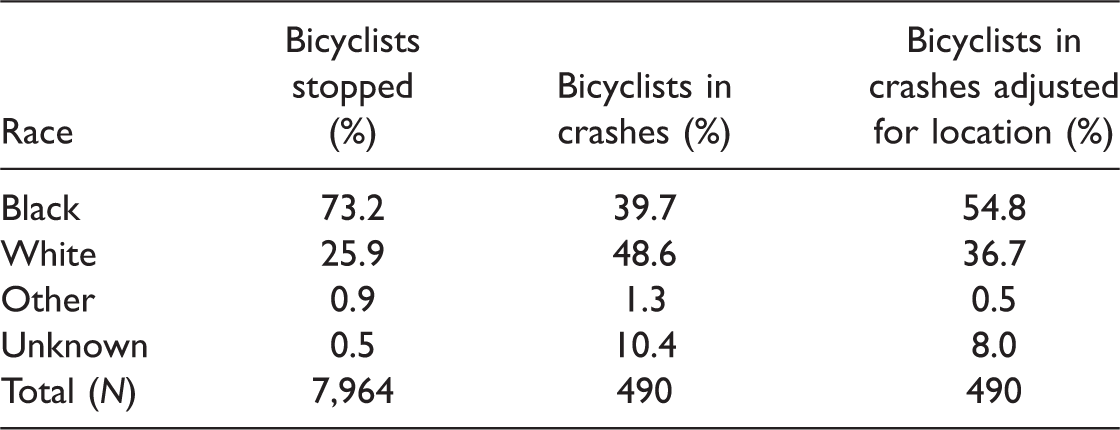
We sought to evaluate if racial disparities in bicycle stops can be explained by race differences in bicycle ridership as measured by bicycle crashes, while taking place into account. If the racial distribution of those involved in bicycle crashes closely matches the racial distribution of bicycle stops, then this would be evidence that the observed racial disparities in bicycle stops are simply due to race differences in bicycle ridership and the manner in which bicycles are ridden. Yet, Table 3 clearly shows that the two distributions are highly dissimilar. In stark contrast to the race distribution of bicycle stops, a larger percentage of those involved in bicycle crashes with injury were White (48.6%) than Black (39.7%). Furthermore, the percentage of Black bicyclists among those injured in crashes is well below their representation in the street checks.
Race Distribution of Bicyclists Stopped Versus Bicyclists Involved in Crashes.
Source: Tampa Police Department.
Note. Bicycle stops recorded by TPD from January 2014 to August 2015 excluding 156 stops that did not record location of stop.
As noted earlier, part of the racial disparity in bicycle stops is related to differences in location. Blacks are much more likely than Whites to live in areas of Tampa, like District 3, where bicycle stops are numerous. A spatial analysis comparing the location of bicycle stops to bicycle crashes found a spatial mismatch between the two. Of the 19 grids with the highest number of bicycle crashes with injuries, only three also had relatively high numbers of bicycle stops. The remaining 16 grids with the highest numbers of bicycle crashes do not have relatively high numbers of bicycle stops. As a result, it is plausible that the differences in the racial distribution of stops versus crashes shown in the second and third columns in Table 3 are due to differences in where bicycle crashes and stops occur. To account for these differences in location, we used the TPD grid of each bicycle crash and reweighted the bicycle crash data so that the frequency of bicycle crashes in a grid matched the number of bicycle stops in the grid—effectively eliminating location as a plausible explanation for the difference. Even after adjusting for the location of the stops, Black bicyclists were overrepresented by nearly 20 percentage points when compared with their representation in bicycle crashes in the same neighborhoods (p < .001). 7
Stop Data Show a Focus on Crime Control
The preceding analyses demonstrate that there are strong place-based differences in the likelihood of a bicycle stop. Another, perhaps by meaningful way, to demonstrate variation in place-based variation in bicycle stops and racial disparities in bicycle stops is to examine the rate of bicycle stops by grid color and racial disparities by grid color. Figure 2 reports the rate of bicycle stops per grid-by-grid color. This figure clearly shows that bicycle stops were much more common in high-crime grids (orange and red grids) than in low-crime trends (unmarked and yellow grids). The number of bicycle stops was highest in orange grids; it is important to note that informally police officers expressed to us that they focus their crime control efforts in these areas to prevent them from becoming red grids. These quantitative findings combined with the findings of our qualitative interviews strongly imply that TPD focuses its bicycle stop activities in high-crime areas in an effort to suppress crime.
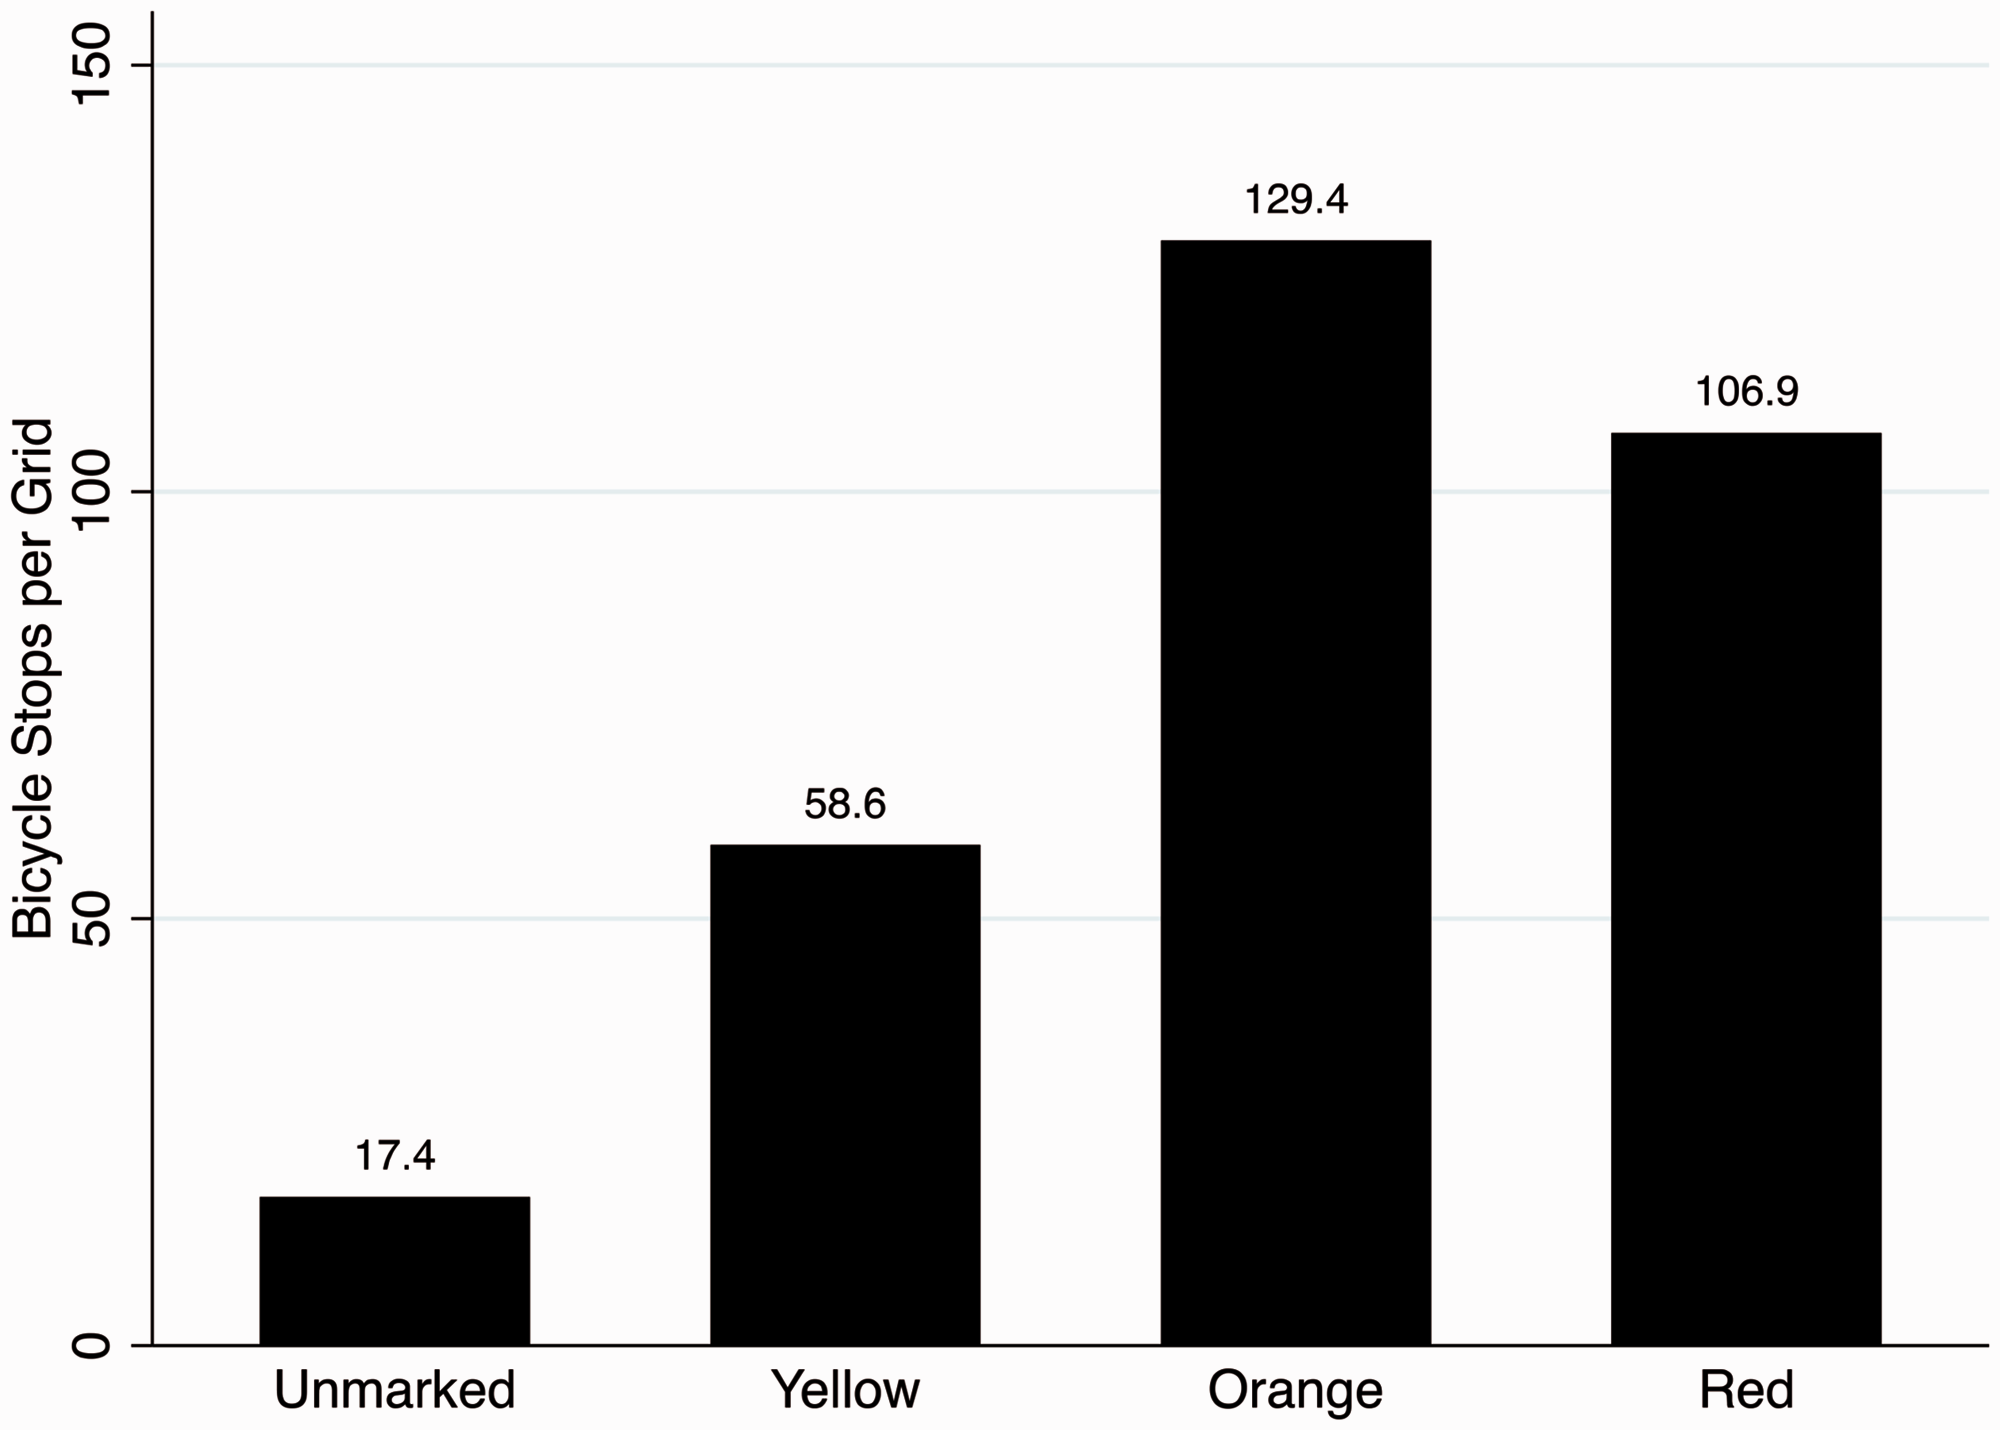
Bicycle stops per grid by TPD grid color.
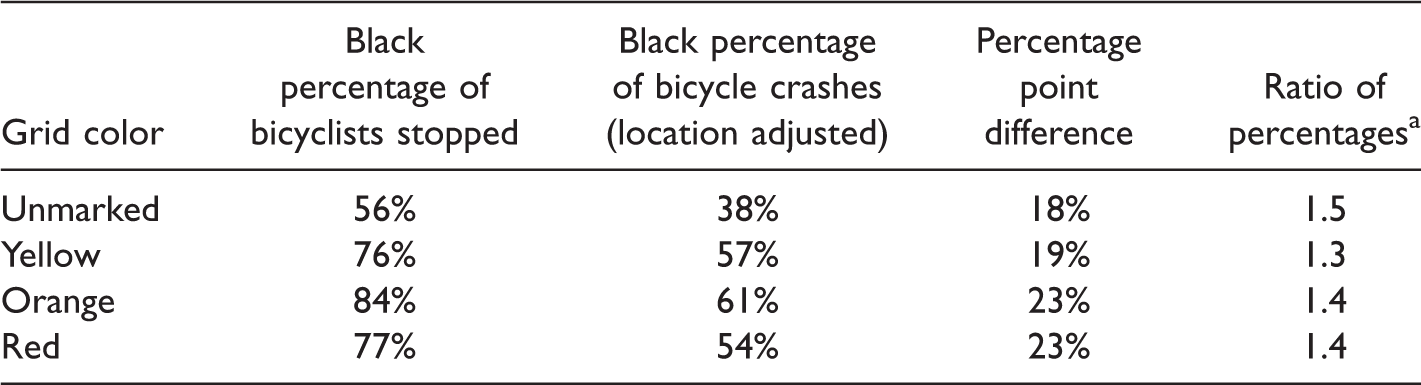
Table 4 reports the raw and place-based adjusted Black percentage of bicyclists stopped by grid color. The Black percentage of bicyclist stopped by TPD was decidedly lower in unmarked, low-crime grids and, much higher in the other grid colors, especially orange grids, which again were areas with relatively heavy proactive policing activity in an effort to keep these grids from becoming red grids.
Black Overrepresentation by Grid Color.
Source: Tampa Police Department.
Note. Bicycle stops recorded by TPD from January 2014 to August 2015 excluding 156 stops that did not record location of stop.
aCalculated as Black percentage of bicyclists stopped over Black percentage of bicycle crashes (located adjusted).
Taken as a whole, these findings reveal many important features of the racial disparities in bicycle stops. First, there are stark racial disparities in bicycle stops, and the magnitude of the disparity was consistent regardless of grid color. Second, these disparities cannot be attributed to racial differences in bicycle ridership or dangerousness of bicycle ridership, as assessed by the bicycle crash benchmark. Third, there was a weak relationship between the number of bicycle stops and bicycle crashes in an area; thus, the use of bicycle stops does not appear to be honed in a manner suitable for promoting bicycle safety. Fourth, the frequency of bicycle stops was considerably higher in areas with relatively high levels of crime, particularly in orange grids. These findings do not prove that TPD racially profiled Black bicyclists but do show a pattern of enforcement that disproportionately affected Black bicyclists. The strongest conclusion that can be drawn from these findings is that TPD, in the time period of interest, concentrated the use of proactive bicycle stops in high-crime areas, particularly in areas at risk of becoming red grids. TPD officials and officers claim that one of the purposes of this concentration of bicycle stops in high-crime areas was to reduce crime. Given this claim, it becomes vital to assess the effect of bicycle stops on crime in Tampa.
The Effect of Bicycle Stops on Crime
TPD’s use of bicycle stops as part of its proactive strategy implicitly assumes that bicycle stops are effective in controlling crime. This belief was explicitly confirmed in interviews with TPD officers and officials. Yet, there is no empirical evidence testing the effectiveness of bicycle stops in or outside of Tampa to our knowledge. Assessing the relationship between bicycle stops and crime is very important, because if bicycle stops are effective in reducing crime, then an evidence-based argument can be made that the disproportionate burden placed on Black bicyclists is offset, at least in part, by the benefit of reduced crime in Black neighborhoods. On the other hand, if bicycle stops are not effective in reducing crime, then the burden placed on Black bicyclists is difficult to justify.
As discussed in the “Methods” section, to estimate the effect of bicycle stops on crime in Tampa, we used a natural experimental approach. The central element of this natural experiment is the precipitous drop in the number of bicycle stops after the publication of the TBT article. Logically, if bicycle stops are an essential part of TPD’s proactive policing strategy, then crime should increase in the period after the TBT article. Thus, we can assess the effect of bicycle stops on crime by comparing the level of Part I crime before and after the TBT news story. Yet, it is important to account for the strong downward trend in Tampa’s crime rate and strong seasonal effects in crime. To do so, we employed the difference-in-difference approach described in the “Analytic Strategy” section.
Based on this analytic strategy, we find that crime did not substantially change after the TBT article (see left side of Table 5). After the TBT story, crime was 4% larger than we would have expected based on seasonal trends in 2014 and the 2014 to 2015 trend in crime. 8 This estimate has a relatively large standard error, making this estimated effect imprecise. The 95% confidence interval the estimated effect spans from a 8.4% decrease in crime to a 17.8% increase in crime.
Estimating the Effect of Bicycle Stops on Part I Crime: Poisson Regression With Robust Standard Errors.
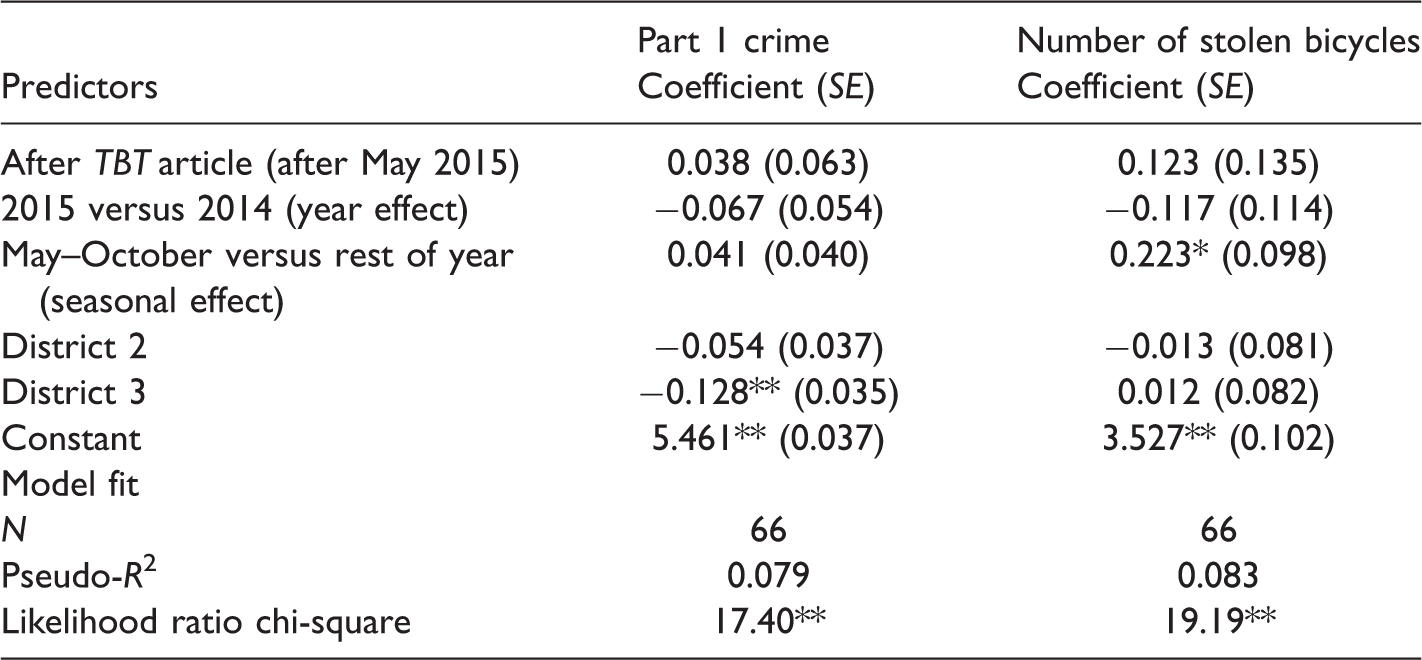
Source: Tampa Police Department.
Note. Bicycle stops recorded by TPD from January 2014 to August 2015 excluding 156 stops that did not record location of stop. Coefficients in the table correspond to coefficients in Equation (2). TBT = Tampa Bay Times.
*p < .05. **p < .01.
The parallel analysis assessing the effect of the reduction in bicycle stops on reported bicycle thefts also had a positive point estimate of approximately a 13% increase in bicycle thefts (see right side of Table 5). This estimate is substantially larger than the 4% change in overall crime, yet again the standard error associated with this effect was large and thus the estimated effect is unreliable with a 95% confidence interval running from a 13% decrease in the number of reported stolen bicycles to an increase of 47%.
These findings offer little compelling evidence that the sharp reduction in bicycle stops resulted in a crime increase. In fact, our results most strongly support the conclusion that the reduction in bicycle stops had no discernible effect on crime in Tampa.
Discussion
In this research, we attempted to examine the fairness and effectiveness of bicycle stops in Tampa. In regard to these two questions, this research yields several notable findings. First, the data provided by the TPD do not appear consistent with the agency having a strategic focus on bicycle safety, because there is a spatial mismatch between the places with the highest number of bicycle crashes and places with the greater number of bicycle stops. Therefore, TPD bicycle enforcement does not appear to be implemented primarily as a means to enhance bicycle safety. 9 Second, we found clear evidence that there is a relatively strong relationship between the number of bicycle stops made in an area and crime in that area. Third, natural experimental analyses find that the sharp reduction in bicycle stops after the publication of the TBT article had no discernible effect on the number of stolen bicycles, or the number of Part I crimes generally. This finding suggests that bicycle stops are not an essential part of TPD’s efforts to suppress crime.
More simply stated, this research finds evidence consistent with the claim that the TPD used bicycle enforcement as part of an overall proactive crime reduction strategy. We conducted qualitative interviews and discussions with dozens of TPD officers in all three districts, who consistently told us that proactive policing including the use of bicycle stops is an important component of TPD’s culture and strategy toward controlling crime. The quantitative data are consistent with these claims in that bicycle stops were most numerous in high-crime areas. Our interviews with these officers also indicated that bicycle stops were intended to promote community safety, particularly in areas with the highest crime rates, which were largely Black communities, and bicycle stops were not intended to harass or intimidate Black bicyclists. Interestingly, it was visually clear from our observation of roll calls that many of the officers working in District 3, the district with the highest crime and largest number of bicycle stops, were racial or ethnic minorities including the commanding officer. Numerous of these minority officers told us that they chose to work in District 3, because they grew up in District 3 or in neighborhoods similar to those in District 3, and they wanted to help make these neighborhoods safer. Further, our interviews with residents in District 3, the majority of whom were racial or ethnic minorities, revealed considerable support for TPD’s efforts to suppress crime in their community including their use of bicycle stops. We uncovered no evidence that challenges TPD’s claim that the use of bicycle stops was an earnest effort to reduce crime in high-crime communities. Thus, in this context, bicycle stops did not appear to have been made in an effort to discriminate against Black bicyclists; instead, the TPD’s emphasis on bicycling enforcement, by all indications, appears to have been an honest effort to improve community safety in the areas most in need.
TPD’s use of bicycle stops lays bare a fundamental issue in criminal justice—balancing the interests of community crime control against the rights of individuals. While the bicycle stops apparently were a well-intended means of fighting crime in high-crime communities, these efforts have disproportionately burdened Black bicyclists. And to be clear, not all of the residents we interviewed supported TPD’s use of bicycle stops. A sizable portion of interviewees expressed concern that what may have begun as an attempt at proactive policing has turned into a way for the police to harass Black bicyclists. The bottom-line appears to be that the TPD burdened Black bicyclists by disproportionately stopping them in the name of benefiting Black communities by increasing their public safety. Yet, our analyses indicate that the TPD’s bicycle enforcement did not produce a community benefit in terms of crime reduction but did burden individual bicyclists, particularly Black bicyclists in high-crime areas of Tampa.
The technical assistance report to TPD recommended a number of changes to make bicycle stops more fair and transparent. TPD quickly implemented these recommendations and even made several notable policy changes before the technical assistance report was finalized (e.g., all street checks were required to be documented). Under the leadership of TPD’s new police chief, Eric Ward, TPD reduced its emphasis on a broad &&red-grid strategy, and instead sharpened TPD’s focus on microlocations (e.g., intersections) with high-crime rates (i.e., hot spots), particularly violent crime. Thus, law enforcement emphasis was shifted from relatively large grids with high-crime rates to much smaller hot spots. Further, Chief Ward and TPD took steps to strengthen community involvement in crime prevention by working and communicating more closely with business owners and residents. In 2016, the first full year after TPD curtailed its use of bicycle stops, Tampa maintained its long and consistent downward trend in the number of Part I crimes. Tampa’s violent crime decreased by 16.5% and property crime fell by 6.8% in 2016 (Farrow, 2017). TPD attributes this continued drop in crime to the changes implemented under Chief Ward—and notably this downward trend did not rely on making large numbers of street checks or bicycle stops, suggesting that police can effectively control crime without making large numbers of discretionary, proactive stops.
The broad issue of racial disparities in discretionary, proactive police actions is a reoccurring and persistent problem nationally, and perhaps particularly in the state of Florida. In fact, many scholars credit police officers in Volusia County, Florida for being a forerunner in the systematic use of race in highway drug interdiction traffic stops beginning in the 1980s (see, e.g., Harris, 2003; Withrow, 2006). More recently, police in Miami Gardens have been accused of racial bias in stop and frisk encounters (Brown, 2013). Police in Jacksonville have been accused of issuing a large number of citations for jaywalking in a racially biased manner (Sanders & Rabinowitz, 2017). And statewide, there are sizable racial disparities in seat belt violations (The American Civil Liberties Union Racial Justice Program, 2016). Perhaps, police agencies throughout the state of Florida could learn from TPD that making large numbers of highly discretionary and potentially racially biased stops are not necessary to reduce crime.
Footnotes
Acknowledgments
The authors would like to acknowledge the staff of the Tampa Police Department for their willingness to share experiences and insight with authors and also want to acknowledge the technical assistance team: Sheila Gunderman, Cedric Alexander, and James Letten.
Declaration of Conflicting Interests
The authors declared no potential conflicts of interest with respect to the research, authorship, and/or publication of this article.
Funding
The authors disclosed receipt of the following financial support for the research, authorship, and/or publication of this article: This project was supported by grant number 2014-CK-WX-K027 awarded by the Office of Community Oriented Policing Services, U.S. Department of Justice. The authors were independent subcontractors on this project. The opinions contained herein are those of the author(s) and do not necessarily represent the official position or policies of the U.S. Department of Justice.