
Abstract
In this work, we demonstrate that current fatigue characterization tests with high density foam suffer from edge effects within the specimen, probably leading to early failures. Then a new specimen is designed to avoid this artifact. With this developed geometry, the stress is concentrated in the center of the specimen and not in the edge as given by the ASTM D1623-78 standard one. This allows getting the optimal fatigue life of PVC 4e-5 ℃-1 foam during tensile–tensile fatigue test.
Keywords
Introduction
Sandwich materials are widely used in the aerospace, space industries, marine, sport, and transport since they give the structure a very good stiffness for a minimized weight, which can lead to substantial weight savings [1]. In all of these applications, the core is typically closed-cell polymer foam and designed to carry a substantial part of the load. The increasing use of these cellular materials bring about the need for material properties and failure to do so especially in highly loaded, with high fatigue requirements such as the marine industry could slow their uses [2, 3]. One of the distinctive uses of sandwich in naval application is the presence of very high stresses and high-cycles fatigue [4–5] where both the skin and the core must perform very well. However, while fatigue of skin materials has been widely studied [6–8], the assessment of the foam’s fatigue behavior would benefit from additional studies, extending work already done. A tutorial about fatigue of foam cored sandwich structure can be read in Sharma et al. [9]. Previous work has been also presented Gibson and Ashby [10], Zenkert et al. [2] and Zenkert and Burman [3], using both tensile and flexure tests and Shenoi et al. [11], Kanny and Mahfuz [12] performed fatigue testing of foam core sandwich beams.
The difference between tested properties and real material properties can be test set up dependent [13]; care needs to be taken that the results used are sourced from a test where the test setup is relevant to the load case [13–15]. This is particularly applicable to fatigue; when characterizing a material fatigue life, it is important to reduce to the minimum any artifact that could influence the material behavior as it could lead to a nonintrinsic material properties evaluation. The significance of defects on the fatigue life has been studied by Morel et al. [16] on C35 carbon steel samples. They note that increasing the size of the defect decreases the measured fatigue life of the tested material. With sandwich or foam core specimens, edge effects may be related to the cutting of the specimen. The use of cutting tools can degrade the foam cells (wrenches, tears, heating), which can lead to a modification of the local stress field or the material properties and therefore affect the fatigue life.
Our work aims to bridge the gap between current fatigue testing techniques and real, intrinsic, material fatigue properties. A specific emphasis is put on avoiding edge effects, defined by a modification of the stress field or the material properties due to specimen machining or foam cell deterioration, which can affect the fatigue life. Testing the material with lower edge effects will enable to find the intrinsic material fatigue properties and behavior of the studied foam. This aims to be used in future full-scale designs, requiring accurate knowledge of such properties.
Testing standards generally aim at developing test setups that eliminate these stress concentrations, but it is not always possible and currently not present in the literature. In this article, it is then offered an original test method for tensile fatigue on PVC foam, by no longer considering a homogeneous state of stress. To achieve this goal, comparative testing using the ASTM standard D1623-78 [17] has also been done with the same batch of material in order to quantify the difference in fatigue life and perform the most objective study possible.
Background
In terms of fatigue on polymeric foams, studies have been done by Gibson and Ashby [10], Zenkert et al. [2] and Zenkert and Burman [3] using the ASTM D1623-78 [17] (tension–tension test) and other authors presented in the tutorial made by Sharma et al. [9].
Tensile–tensile tests are used as it is the first test to be carried out in most material characterization campaigns as they are less demanding in terms of testing gear.
The specimen geometry recommended by the standard is an axisymmetric dog bone shape with an upper diameter of 50 mm and a center diameter of 30 mm (Figure 1).
Current fatigue specimen geometry, ASTM D1623-78 [17].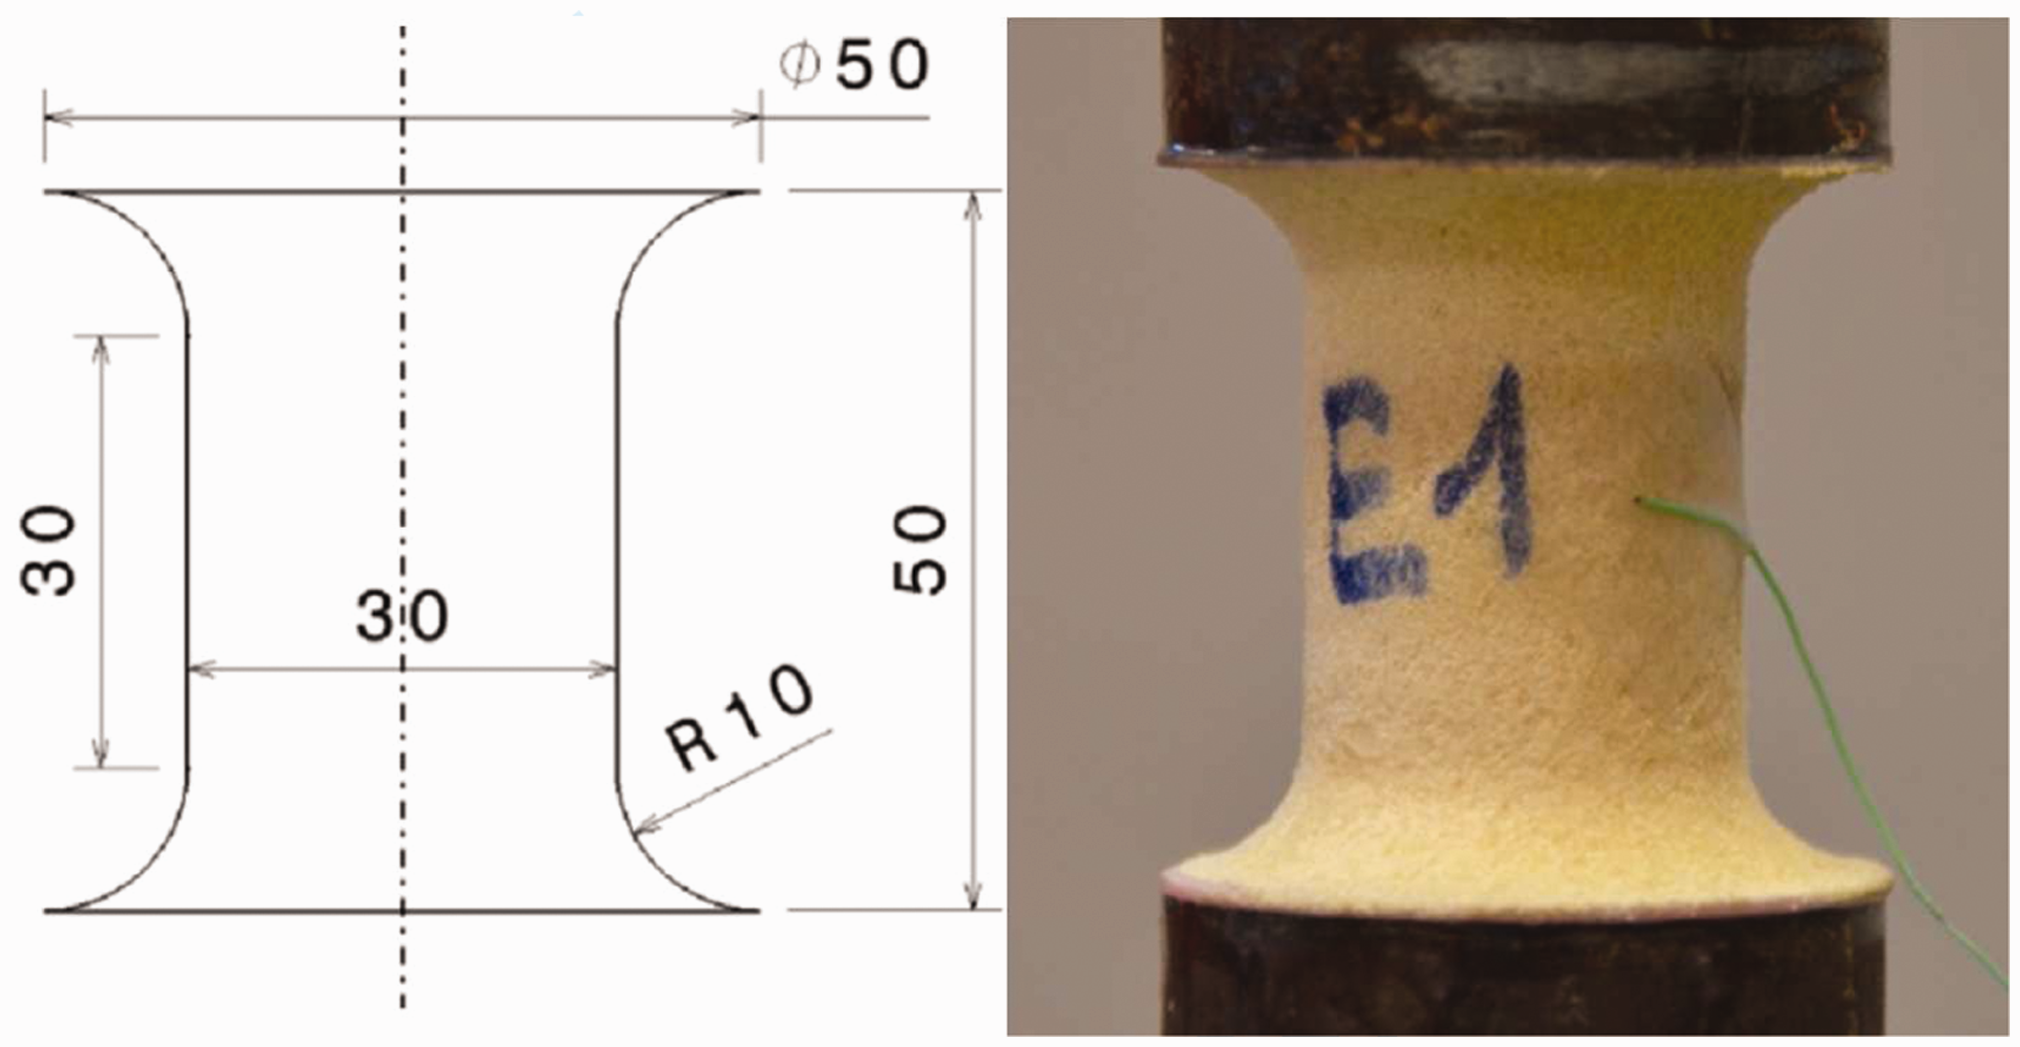
The specimen is cut from a 50-mm thick panel where the thickness of the panel corresponds to the height of the specimen. In such geometry, it is assumed that the stress is maximum and uniform at the midplane.
In this study, we aim to demonstrate that the current geometry used in the tension–tension test creates edge effects, which affect the fatigue life of the studied material. To highlight this phenomenon, we propose the following:
Study the actual shape with tests completed in our facility, in order to have full control on the testing parameters. Conduct a finite element analysis (FEA) on the actual shape to isolate the stress concentrations that may lead to early failure. Using 3D modeling and FEA tools, create a new test method capable of reducing the stress concentrations at the edges of the specimen and shift the maximum stress to the center of the specimen. Compare the fatigue life given by each test method, with the same testing environment at a given stress level.
Material
Divinycell H100 PVC closed-cell foam, from DIAB Group, is the material tested in this paper. It is widely used in structures for many applications like automotive and marine industries. However, fatigue and failure are still not very well known and mechanical characterization requires some more improvements. Foam core microstructure consists of a tridimensional network of thin membranes. Walls cross randomly and lead to complex failure paths. Therefore, the foam is a heterogeneous material with a behavior strongly influenced by the local behavior (microstructure).
Mechanical characteristics of the PVC foam (Divinycell) [18].
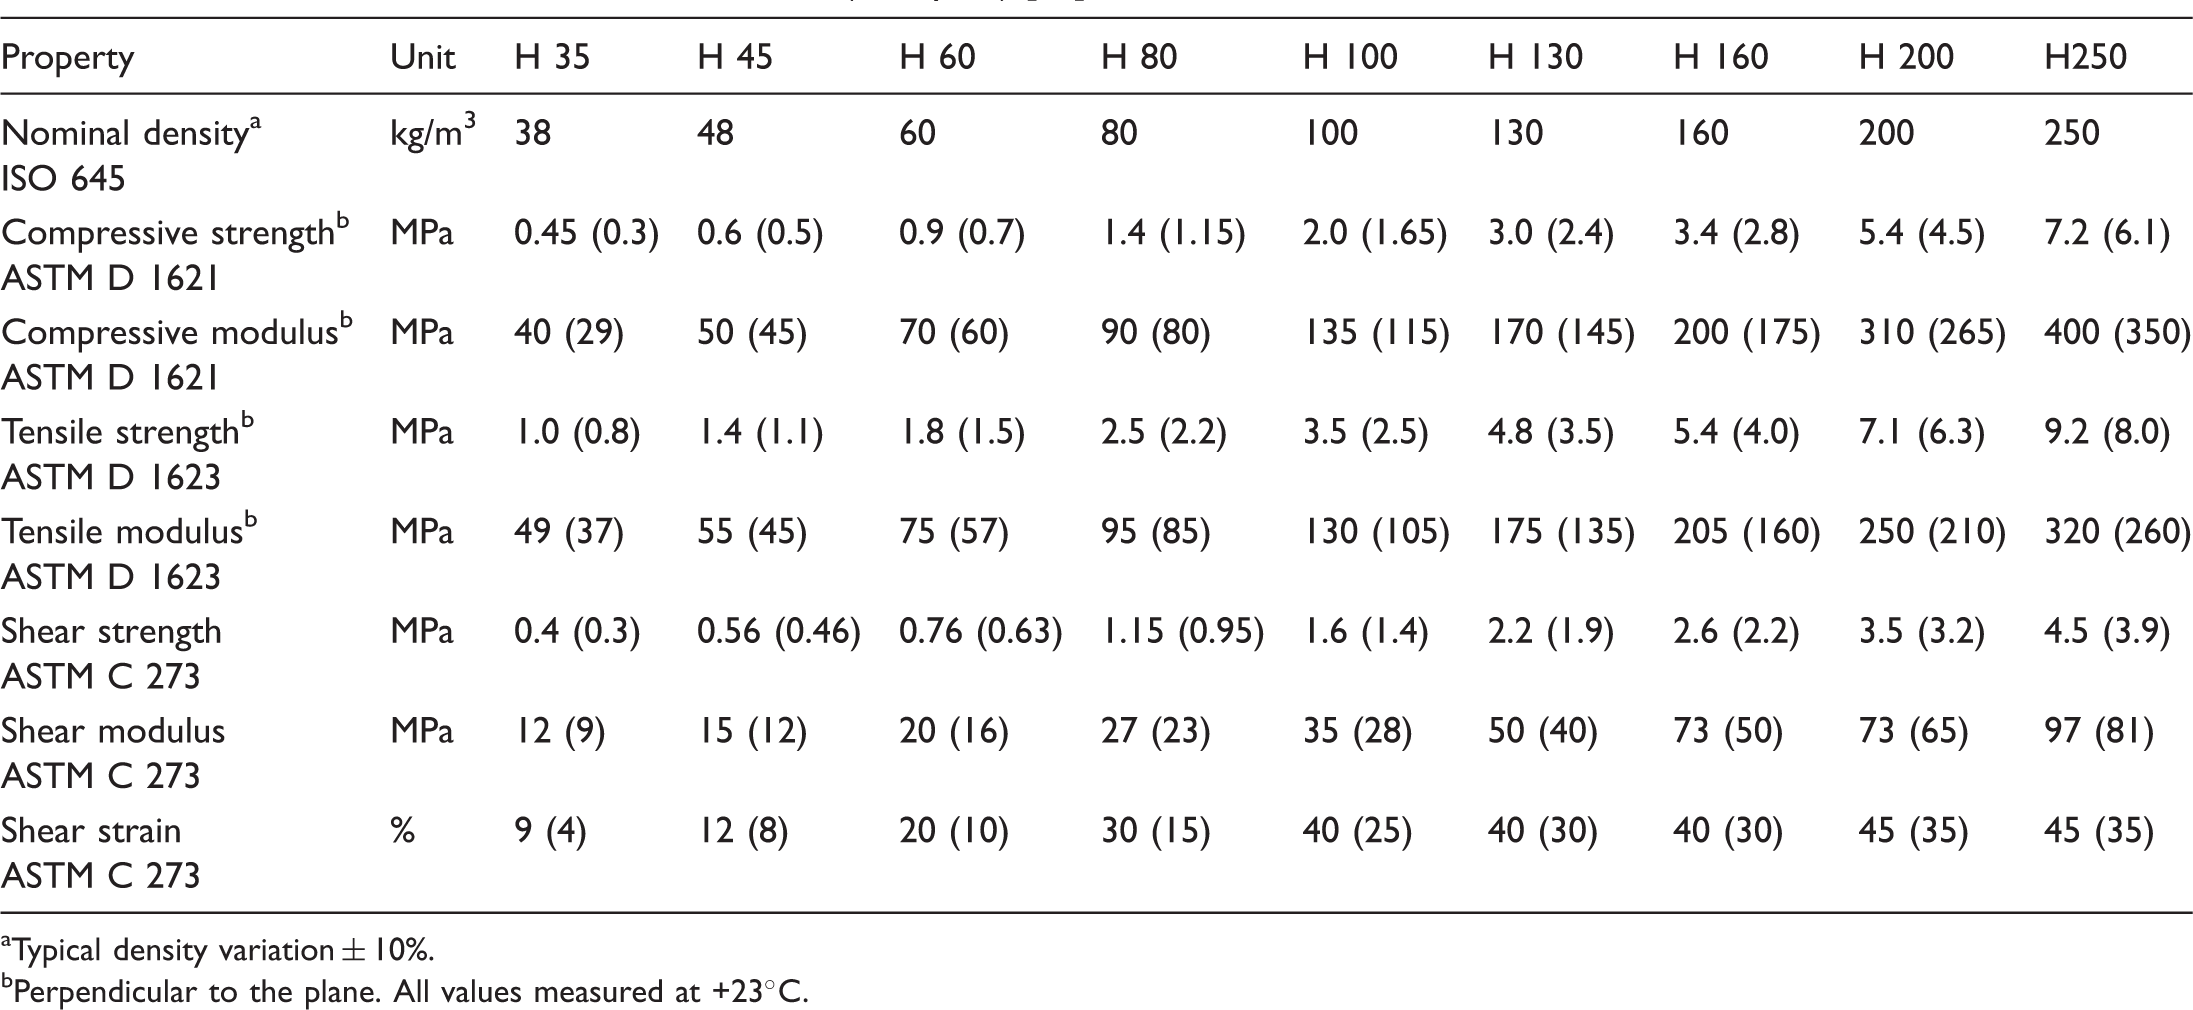
Typical density variation ± 10%. bPerpendicular to the plane. All values measured at +23℃.
Testing apparatus
Fatigue tests were performed using a MTS 100 kN Servo hydraulic testing machine. They were carried out at 5 Hz with the following loading ratio

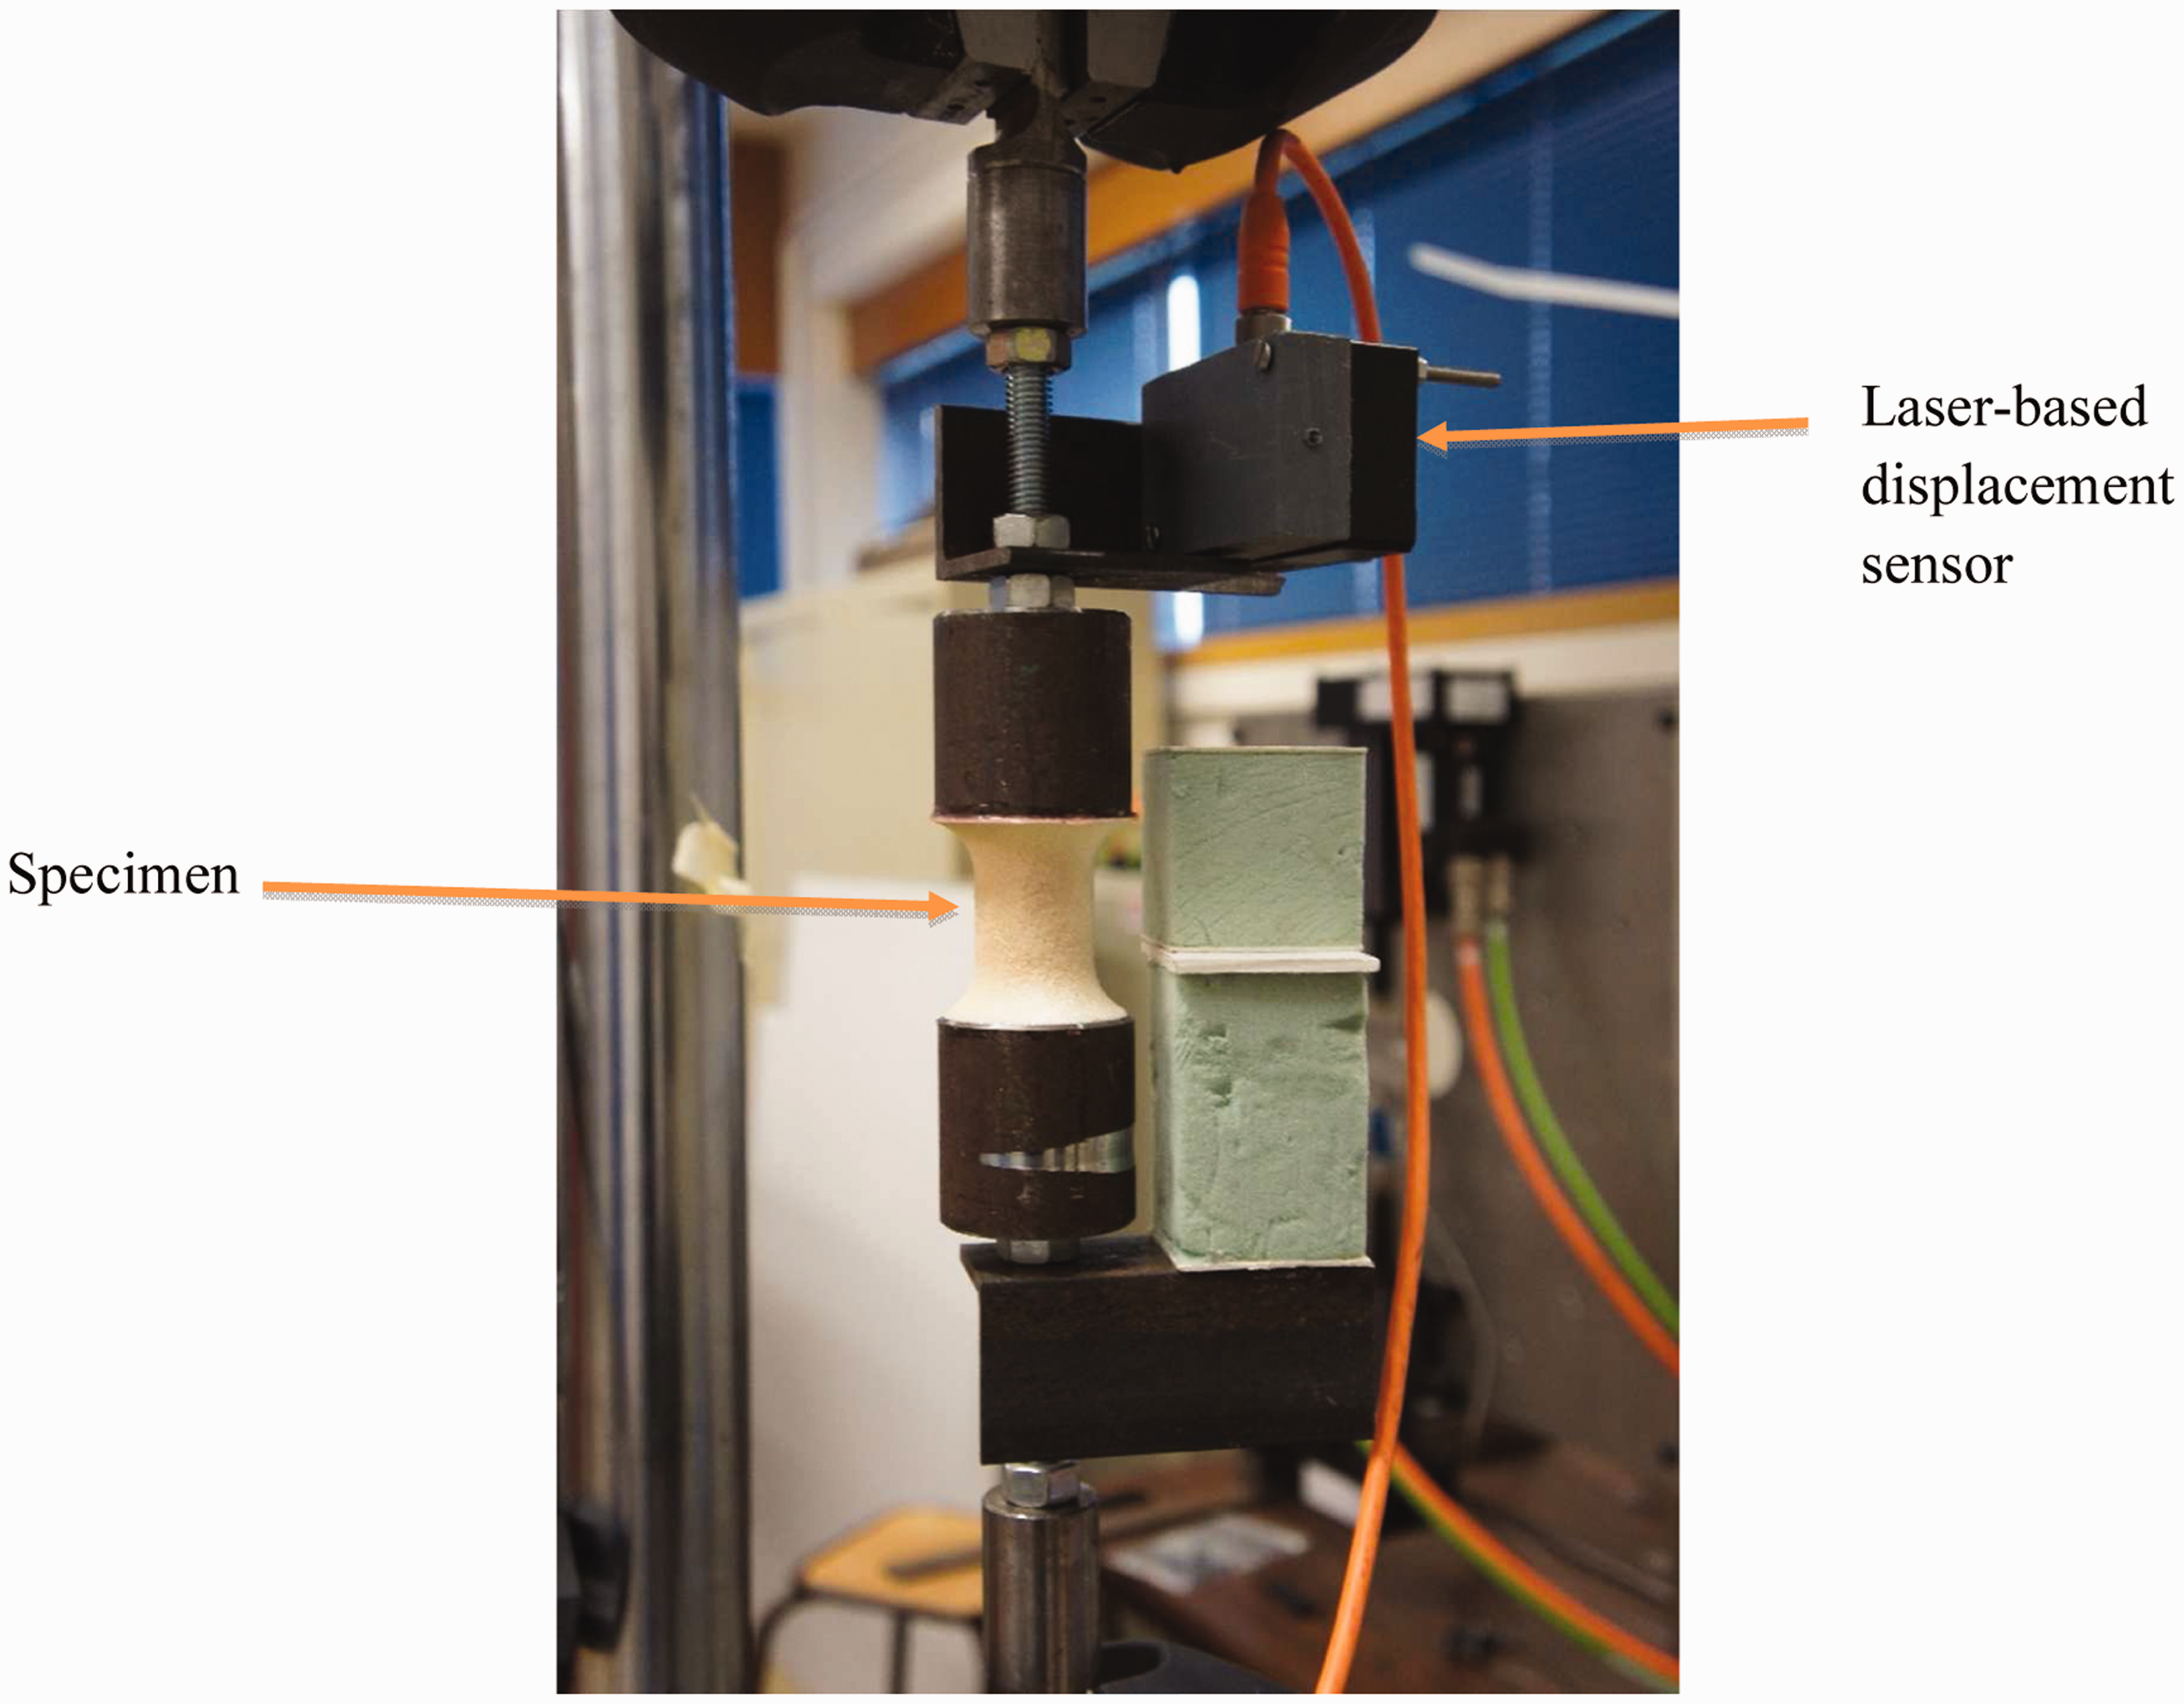
A laser-based displacement sensor was used to capture the elongation of the specimen during the fatigue test.
The tests were conducted at room temperature; ambient temperature is recorded as well as the temperature at the surface of the specimen during the full duration of each test. The measure is done by thermocouples, synchronized with force, and displacement. These measurements allow us to have a full picture on the testing parameters.
Temperature measurements are an important factor to take into account during fatigue testing, as the cycling frequency needs to be sufficiently high to realize a high number of cycle within a reasonable time, while not being too fast as that would result in the specimen heating up, which can affect the mechanical behavior of the tested material.
We have chosen to compare our developed geometry with the ASTM geometry at a number of cycles, which induces a fatigue failure mechanism while minimizing the testing time. The chosen life time from the literature is 100,000 cycles, which corresponds to a theoretical stress level of 1.61 MPa, Zenkert et al. [2].
In such geometry, it is assumed that the average stress applied in the dog bone–shaped test specimen is the load applied divided by the cross section of the specimen.
The reference value is σmax = 1.61 MPa, in the midplane, for our tests. For such a stress level and for a same R coefficient of 0.1, the applied load is 626 N ± 512 N.
Existing geometry
Fatigue tests
As stated above, in order to confirm test results from the literature, Zenkert et al. [2] and Zenkert and Burman [3] and Gibson and Ashby [10], and control all the testing variables such as temperature during testing, specimen machining, load alignment, five ASTM type specimens have been tested at room temperature.
To assure consistency with the literature, the tests performed at our facility, Figure 2, were operated at 5 Hz and with an R coefficient of 0.1.
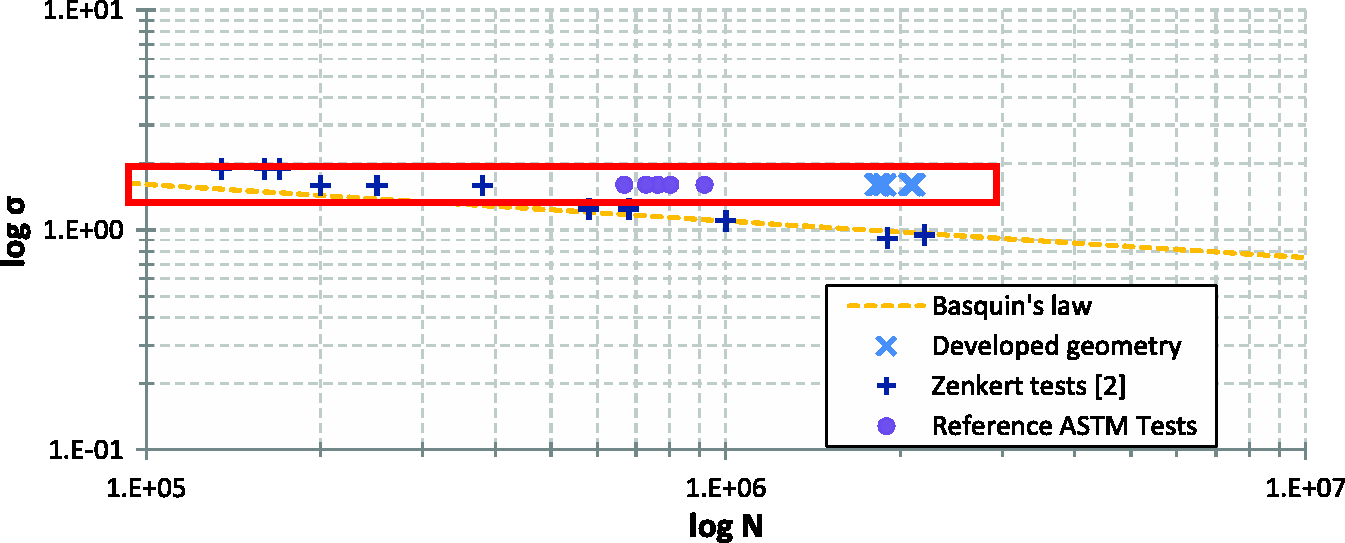
Figure 3 shows the test results from the literature (Zenkert et al. [2]) as well as the Basquin’s law, defined in [2] as well. This law, relating stress (σ) and fatigue life (N), is defined empirically by the authors as follows
Test assembly -- Tests performed at Institut de Recherche en Genie Civil et Mecanique, Université de Nantes. S–N curve, comparison between Zenkert results and our results with the ASTM geometry.
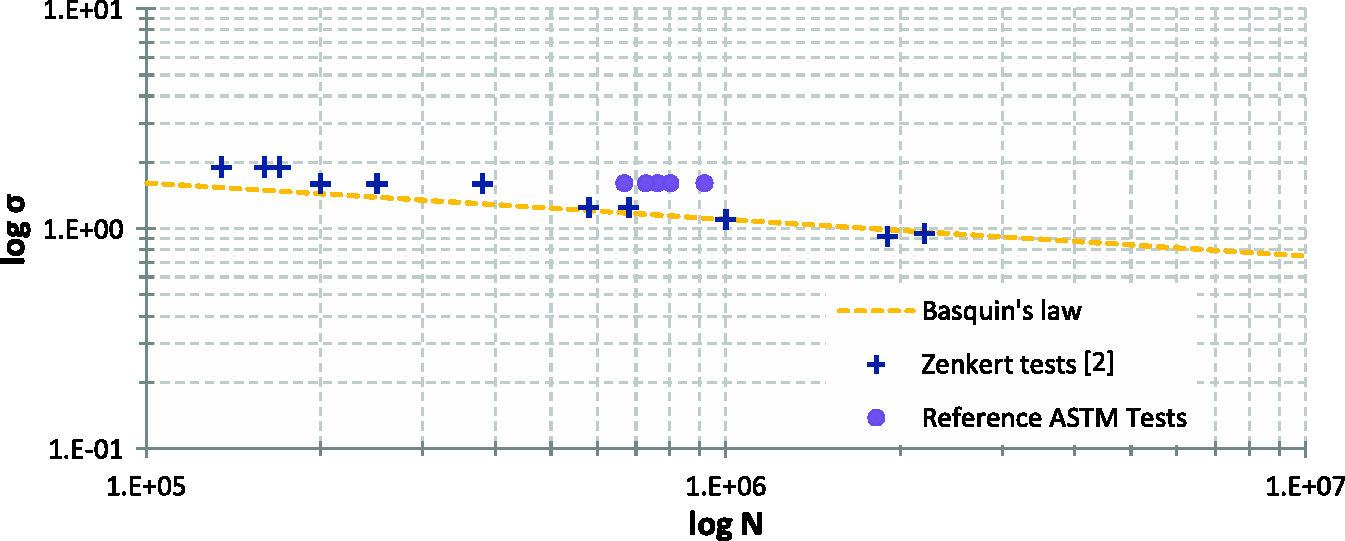
With B = 11 and β = 6.
In our tests using the ASTM geometry, the average lifetime obtained is 7.7. E5 cycles (Figure 3). This is significantly higher than the results found by Zenkert et al. [2].
The discrepancy observed in fatigue life could be directly due to the different batch of materials used in this study and the one conducted by Zenkert et al. [2].
Indeed, as noted on the datasheet [18] and Table 1, the density can vary by ± 10%, leading to similar variations in mechanical properties. As the ASTM and modified tests carried out on this study used the same batch of material, this aspect should not affect the results presented here.
An important aspect of the results is that the specimen’s failure occurs around the fillet area. This failure mode suggests that we do not have a maximum stress located in the midplane. This is shown in Figure 4.
Failures on ASTM specimens.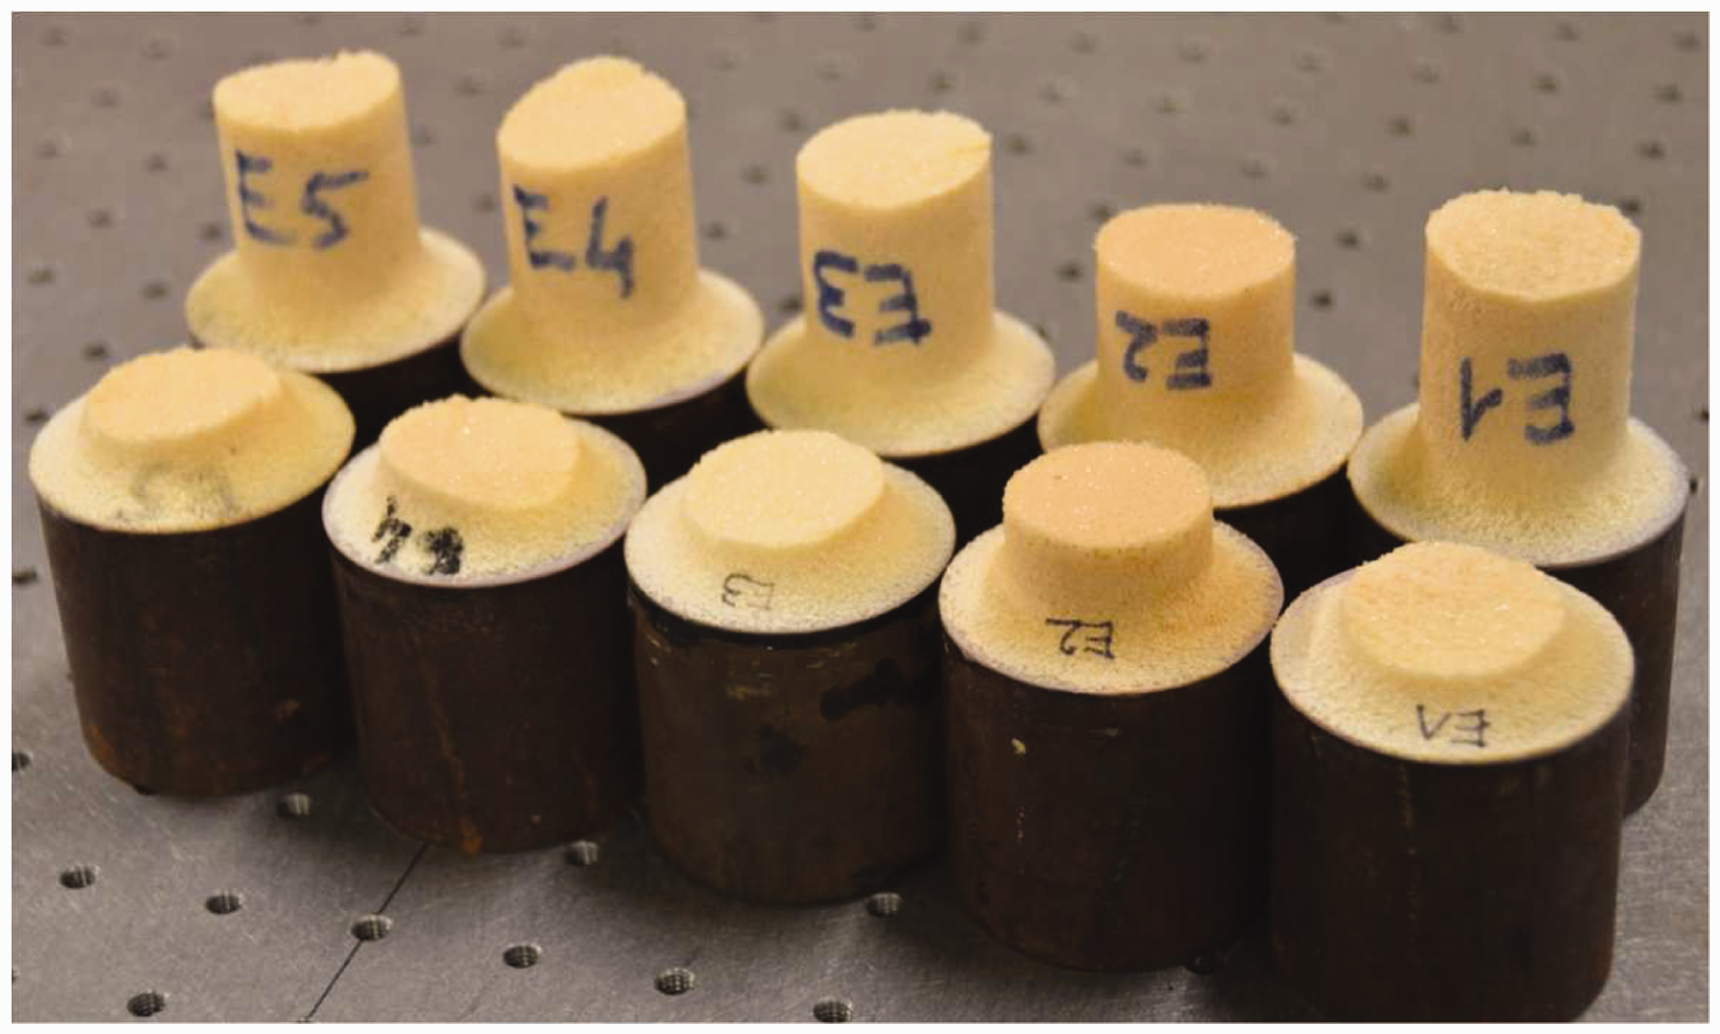
A study of the stress distribution within the ASTM specimen will allow understanding and explain the failures observed during the tests.
Finite element analysis
To calculate the stress applied in the test specimen, we divide the applied load by the cross section of the specimen ( Axisymmetric test model and boundaries conditions.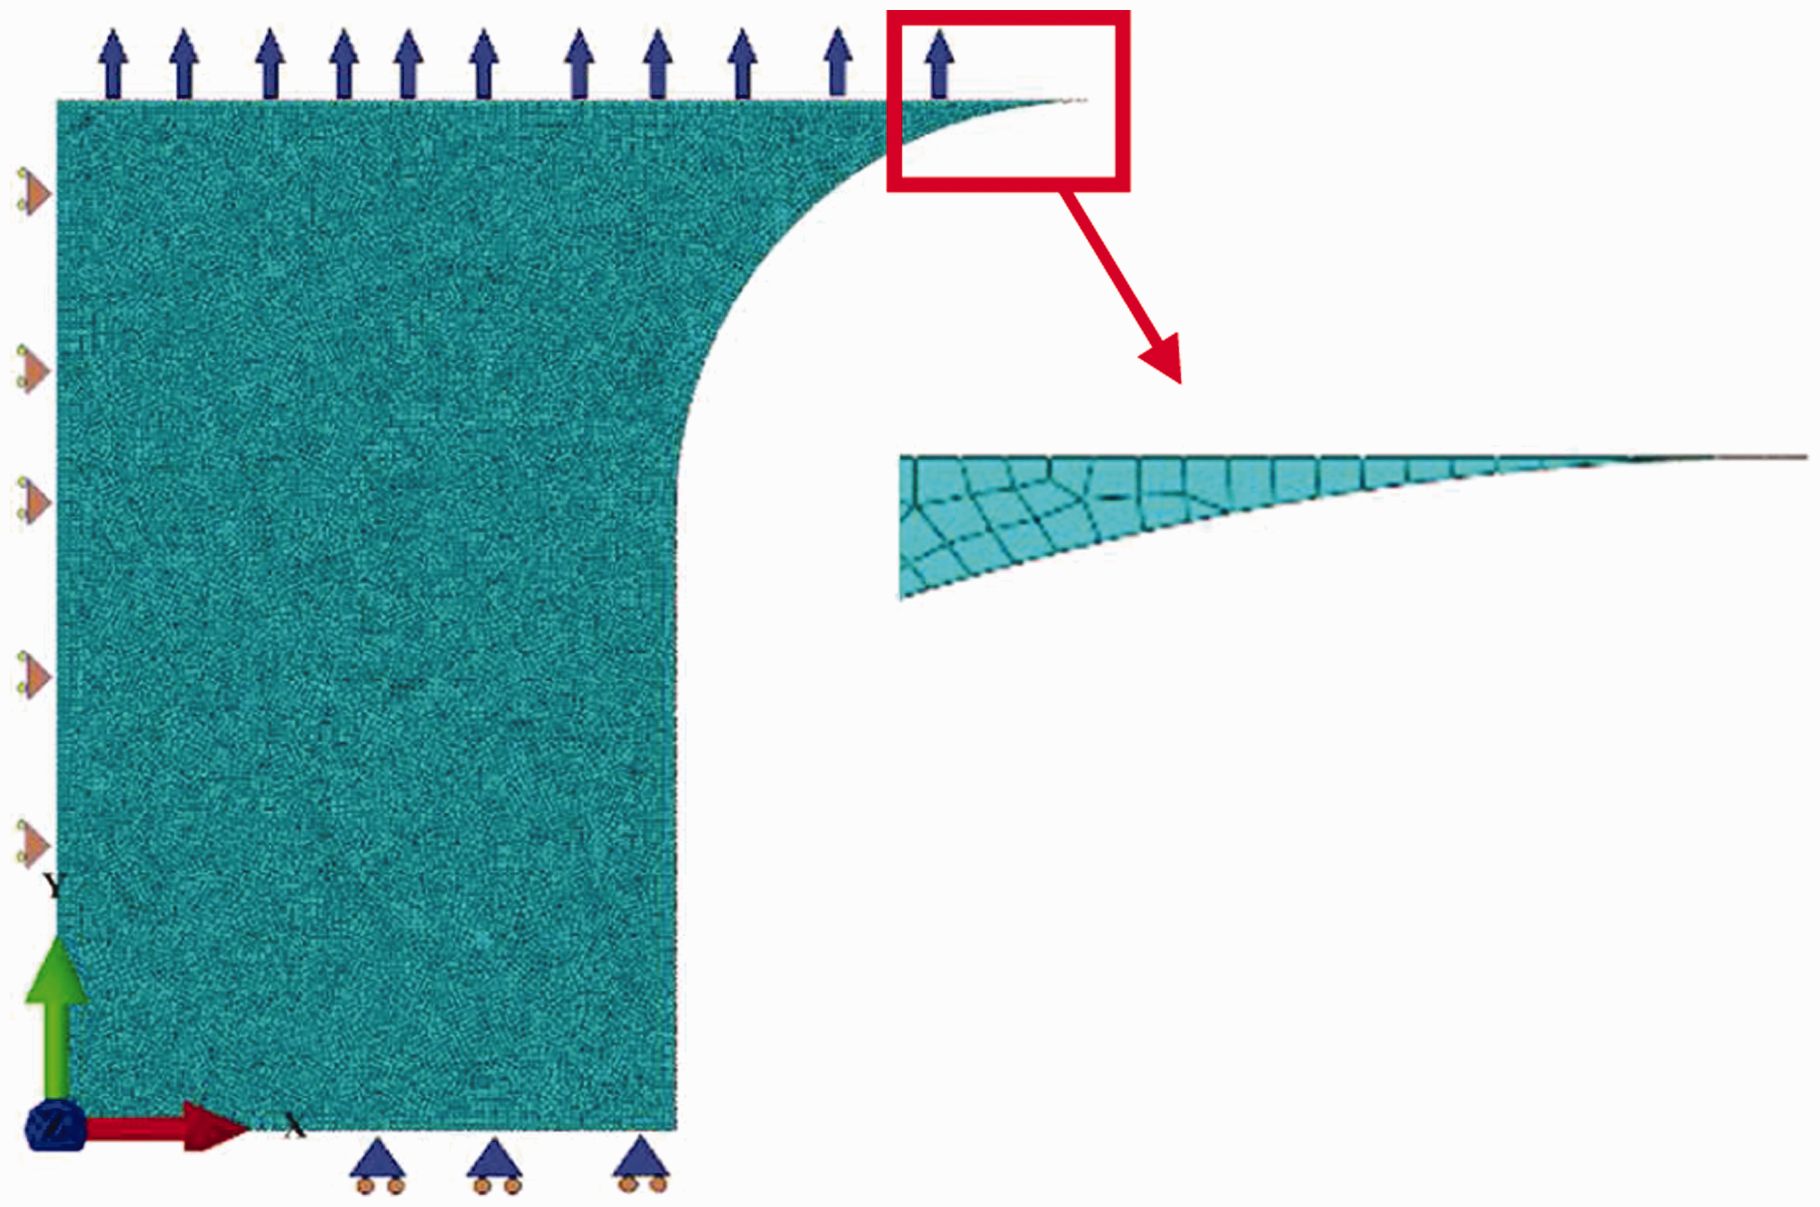
Since the specimen has a circular cross section, modeling is done with an axisymmetric assumption using Quad elements on ABAQUS® and 75,968 elements have been generated. We assume that the material behavior is linear elastic and homogeneous. Boundary conditions are drawn in Figure 5. The Y-displacement is considered as pinned in the median plane and the X-displacement is blocked at the load introduction. The stress imposed on the steel grips depends on the maximum stress as said earlier.
After calculations with an applied load corresponding to the stress multiplied by the section referred to the narrowed area, we can obtain the stress distribution in the specimen. Figure 6 presents the distribution of a: σ11, b: σ22, c: σ33, and d: σ12.
Stress distributions within the specimen subjected to tension (Y direction): (a) σ11, (b) σ22, (c) σ33, and (d) σ12.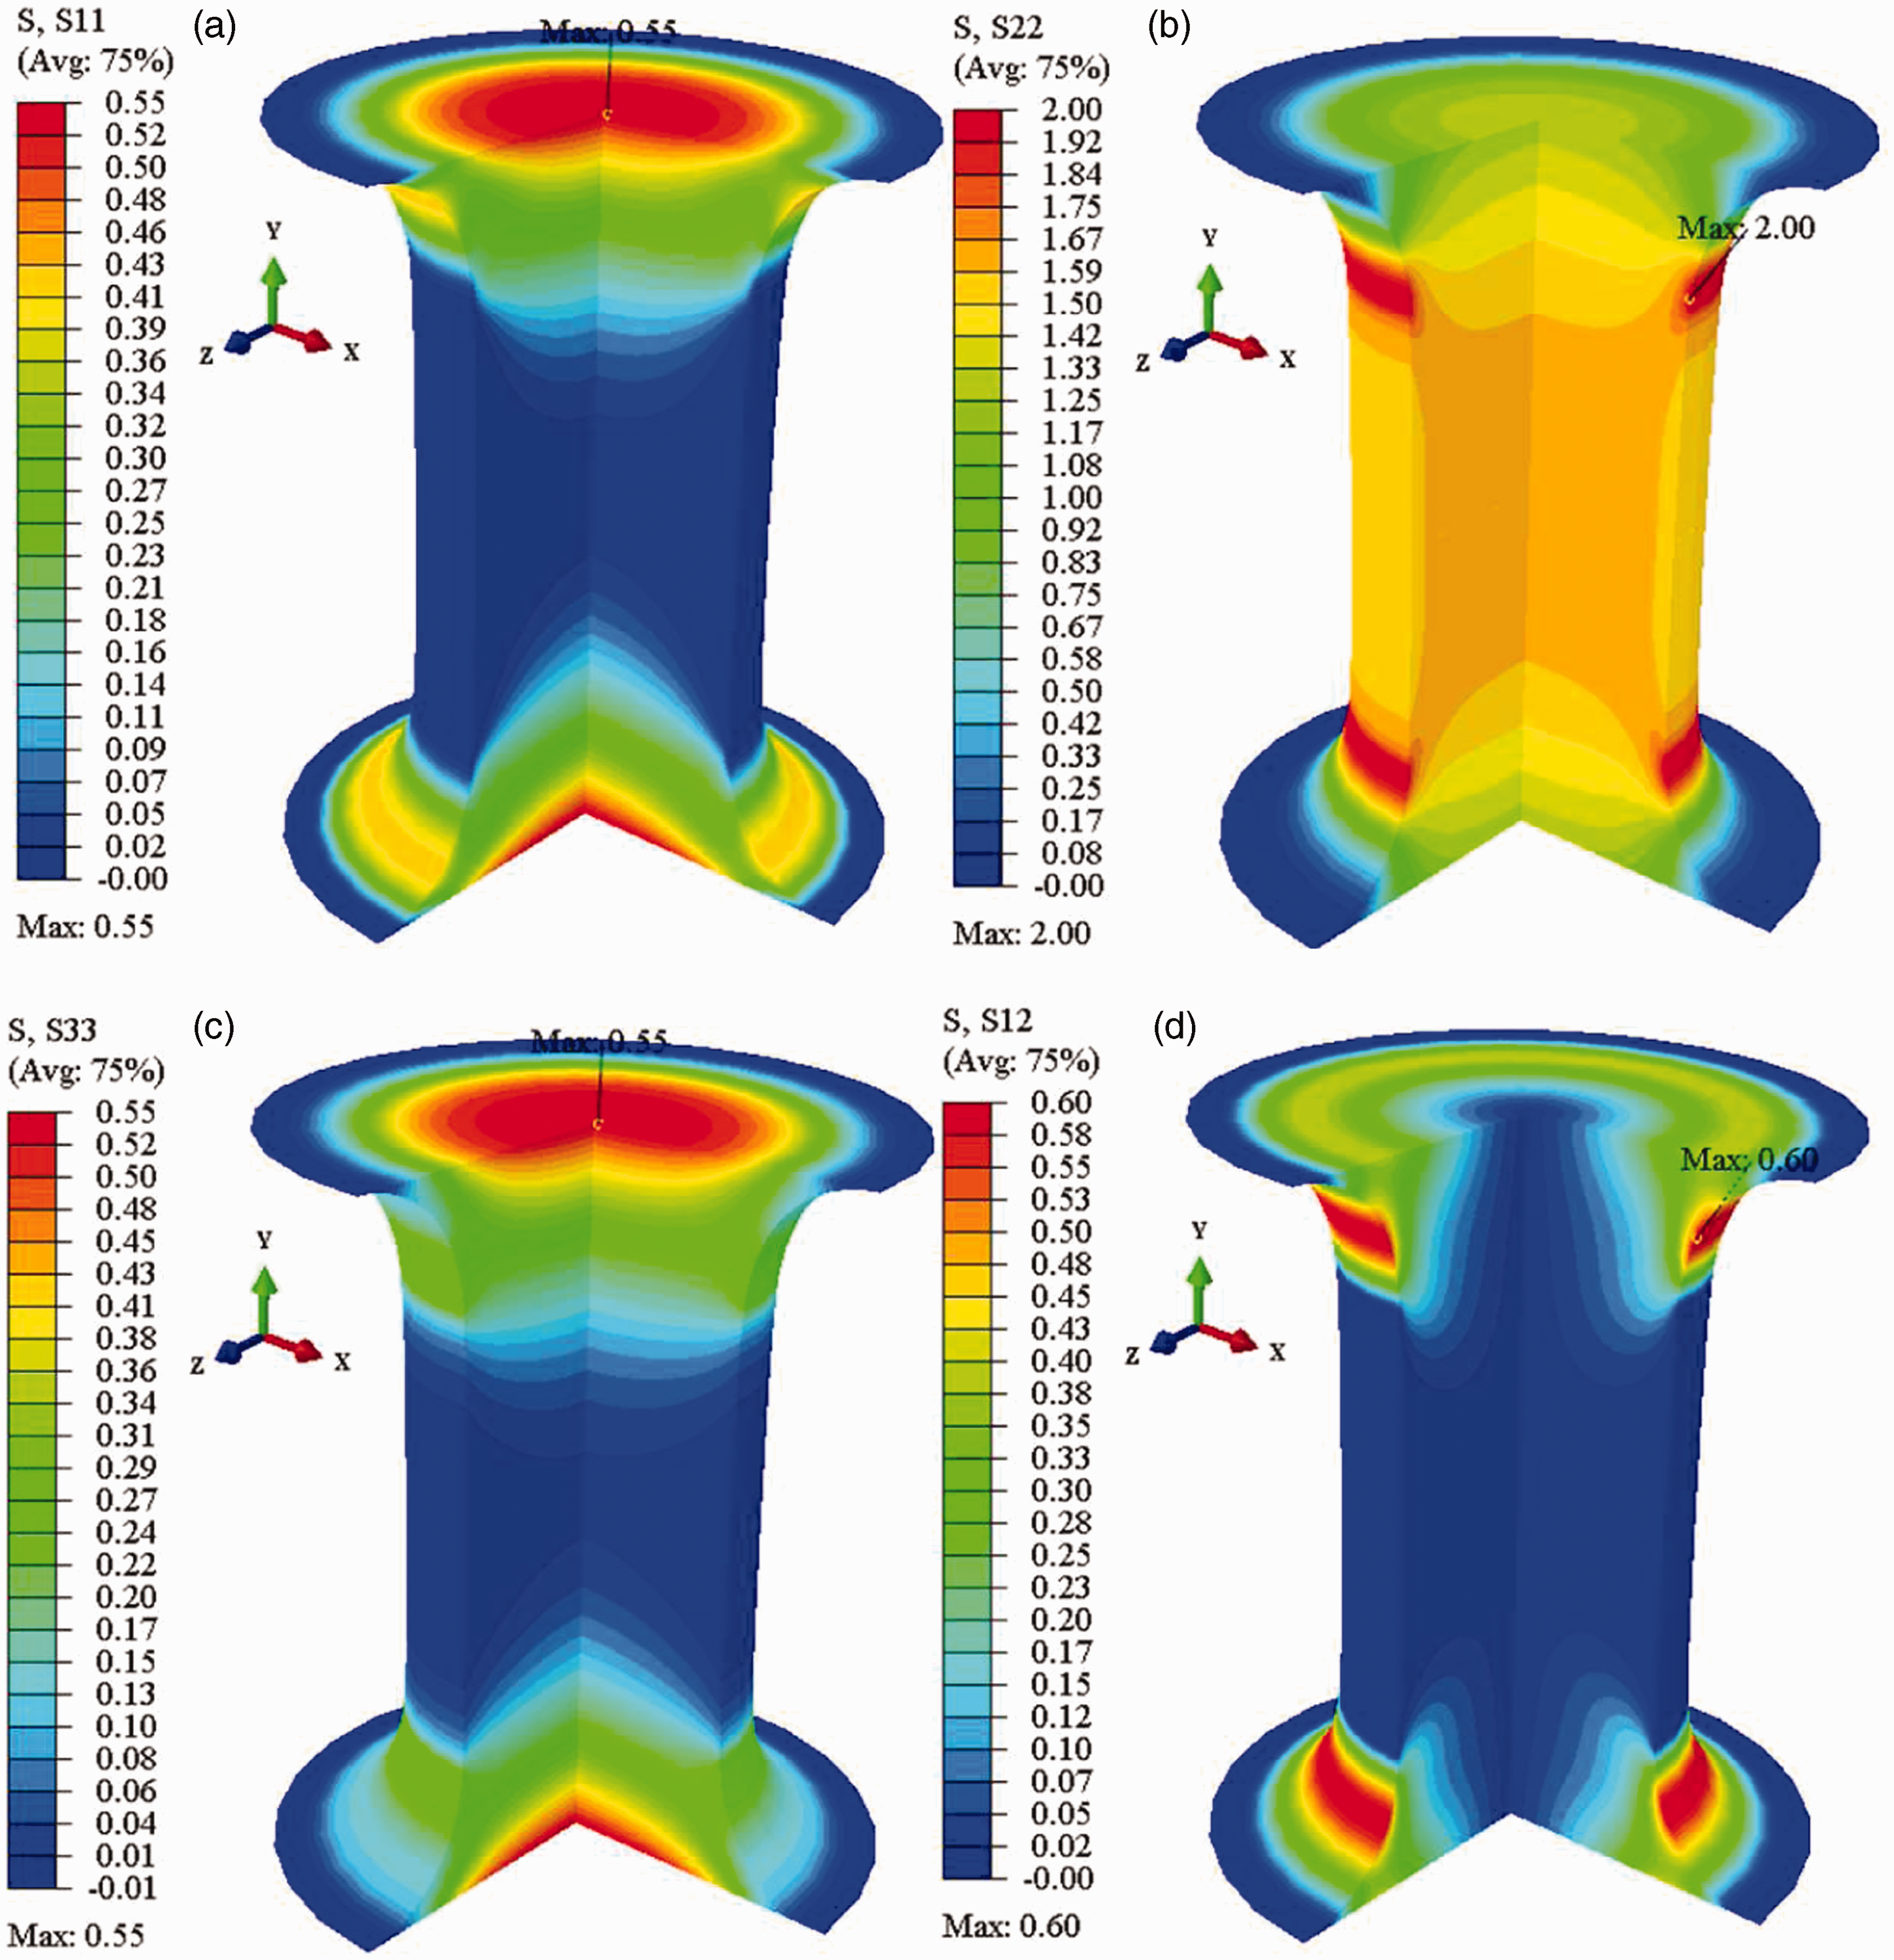
We can observe (Figure 6(b)) at first that the maximum longitudinal stress (σ22) is not located in the midplane as expected, but at the edge in the radius transition, and reveals a much higher value that calculated from the load divided by the cross section (2.0 MPa instead of 1.61 MPa, which means a 17.5% difference). The location of the maximal stress at the edge should lead to an early failure during fatigue tests.
Analysis
Specimens have been tested according to ASTM standard D1623-78 [17] in the present work and in Zenkert et al. [2], and a significant difference appears. Several reasons could explain this discrepancy:
The foam core may have been formulated differently by the manufacturer or the foaming process may have been changed. We do not have any possibility to assess these possible variations, but this leads to the conclusion that this is of primary importance to test a batch of specimens, which represent the exact material to be used if we plan to predict the fatigue strength of a structure. The machining of specimens is certainly different, and thus would require more recommendations for specimen preparation in the standard text. In our case, cells are obviously affected by machining, and this either helps to resist in the areas submitted to stress concentrations, or create onsets speeding up fatigue failure. No specific study has been conducted furthermore to analyze the effect of machining, but the design of our new specimen avoids this possible artifact. The load may have been introduced differently on the testing machine. There are several ways to ensure that the tensile load is applied without any misalignment. Indeed, this could decrease the lifetime of the specimens if there was a misalignment providing a parasitic bending moment. In our tests, caution has been taken to help aligning specimens with the tensile load by using long threads between the machine and the specimen-loading blocks. This may be one of the reasons for a higher strength of our ASTM-based tests.
One of the purposes of this work is to design and implement a new geometry that is able to take into account the edge effects in order to concentrate forces at the center of the specimen and have a good characterization of the PVC foam.
Development of the new testing method
Geometrical conception
To verify whether edge effects have an effect on fatigue life, a new geometry has been developed to initiate a controlled, concentrated stresses at the center rather than at the edges of the foam specimen.
We opted for a simple cylindrical geometry for the foam specimen. This type of geometry is simple to cut and will make a campaign with a lot of specimens cost-effective to produce.
In our test, the major change involves the steel grips, which are designed to deform themselves in a controlled manner.
The deformation continuity between the grips and the foam specimen is optimized in order to apply a stress field with no edge effects (Figure 7).
(a) Dimension of our developed testing method: global view (left), zoom at the edge of the loading block (right) and (b) mesh definition.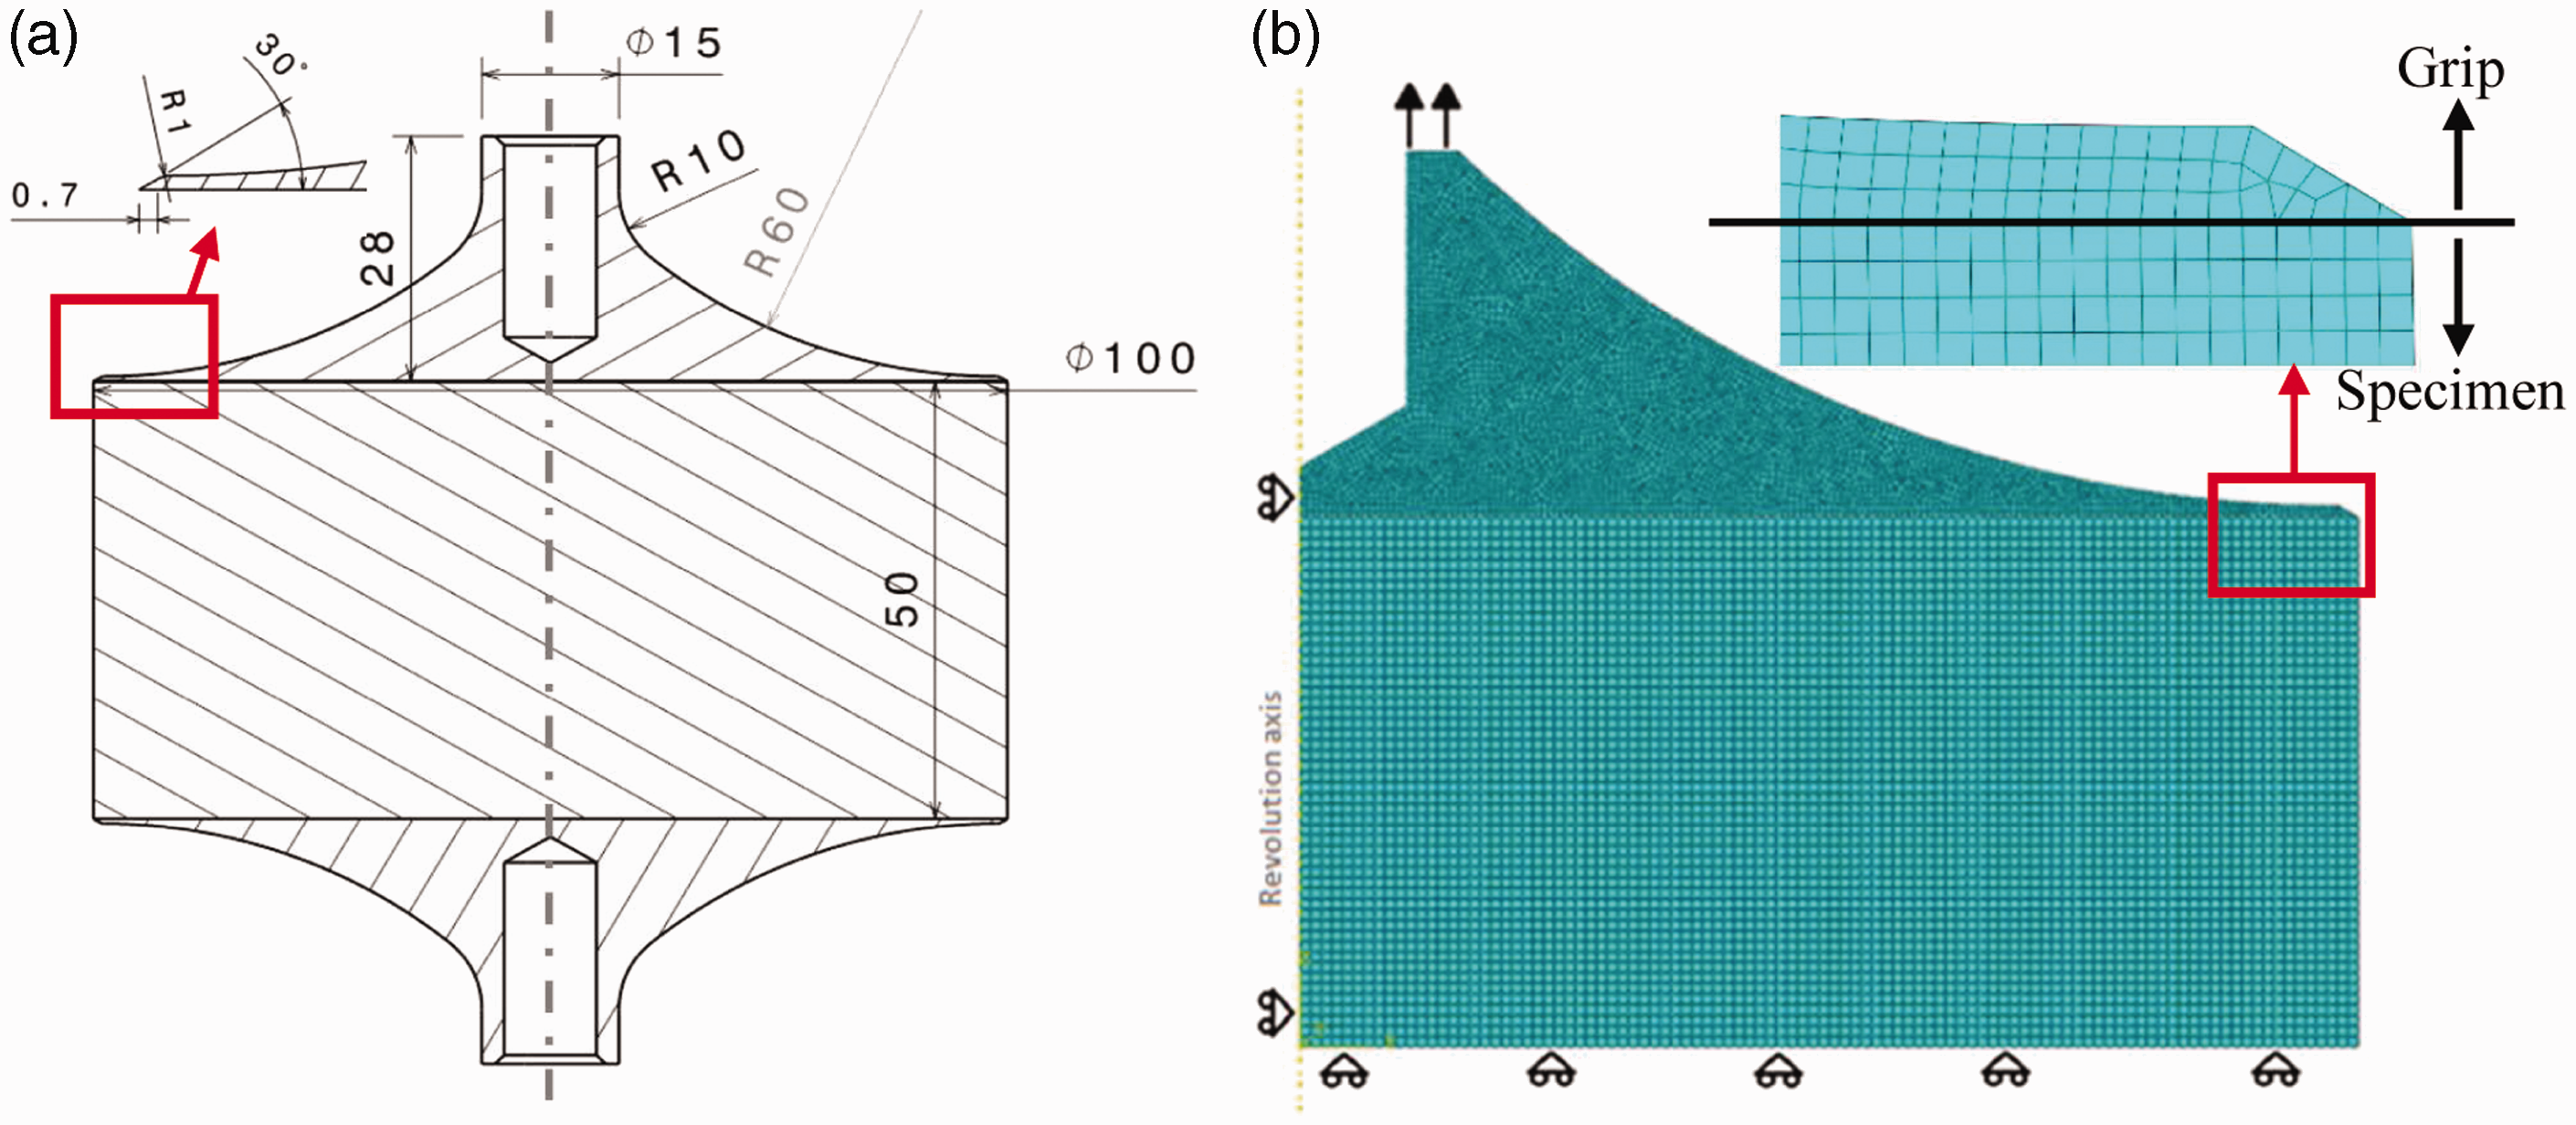
In order to avoid any failure of the loading blocks themselves, we choose a high-strength steel having 800 MPa yield strength and optimize the shape to stress the loading block below one third of its elastic limit (corresponding to an infinite lifetime) when the foam specimen is tested in fatigue.
The numerical model includes both the specimen and the loading blocks, as done in the study of the ASTM geometry, we have chosen an axisymmetric simplification.
Due to the sharpness of the loading block, the greater size of the specimen compared to the ASTM geometry and the great deformation of the specimen near the edges, it is compulsory to increase the number of elements to get a mesh convergence. The mesh presents up to 31,250 elements in the loading block and 9018 elements in the foam specimen. These numbers of elements allow a sufficient precision of the analysis (Figure 7).
Figure 8 gives the simulation results of stress distribution: (a) σ11, (b) σ22, (c) σ33, and (d) σ12. We can note that the maximum longitudinal stress (1.61 MPa) is localized in the specimen’s center (Figure 8(b)).
Stress distributions: (a) σ11, (b) σ22, (c) σ33, and (d) σ12.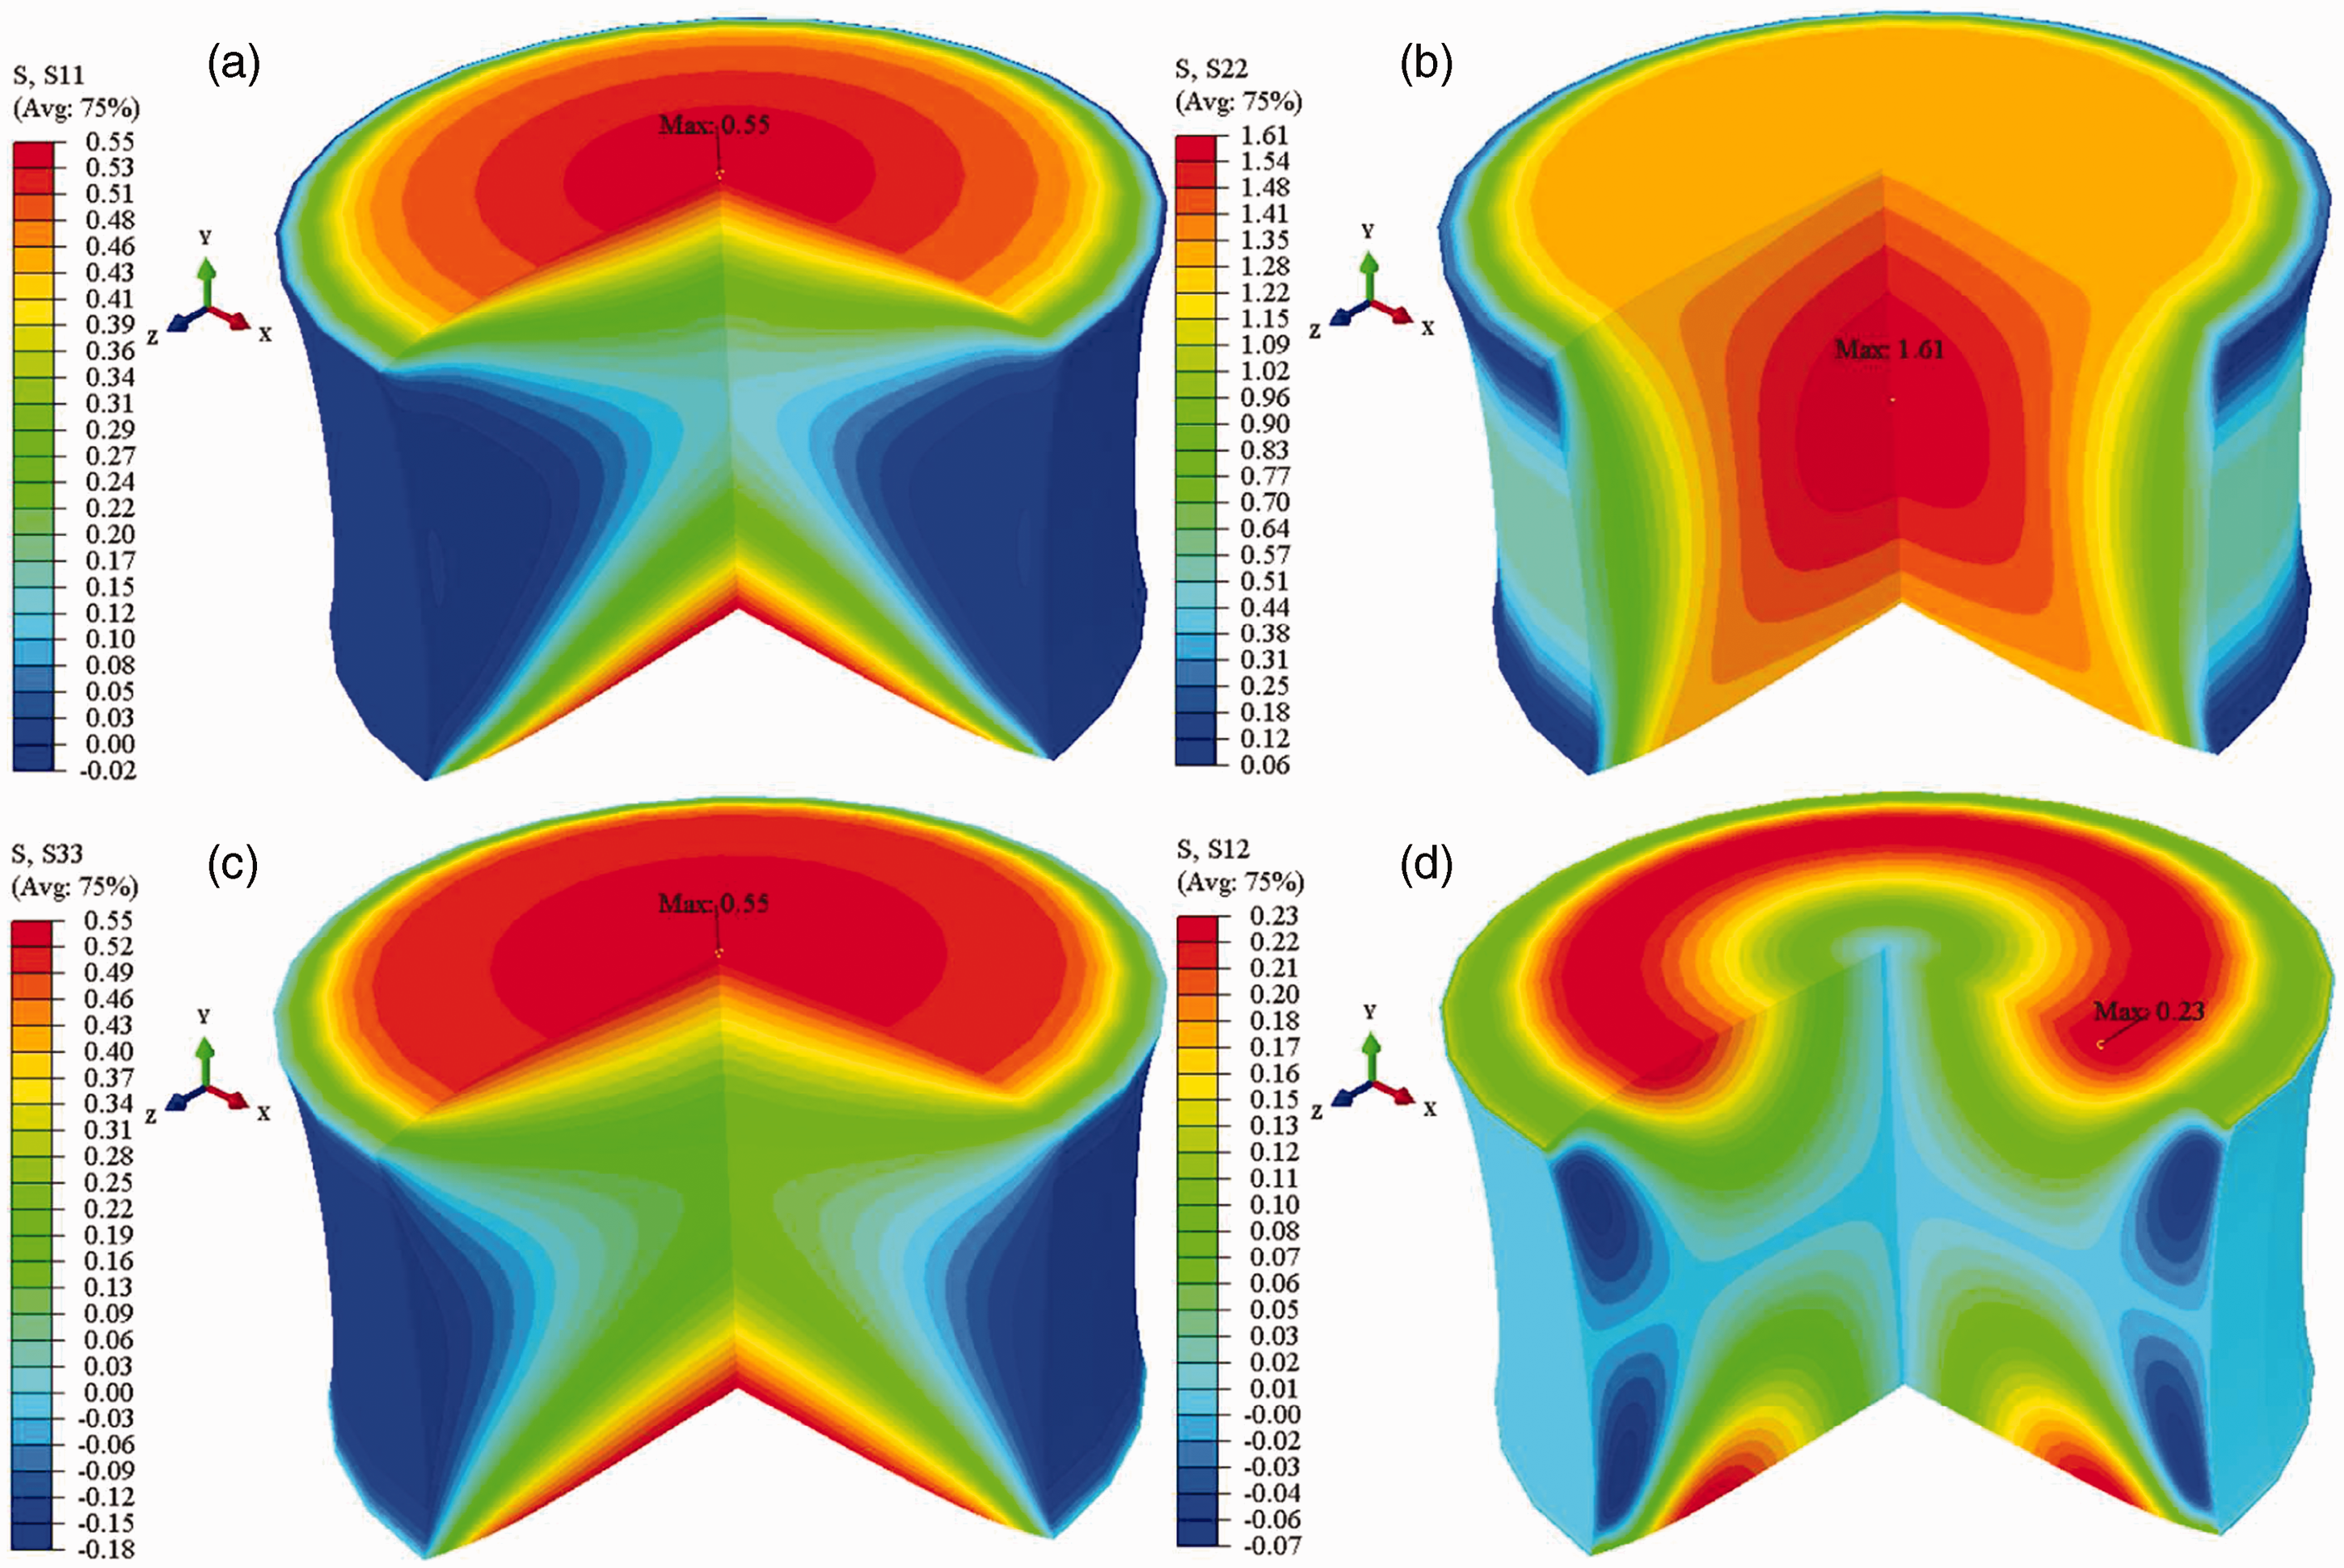
To quantify, the edge effect reduction from our new test method, we can compare the stress distribution at median plane within the ASTM specimen and our developed method (Figure 9).
Stress distribution comparison along the X-axis.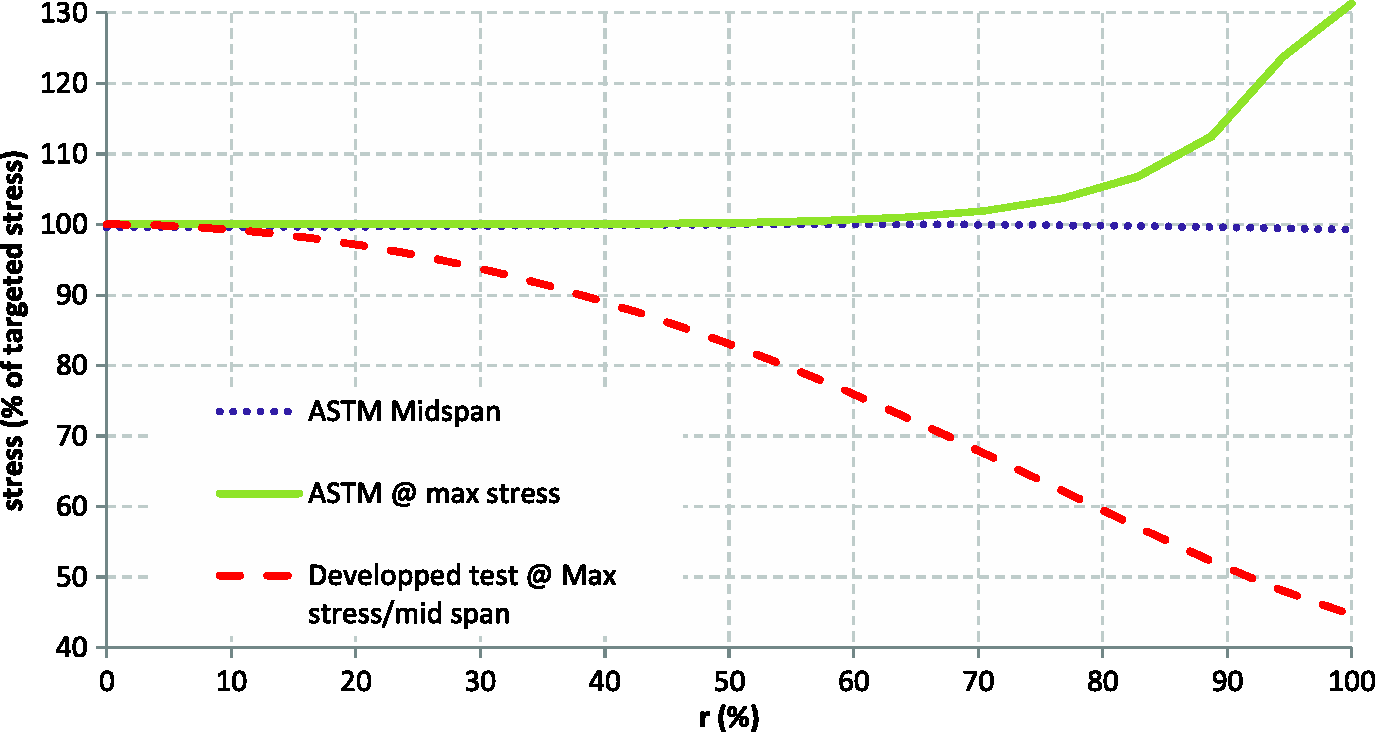
The assumed stress ratio is constant in the ASTM standard. The dotted line (Figure 9) shows that indeed, it is almost constant at midplane, but if we plot the stress distribution at maximum stress, we can see that the stress increase rapidly toward the edge to reach 130% of the assumed stress.
With the new specimen geometry (in dashed line), the tensile stress achieves exactly the aimed stress level at the center, and is reduced by 60% at the edges.
Results
As done previously during our ASTM geometry tests, the new test geometry is tested at a maximum stress level corresponding to 1E5 cycles, using the Basquin’s law defined in [2], i.e., 1.61 MPa.
We test five specimens, at 5 Hz with an R coefficient of 0.1.
Furthermore, the displacement is measured by a laser-based sensor and tests are carried at room temperature with ambient temperature recorded during the entire test as well as the temperature at the surface of the specimen.
Presented in Figures 10 and 11 are the fatigue lifes using the ASTM geometry and our developed test method. We can see that the tests using the new method show a fatigue life 2.4 times higher than the one obtained with the ASTM geometry.
Fatigue life (cycles), comparison between the different methods (graphic visualization). S–N curve, comparison between Zenkert’s results our results with the ASTM geometry and with the developed geometry.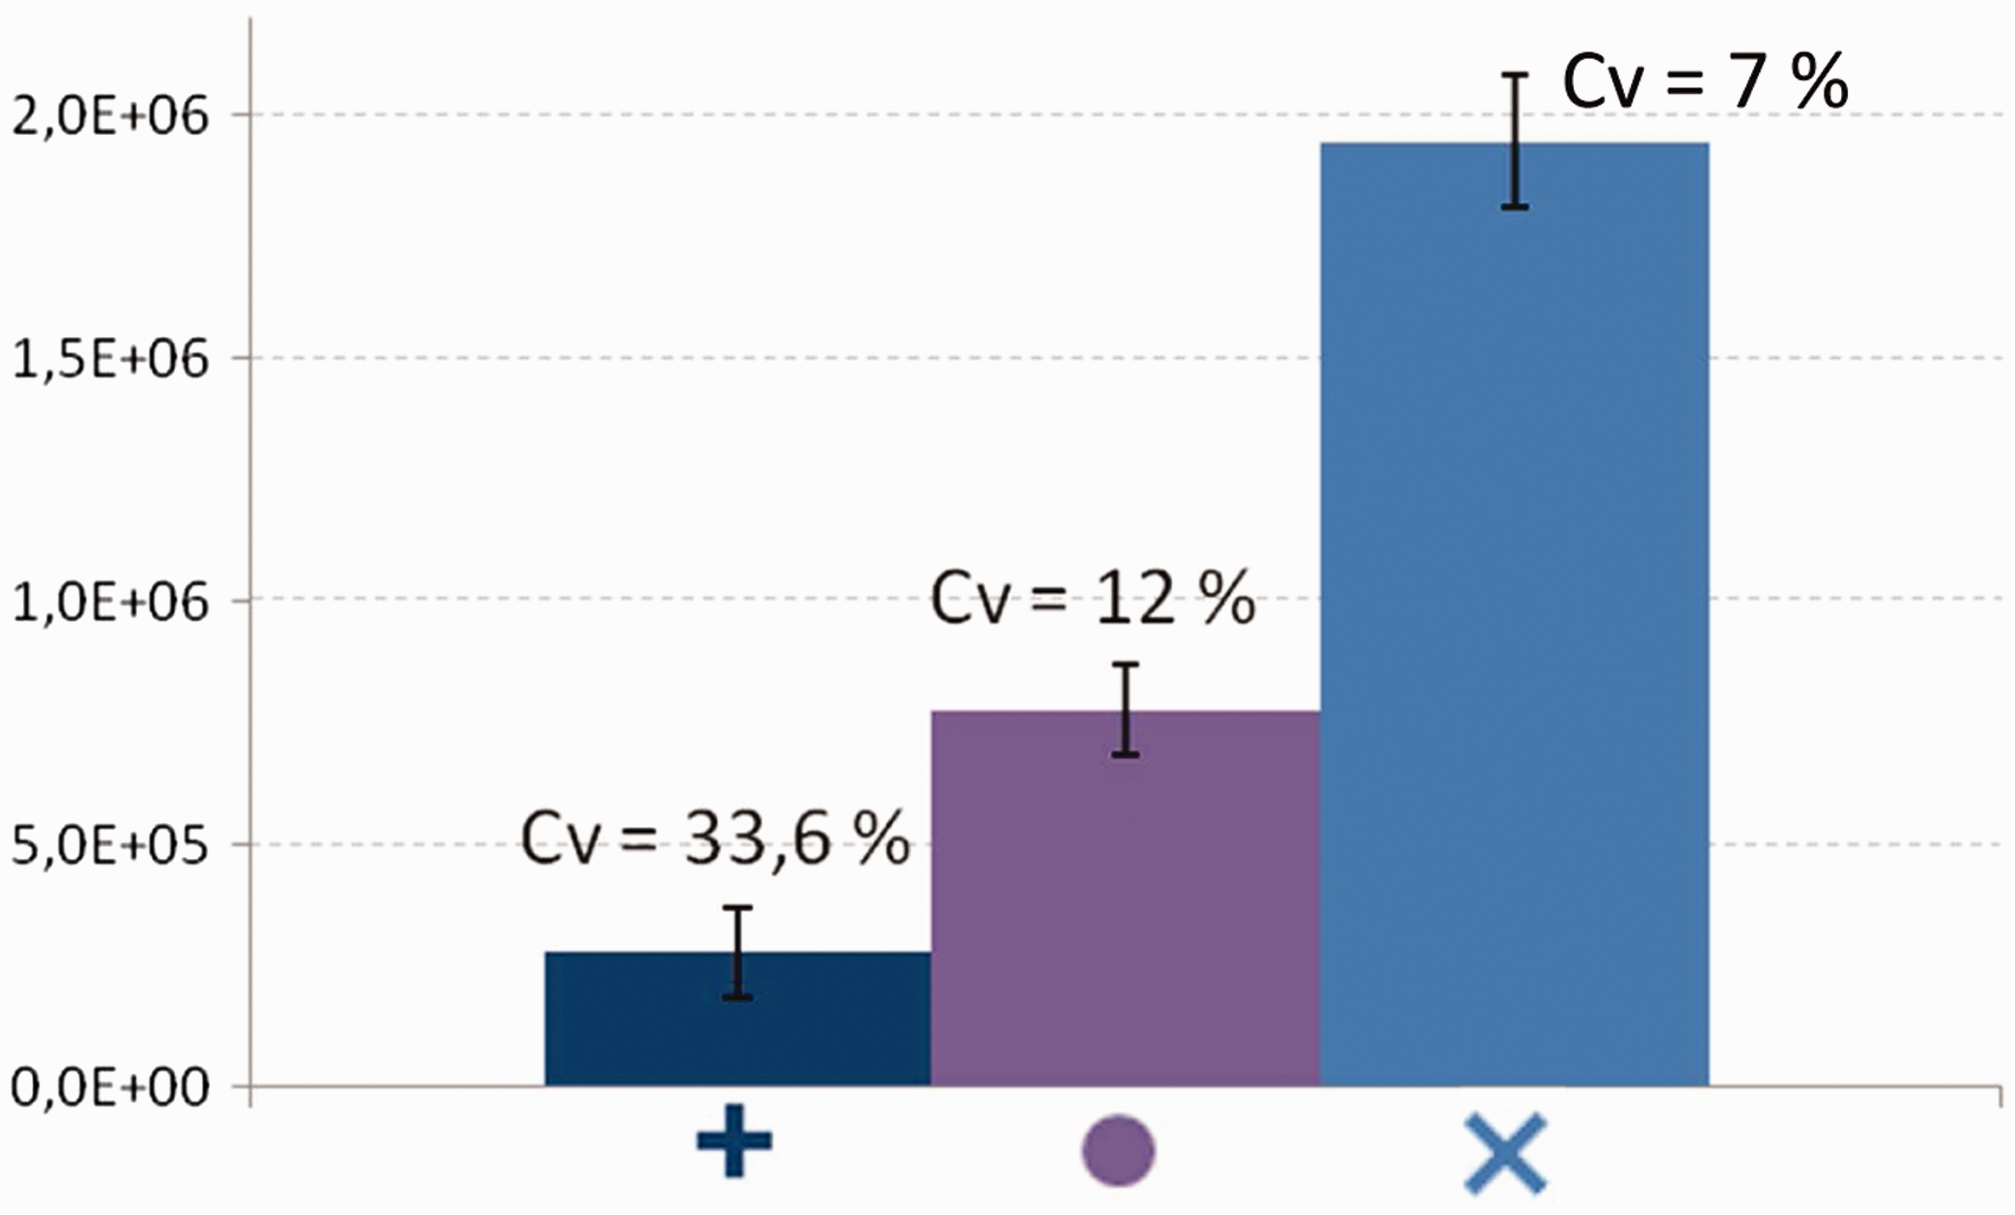
In addition to the enhanced fatigue life, the coefficient of variation with the new test method is lower, 7% compared to 12% or even 34% with the standard geometry.
Moreover, one of the key results showing the necessity to change the way foams are tested is the failure of the tested samples. In fatigue characterization, it is important to be sure that the failure that occurs is representative of the fatigue of the material tested and does not come from diverse edge effects.
A suitable failure is made to occur in the gage area. The ASTM geometry tries to make the failure occur in the gauge area by reducing the cross section of the sample.
However, this section reduction is not efficient enough as the maximum stress is located in the edge of the fillet region.
One of the aims for our new testing method is to make the sample break as close as possible to the middle of the sample to be as far as possible of the loading blocks.
If we compare failure between the two testing methods (Figure 12), it shows that the new test specimens break at the midplane unlike the ASTM specimens which break in the fillet region.
Break area comparison. (a) Failure in the ASTM specimen and (b) failure in the developed specimen.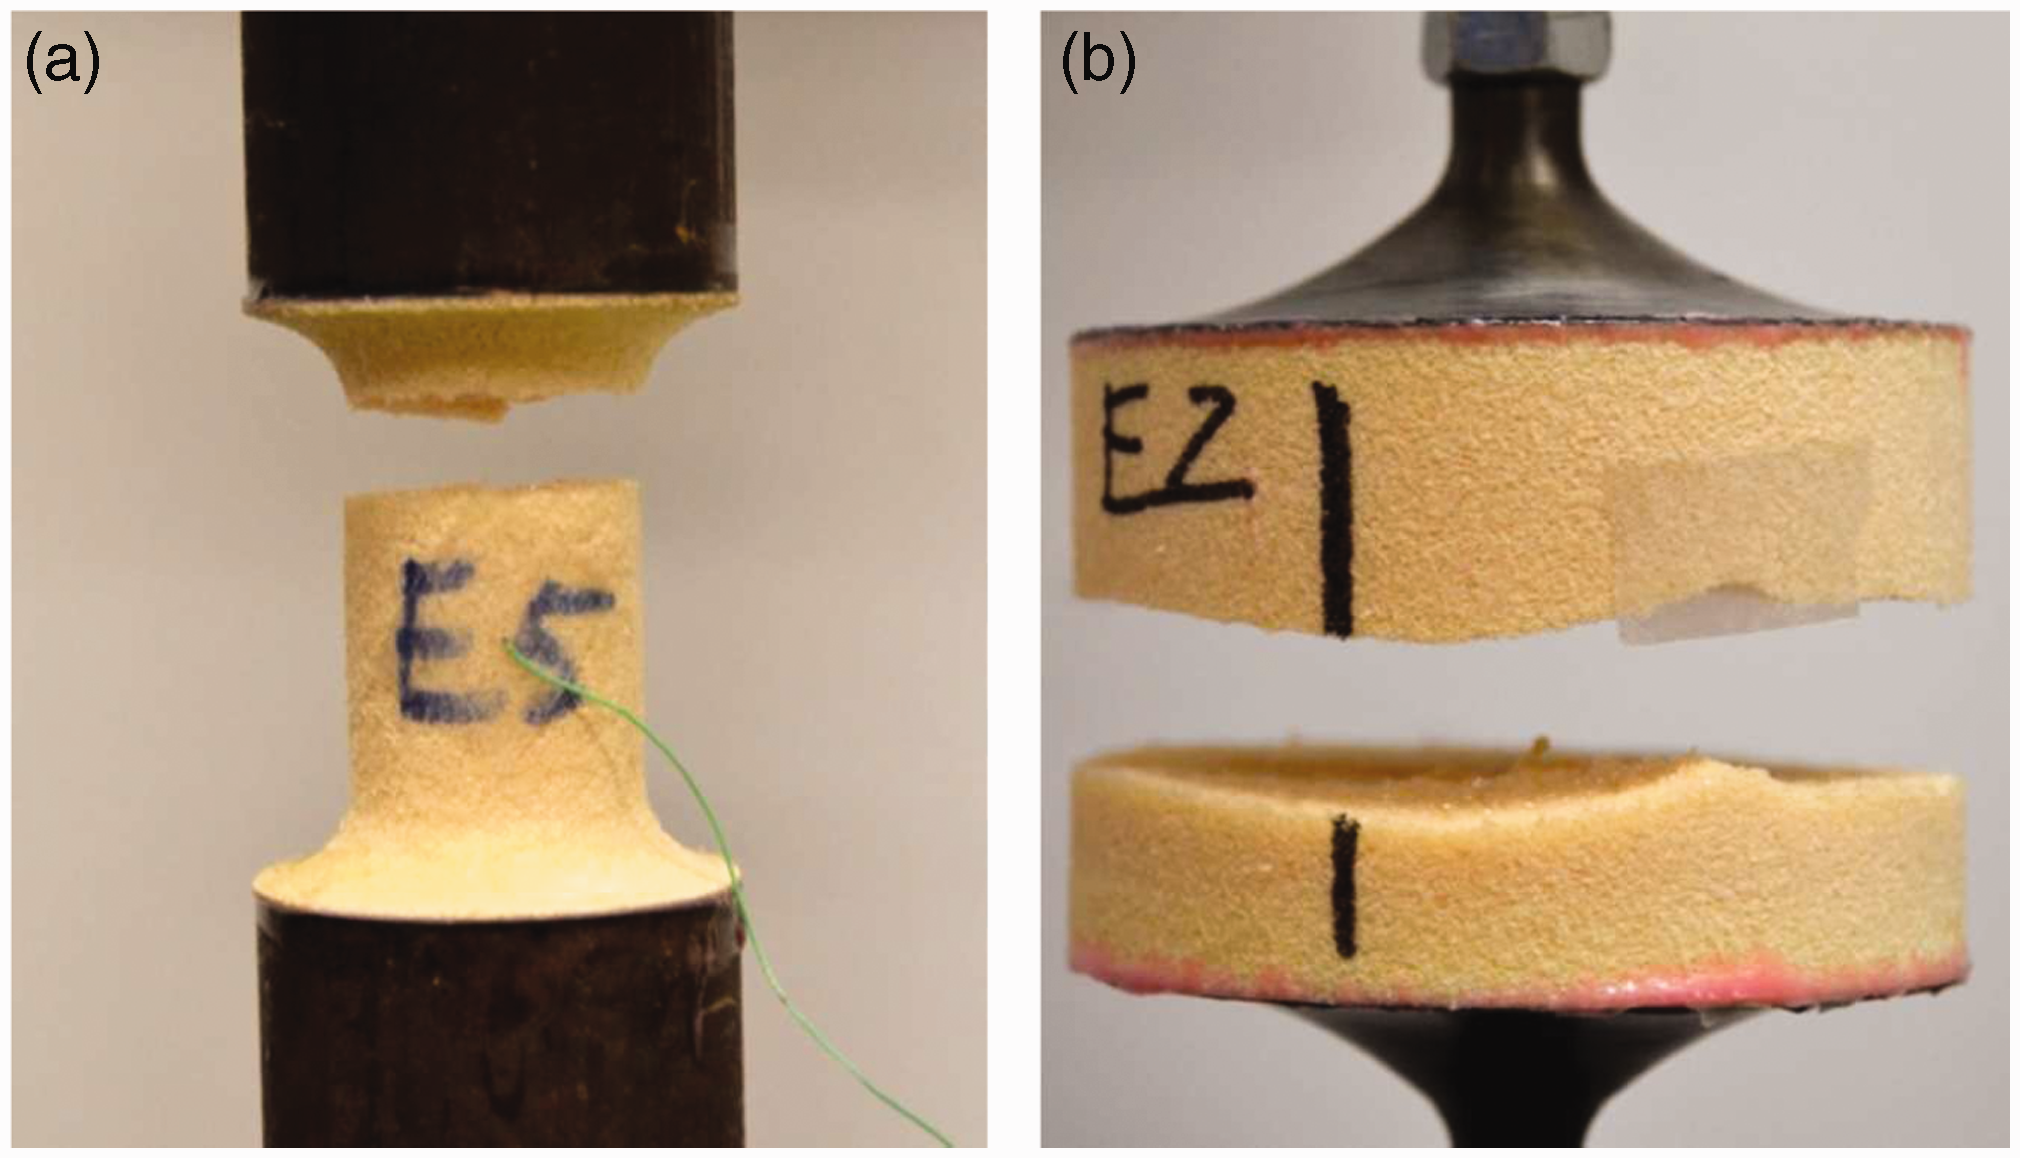
Finally, in order to check that our numerical model is equivalent to the experimental work, we can plot the applied force versus the specimen displacement.
In Figure 13, we can see that the two approaches (experimental and numerical) match. This confirms that we have the correct mechanical properties in our model and that the stress displayed in this model is as applied in the specimen during the tests.
Force/displacement—experimental and numerical comparison.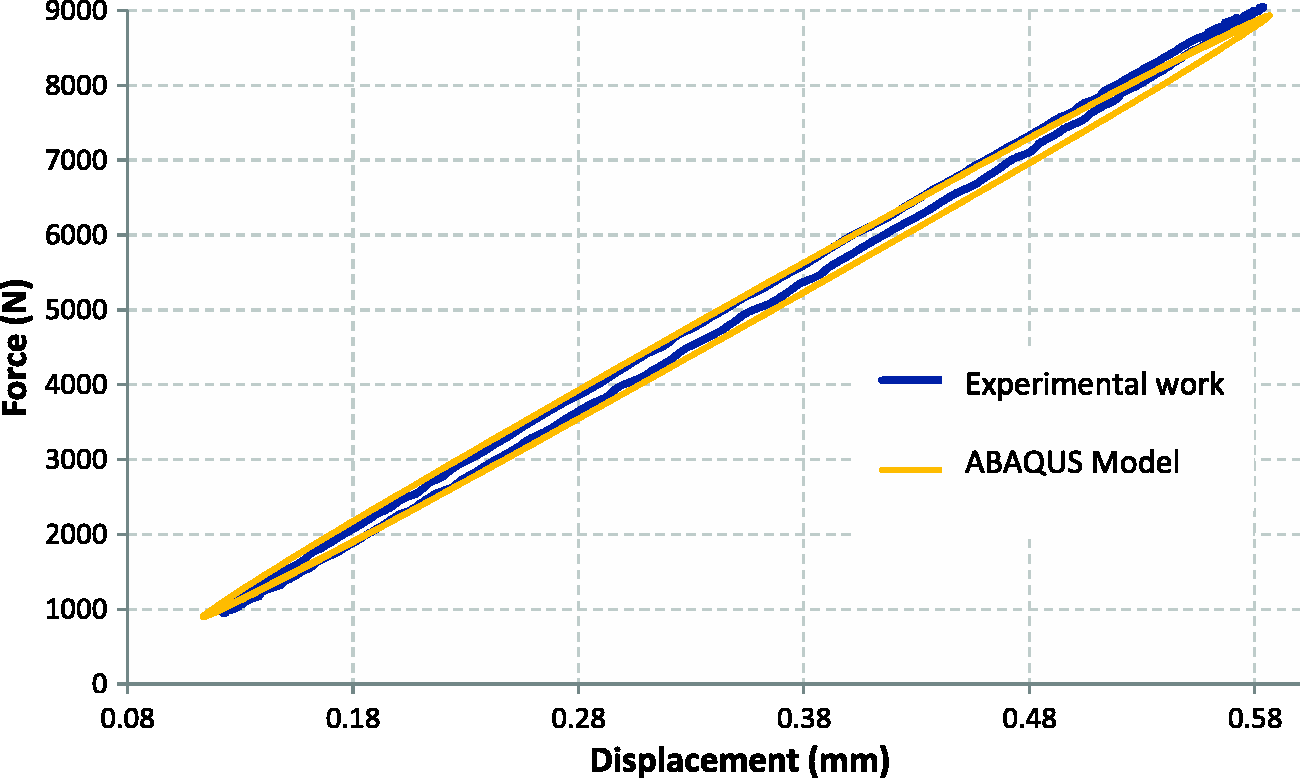
Conclusions and perspectives
In general test, results are affected in some ways by the test setup, because it induces stress concentrations.
When these stress concentrations are not quantified and close to the edge of the test sample, the results can lead to a specimen-based material property rather than an intrinsic property. Testing standards generally aim at developing test setups that eliminate these stress concentrations, but it is not always possible.
Instead, one can aim to control the stress concentration so as to be able to quantify it. In our case, we were interested in the fact that fatigue failure can be affected by local modifications to the material macro structure (cell scale) at the edges of the sample.
After analyzing and testing ASTM standard specimens, we chose to develop a new test as the actual test specimen was showing stress concentration at edges.
The presence of stress concentration at the edges of the dog bone–shaped specimen would be affected by the effects of a modification of the material properties or foam cells deterioration due to sample machining, these local modifications are likely to be very variable in nature, hence the introduction of the variability in the previous results.
Through the use of design tools, calculations, and processing, we have designed a test able to load the material studied by limiting stresses on the edges of the specimen. The absence of free edges in real structure such as a boat justifies the need to characterize the fatigue of core material without introducing additional edge effects.
Tests from the new geometry exhibit a significant increase in fatigue strength and a reduced variation.
In ASTM tests, failure occurs very often at the location of the stress concentration, but not in the middle of the specimen where stress is assumed to be homogeneous. For the new test, failure occurs systematically close to the midplane of the specimen, ensuring a repeatable response of the test. The coefficient of variation measured from the new test is 7% versus 12% for the ASTM test, this lower level of variation is another improvement of the specimen geometry. Based on this first design that uses loading blocks avoiding stress concentrations at the edge, a much higher fatigue lifetime has been predicted. These results demonstrate that the standard tests do not provide accurate material fatigue properties. The value obtained from ASTM standard becomes more a specimen-based fatigue life rather than the actual material’s fatigue life.
The differences indicate that it is important in the evaluation of the fatigue life of a material, to limit edge effects in the specimen.
In addition, through the instrumentation of our test using thermocouples, we have highlighted heat dissipation during fatigue testing and an interdependence of the mechanical behavior with the thermal behavior of the material. This behavior will be treated in a following publication.
In order to test if this new result is more representative from the actual fatigue life in real structures, some more tests with various foam core densities and stress levels will have to be conducted, but the difference is already noticeable.
Footnotes
Declaration of Conflicting Interests
The author(s) declared no potential conflicts of interest with respect to the research, authorship, and/or publication of this article.
Funding
The author(s) received no financial support for the research, authorship, and/or publication of this article.