
Abstract
This paper presents the experimental behavior of low-energy impact and quasi-static compression test of shifted-tri-axial structural wood-fiber-based composite panels made from laminated paper. The experimental results were analyzed based on design parameters and configurations of panels for the further design and optimization. The results showed that the face stiffness and strength was a significant factor to improve both impact performance and compressive performance. The panels made with additional carbon fiber fabric composite faces had higher energy absorption compared with the same panels made without it. The core configuration also affected the impact behavior of the panels, the foam filled core integrated with the shifted-tri-axial rib structure improved the impact load and absorbed more energy than the same panels without the foam. Further, the structure and size of the element in the core influenced the impact performance and energy absorption. The location for both compression and impact at the triangular lattice element center of the ribs had higher absorbed energy than the location at the hexagonal lattice element center of the ribs. A 3D contour surface map of maximum energy absorption was made based on the experimental data, the contour shows localized energy absorption based on the impact location on the core, the small triangular lattice element of the core had highest maximum energy absorption of panels. For both the quasi-static compression tests and the low-velocity impact tests, the panels with the same core configuration had similar compressive load–displacement trends during the early contact phase. However, the peak load was higher in compression than the peak load for the low-velocity impact for panels with the same configuration.
Keywords
Introduction
Sandwich structures assembled with stiff faces and a lightweight structural core are commonly used for a variety of applications including building, transportation, aircraft, marine, packaging, and furniture [1–7]. The type of core components has many options such as honeycomb, foam, corrugate, truss, grid, lattice, and each type provides different characteristics and properties that can sufficiently achieve specific requirements for various applications. Currently, an interlocking grid structural system offering high stiffness is used to fabricate sandwich structures [8]. This type of interlocking grids uses a linear rib system that has one set of ribs with single slots from one edge of the rib and a second set of ribs with double slots from both edges. The slots on one side of the double slot ribs were shifted to create a combination of triangles and hexagon grid elements (Figure 1). The design of the interlocking grid structure is very flexible that can be used to construct various grid structural patterns such as isosceles triangular, rectangular, hexagonal or mixed structures [9–12]. The flexible nature of the rib design can be used to better resist stresses for multidirectional loadings. Ribs oriented in 60° directions have been used to sufficiently meet initial load criterion [13]. Recently, shifted-tri-axial structure attracted researchers’ interest, the static mechanical properties of the shifted-tri-axial core structure were widely studied by compression, tension, and bending tests [14]. This structure transversely shifts one set of longitudinal ribs a half-length from the triangular geometry in tri-axial structure to create the shifted-tri-axial ribbed structure. Both the hexagonal and triangular elements in this structure may provide different characteristics compared with just the triangular tri-axial core structure. The low-velocity impact damage and response of these shifted-tri-axial sandwich structures have not been investigated.
The design and configurations of shifted tri-axial engineered core, (a) single-sided rib inserted from one side, also showing potential of foam in-fill; (b) shifted-tri-axial core with faces. Notice the smaller triangular rib areas and hexagonal rib areas.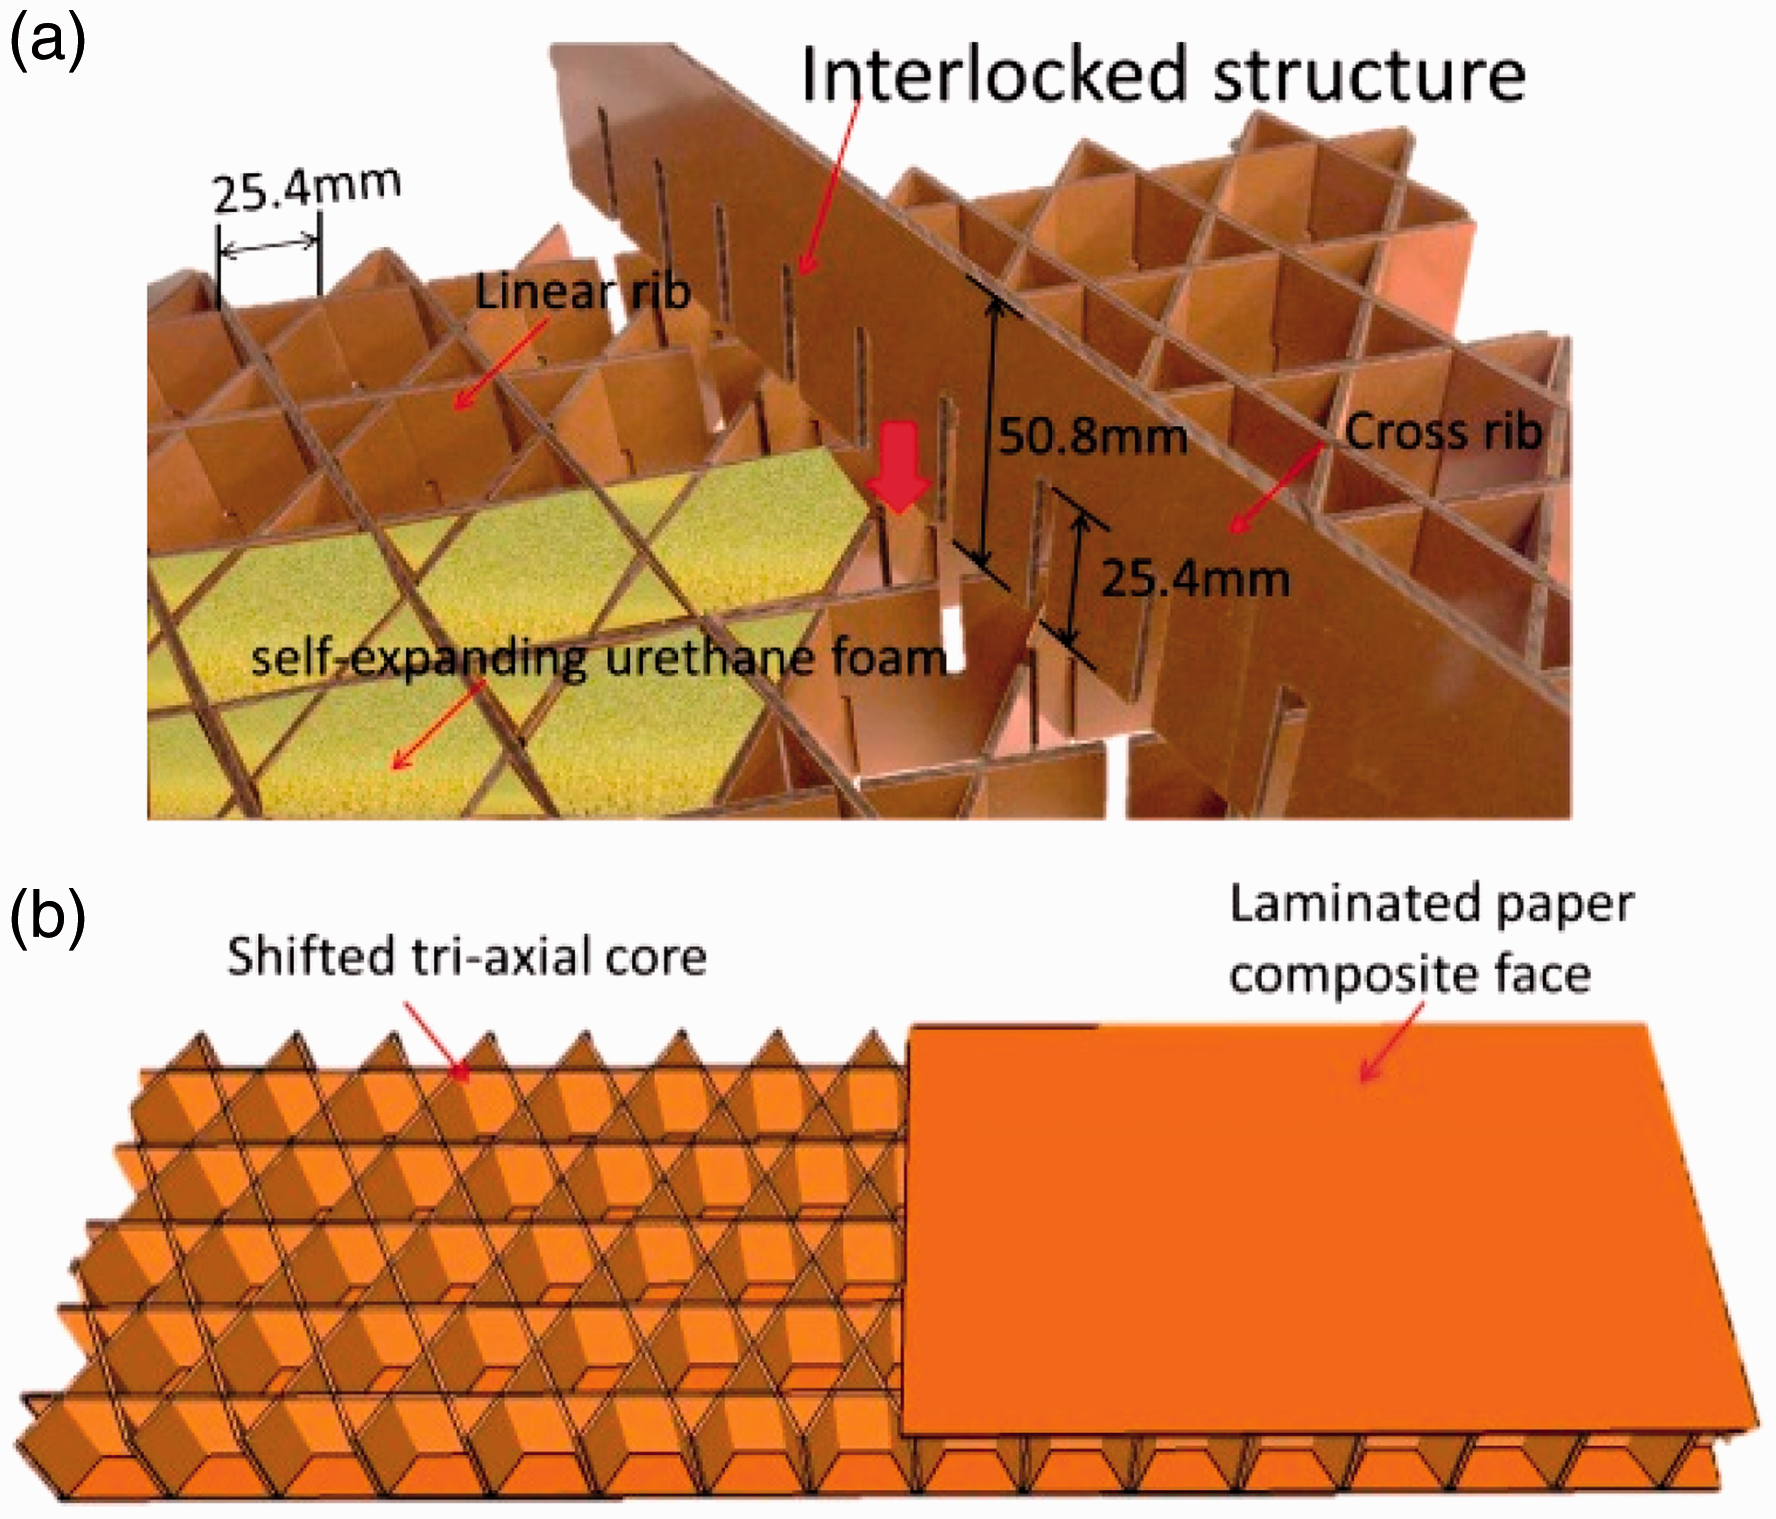
Low-velocity impact is a common phenomenon found in many applications where it could cause different types of damage and could significantly affect the performance of the structure. Therefore, understanding of low-velocity impact behavior for sandwich structures is extremely important, especially, for some high demanding applications where there is a need to be tested and certified to perform without critical damage [15]. Recently, the low-velocity impact behavior of a sandwich structure with isogrid stiffened syntactic foam core was investigated [16]. The results showed that the structural configuration significantly improved the impact performance. The proposed triangular cells had better impact capacity than the traditional laminated composites [16].
New research at the United States Department of Agriculture (USDA), Forest Products Laboratory (FPL) is being conducted to develop an eco-friendly tri-axial isogrid core structural panel made using phenolic impregnated laminated paper composite material. Initially this research was to find alternative sustainable materials to substitute an aluminum faced and nomex honeycomb core panel structure. Requirements such as high strength, light weight, water, and fire resistance were included in the design parameters. Thus, these bio-based structural materials could be reconfigured and designed for building construction, transportation, packaging, or container-like applications. A previous study investigated the static mechanical properties and fatigue performance. The results indicated that this type of structural panel had better mechanical performance than the traditional honeycomb structural panels [11, 17, 18]. However, the low-velocity impact performance is also a key behavior that could be a critical property for some composite panels, thus should be investigated.
This paper presents an experimental investigation of impact and compressive behavior for shifted-tri-axial wood-fiber-based engineered structural panels with different configurations. Low-velocity impact test and quasi-static compression test were used to compare and analyze the load and energy absorption characteristics using different thicknesses face components, different face materials and different core configurations.
Experimental investigations
Material properties
Materials’ properties for tri-axial structural panel.
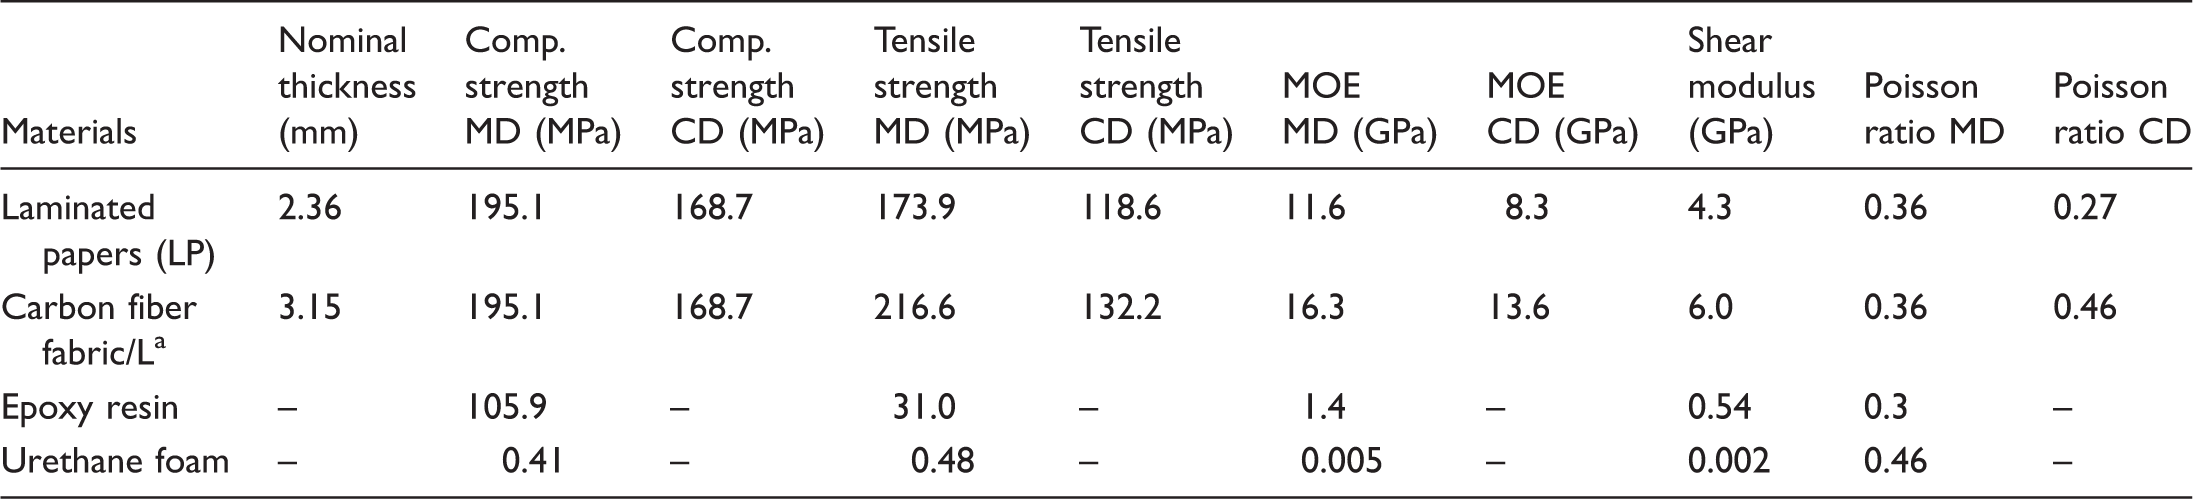
CD: cross direction (2-axis); MD: machine direction (1-axis).
Carbon fiber fabric bonded with laminated paper composite.
Carbon fiber fabric, a tri-axial woven material, QISO, A&P Technology (San Jose, CA), was bonded to both outside panel faces using U.S. Composites epoxy resin no. 635 (West Palm Beach, FL). The ratio of epoxy to hardener was 3:1. The purpose was to enhance the total face strength and stiffness. The properties as a result of bonding the carbon fiber fabric to the laminated paper were tested as a combined composite. The laminated paper/carbon fiber fabric composite was tested to determine the combined properties in the MD and CD directions (Table 1).
The epoxy resin no. 635 (US Composites Inc.) was formed into a dog-bone test coupon and tensile tested. The shear property of the epoxy resin was also determined using a single lap sample of the NP 610 laminated paper.
A self-expanding urethane foam (US Composites Inc.), having a density of 48 kg/m3, was used to fill the volume between the core ribs. The foam properties are listed in Table 1.
Panel fabrication and experimental design
Composite panels were fabricated with a shifted-tri-axial core configuration using laminated paper ribs. The nominal rib height for the core was 50.8 mm. The slots were machined into the core rib pieces slightly oversized to account for the 60° angular orientation between the ribs (Figure 1) when assembled. For this study, a 25.4-mm side length triangular/hexagonal element for the shifted-tri-axial core was used to investigate the damage and mechanical responses. The cross rib slots were slightly more than 1/2 the rib height and spaced 25.4 mm apart. One set of ribs had all the slots cut from one edge. In the other set of ribs, the slots were cut alternating from either edge, slightly more than 1/2 the height of the ribs. In comparison with an iso-grid tri-axial structure, the ribs in one axial direction were shifted 25.4 mm to create the shift-tri-axial structural core (Figure 1).
The characteristics and dimensions of tri-axial structural panels.
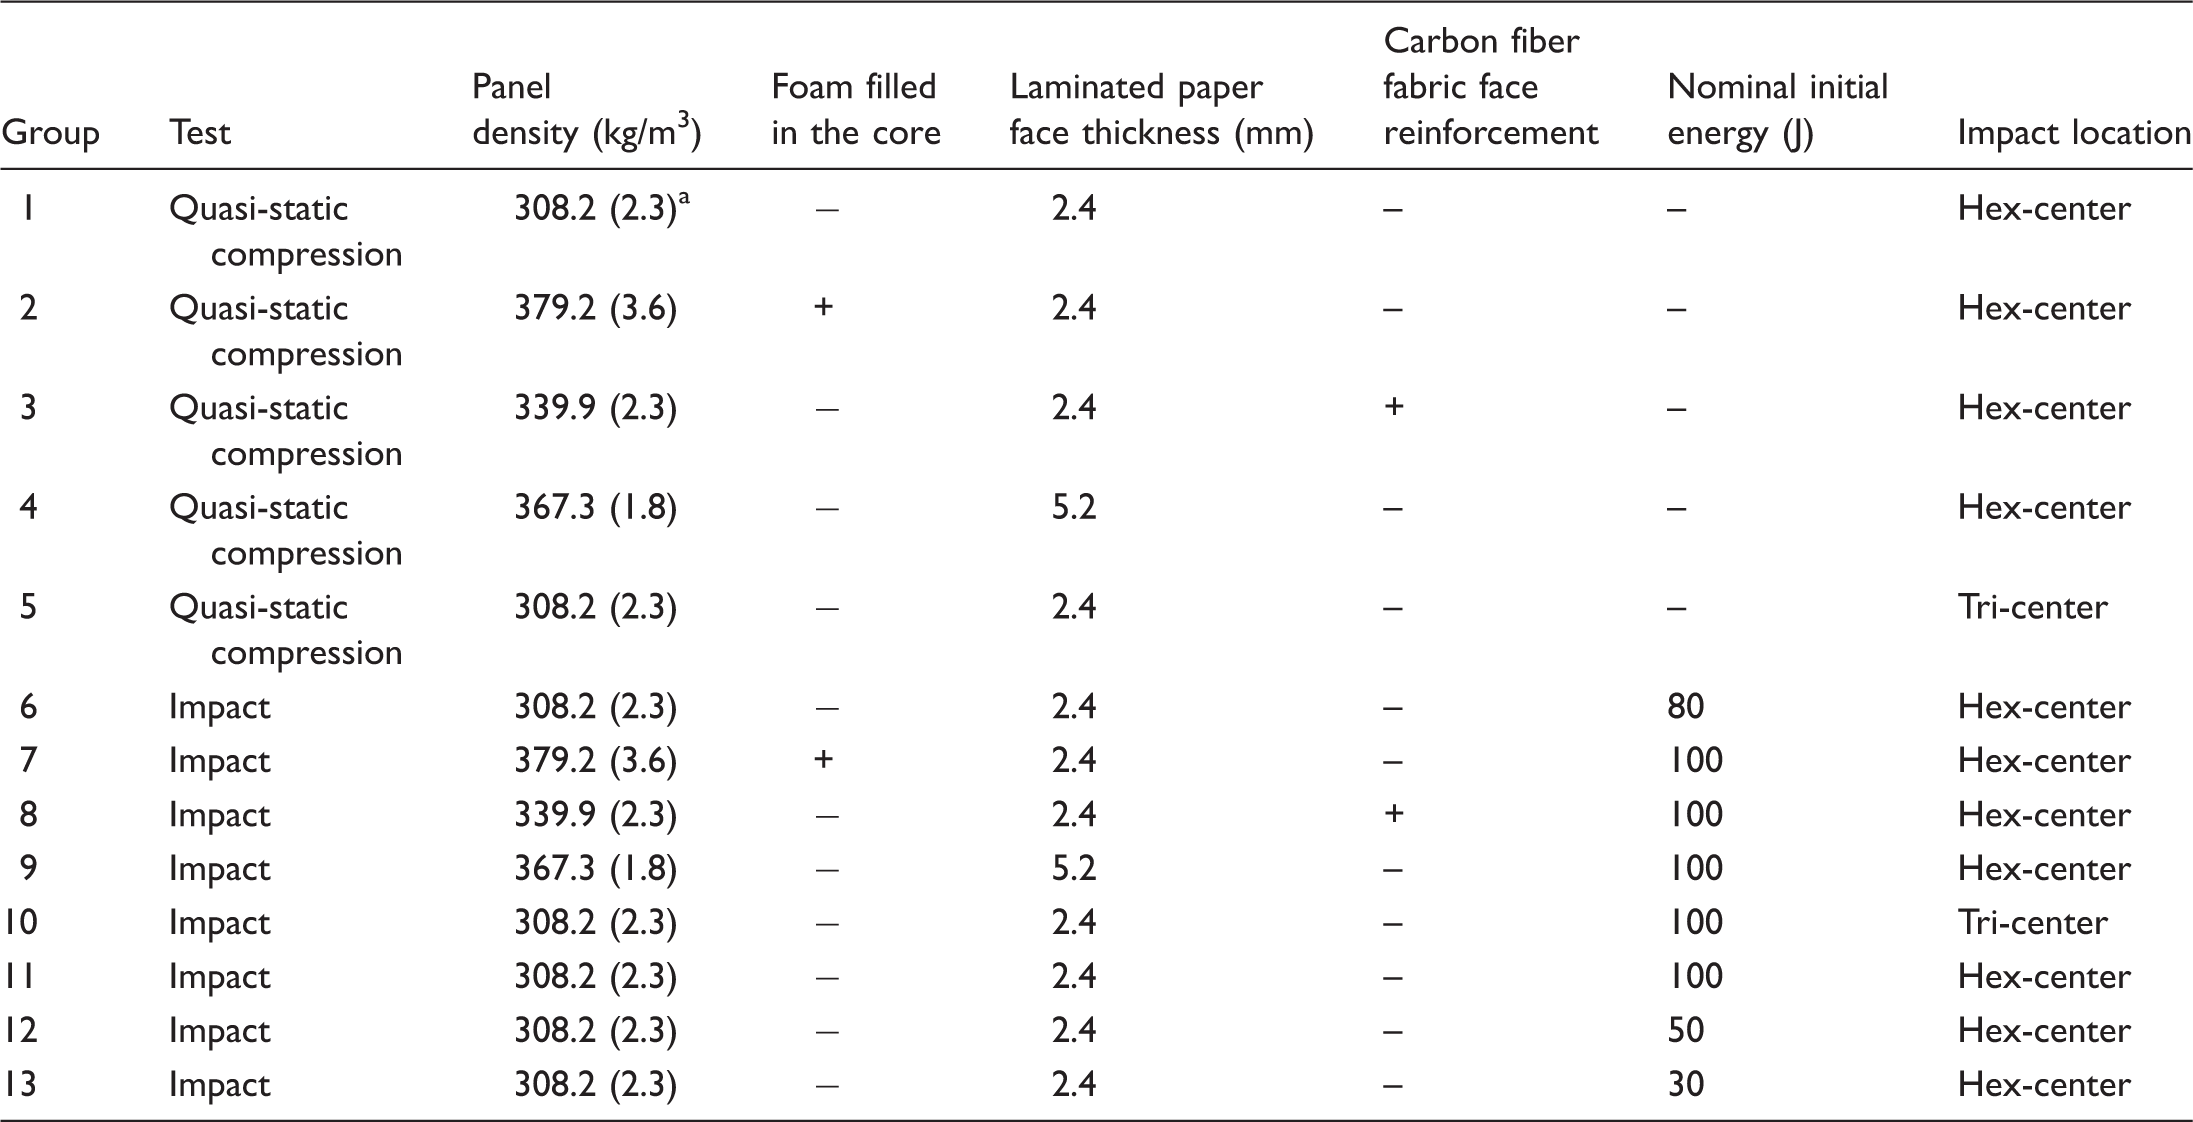
Coefficients of variation, in percent.
Quasi-static compression test
To determine the approximate load parameters for the low-velocity impact test, panels with different configurations were tested using quasi-static compressive loading. The quasi-static compression test set-up is shown in Figure 2(a). The load was applied to the top face using a 38 mm diameter hemisphere load-head positioned at the center of the triangular core element. The same clamping fixture was also used for the impact test. The compressive load rate was 10 mm/min. The test samples were 127 mm × 127 mm.
Testing set-up: (a) quasi-static compression; (b) low-velocity impact.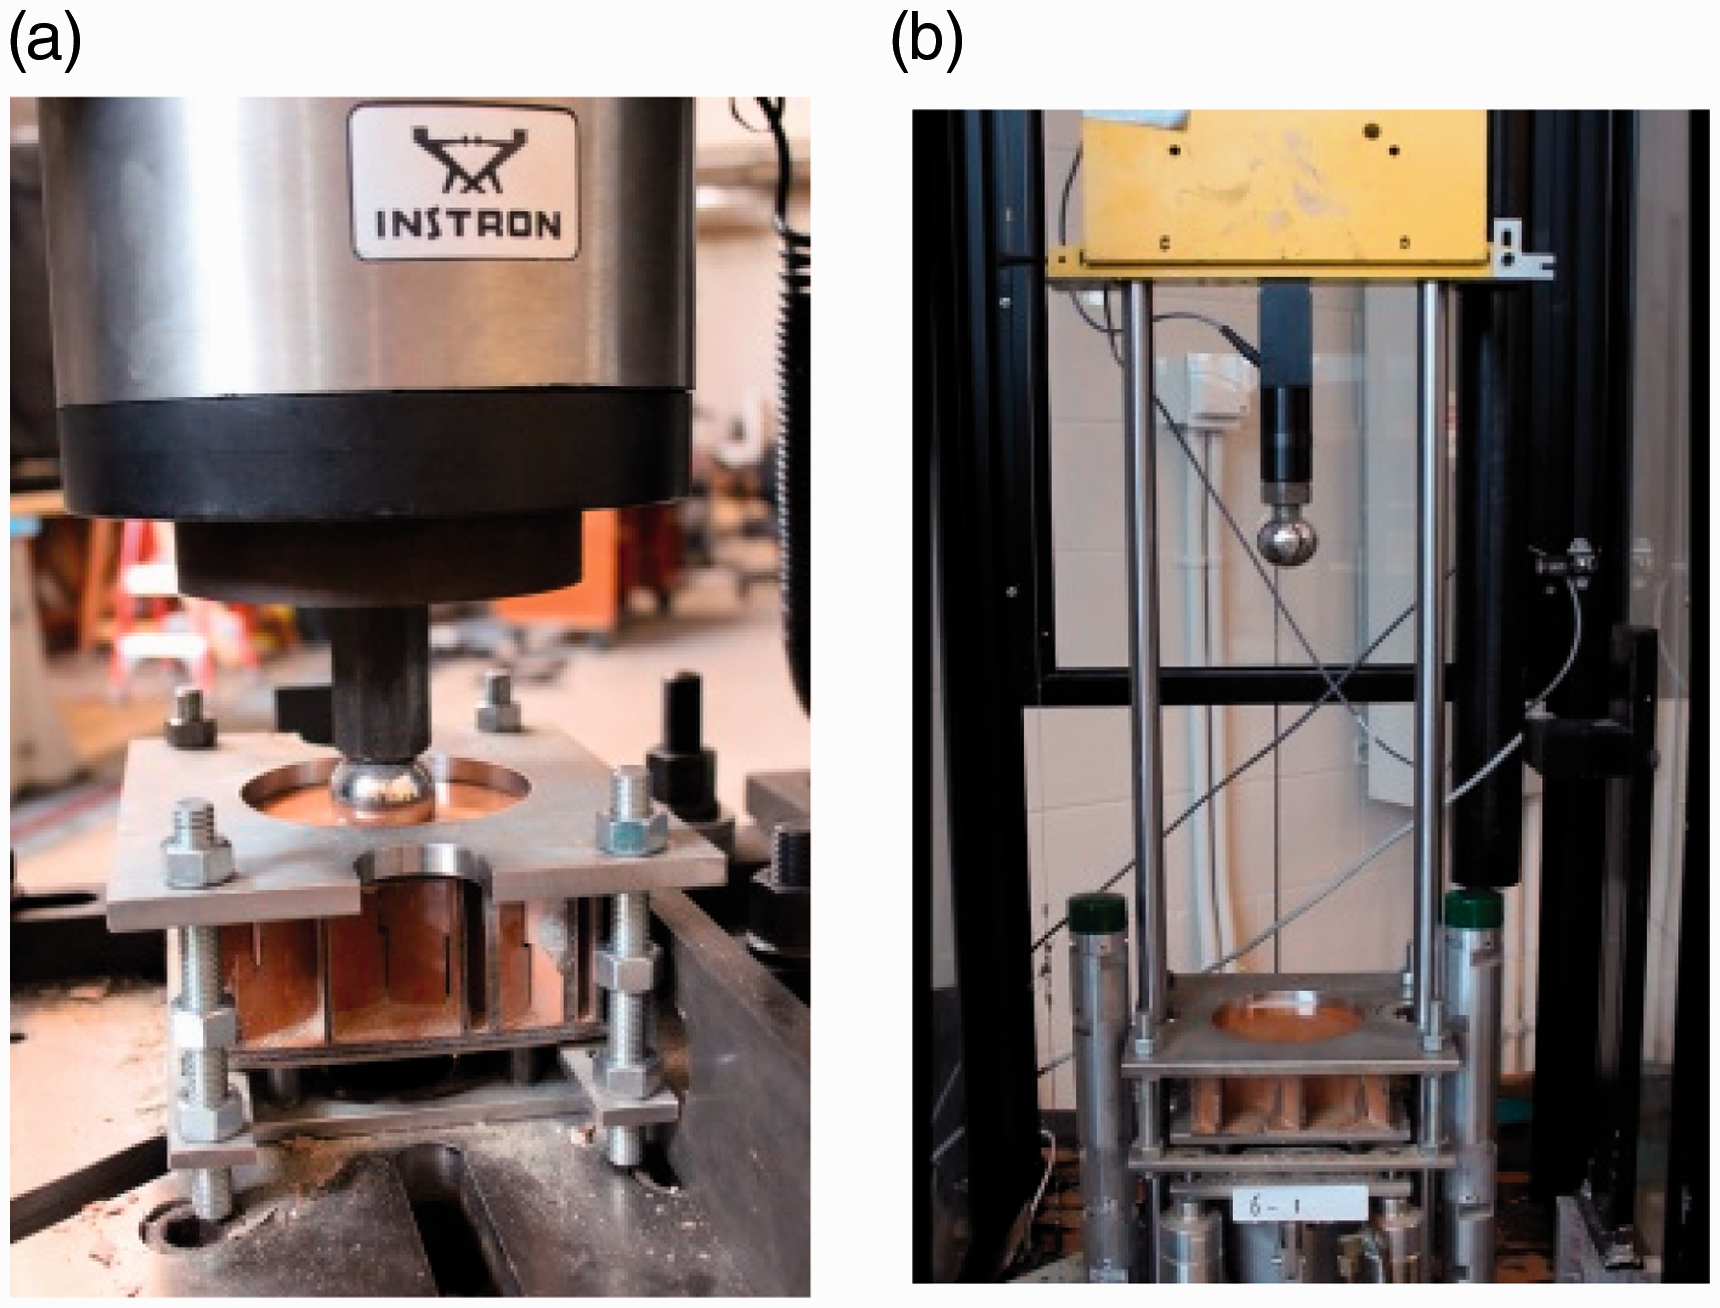
Impact test
Low-velocity impact test apparatus used to measure the impact damage and responses was an Instron Dynatup drop tower, model 8250, with a free-falling mass (Figure 2(b)). This machine was capable of impacting samples at four different initial energies 30 J, 50 J, 80 J, and 100 J obtained by using two different drop weights, 22.51 kg and 33.28 kg, and four different heights, 120 mm, 220 mm, 300 mm, and 350 mm, respectively. Impact velocities were nominally 1.6, 2.1, 2.4, and 2.5 m/s. The same hemisphere load-head was also used for the quasi-static compression test. Pneumatic clamping fixture was used to secure all the test samples. A 22.2 kN load sensor was connected to the load-head to measure the impact load. The initial impact speed was obtained using a speed sensor located at the impact plane. A position transducer was used to measure the displacement after impact. The locations for the compression test and low-velocity impact test were selected based on the estimated maximum and minimum core loads for the structural core.
Results and discussion
Quasi-static compression test
Typical curves for compressive load vs. displacement and accumulated energy vs. displacement are shown in Figure 3(a). The solid curves show the compressive load vs. displacement for the quasi-static compression test behavior. The displacement transducer recorded the starting of displacement data when the compressive sphere load-head contacted the top face. The results showed that these panels with various configurations had different quasi-static responses, as expected. Panel 1, made from laminated paper only, the load-head was located at the middle of the hexagonal rib portion. Also, as the load-head passed through the face, the load-head would start to encounter the ribs causing load transfer directly to the bottom face. The load can be seen to increase quickly as displacement increased until the top face failed in combination with the ribs. Maximum face failure load occurred when the maximum load-head sphere diameter, 38 mm, passed through the face. The load decreased to near zero as the load-head penetrated into the center of the hexagonal portion of the core, but still forced the hexagonal area ribs horizontally and still had minimal load recorded until the load-head contacted the bottom face. Once contact was made with the bottom face, there was a smaller peak load observed as the load-head pushed against the bottom face of the sample. The compression test ended when the load-head displacement was at the nominal point where the load-head maximum diameter would have passed through the bottom face. The bottom face shows broken areas larger than the diameter of the load-head. Some of this failure could be due to the load transfer through the ribs before the load-head contacted the bottom face. Also, the failure of the rib-to-face adhesive contact line would have been larger than the diameter due to lack of full support during movement of the load-head penetrating from the inside to outside direction. For panel 2, foam-filled core, the compressive load increased to the maximum compressive load greater than panel 1. The load did not drop to zero, but decreased to a relative constant value as the foam sheared and compressed as the load-head passed through the core. It can be seen in Figure 3(b) that a portion of the foam sheared and pushed out a greater area of the bottom face out, see front view for panel 2. The foam-filled core absorbed the energy and also helped the ribs of the core to resist core buckling, thus, the maximum compressive load was higher than that of panel 1. For panel 3, with carbon fiber fabric composite face, the results showed that it had the highest maximum compressive load, because the face strength and stiffness were higher than the laminate paper (Table 1). The carbon fabric bonded to the face significantly improved the resistance to compressive load. Furthermore, the compressive load–displacement curve had a second peak when the load-head contacted the bottom face as compared with panels 1 and 2 shown in Figure 3(a). This is because the carbon-fiber fabric composite face had provided higher strength and stiffness. The failure mode was significantly different than the brittle failure of the bottom face observed by all the other panels. For panel 4, with nominally twice the face thickness, 5.2 mm, the peak load was approximately twice the load for panel 1, with 2.4 mm laminated paper faces. As the load-head passed through the center of the hexagonal area, it had a similar behavior where the load dropped to near zero. As the load-head impacted the bottom face, the thicker face provided higher stiffness and higher energy absorption. For panel 5, the load-head was located at the center of the small triangular area (279 mm2) within the core (Figure 1). The load-head area was 1.134 mm2, resulting in the load being transferred through the ribs to the bottom face directly. Having the ribs directly beneath the impact, resulted in significantly initially higher load vs. deflection response compared to the impact at the center of the hexagonal area, as shown by the higher peak load within a shorter distance of load-head travel. It was also evident that the initial localized impact has highest absorbed energy. The triangular rib area also had the ribs oriented closer to the center of the load-head increasing initial resistance to the load-head. The peak load for panel 5 was higher than panel 1. However, once the load-head passed through the ribs and caused failure through the bottom face, there was not much more resistance to the energy. The higher initial load for panel 5 was due to the smaller triangular rib element area that provided better load support from the ribs than the area for the hexagonal element in the core as the spherical load-head passed through the panels.
(a) Typical compressive load and absorbed energy vs. displacement curves of panels in the quasi-static compression. (b) Typical failure modes of panels in the quasi-static compression.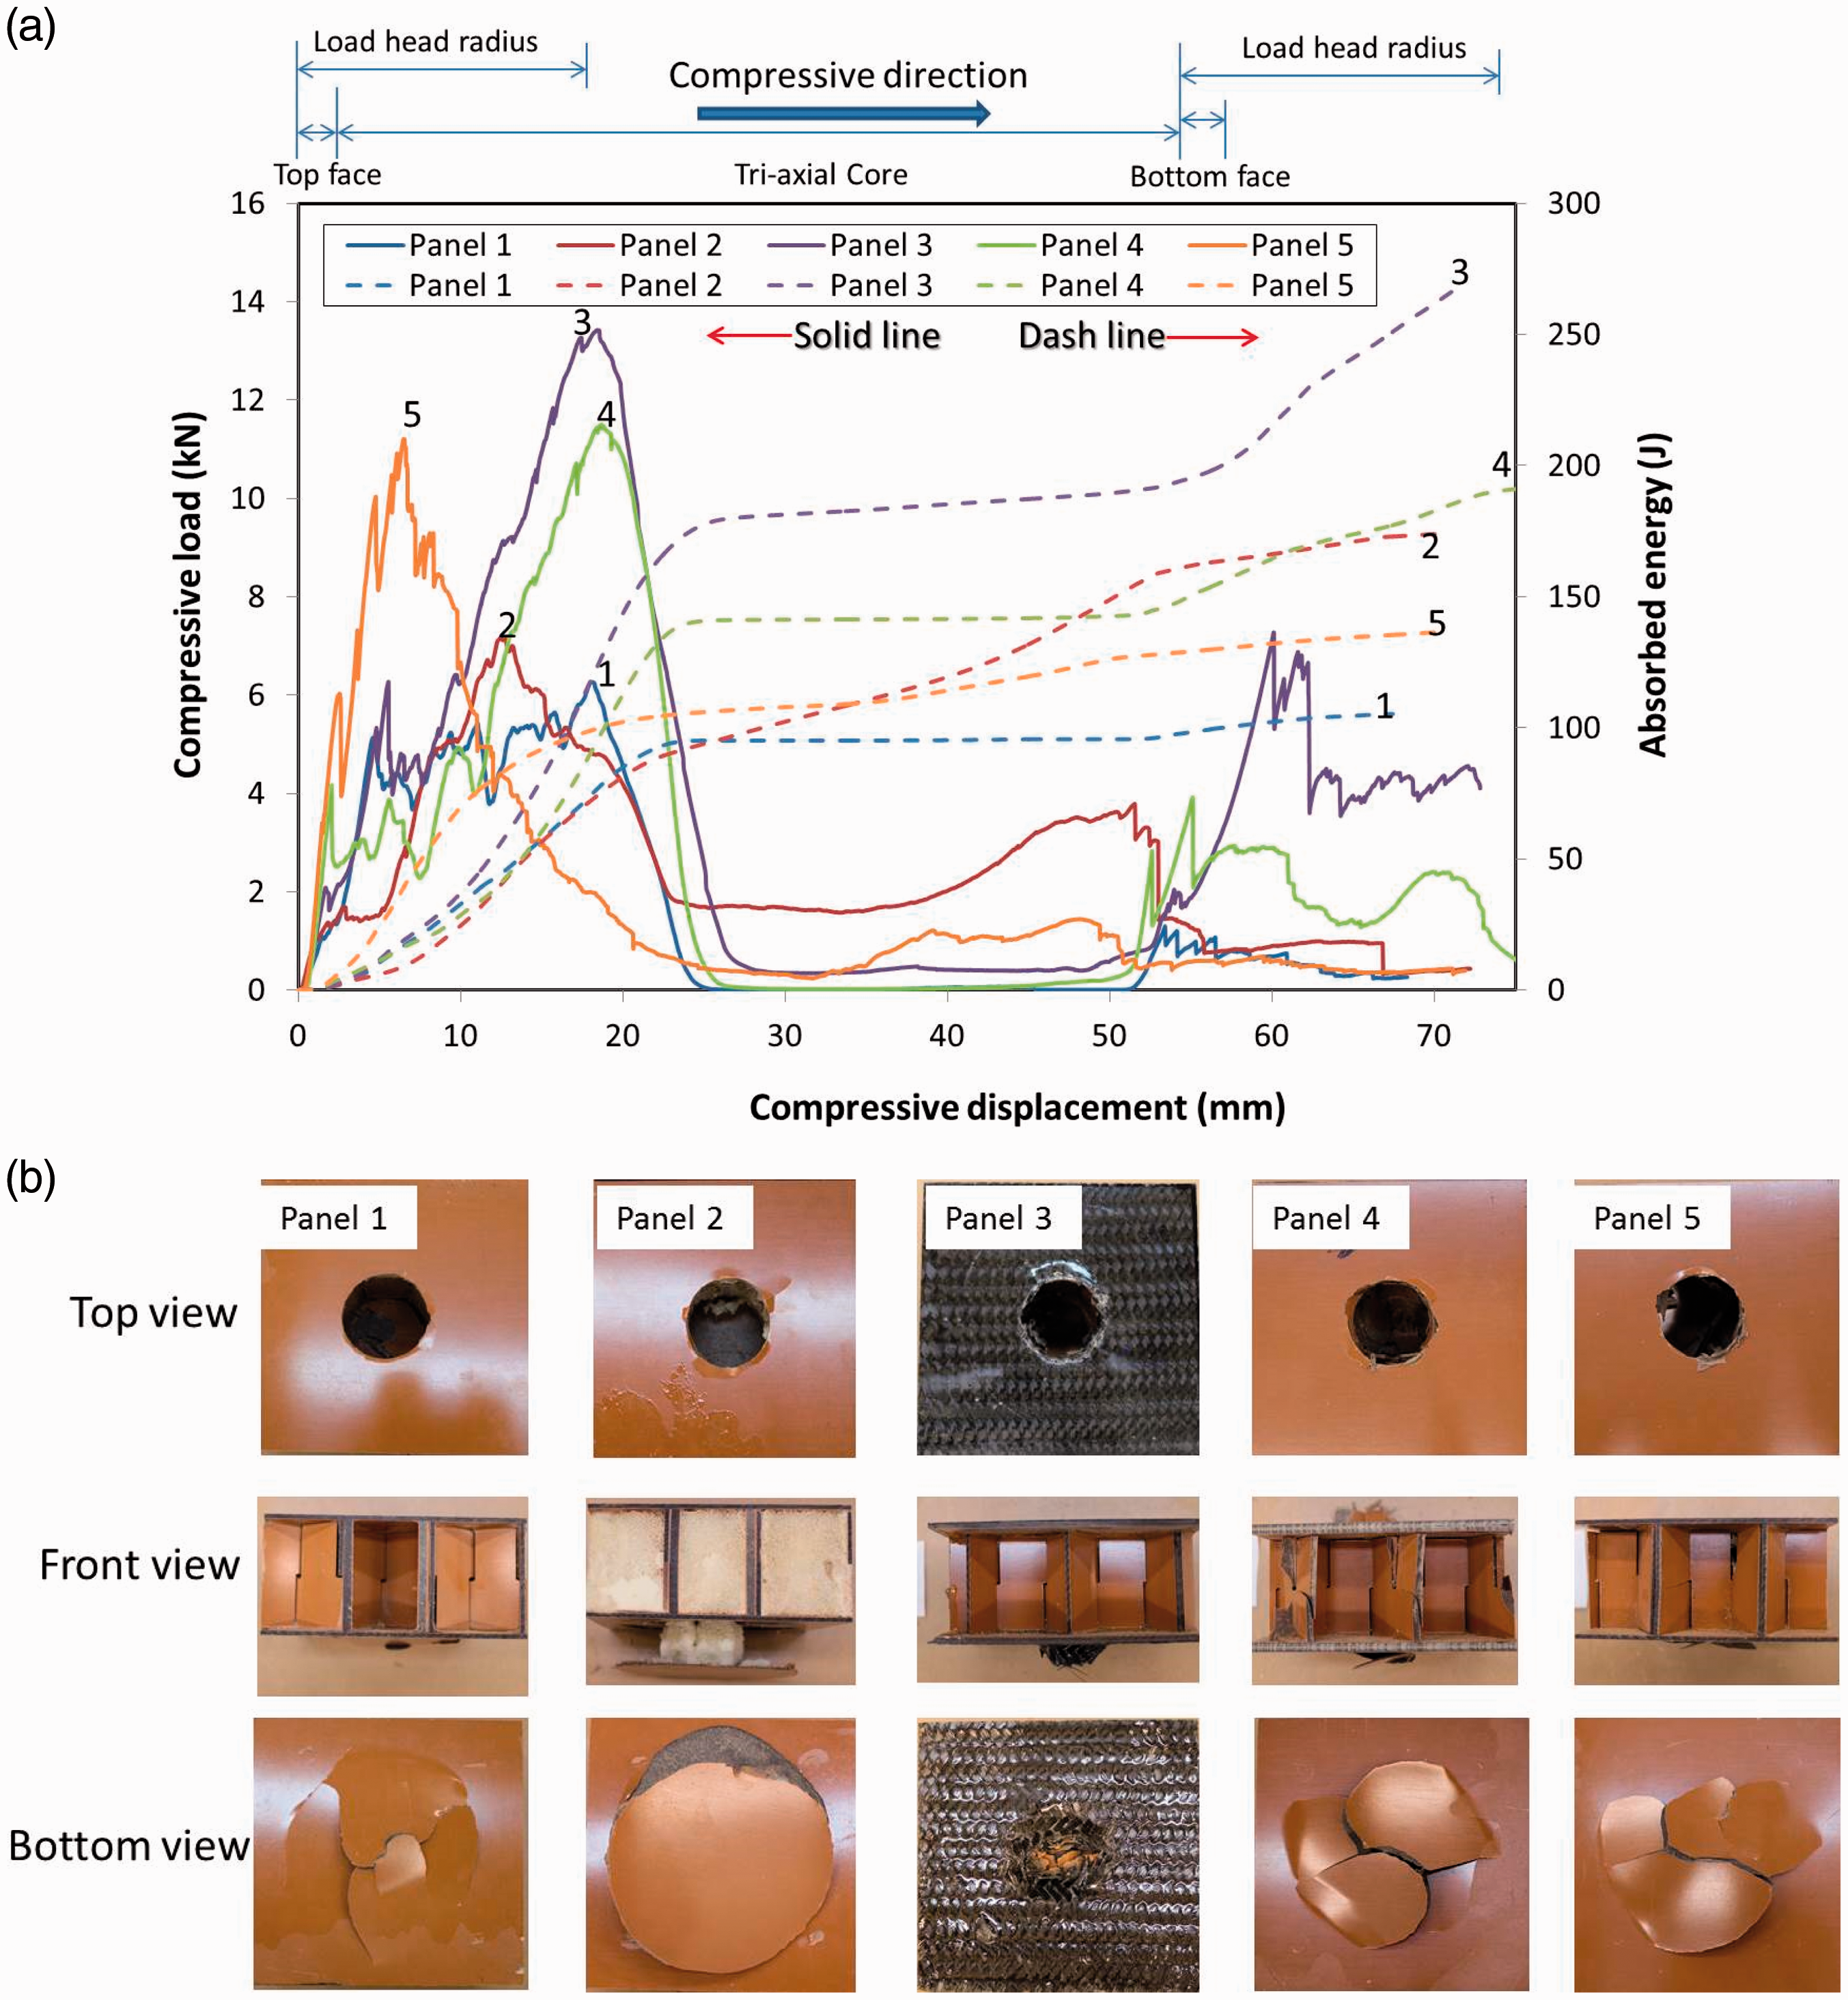
The dashed lines (Figure 3(a)) show the typical accumulated energy absorption vs. displacement for all the panels. It indicates that face stiffness and strength influenced the total energy absorption in the quasi-static compression test. Panel 3 with carbon fiber composite face absorbed 270.6 J, which was 54% higher than panel 2, 175.5 J, with the foam-filled core and 157% higher than panel 1, 104.6 J, with laminated paper faces only. Panel 2, with foam filled core, absorbed 53% more energy than panel 1. For panel 4, with the 5.2 mm thickness laminated paper faces, absorbed 191.4 J energy, which was 83% higher than panel 1 made from 2.4 mm thickness laminated paper faces. As expected, the face components were significant factors for the compressive energy absorption. The absorbed energy for panel 5, compressed at the center of triangular element area in the core, was 138.2 J, which was 32% higher than the panel 1 which was compressed at the center of hexagonal element area of the core. The impact energy absorption results had similar results as with the compression. It indicated that the structure and size of element in the core also had an effect on absorbed energy, but it was less important than the contribution of the top face components.
Figure 3(b) shows the typical failure modes of all the panels with different configurations in the quasi-static compression test. While the damage to all panels were similar on the top face; however, the damage as observed from the bottom view were different, Figure 3(b). Panel 2 with foam-filled core had better core integrity where the load can be seen distributed over a larger area as compared with panels 1, 4, and 5. For panel 3, carbon fiber fabric significantly increased stiffness and strength of the faces. Its failure mechanism was not a brittle failure, but seemed to be a controlled failure of the carbon fabric. While panels 1, 4, and 5 made from laminated paper had similar bottom face failure modes in the compression tests in Figure 3(b), but they had different compressive behaviors and peak loads.
Impact analyses
Impact analyses of panels with different configurations
Typical results from the 100 J initial impact energy of load and accumulated absorbed energy vs. impact displacement are shown in Figure 4(a). Panel 11, of all the tested panels, had the lowest energy absorption, 42.2 J, where the load-head passed through both top and bottom faces. Panel 11 was made with 2.4 mm thick laminated paper faces. The impact peak load was 2.9 kN, was also the lowest of all the tested panels. As expected, panel 9, with 5.2 mm laminated paper faces, had higher impact peak load, 6.2 kN and energy absorption, 98.6 J as compared with panel 11. Even the density of panel 9 was 367.3 kg/m3 and higher than the density of panel 11 with 308.2 kg/m3, the specific energy absorption (absorbed energy/density) of panel 9 was 0.286 and 104.3% higher than the panel 11 with 0.140. Panel 8 with a density of 339.9 kg/m3 had the shortest impact displacement, 18.92 mm with the maximum impact load of 10.7 kN, a relatively thin layer of carbon fabric was able to absorb most of the energy before the load-head passed into the core section. The evidences indicated that the thicker and stiffer faces provided higher strength and stiffness to resist the impact load, thus absorbing more impact energy. For panel 7, with just a foam-filled core, it had higher impact peak load, 4.3 kN, at 42.5 mm impact displacement because the foam core supported both faces and ribs during impact. The peak load for panel 7 was 45.9% higher than the impact peak load of panel 11 while the density was only 23.0% higher than the density of panel 11 (Table 2). The foam-filled core helped to disperse the impact load within the core and faces, thus reducing the localized failure stresses. However, the peak load for panel 7 was still 31.3% less than panel 9 that had twice the face thickness, because the higher stiffness of faces had less deflection under impact that reduced the buffer zone, as expected. While panels 7, 8, and 9 all absorbed the full energy of the load-head, the foam core configuration for panel 7 was more effective for maximum impact load reduction than for the increased stiffness effects for the face configurations of panels 8 and 9. Panel 7 absorbed the energy as a result of the foam compression and panel 8 absorbed the energy in the carbon-fabric face. Panel 9 absorbed the energy in both faces and the core.
(a) Typical load and accumulated absorbed energy vs. displacement curves using 100 J impact energy. (b) Typical observed failure for the four panel types after the impact test.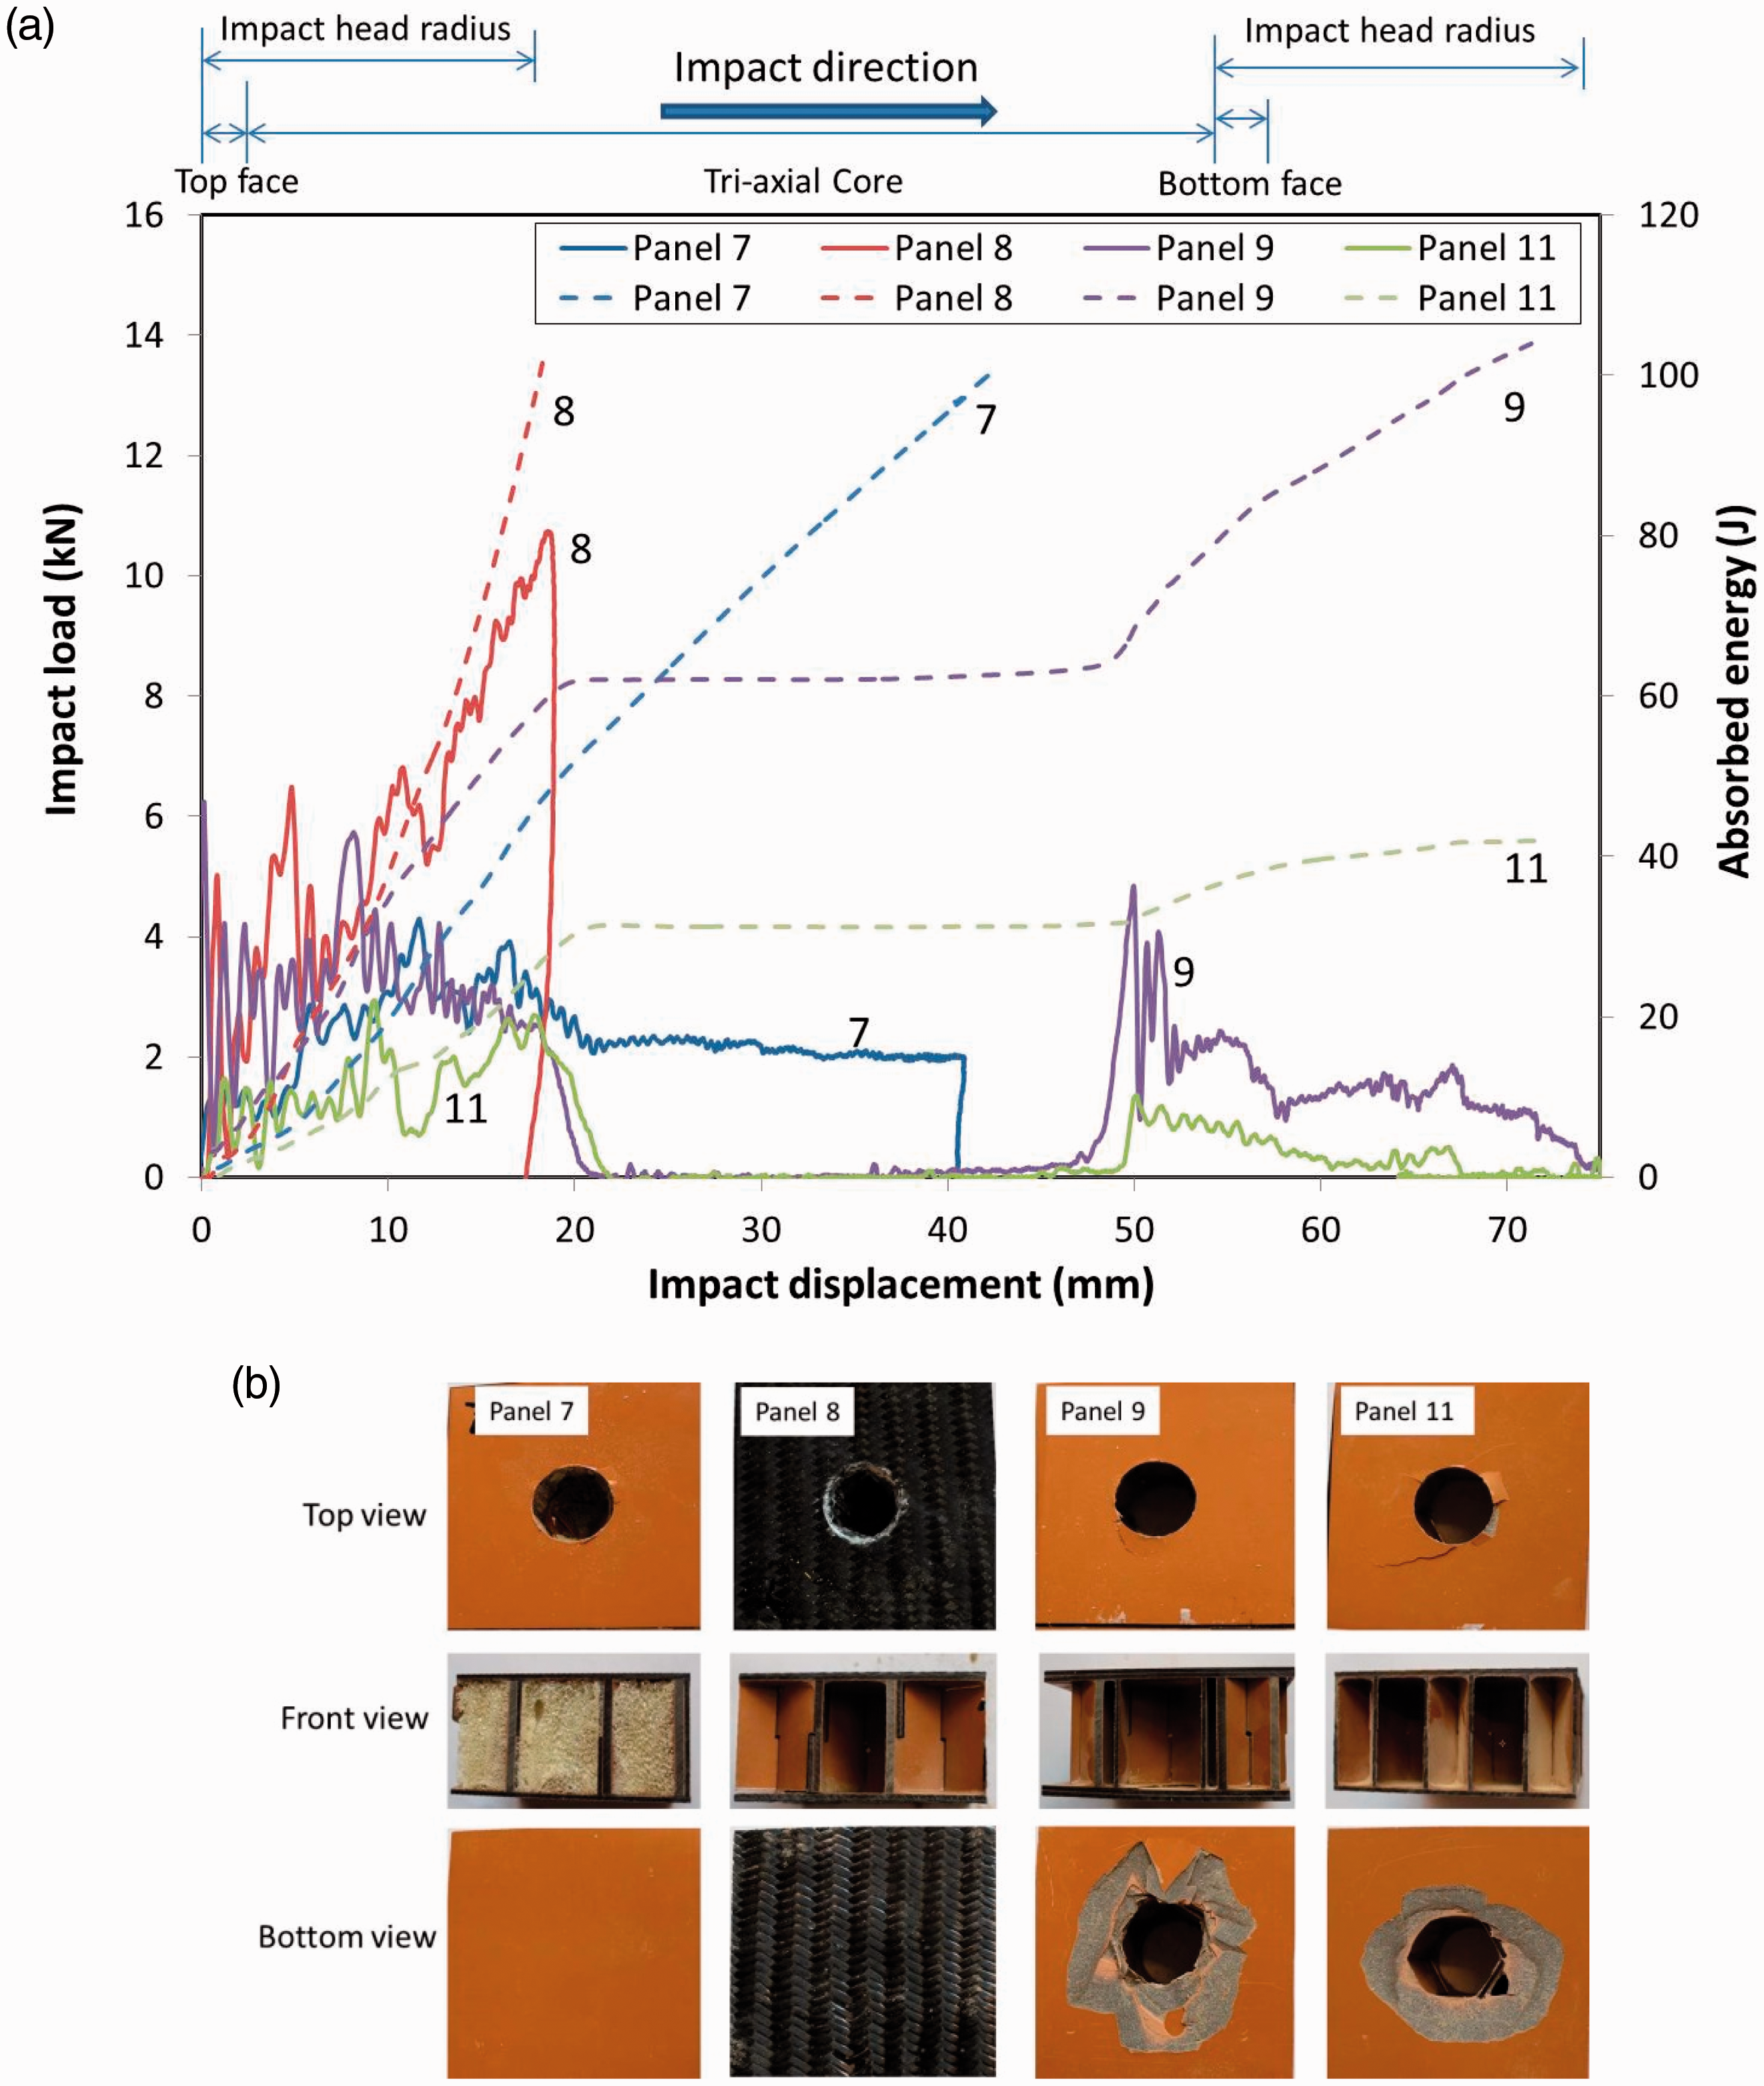
Figure 4(b) shows the typical failure modes of each panel tested at 100 J initial impact energy. For panel 11, both faces and core were damaged. The ribs in the core showed signs of buckling failure. The load-head passed through the bottom and the full 100 J of energy was not absorbed by the structure. For panel 7, while it had higher peak load and smaller impact displacement, the panel had similar top face failure as panel 11, but without failure on the bottom face. The foam provided sufficient energy absorption to fully absorb the energy within the top face and partial core. The foam provided improved performance, over panel 11, that could for future panels be modified based on the elastic modulus of the foam. For panel 9, it had similar damage as panel 11 on both top and bottom faces. The thicker faces with higher stiffness provided higher impact peak load energy absorption than panel 11, but it had less energy absorption in the core compared with the foam filled panel 7. Panel 8, with carbon fiber fabric and a single face layer with no foam showed the least damage on the top face. The core must have buckled slightly to allow for this displacement. These four impact tested panels show the effects of material characteristics on impact response for basic shifted-tri-axial core panels.
Impact analyses of panels under different impact energy
Panels 6, 12, and 13 had the same face and core configurations but were tested with 80 J, 50 J, and 30 J initial impact energy, respectively. A 22.51 kg impact weight was dropped from heights of 350 mm, 220 mm, and 120 mm to provide the three initial impact energies. The solid lines in Figure 5(a) show the three impact load vs. impact displacement for these panels at the different initial impact energies. The impact peak loads for the three panels occurred on the top face and were very similar even with the different initial energy levels. The results indicated that the face material’s strength and stiffness had similar energy absorption characteristics. The dash lines in Figure 5(a) show the absorbed energy vs. impact displacement for these panels at the three different initial impact energies. The results for panel 13 showed that 30 J impact energy was completely absorbed by the face at a displacement of 18.3 mm. When the initial impact energy increased to 50 J, panel 12, the impact energy was not completely absorbed by the top face thus resulting in further failure at the bottom face. The absorbed energy of panel 12 was able to absorb 42.6 J before the impact head passed through the panel or just 85.2% of its total potential impact energy. For panel 6, the initial impact energy was 80 J, the impact energy was not completely absorbed by the panel. It absorbed only 46.9 J of energy, which was similar to the energy absorbed on panel 12. The impact load-head passed through both top and bottom faces.
(a) Impact load and absorbed energy vs. displacement at different initial impact energies. (b) Impact load and absorbed energy vs. time at different initial impact energies. (c) Failure modes for panels at different initial impact energies: panel 6 = 80 J; panel 12 = 50 J; panel 13 = 30 J. All were impacted at the center of the hex-center geometry.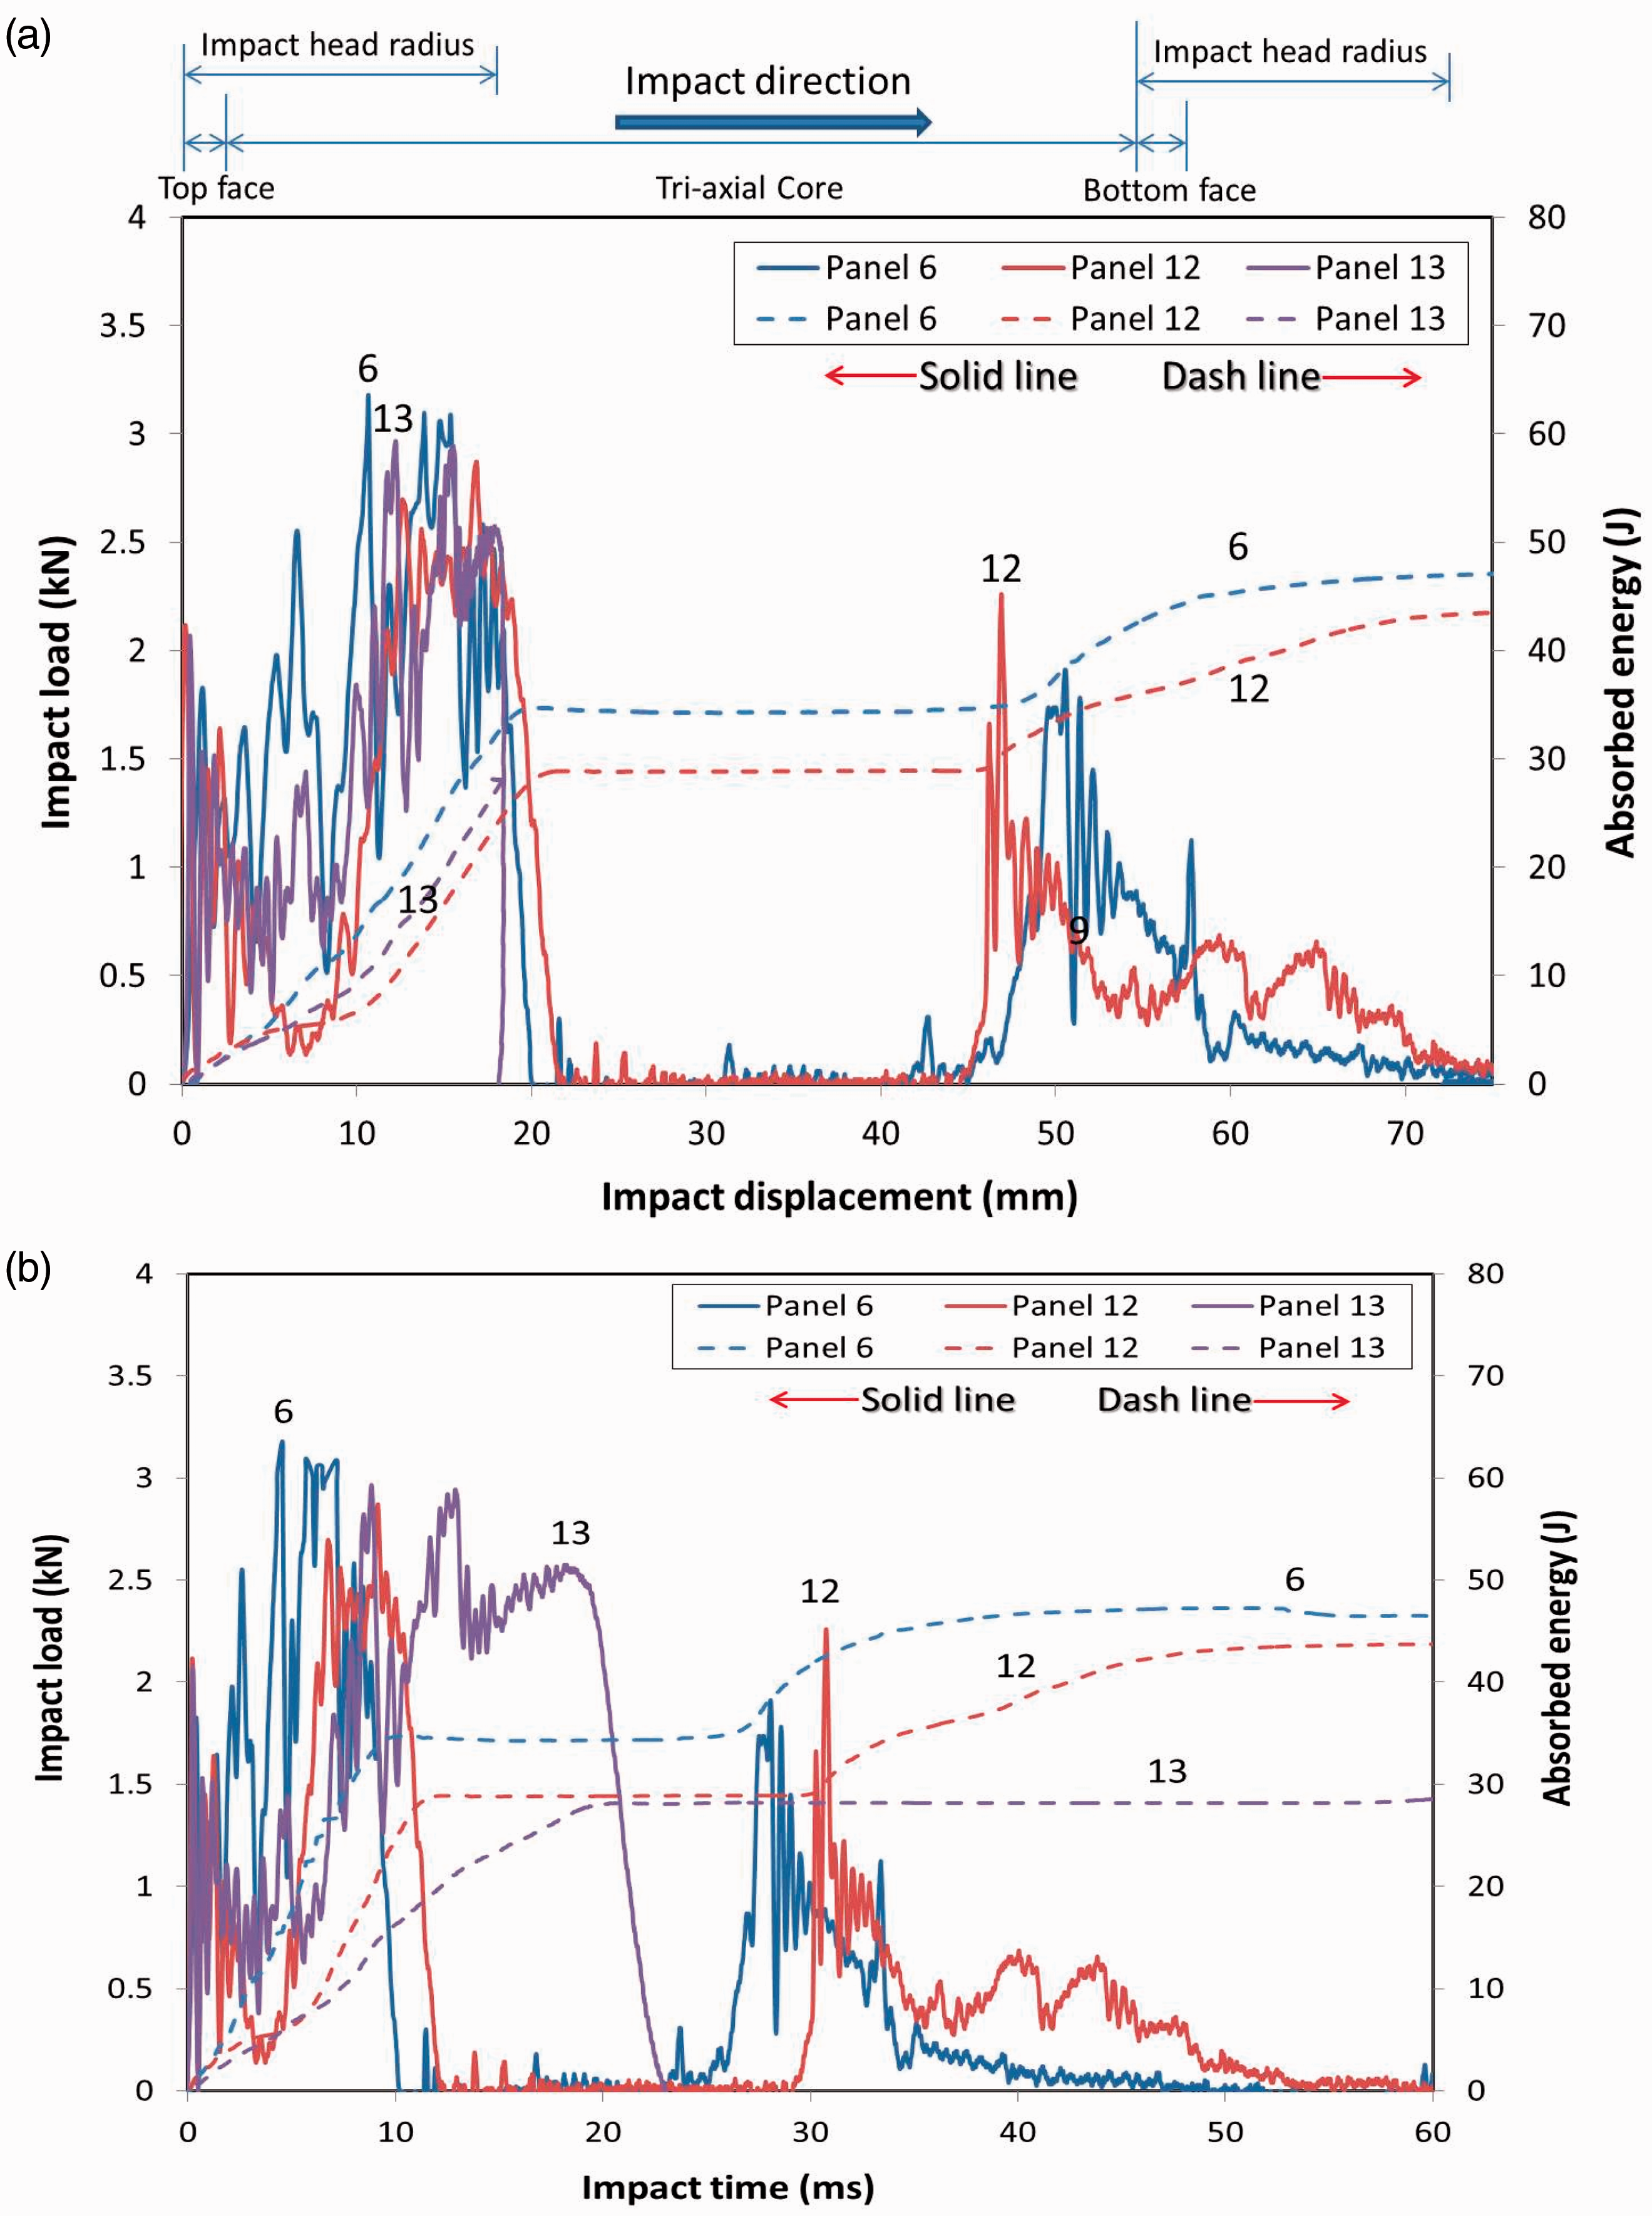
Figure 5(b) shows the typical impact load and absorbed energy relationships in the time domain, respectively. At 80 J potential energy, the impact load-head had the highest speed at 2.5 m/s was applied to panel 6 which caused an impact peak load at 3.9 ms earlier than the panels 12 and 13. The slope of absorbed energy vs. time was largest for panel 6 and decreased as potential impact energy and speed decrease for the other two panels, as expected. Panels 12 and 13 had lower impact speeds of 2.1 m/s and 1.6 m/s thus causing lower impact peak loads, respectively, also as expected. As impact speed decreased the impact time to absorb the impact energy increased.
Figure 5(c) showed the failure modes for the panels. Clearly, panel 6 under higher initial impact energy had the largest damage area on the bottom face than the other panels. With more residual unabsorbed energy resulted in the load-head having higher impact force on the bottom face. For panel 13, the load-head did not penetrate the top face, but it stopped without impacting the bottom face.
Impact analyses of panels with different impact locations
Figure 6(a) shows impact load and absorbed energies at two locations, at the center of the rib triangle and the center of the rib hexagon of the core showing the comparisons of the impact load and absorbed energy vs. displacement for panels 10 and 11 using 100 J initial impact energy. For panel 10, the impact location was at the center of the triangle area, it had significantly higher impact peak load of 10.6 kN whereas for the panel 11, the impact load at the hexagonal center of the core was much lower at 2.9 kN. The reason for the difference was the effective ribs of trangular element, which was approximately three times larger than the hexagonal area. Therefore the impact energy was distributed over a larger rib area bounded by the rib geometry or structure thus reducing the face impact displacement. Both panels had impact damage that went through the top and bottom faces, so the 100 J initial impact energies were not completely absorbed by the top face. The average absorbed energy at the center of the triangular area was 92.0 J, which was almost twice that of the hexagonal area absorbed energy of 48.2 J.
(a) Impact load and absorbed energy vs. displacement at different locations using 100 J inital impact energy. (b) Contours for the typical maximum absorbed energies for the panel at the hexagonal and triangle impact locations.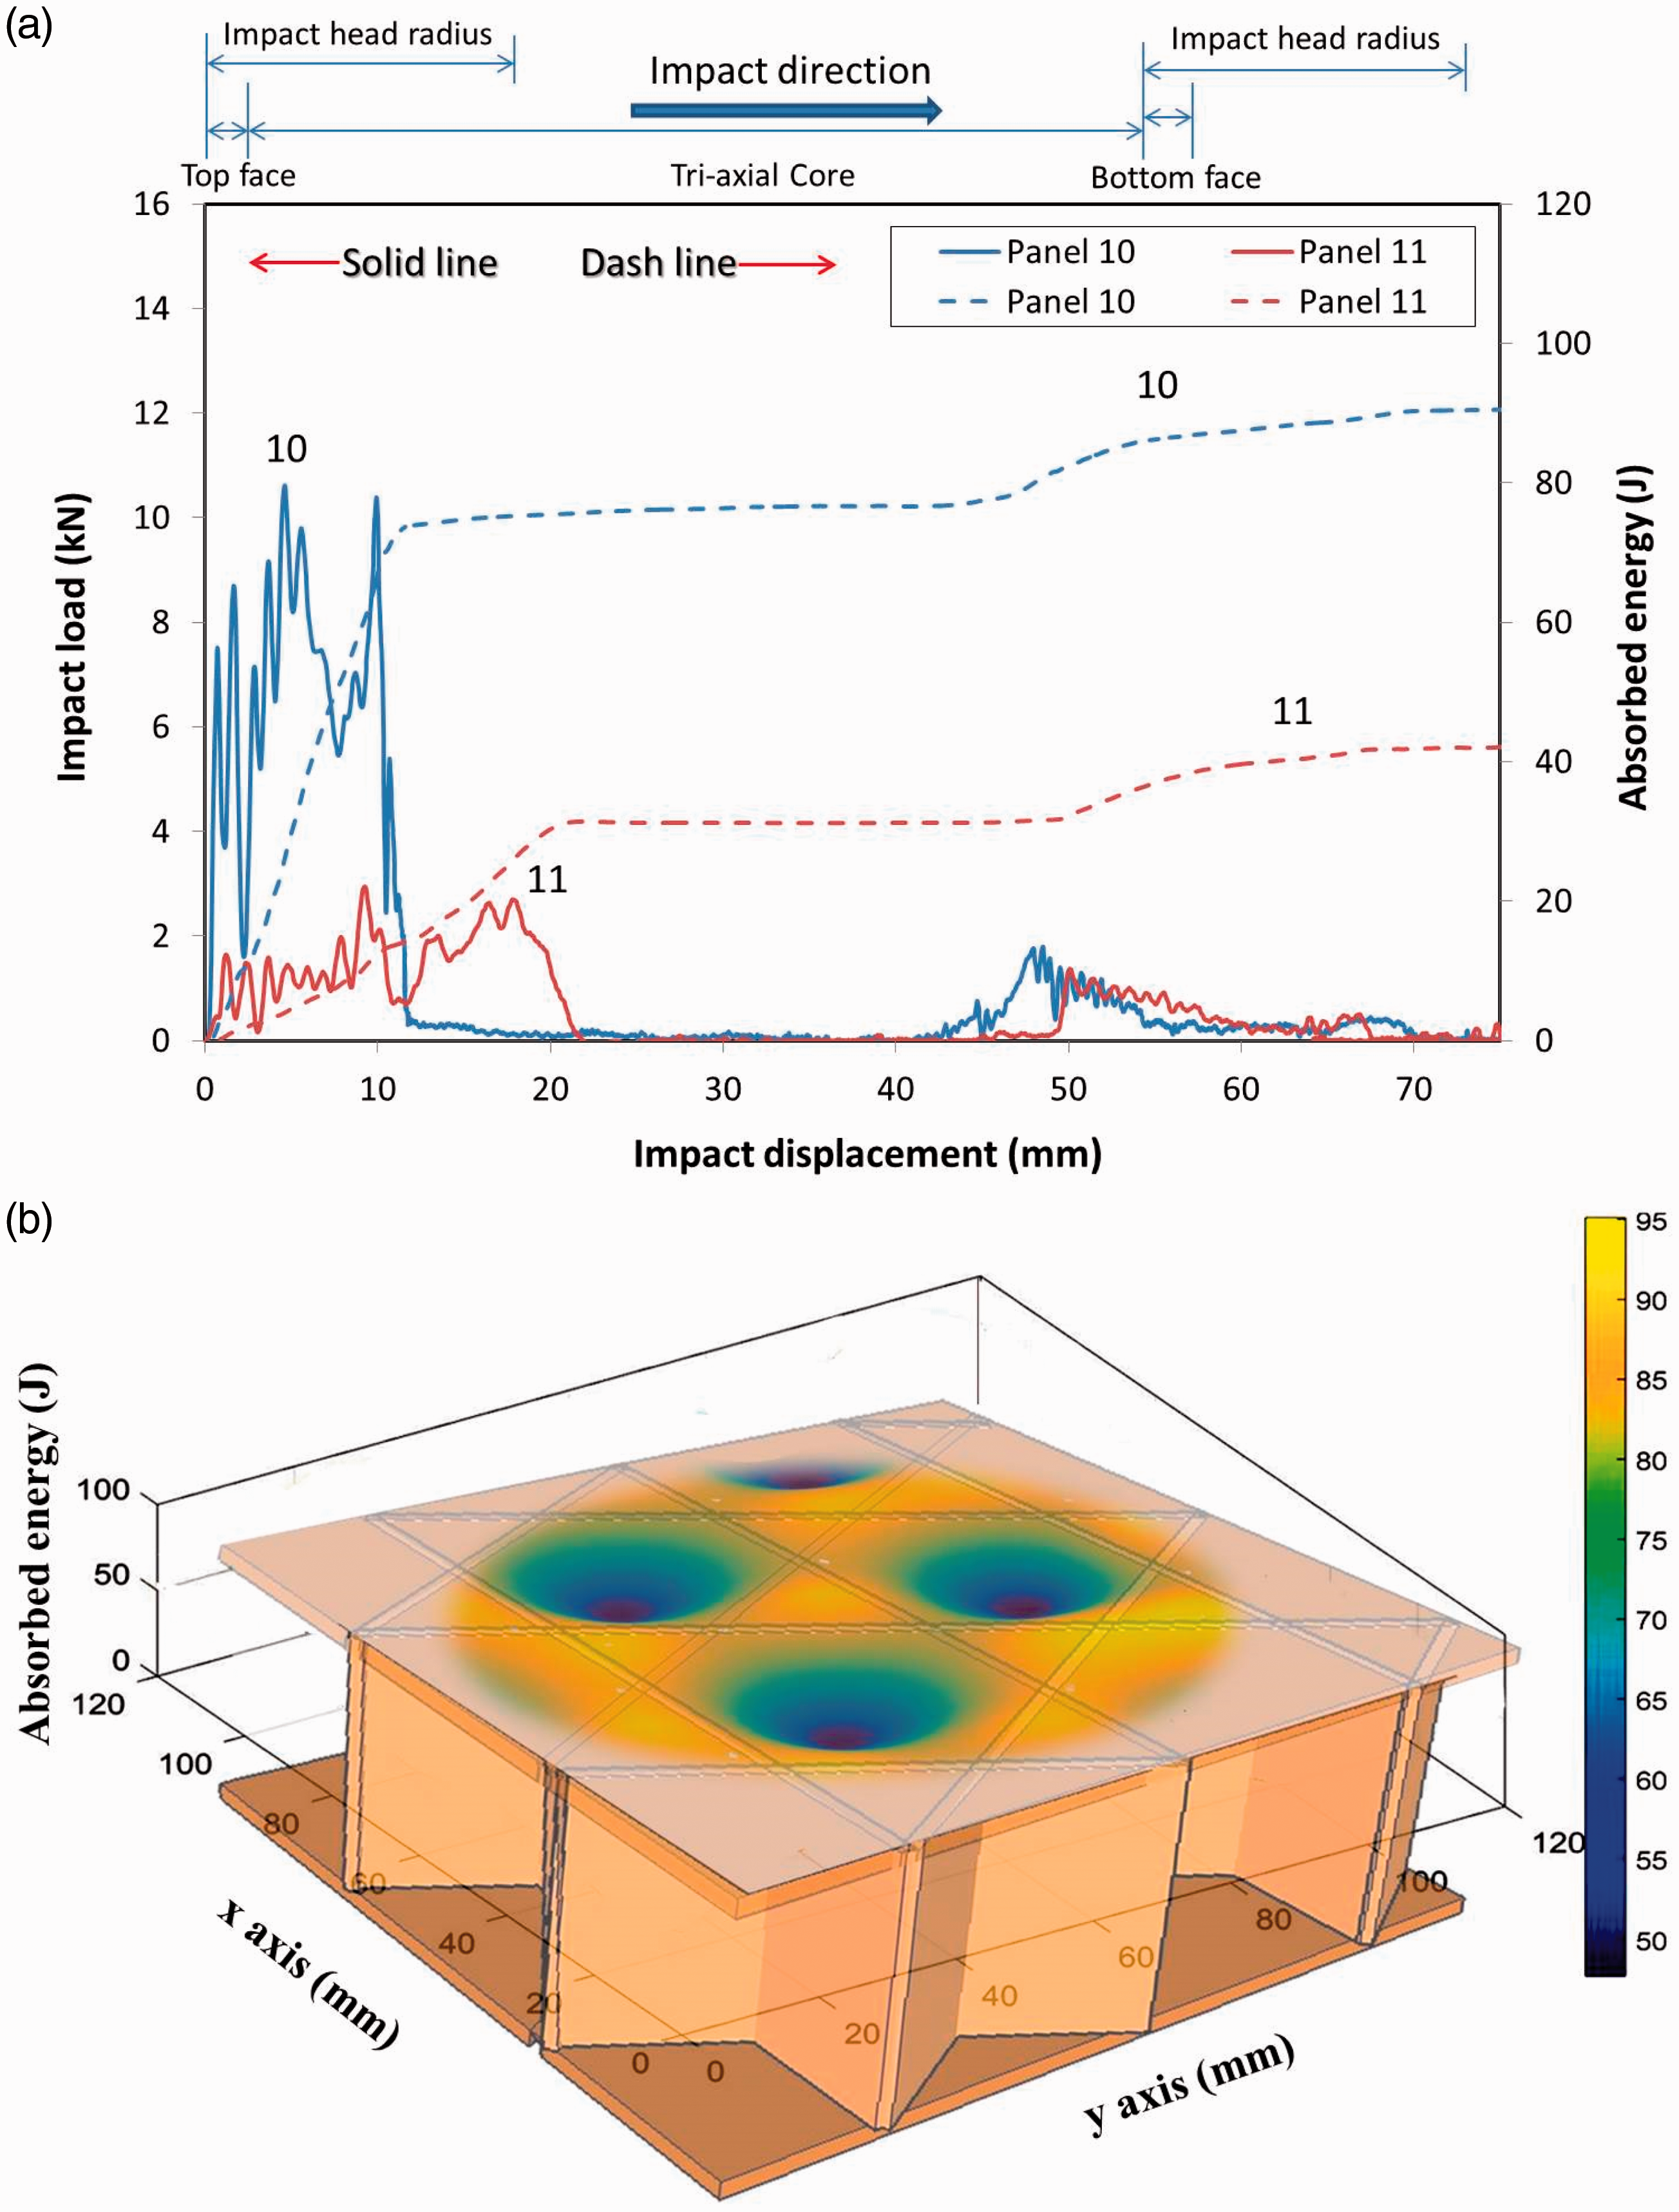
Figure 6(b) shows a coutour map for the potential maximum absorbed energy for a panel impacted at the locations from the experimental results. The absorbed energy is essentially lower when the load-head passes through the core within the hexagonal area. However, the faces absorbed more of the impact energy when impacted at the center of the hexagonal area. There is significantly high absorption of energy as the load-head passed through the core within the triangular area indicating the triangular rib area provided some resistance to the load-head. The size and geometry of the lattice element in the core also affected the energy absorption. The results can be used as reference for further design to obtain the optimum combination to maximize the performance for impact.
Comparison of quasi-static compression and impact tests
Comparing the quasi-static compression and impact response of the wood-fiber based composite panels, the load vs. displacement relationships were analyzed using panels 1, 2, 3, 4 and 11, 7, 8, 9 with four different panel configurations. Displacement and load were measured once the load-head made contact with the top face (Figure 7). The solid lines represent the quasi-static compressive responses of panels and the dashed lines represent the impact responses of the panels. These results show that the low-energy impact behavior for each panel with different configurations was very similar to the quasi-static compression behavior. Further, the load–displacement trend for each of the panels in the quasi-static compressive test had good agreement with the load–displacement trends for the impact tests. It indicated that the properties and structure of face components dominated the early phase response and damage in both tests. The wave-like trends can be found in both tests as the load-head penetrated the top face of each panel, as expect. The major difference between compression and the low-velocity impact tests were that they occurred over a different time domain. The low-velocity impact test for each panel had a short time domain for the entire test that absorbed less energy than the quasi-static compression. The load redistribution during the sub failure had sufficient response time in compression compared with the panel in the impact test. The peak load for each panel in the compression was higher than the same panel in the impact test. In the future, it might be possible to correlate the ultimate compressive characteristics with the impact behavior or vice versa.
Load vs. displacement for panels with different configurations by quasi-static compression tests (solid lines) and low-velocity impact tests (dashed lines). Circled of 1-dashed and 1-solid line indicates panels made with similar configurations.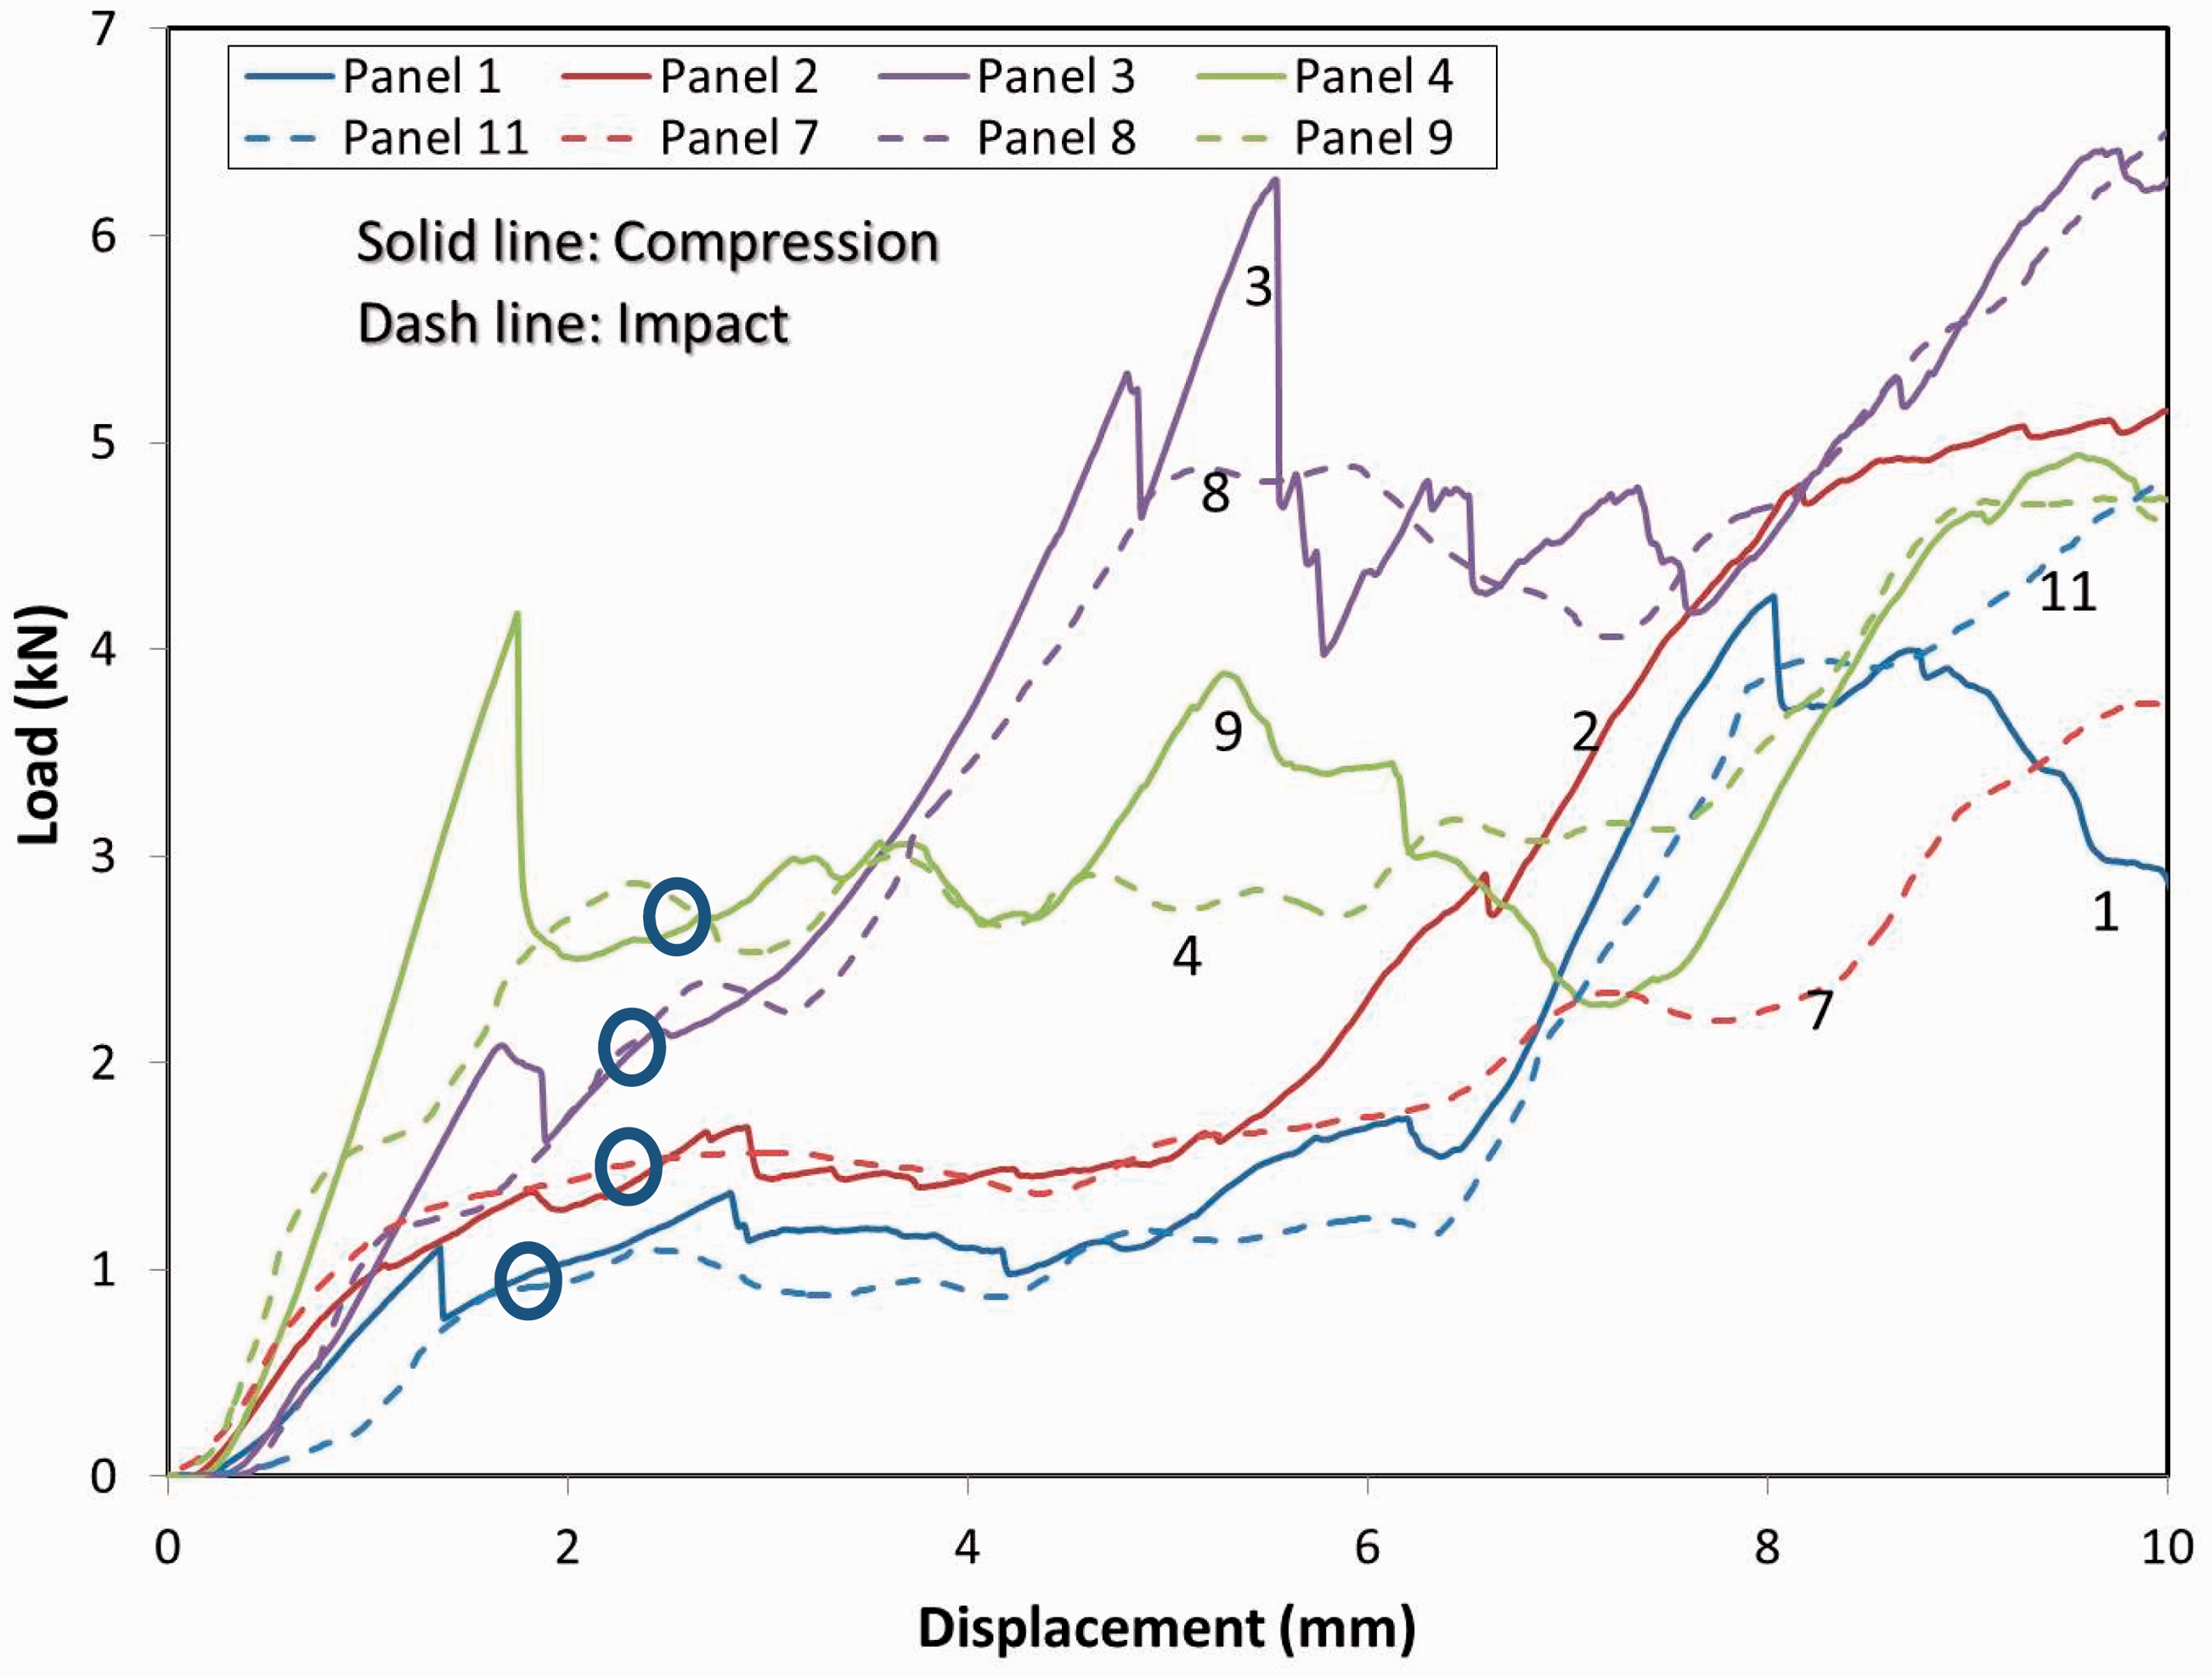
Conclusions
Experimental investigation on the shifted-tri-axial composite structural panels has been presented and analyzed by low-energy impact tests and quasi-static compression tests. For the low-energy impact test, the design variables significantly affected the impact response, the higher face stiffness or strength such as carbon fiber fabric composite face or thicker faces provided better impact capacity. Further, the foam filled core, between the ribs, provided much higher energy absorption within the core, thus preventing full-penetration failure at the bottom face. The combined triangular and hexagonal lattice elements in the structural core had an influence on the impact behavior and energy absorption. The triangular lattice center was stiffer and had higher energy absorption than the hexagonal lattice center. The contour plot of the panel core demonstrates the full field ultimate energy absorption characteristics. For the compression test, the results showed that both quasi-static compression and low-energy impact test had similar energy absorption trends, especially in the early phase of each test. The compression results might be used as reference to evaluate the low-velocity impact performance. All compressive peak loads for the panels were higher than the impact peak loads of the panels with the same configuration, respectively.
For future applications, the shifted-tri-axial composite structural panels could be engineered to achieve various impact performances for different requirements while reducing the weight and cost through optimizing the design configurations. The micro damage mechanism and finite element model could be used to further analyze and compare with the original tri-axial core design and structural panels in a possible subsequent study.
Footnotes
Declaration of Conflicting Interests
The author(s) declared no potential conflicts of interest with respect to the research, authorship, and/or publication of this article.
Funding
The author(s) received no financial support for the research, authorship, and/or publication of this article.