
Abstract
The glass fiber honeycomb sandwich panel is an efficient structural configuration which has been widely used in several designs related to air, sea, and land transport systems. Terahertz time domain spectroscopy technology is an effective supplementary method for nondestructive evaluation of composites. Terahertz time domain spectroscopy imaging technology in the reflection configuration was employed to detect the defects of glass fiber honeycomb sandwich panels, such as a skin-core debonding and a foreign inclusion. It was shown in systematic experimental investigation that different defects were detected through terahertz imaging based on different parameters, which were obtained by comparing and analyzing the waveforms in time and/or frequency domain between normal and defective regions of the sample.
Keywords
Introduction
Glass fiber honeycomb sandwich panel is fabricated by adhering two glass fiber facial sheets on a low-density honeycomb core. It is possible to obtain various desired performance by varying the facial sheets and the honeycomb core structure. They are immensely useful composite materials due to their excellent mechanical properties [1, 2], which have been increasingly used instead of metal materials for the construction of spacecraft and aircraft. They perform well in resistance to shock and impact, and constitute the best lightweight structure for a high bending stiffness. However, glass fiber honeycomb sandwich panels may be weakened by various defects during their lifecycle, such as delaminations, voids, debonding, mechanical/heat damage, and so on. Hence, nondestructive evaluation (NDE) technologies are needed to detect the defects, which are necessary for insuring the quality and structural soundness of glass fiber honeycomb sandwich panels. Traditional NDE technologies include permeation [3], ultrasonic [4], eddy current [5], magnetic powder [6], X-ray [7], and so on, each of which having its merits and deficiencies. For instance, liquid coupling may be required and the detection resolution is relatively poor for ultrasonic inspection method; only the surface and near surface defects of conductive materials can be detected with eddy current technology; and X-ray method is not safe to the human body due to the harmful radiation employed.
The terahertz (THz) wave is an electromagnetic wave that lies between the traditional microwave and the infrared light wave, with the frequency ranging from 0.1 to 10 THz. In the past two decades, THz technology has been developed tremendously, which has broad application prospects in medical science, security imaging and screening, and many others. THz time domain spectroscopy (TDS) technology is one of the most popular THz methods, with great potential for interior imaging of nonconductive and nonpolar materials with hidden defects, due to its strong penetrability and low photon energy radiation. As such, THz-TDS imaging has become a powerful complement of the traditional NDE technologies [8–10].
In recent years, a number of studies on the defect detection of glass fiber-reinforced polymer (GFRP) composites using THz technology have been reported. Rutz and Koch [11] investigated GFRP composites with different fiber laying directions using the THz-TDS system, and found that the refractive index and absorption coefficient of GFRP composites had no direct relationship with fiber laying direction. Naito et al. [12] measured two types of GFRP composites (PW-GFRP and 8H-GFRP) using the THz-TDS system. The real parts of the complex dielectric constant for both GFRP composites were almost frequency independent, whereas the imaginary parts increased linearly with frequency. Stoik et al. [13] employed THz-TDS in reflective mode to detect defects of GFRP composites, such as burn damage, puncture holes, hidden voids, and bending damage, etc. Jordens et al. [14] employed THz-TDS technology to study the fiber orientation and fiber content in GFRP composites. Naito et al. [15] examined the dielectric properties and carried out in situ noncontact damage evaluation of GFRP composites using a free-space microwave interference measurement system. The damage hidden in GFRP composites could be effectively detected through the variations of the dielectric constant. Pfleger et al. [16] employed a standard THz-TDS system to extract the birefringence and the orientation of the optical axis of GFRP composites from only two measurements. Ospald et al. [17] detected GFRP composites with various defects using a THz-TDS system, such as impact damage, delamination, and porosity, etc. Dong et al. [18] examined a woven GFRP laminate with a small region of forced delamination defect. The THz imaging had high contrast with the help of wavelet shrinkage de-noising, which removed water-vapor related spectral features.
In the previous studies, only a limited number of studies on the THz-NDE of GFRP composites exist, especially for glass fiber honeycomb sandwich panels. In this paper, THz-TDS reflected imaging technology was used to detect the defects of glass fiber honeycomb sandwich panels with a skin-core debonding defect and a foreign inclusion defect, respectively, which demonstrated the ability of THz wave to detect the defects nondestructively. For the glass fiber honeycomb sandwich panel with a foreign inclusion defect, the defect was detected through THz imaging based on a new parameter (the number of peaks), which was obtained by comparing and analyzing the waveforms in time domain between normal and defective regions of the sample. It also served to expand the repertoire of traditional THz imaging algorithms (peak-to-peak, time-of-flight, and the power at certain frequency, etc). In our previous work based on similar approaches, a series of studies had been conducted on defect detection of the carbon fiber reinforced polymer composites and fire-retardant coatings using a THz-TDS technique [19, 20]. The remainder of this paper is organized as follows: First, the THz-TDS imaging system and the imaging algorithm are briefly introduced in Experimental methods section. Results and discussion section describes in detail the experimental results and their analyses. Finally, concluding remarks and a summary are presented in the last section.
Experimental methods
THz imaging system
In this paper, all the experiments were performed in the reflection configuration using the T-Ray 5000 THz-TDS system from Advanced Photonix, Inc. (API). A Ti: Sapphire oscillator was used as a femtosecond laser source, which generated pulses of 1064 nm central wavelength, 80 fs duration, 100 MHz repetition rate, and 20 mW average power. The time domain range was from 0 to 80 ps with 0.1 ps resolution, and the effective spectral measurement range was from 75 GHz to 1.5 THz with 12.5 GHz resolution. The THz imaging in the reflection configuration was accomplished by scanning the transceiver of the THz wave. The maximum scanning range of the two dimensional motor stage was 30 × 30 cm2, and the minimum scanning step size was 0.1 mm in both vertical and horizontal directions. Furthermore, with the high-speed waveform acquisition, an image could be acquired at a pixel rate of 800 pixels per second.
Imaging algorithm
In the process of imaging, the time domain waveform is first acquired for each space point of the sample, and then a Fourier transform is performed to obtain the corresponding frequency domain waveform. For the traditional THz imaging algorithms, the Fourier transform is carried out for the entire time domain waveform. Finally, an image can be built up pixel by pixel based on the specific information from the time or frequency domain waveforms, such as maximum peak, minimum peak, peak-to-peak, etc. in time domain; and amplitude, phase, refractive index, absorption coefficient, etc. at certain frequency in the frequency domain. For each different sample, the information which can produce the best imaging effect must be individually determined, and is generally different from sample to sample.
Refractive index
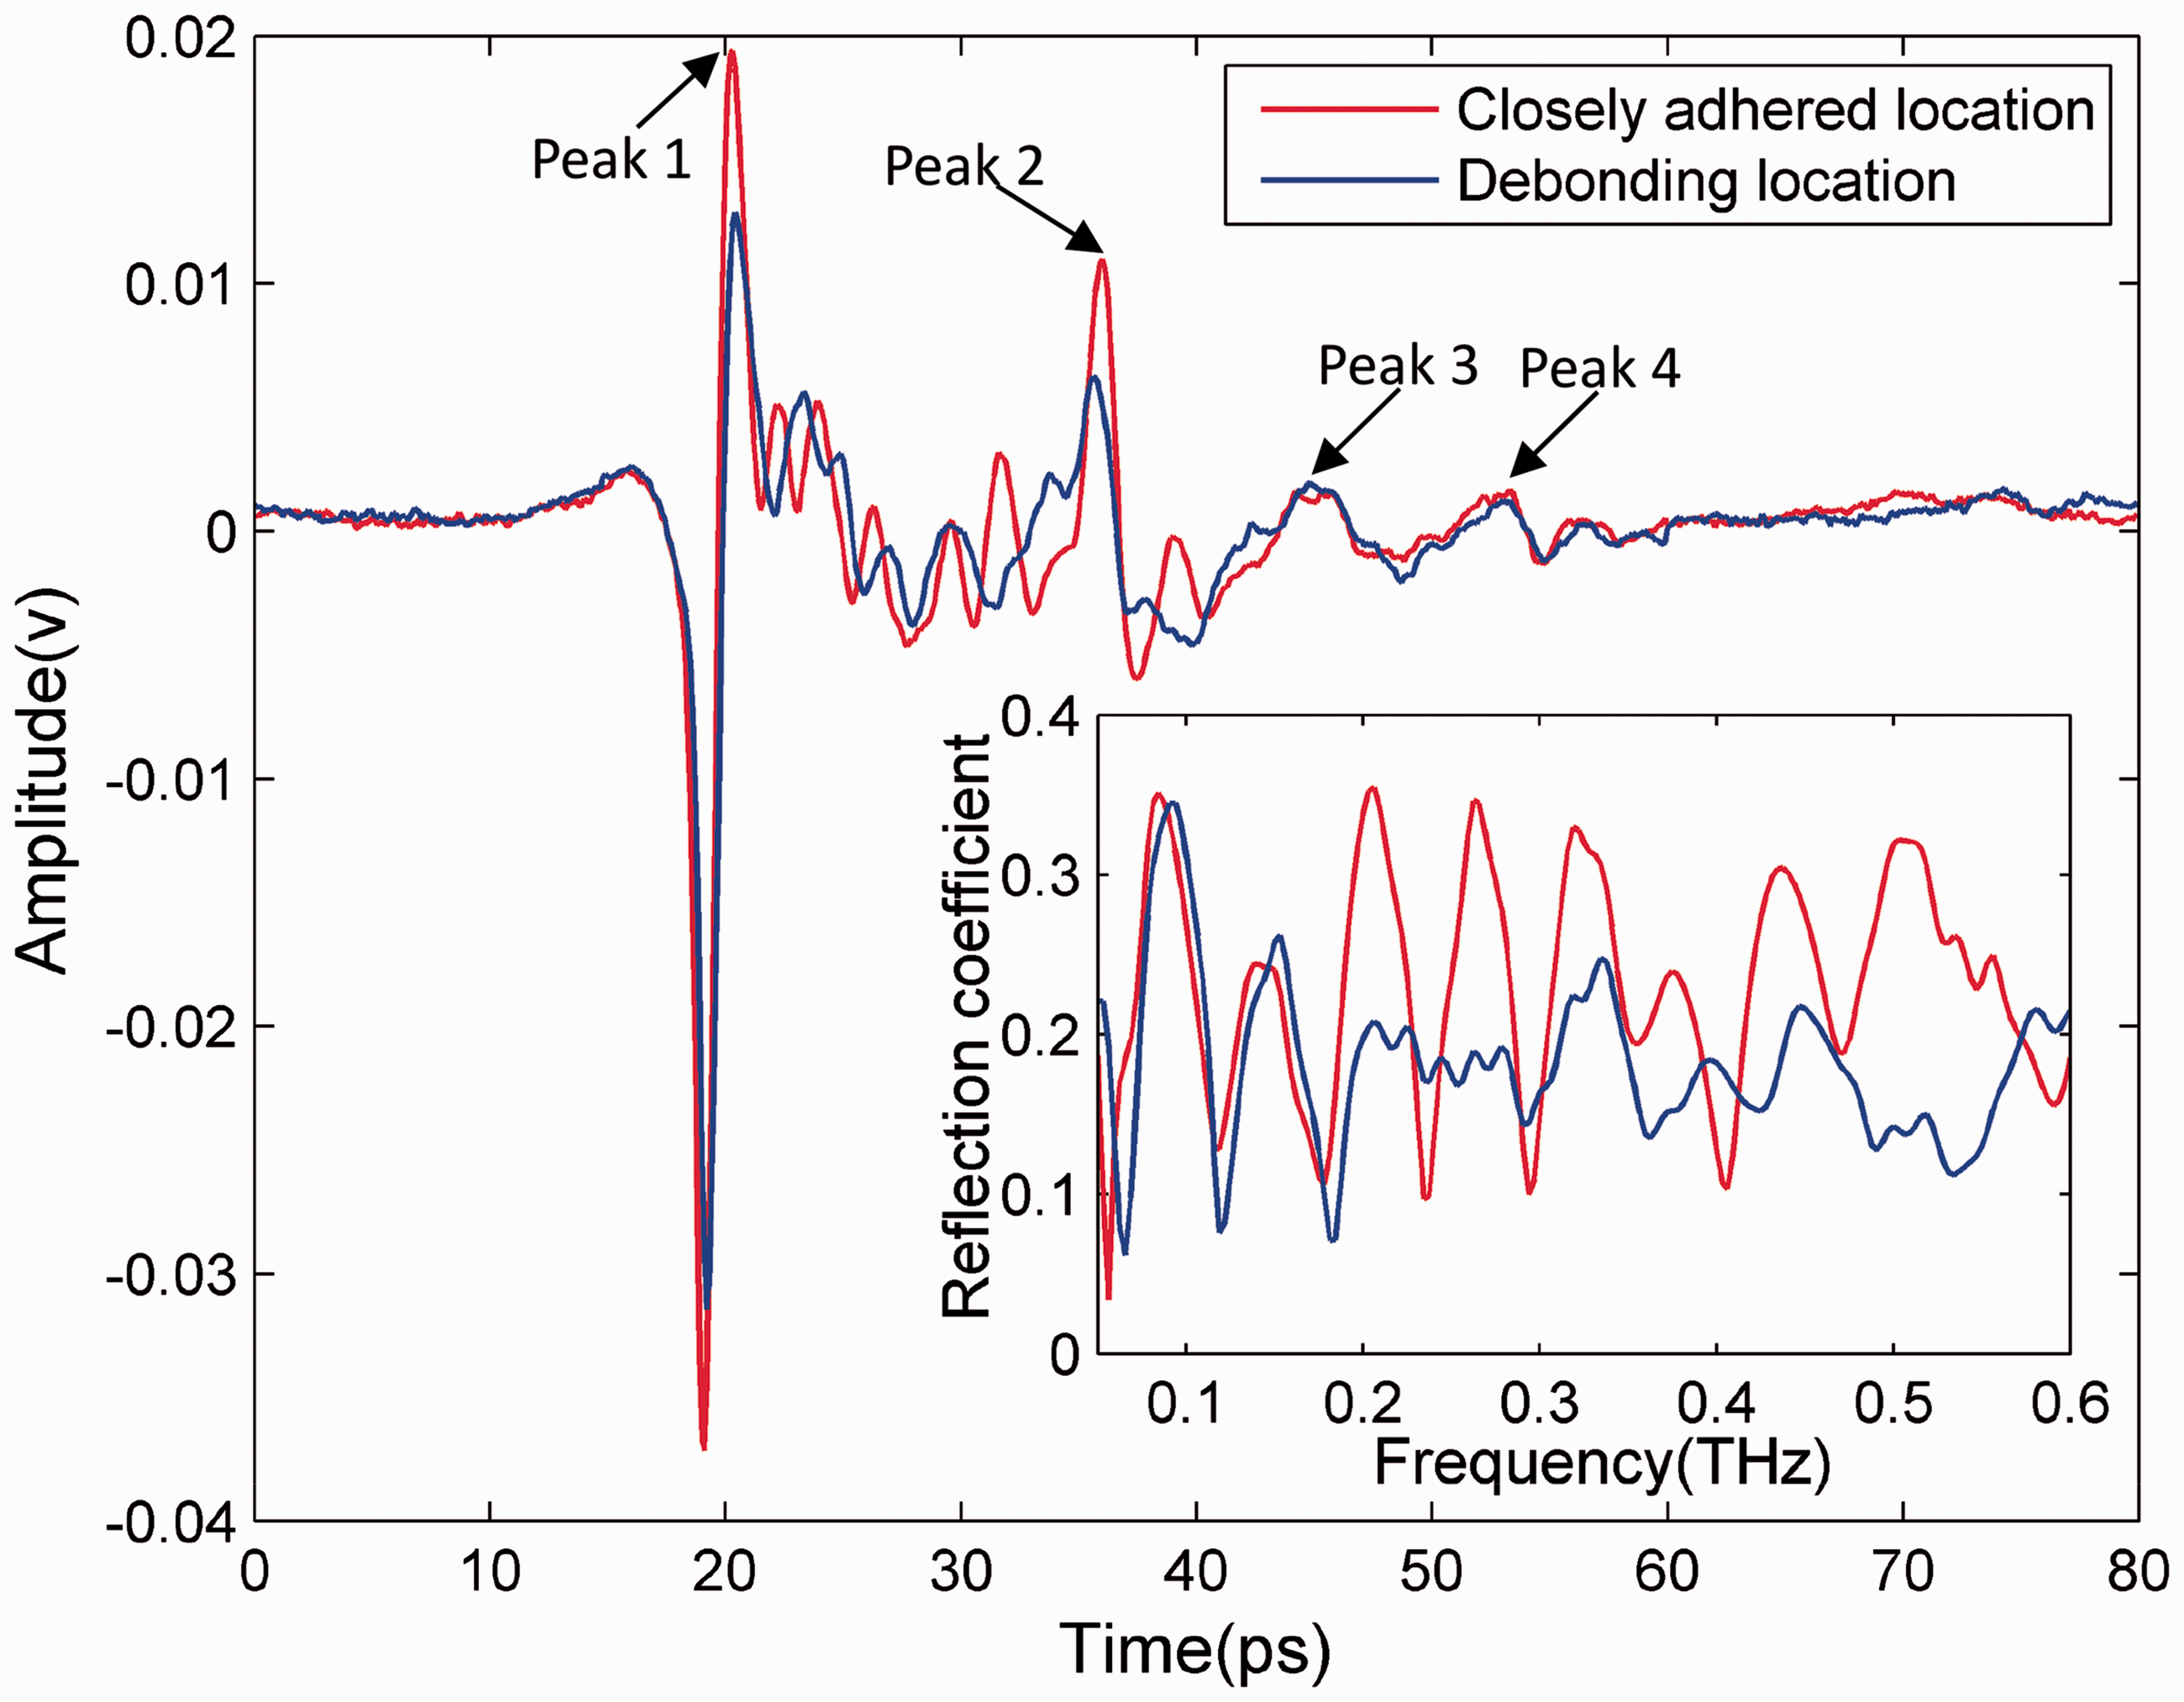
When THz wave is normally incident, the refractive index in the reflection configuration can be calculated based on the optical path length difference between the front and back reflections in the time domain [21], which is expressed as follows
Results and discussion
A glass fiber honeycomb sandwich panel with a skin-core debonding defect
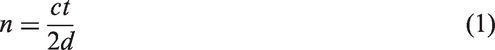
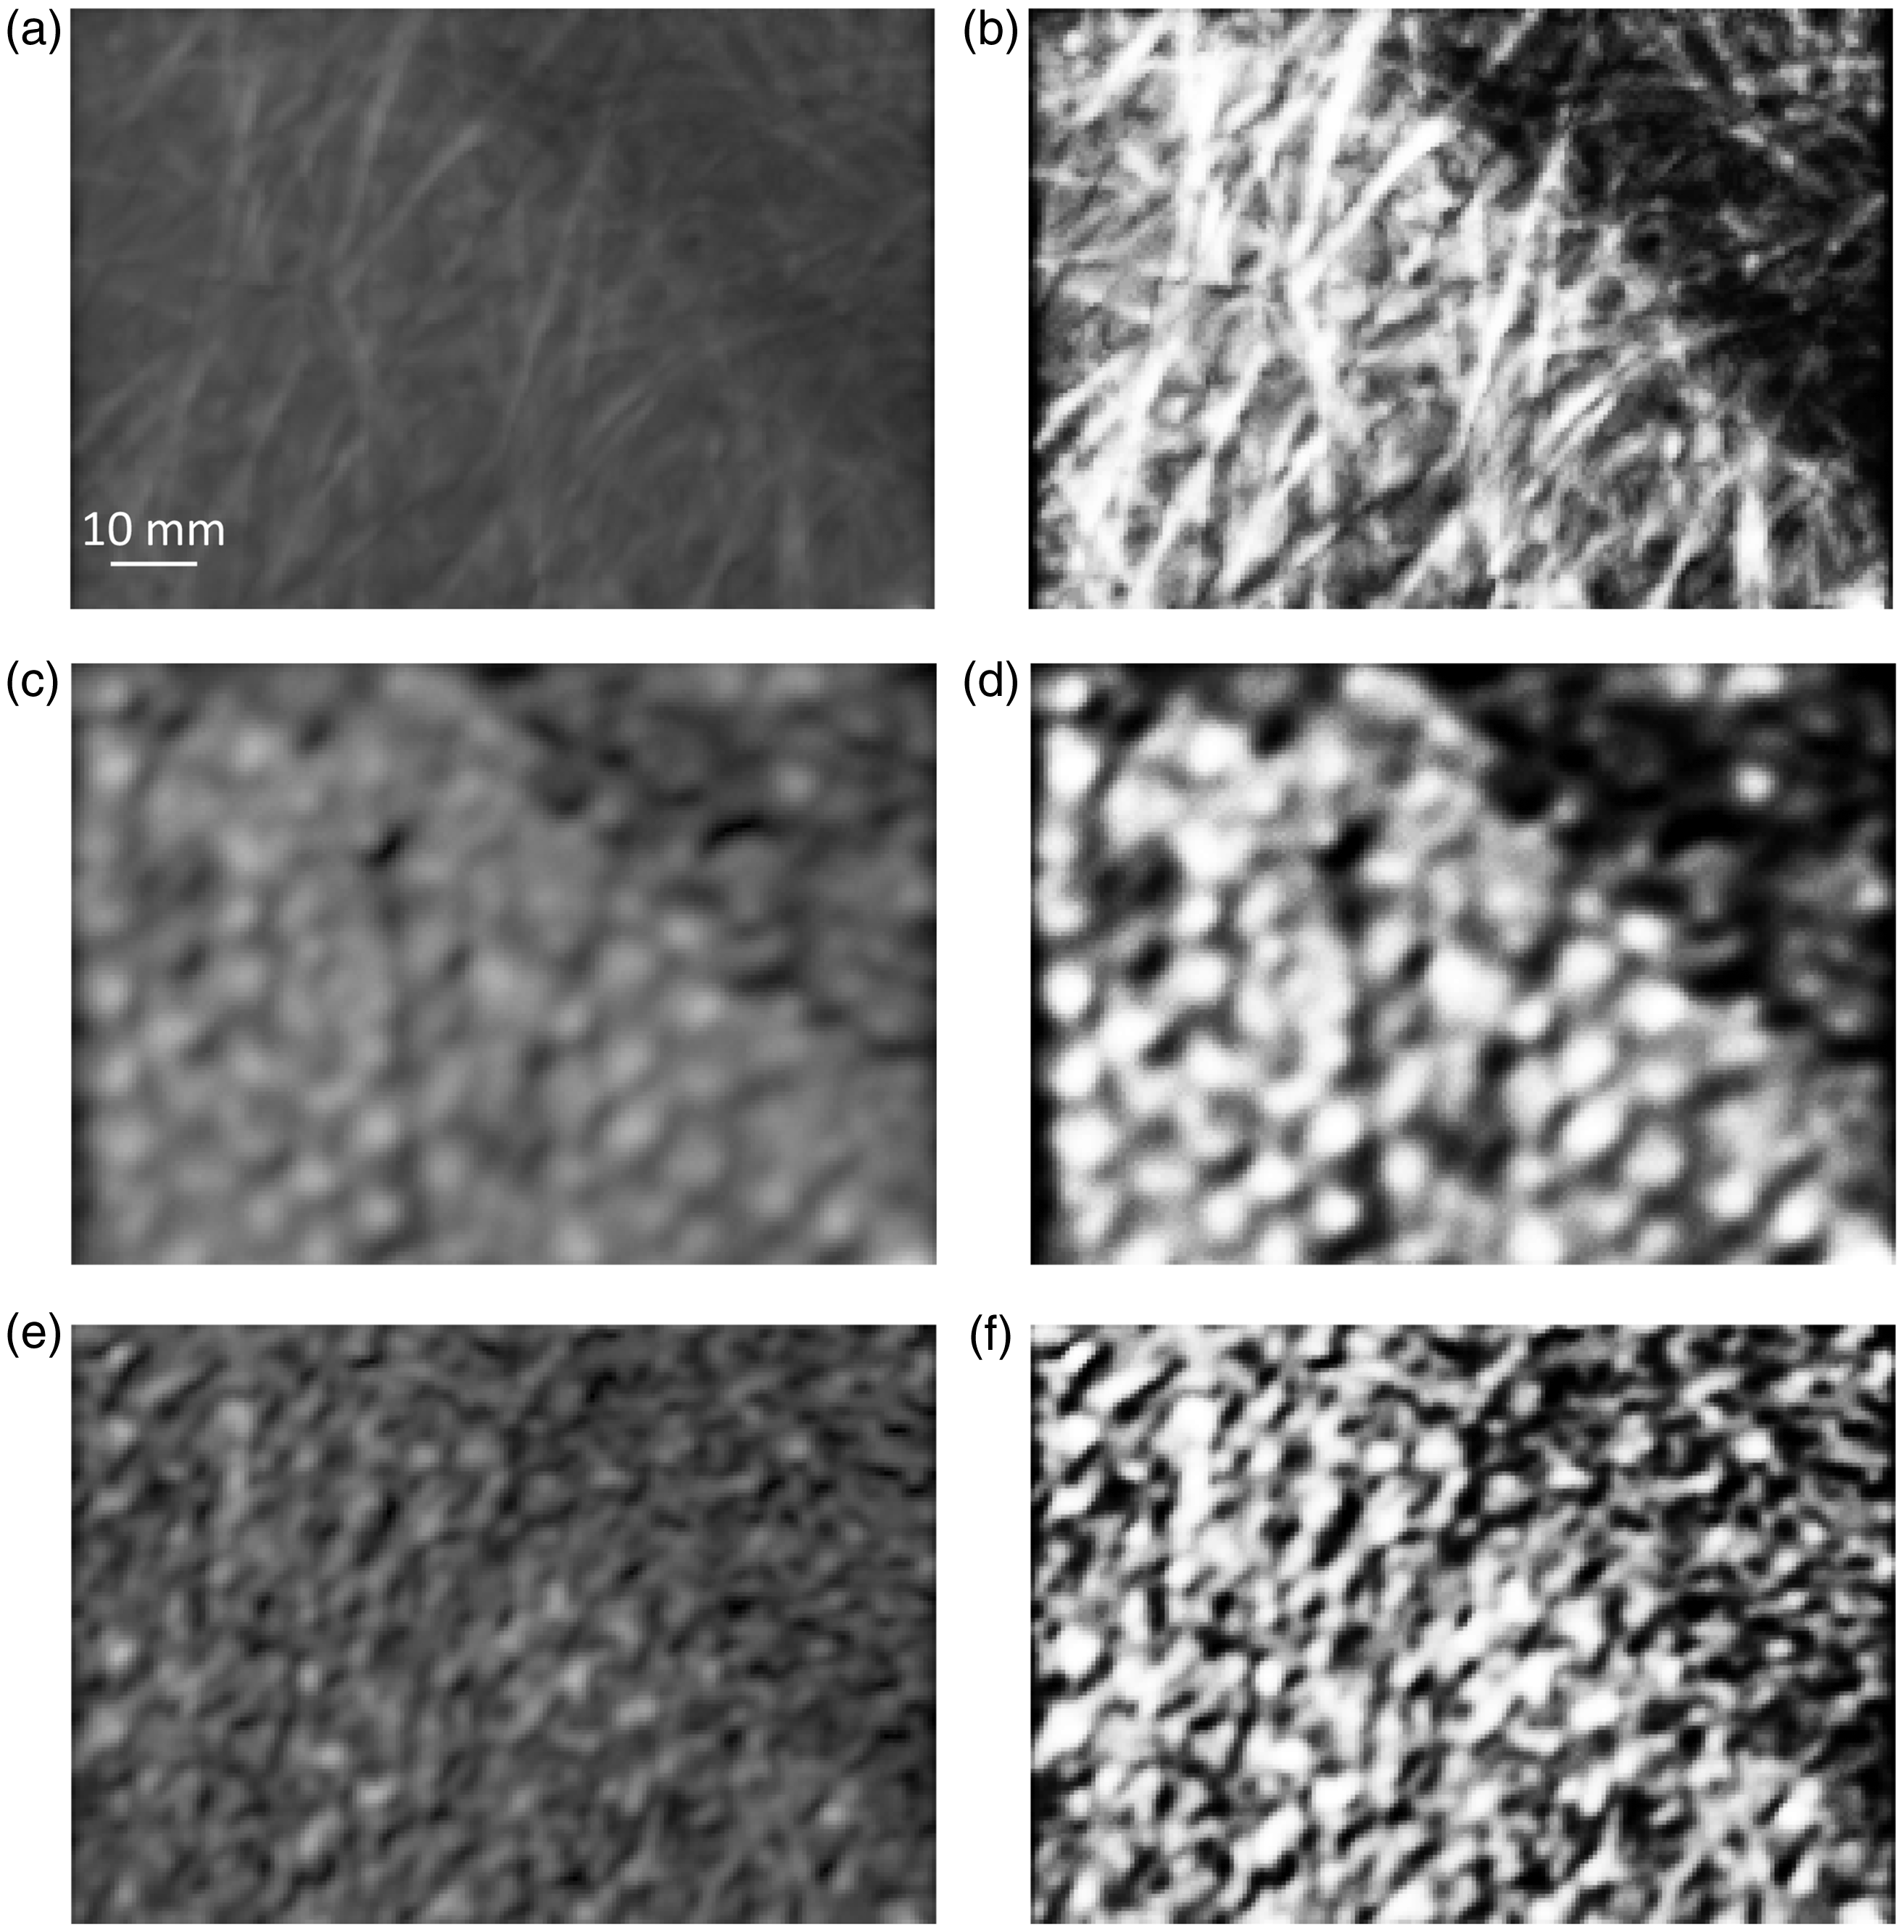
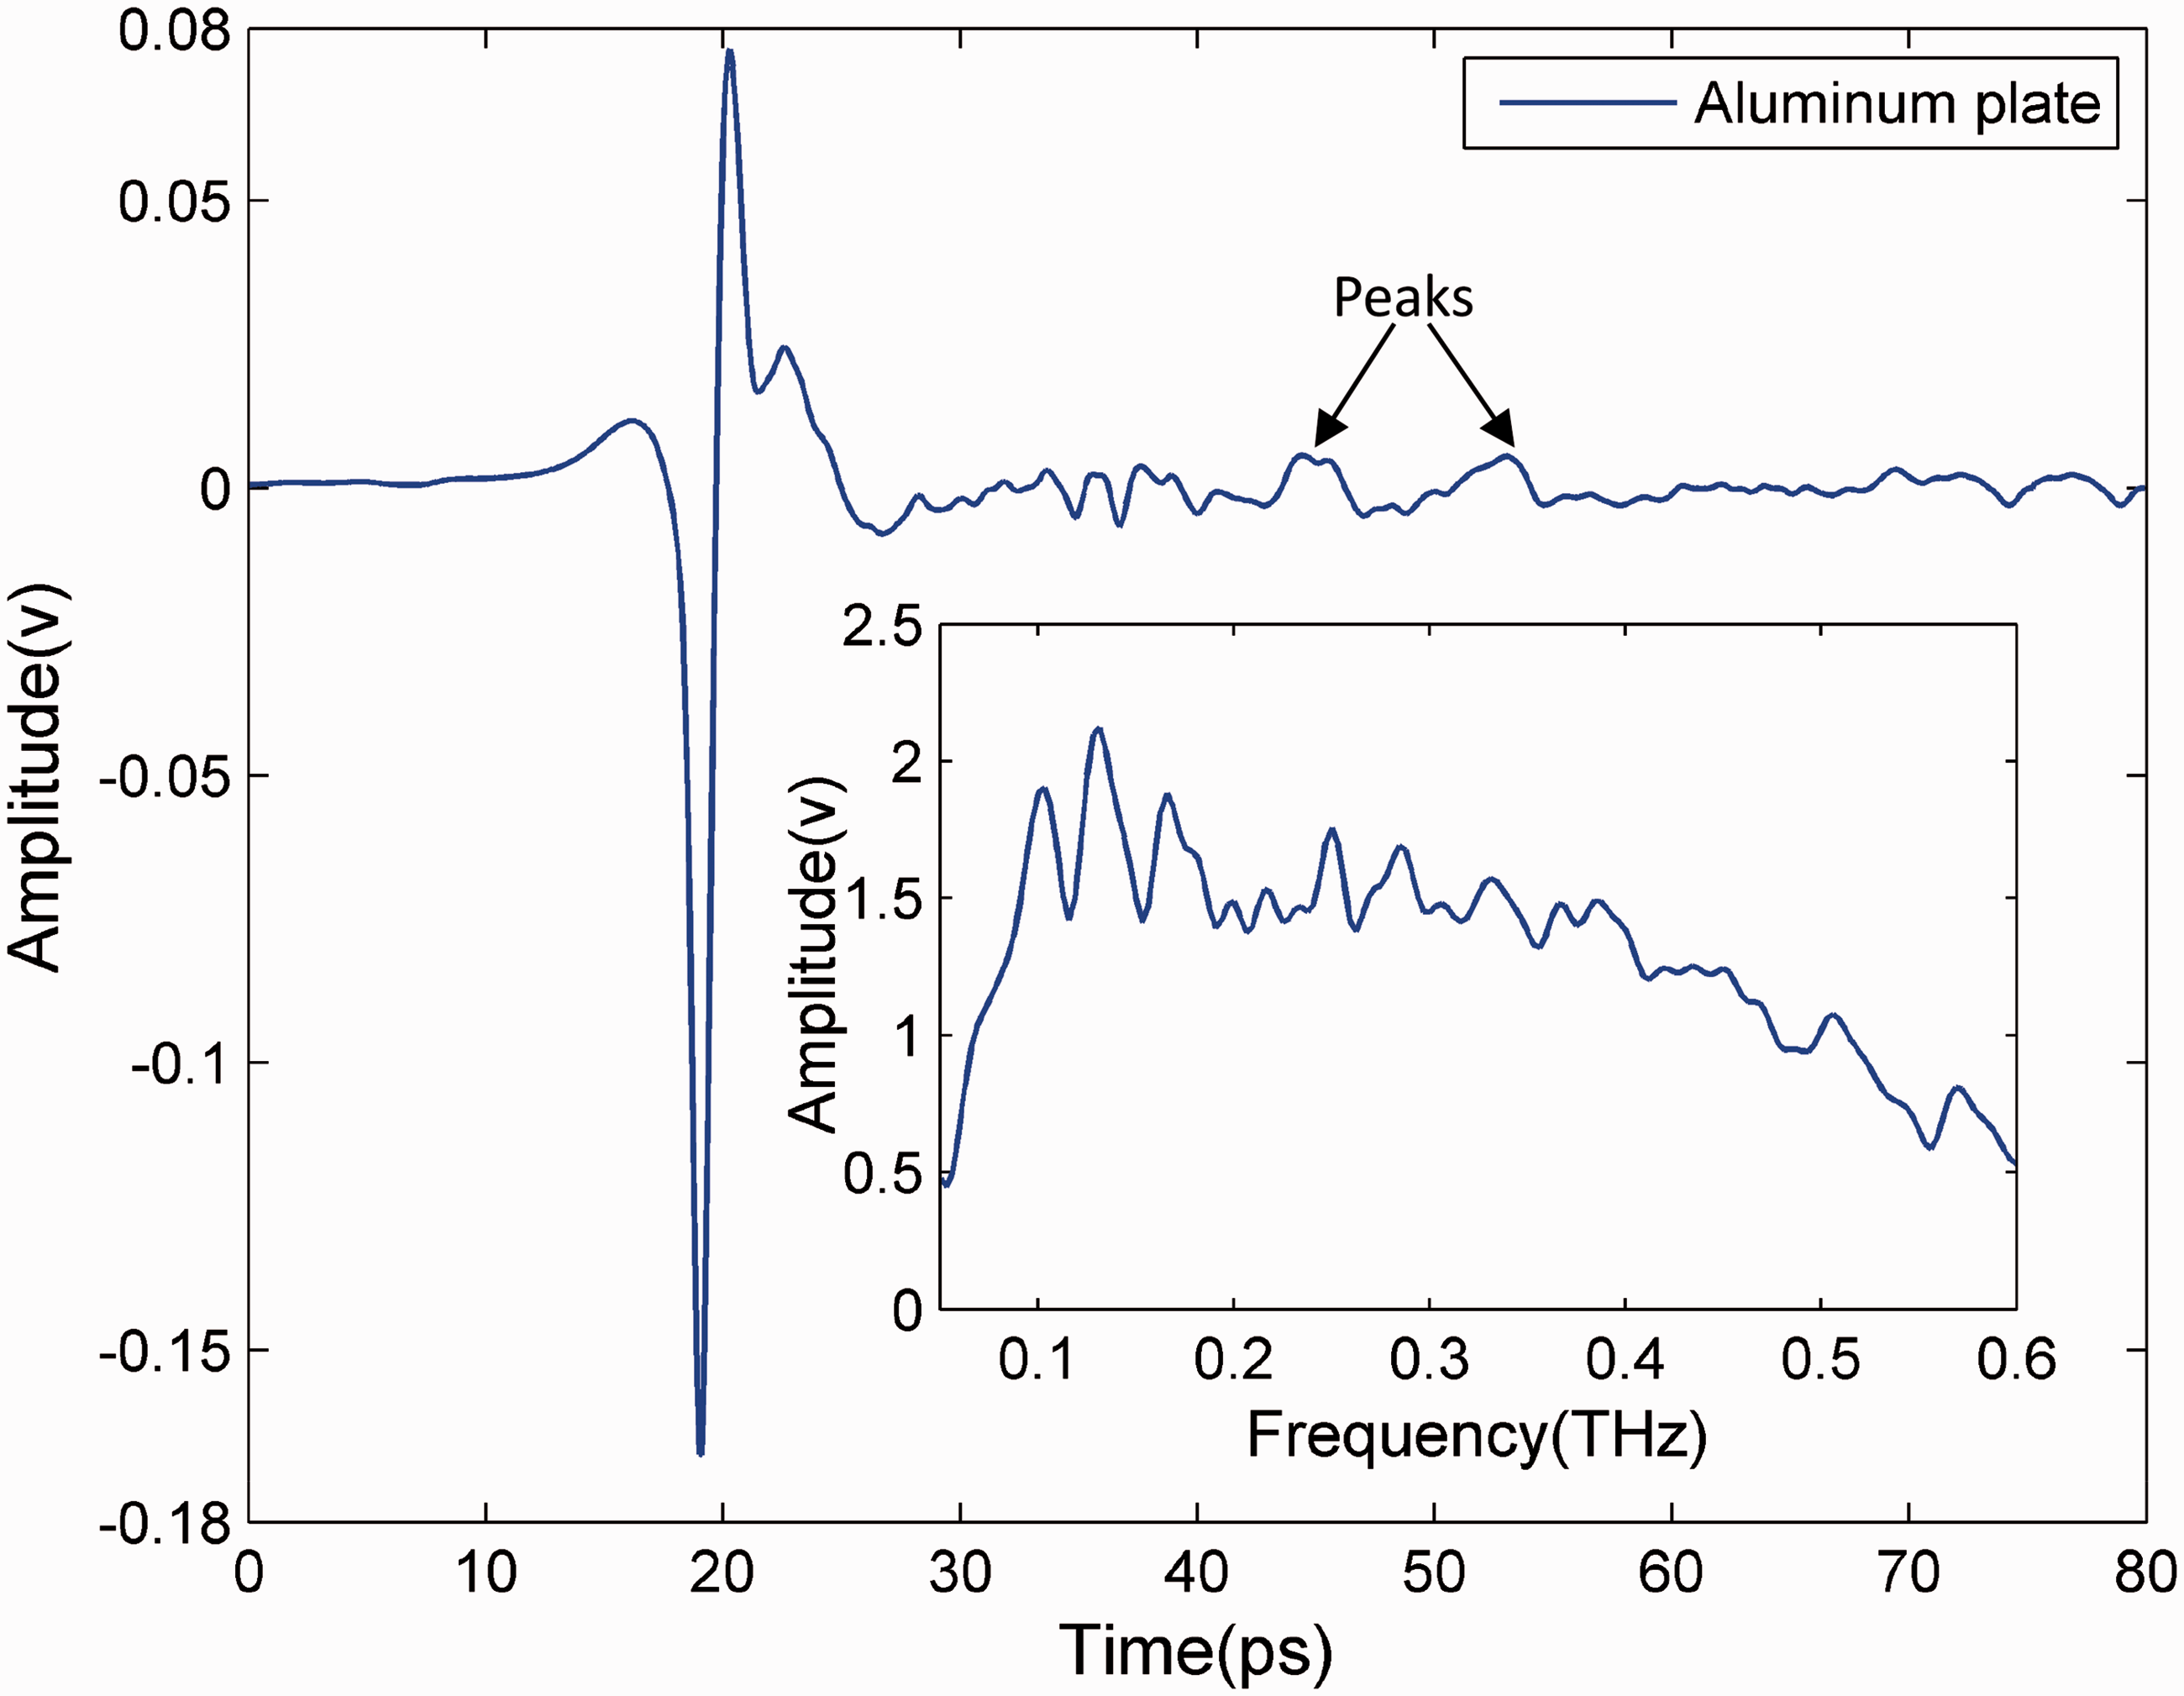
Figure 1 shows the optical images of the glass fiber honeycomb sandwich panel with a skin-core debonding defect. The GFRP panel skins (1 mm thickness) are adhered to the polypropylene honeycomb core (18 mm thickness) through an epoxy resin adhesive. In the upper right corner of the sample, the skin is deliberately debonded, resulting in a debonded zone with an air gap, which is outlined in the black dashed-line enclosed region of Figure 1(a). The side with debonding defect is defined as the front side, and the other is the rear side (see Figure 1(b)). The defect cannot be detected from the rear side, because the time delay of the reflection from the debonding defect in this case is beyond the time domain range of our system (80 ps). Hence, all the experimental results in this subsection are measured from the front side. The THz reflective imaging results are shown in Figure 2. Here, the peak-to-peak value in time domain and the amplitude reflection coefficients at 0.2 and 0.35 THz in frequency domain are respectively selected for imaging. The amplitude reflection coefficient is the reflected THz amplitude spectrum from the sample divided by that from the reference (an aluminum plate). In this experiment, the closely adhered region is the best focus position of the THz wave, whereas the debonded region is slightly outside the optimal depth of focus due to the upward-bulging skin. Hence, the reflected THz wave from the closely adhered region is stronger than that from the debonded region. As can be seen from Figure 2, the image gray value of the closely adhered region is higher than that of the debonded region. After an image enhancement process of histogram equalization [22] for Figure 2(a), (c), and (e), the defect becomes much clearer, as shown in Figure 2(b), (d), and (f). Figure 3 shows the reflectivity comparison between the closely adhered and debonded region. As can be seen from Figure 3, the reflected signal from the closely adhered region is indeed stronger than that from the debonded region on the whole. The first two main peaks (Peak 1 and 2) of the reflected time domain waveforms are respectively caused by the front and rear surfaces of the skin, whereas the third and fourth peaks (Peak 3 and 4) are from the system. Figure 4 shows the THz reflected time domain waveform measured on the reference. Through the comparison between Figures 3 and 4, it is found that the THz reflected time domain waveform of the reference contains the same peaks as the third and fourth peaks (Peak 3 and 4) in Figure 3. Hence, it is concluded that the third and fourth peaks in Figure 3 are from the system. From Figure 2(a), the internal honeycomb structure of the sample cannot be seen. This is because that the peak-to-peak value is from the first reflected THz pulse (Peak 1), which corresponds to the reflection of the front surface of the skin. As can be seen from Figure 2(c), the honeycomb inside the sample is visible. The frequency domain information in this subsection is obtained after the Fourier transform for the whole reflected time domain waveform. Hence, the amplitude reflection coefficient at 0.2 THz carries the internal information of the sample. The lateral resolution of the THz-TDS imaging system is usually determined by the focal spot size. The smaller the spot is, the better the resolution becomes. In addition, the spot size of the THz beam increases with the decrease of the frequency. As can be seen from the comparison between Figure 2(c) and (e), Figure 2(c) is more blurred due to the worse resolution. The scanning step size in this experiment is 0.5 mm.
Optical images of the glass fiber honeycomb sandwich panel with a skin-core debonding defect: (a) a front view and (b) a side view. The reflective imaging results of the sample: (a) the peak-to-peak amplitude image in time domain, (b) the result after an image enhancement process of (a), (c) the THz amplitude reflection coefficient image at 0.2 THz, (d) the result after an image enhancement process of (c), (e) the THz amplitude reflection coefficient image at 0.35 THz, and (f) the result after an image enhancement process of (e). The reflectivity comparison between the closely adhered and debonded region. The THz reflected time domain waveform measured on the reference (an aluminum plate).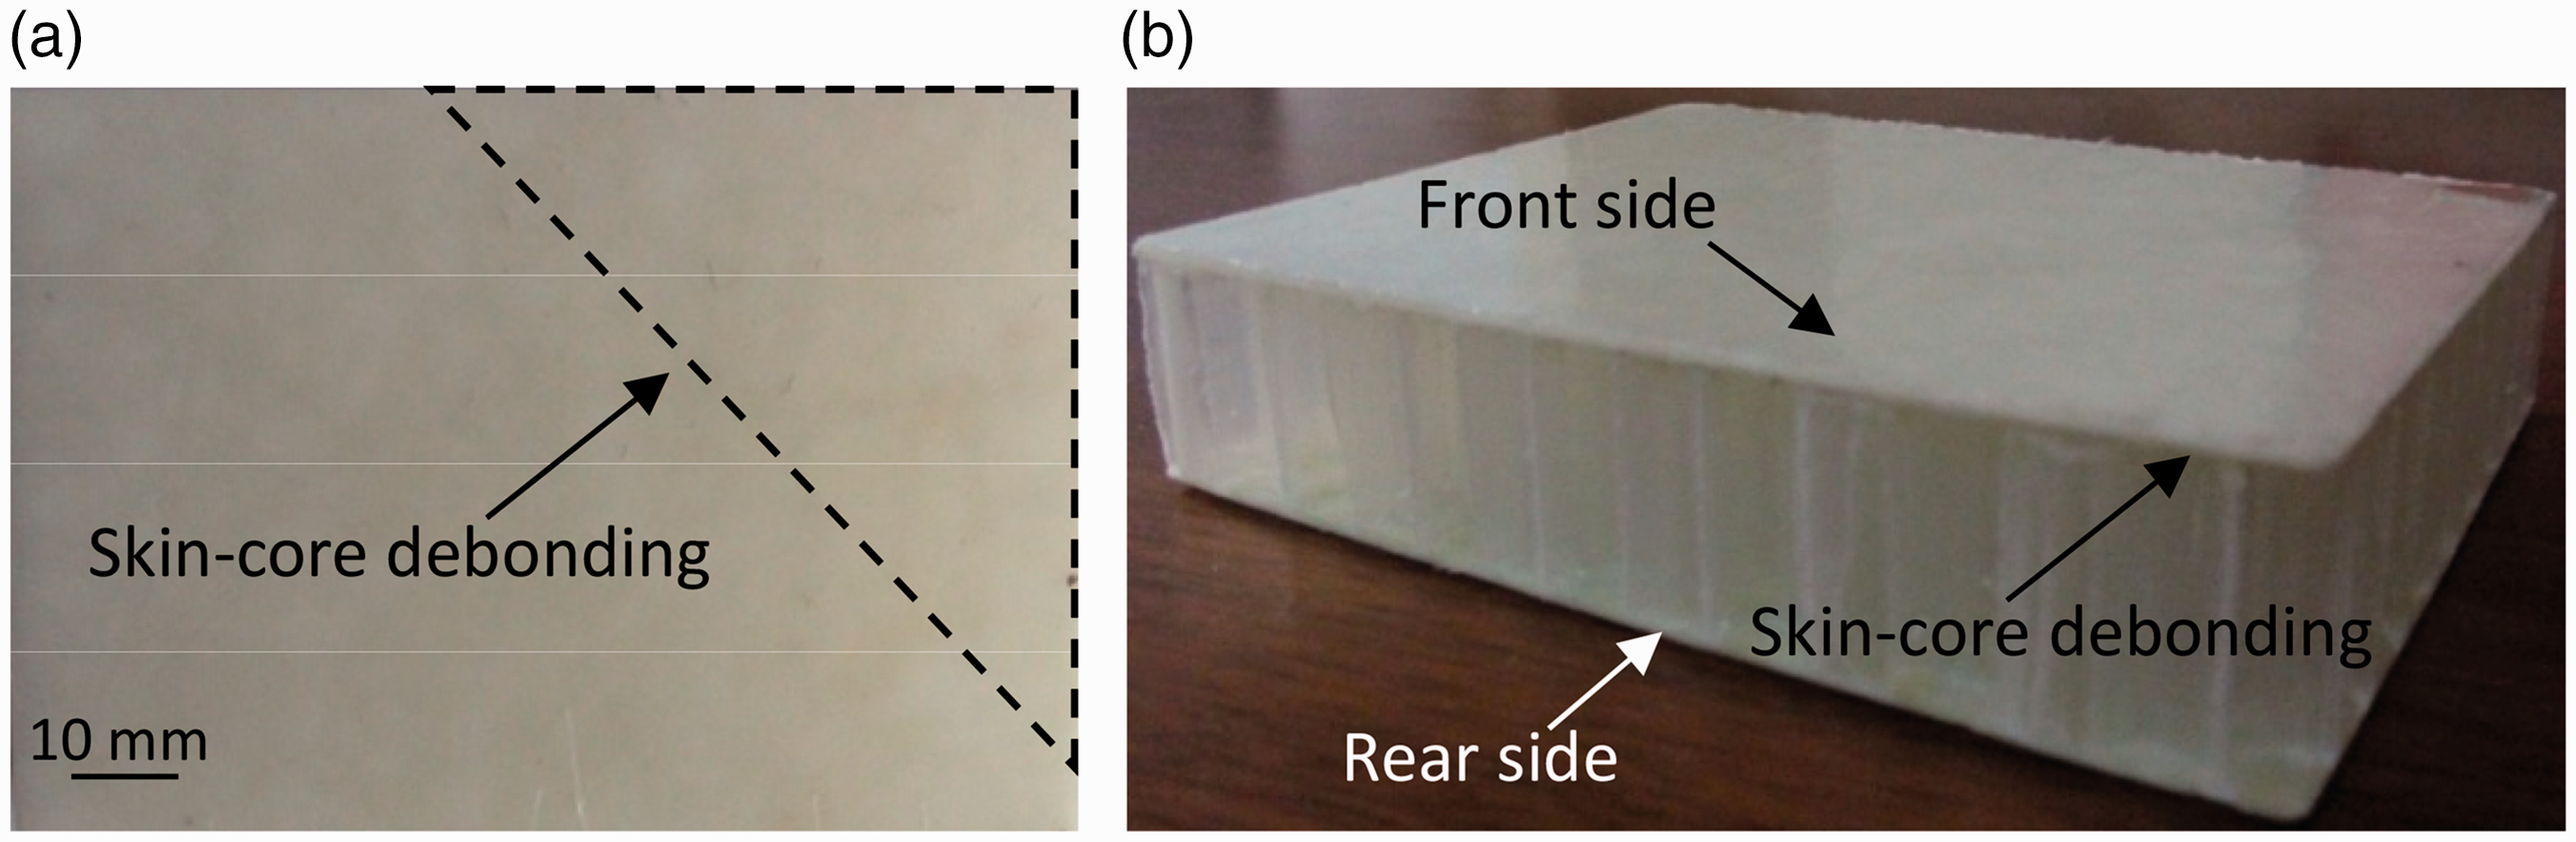
A glass fiber honeycomb sandwich panel with a foreign inclusion defect
Figure 5 shows the optical images of the glass fiber honeycomb sandwich panel with a foreign inclusion defect. The GFRP panel skins (1 mm thickness) are adhered to the Nomex honeycomb core (9 mm thickness) through the J-47C structure adhesive. The overall size of the sample is 100 mm (length) × 100 mm (width) × 11 mm (height). The Teflon sheet (20 × 20 × 0.1 mm3) is inserted between the front skin and the adhesive to simulate a foreign inclusion defect. The thickness of the structure adhesive for the region without defect is about 0.2 mm, whereas it is about 0.1 mm for the region with defect. The side with a foreign inclusion defect is defined as the front side, and the other is the rear side (see Figure 5(b)). In this experiment, the defect can only be detected from the front side, and the reason is the same as that mentioned in the previous subsection. Hence, all the experimental results in this subsection are also measured from the front side.
Optical images of the glass fiber honeycomb sandwich panel with a foreign inclusion defect: (a) a front view and (b) a side view.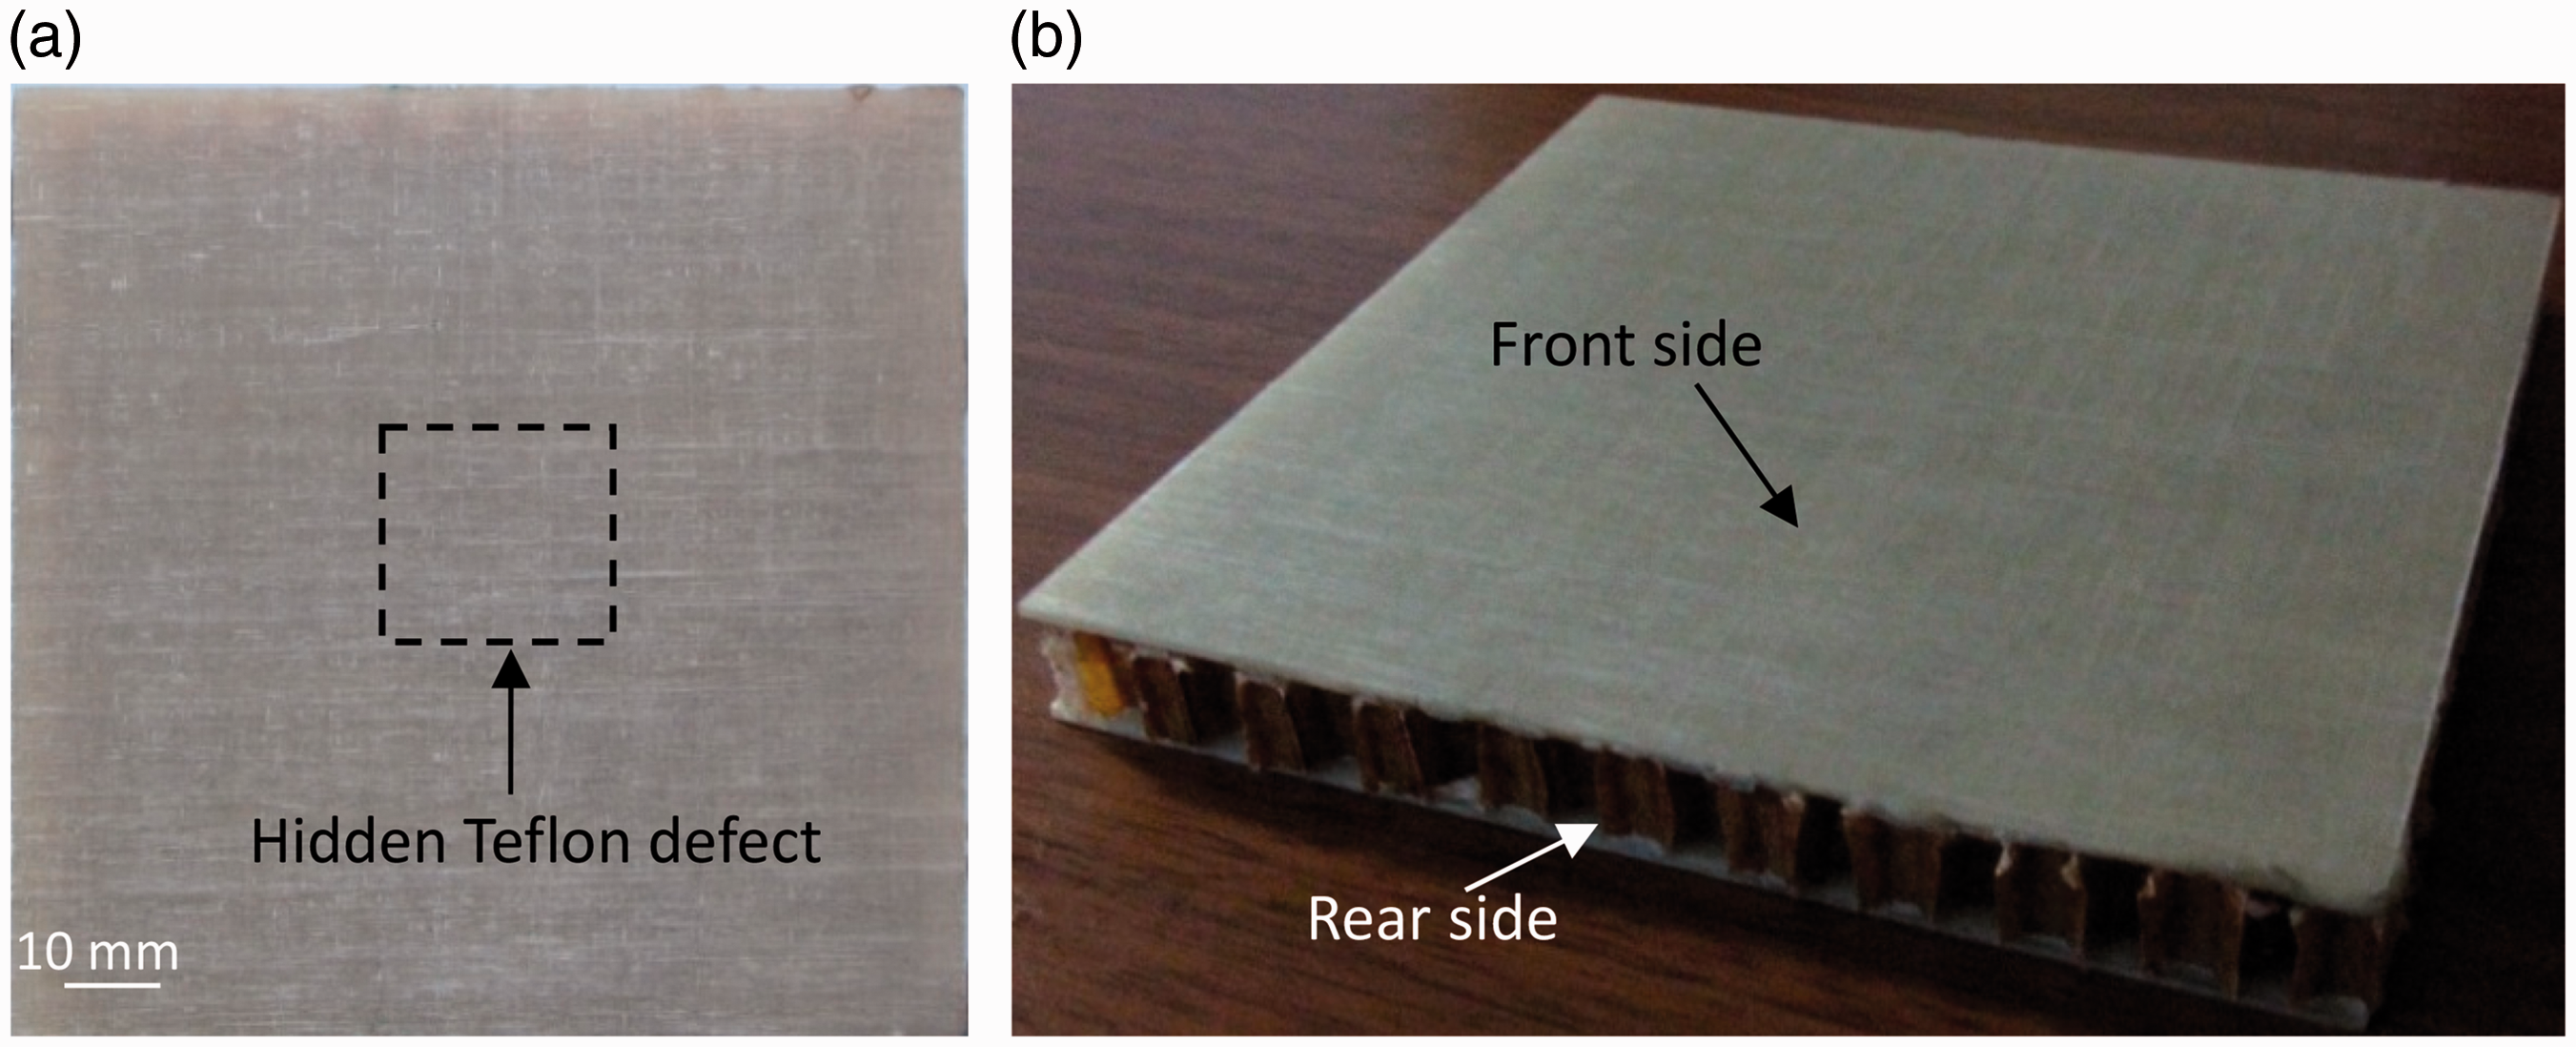
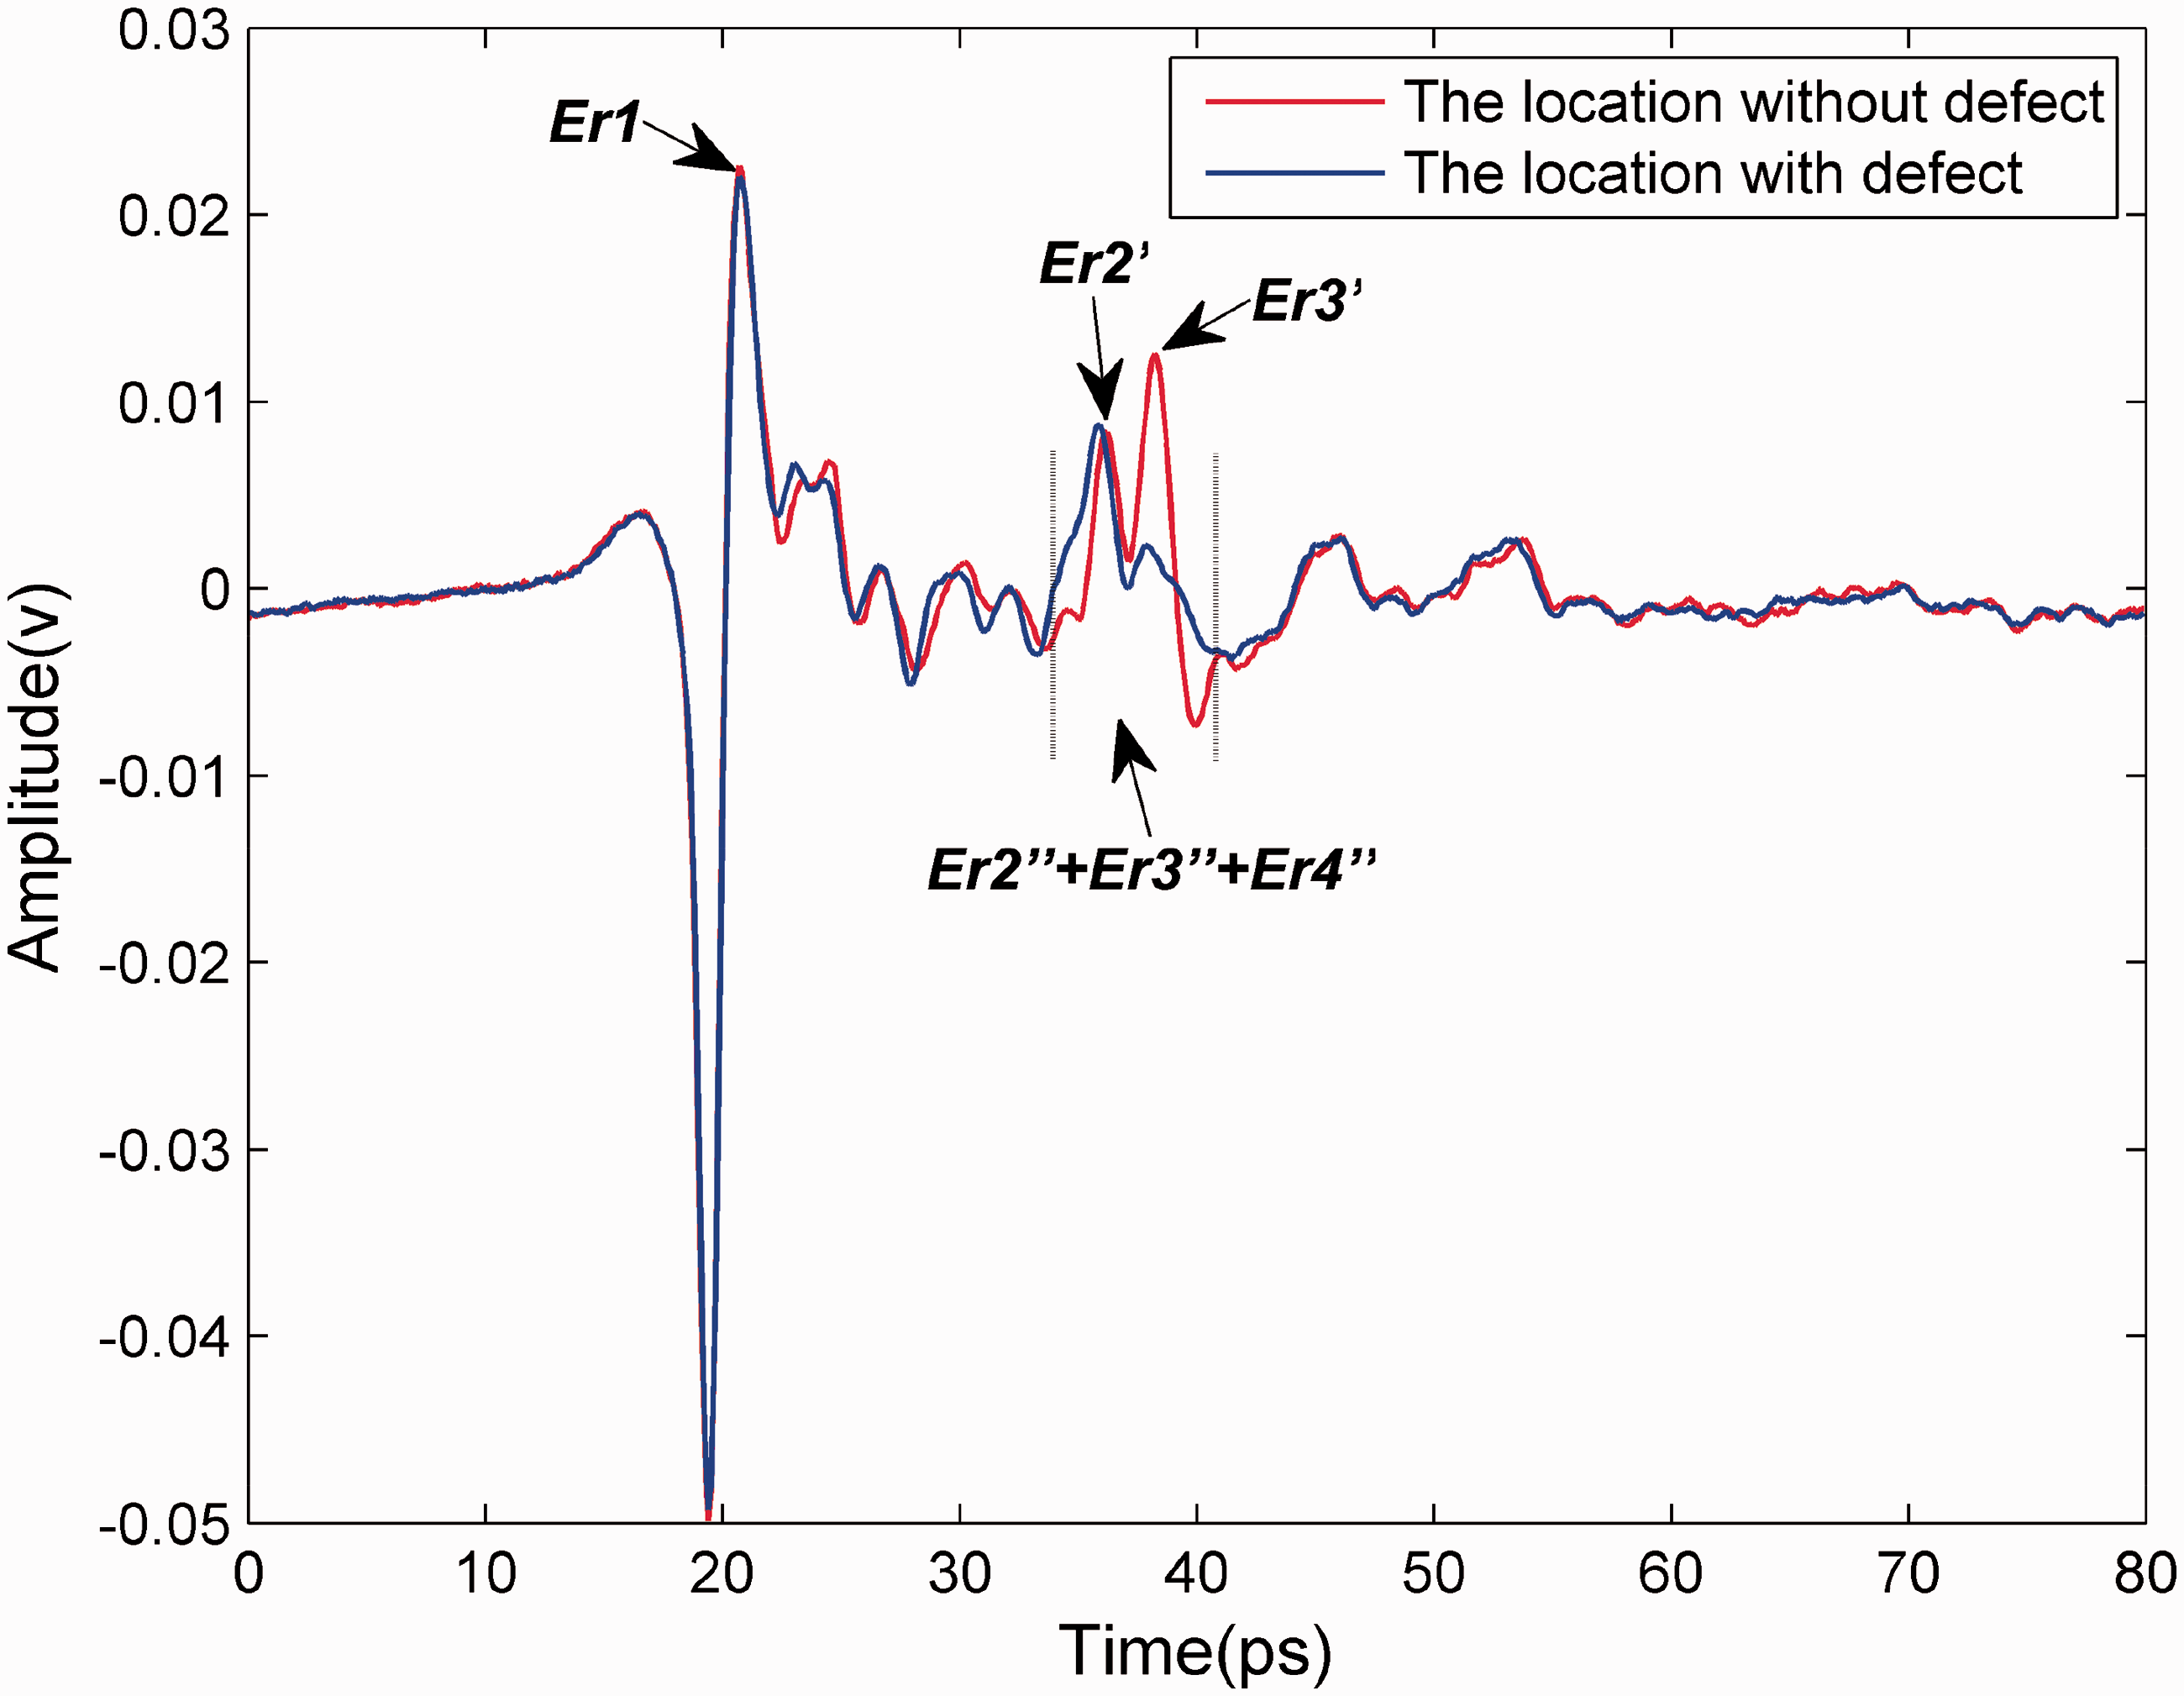
Because THz wave is normally incident, the theoretically estimated reflected THz pulses from various interfaces of the sample are shown in Figure 6. For the region without defect, the reflected THz waveform is expected to be composed as follows
The theoretically estimated reflected THz pulses from various interfaces under normal incidence. The reflected time domain waveforms measured on the sample with and without defect.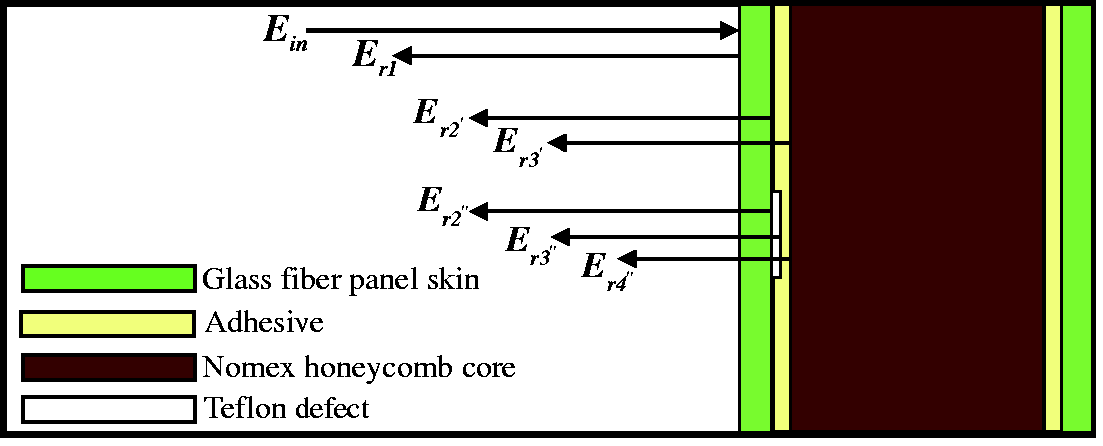


The THz reflective imaging results are shown in Figure 8. Here, three different imaging algorithms are used to detect the defect. In the first algorithm, the Fourier transform is carried out for the whole reflected time domain waveform, which is used in the traditional THz imaging algorithm. Finally, the amplitude at 0.35 THz in frequency domain is selected for the imaging. In the second algorithm, the reflected THz pulse of The reflective imaging results of the sample: (a) the THz amplitude image at 0.35 THz using the first algorithm, (b) the THz amplitude image at 0.35 THz using the second algorithm, (c) the THz imaging result using the third algorithm, and (d) the result after image processing of (c).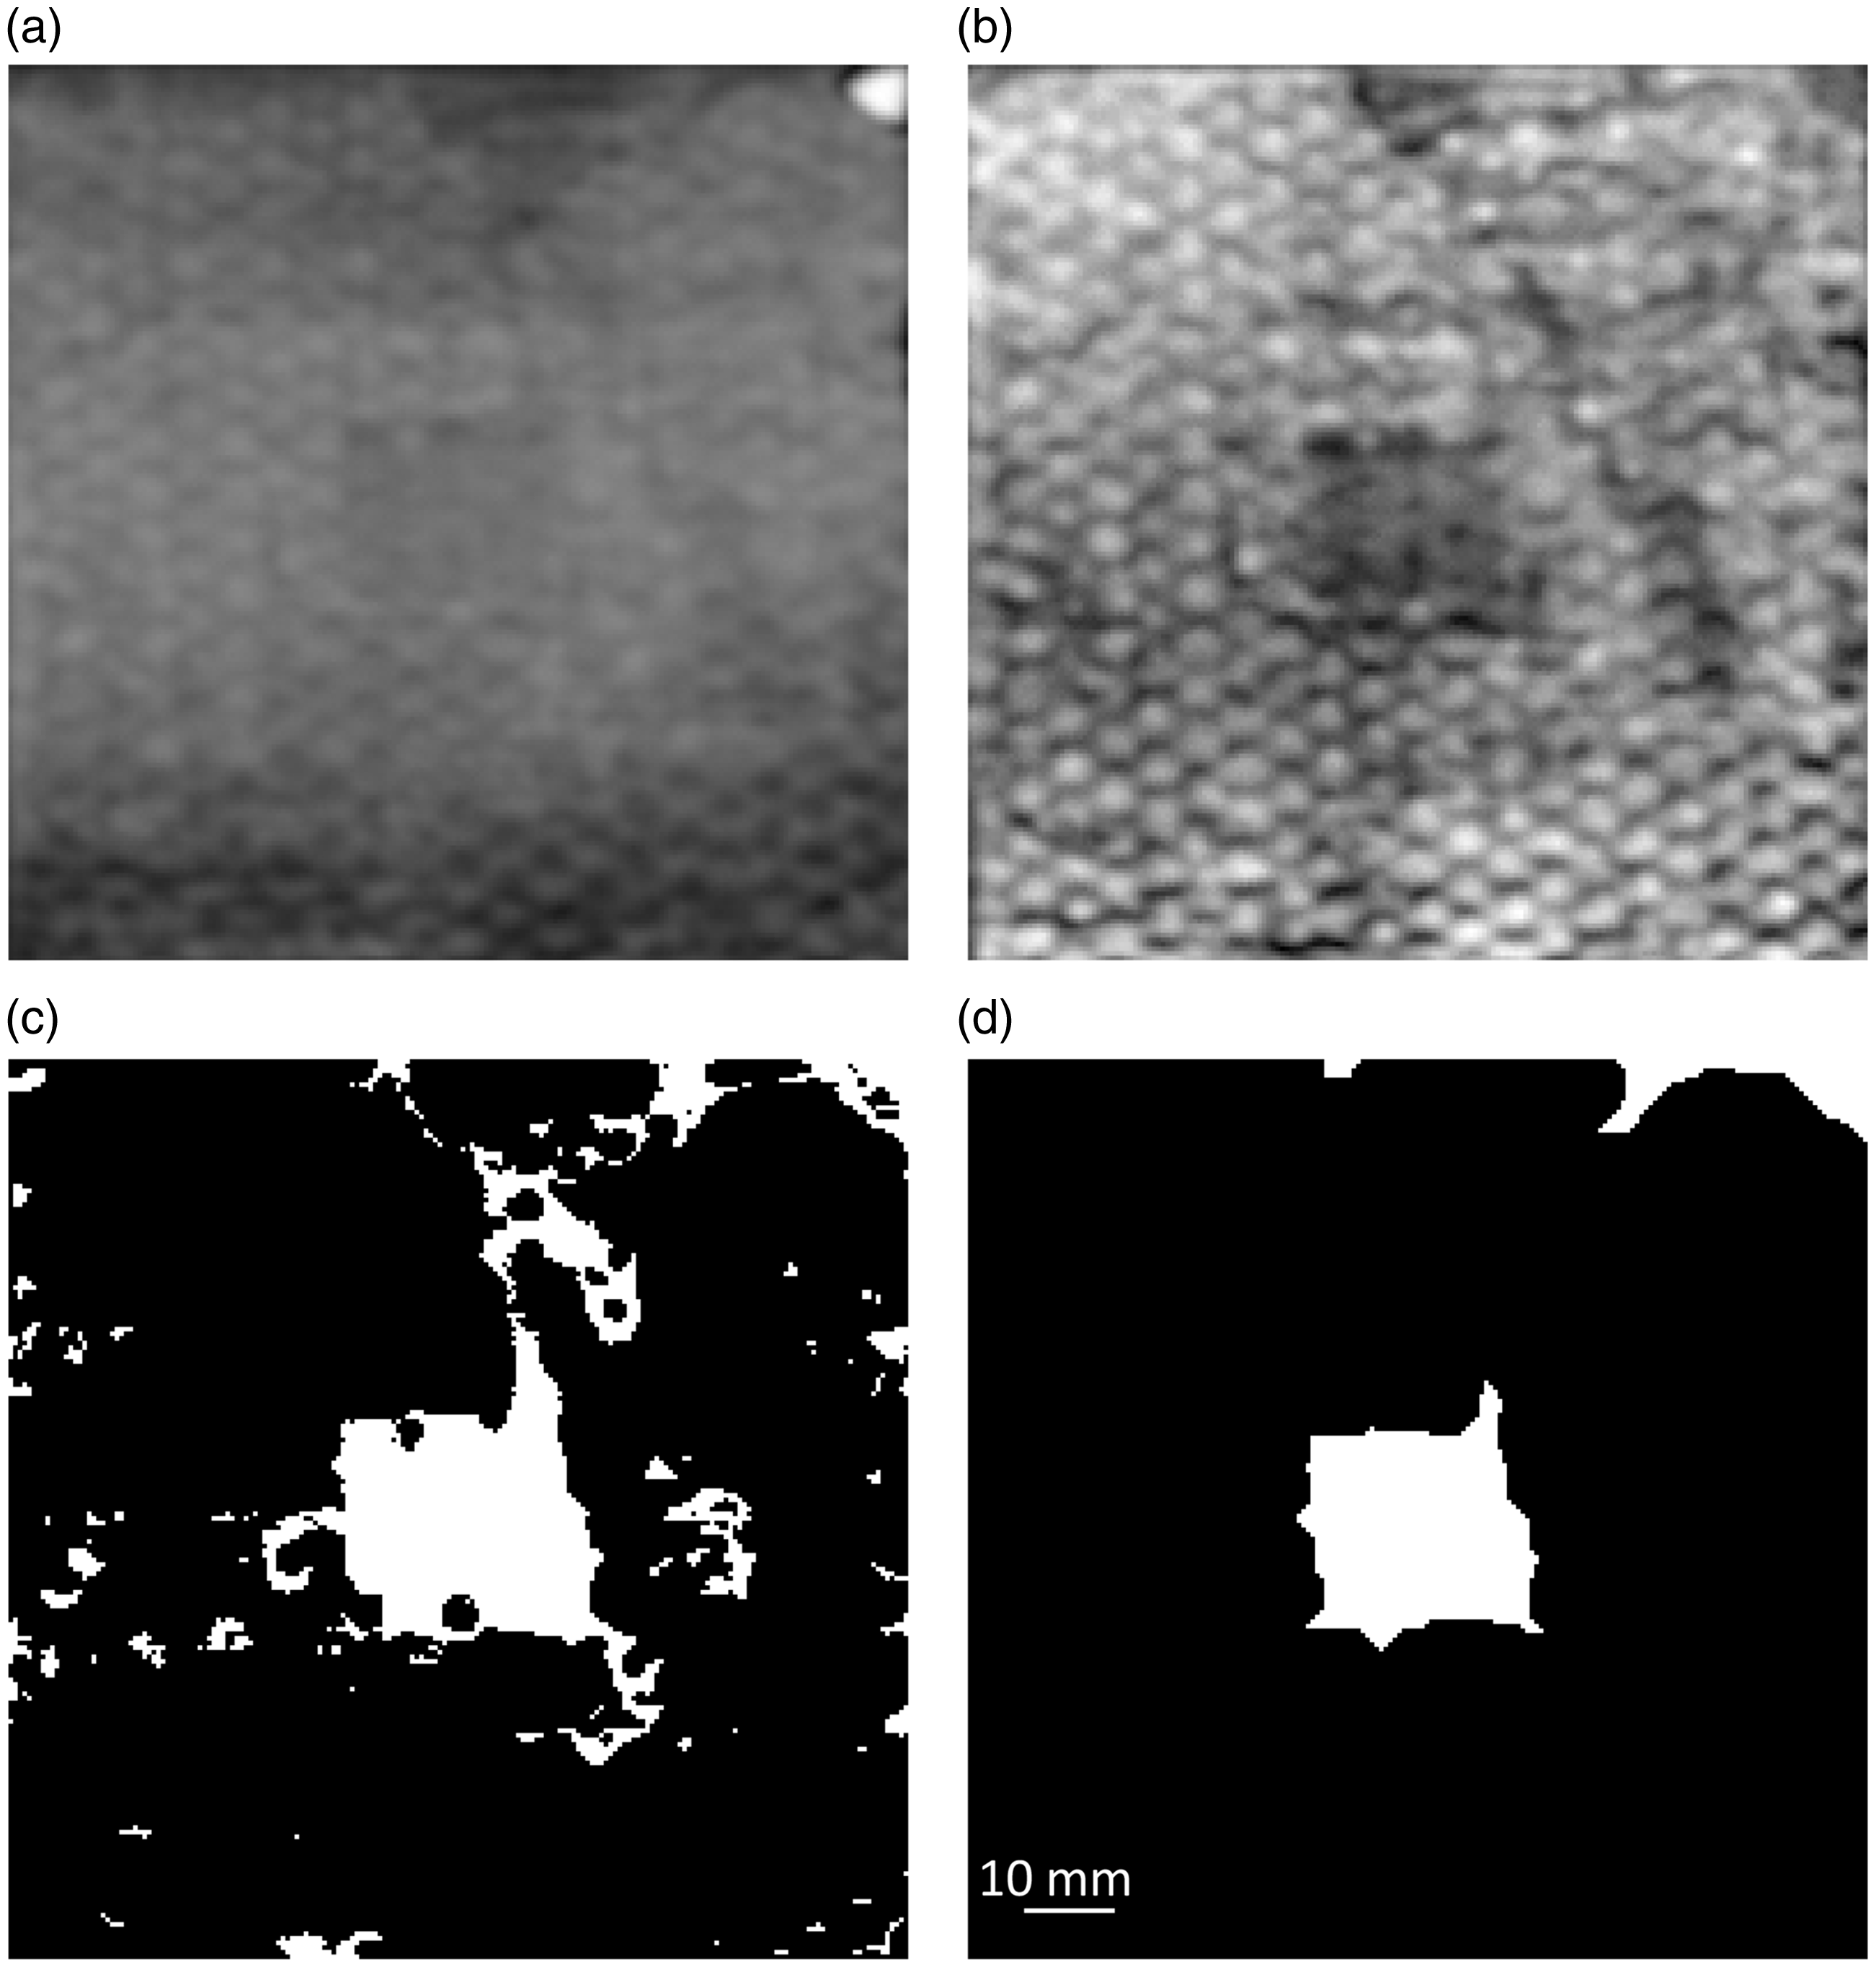
Conclusion
In this paper, THz-TDS imaging system in reflection configuration was used as a NDE tool for the inspection of two glass fiber honeycomb sandwich panels. For the glass fiber polypropylene honeycomb sandwich panel with a skin-core debonding defect, the defect can be successfully detected through both time and frequency domain information, which is mainly because the reflected signal from the closely adhered location is stronger than that from the debonding location. For the glass fiber Nomex honeycomb sandwich panel with a foreign inclusion defect, the reflected THz pulse of the top surface of the sample is removed before the Fourier transform, which can effectively improve the ability of THz wave to detect the inner defects with certain depths (by effectively expanding the dynamic range of the detection system). In addition, the difference between the reflected time domain waveforms measured on the sample with and without defect is also used to build up the THz image, which resulted in better defect detection effect. In future work, it will be advantageous to perform the theoretical simulation on the THz defect detection, and make a comparison between the actual measurement results and the theoretical simulation results. Furthermore, THz-TDS imaging system will be applied to detect other common defects of glass fiber honeycomb sandwich panels, such as water inclusion, collapse, and crack of the honeycomb core. In addition, other NDE methods will be used to verify the defect detection results of THz-TDS technology, and systematic comparison and analysis will be conducted.
Footnotes
Declaration of Conflicting Interests
The author(s) declared no potential conflicts of interest with respect to the research, authorship, and/or publication of this article.
Funding
The author(s) disclosed receipt of the following financial support for the research, authorship, and/or publication of this article: This work was supported by the National Natural Science Foundation of China (Grant No. 11504372) and the Chongqing Science and Technology Commission ((Project Nos. CSTC2013yykfC00007 and CSTC2013jcyjC00001).