
Abstract
The graded lattice structures have advantages in optimizing structure. In this paper, a parametric modeling method of graded lattice structure is proposed. The continuum damage model is used to evaluate the failure load of the structures. In this paper, two types of graded lattice structure are built by parametric modeling method: the cell-size-changed graded lattice structure (the densities of the structures are constant) and the bar-width-changed graded lattice structure (the masses of the structures are constant). The failure loads of the structures under three-point bending load are investigated. The results show that the smaller middle cell improves the bending failure load of the cell-size-changed graded lattice structures up to 52%, and the wider sandwich bar in the middle of the structure improves the bending failure load of the Bar-width-changed graded lattice structures up to 31%. Meanwhile, the graded parameter of the structures will influence the failure mode of the structures.
Keywords
Introduction
The lattice truss structures were proposed as potential replacements for the two-dimensional (2D) lattice structures. Firstly, the lattice truss structures have high specific strength and stiffness. Li et al. [1] manufactured a kind of pyramidal lattice sandwich structure with a hot compression molding method, and out-of-plane compression and shear test were conducted. Xiong et al. [2] investigated the structural performance in direct shear and three-point bending. Song et al. [3] manufactured a kind of C/SiC lattice structure, and the mechanical behaviors under out-of-plane compression were investigated at a room temperature. The results showed that the truss lattice structure were more weight efficient. Secondly, the lattice truss structures have perfect designability. Lee et al. [4] created a kind of lattice structure by systematically assembling continuous helical wires in six different directions. Schnieder et al. [5] came up with a new way to manufacture lattice structure by folding and cutting thermoplastic composite flat sheets into lattice shape. Fan et al. [6] designed and tested a kind of hierarchical lattice truss structure reinforced by woven textile sandwich composite. The performance of the lattice structure changes with the manufactured process. Toropova et al. [7] designed a type of anisotropic lattice that can eliminate thermal mismatch stresses and their concomitant consequences with two kinds of materials. The truss core provided easy access to the core regions, which meant that lattice cores can support additional functions, such as actuation and cooling, Wei et al. [8] measured the heat transfer characteristics of C/SiC lattice structures, and their results provided a foundational understanding on the heat transfer characteristic of C/SiC lattice structures.
As the loading distribution is usually nonuniform in the lattice structures, the gradient concept could be introduced in the lattice structure design to improve the load capacity of the structure. To research the influence of gradient on core, Choy et al. [9] and Al-Saedi et al. [10] manufactured functionally graded lattice by laser melting, and explored the compressive properties of the material, found the plateau stress and specific energy absorption improved by density gradient. To research the influence of gradient on structure, Xu et al. [11,12] designed two kinds of graded lattice structure—one manufactured by varying inclination angle of the sandwich bar, and the other manufactured by auto-cutting and mold-press process so that the core bar width could be changed. The three-point bending properties of the structures were tested, and the results indicated that the gradient improved the failure load. To research the influence of gradient on dynamic problem, Yu et al. [13] and Liu et al. [14] proposed the simulation model of graded sandwich honeycomb planes, and found the positively graded cores improved the stiffness, strength, as well as plastic energy dissipation of the plane. Yang et al. [15] developed the simulation model of density graded cellular materials. Their results showed that the crashworthiness of the material could be obtained by designing the gradient parameters, Wang et al. [16] derived the free vibration of 2D functionally graded beams by using the piecewise exponential model and Khosroshahi et al. [17] found the helmets can significantly reduce the risk of head injury by using a hierarchical lattice liner. On the optimization method, Daynes et al. [18] optimized the graded lattice structure by topology optimization, and Wang et al. [19] optimized the global distributions of spatially-varying graded mesostructures. They manufactured their model by additive manufacturing; the results of the tests verify superior stiffness and strength properties.
In previous studies, the researchers have proved the high performance and perfect designability of gradient lattice structure, and the failure of the lattice structure is very complex. Therefore, the method to evaluate the mechanical properties of the structure is needed. To solve the problems, the following work has been done in this paper: (1) The parametric modeling (PM) method of the graded lattice structure is proposed to create the simulation models, and a continuum damage model is adopted to predict the failure load of sandwich structures. (2) The cell-size-changed graded lattice structures with constant cell density are built, and this kind of lattice structure under three-point bending load is simulated. (3) The bar-width-changed graded lattice structures with constant structure mass are built, and the influence of the gradient function on the failure load of the structure under three-point bending is studied.
Parametric modeling method for graded lattice structures
Parametric model of the structure
The graded lattice structure is manufactured by cutting the middle panel into the bonding area and the graded sandwich bar as in the work of Xu et al. [12], and the skins and the core are made by laminate material. In this paper, the distance in x-direction between the sandwich bar edge is designed as 0 to improve the shear stiffness of the structure. The model of the lattice structure is shown in Figure 1.
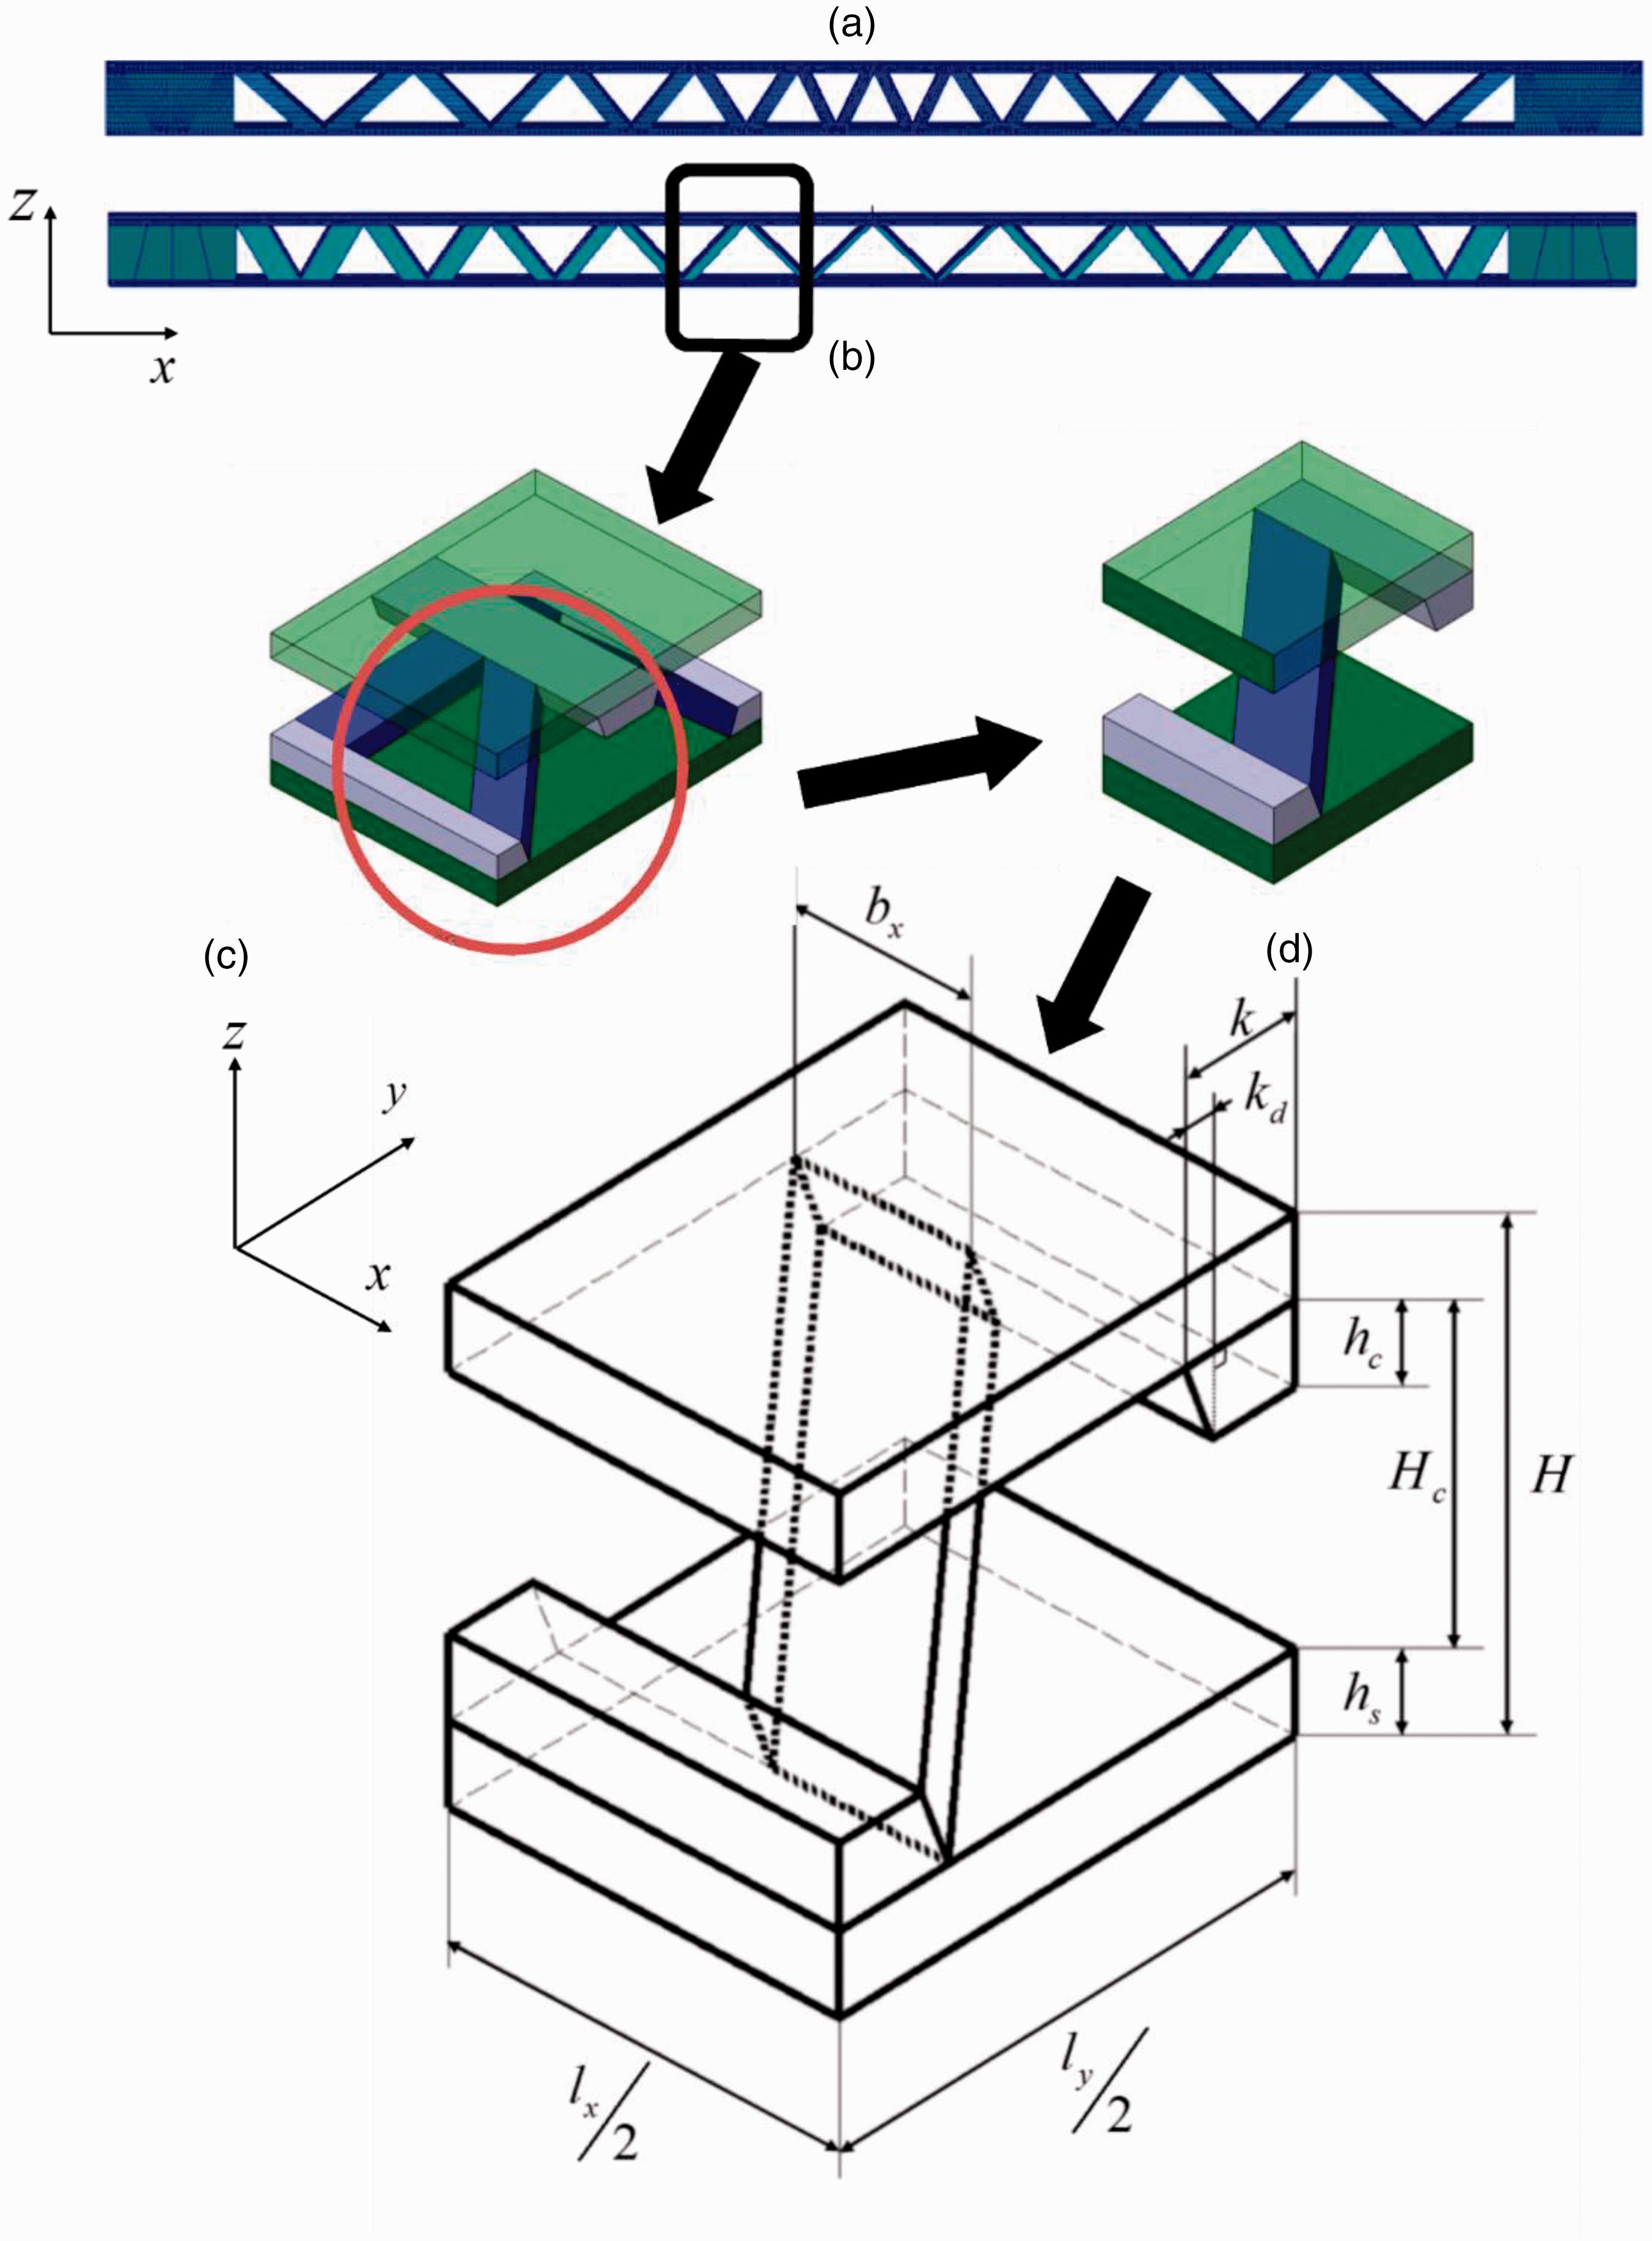
The geometry model of graded lattice structure. (a) X-type cell-size-changed structure. (b) X-type bar-width-changed structure. (c) Single cell. (d) 1/4 cell.

For the graded lattice structure, the equivalent density can be obtained by

Substituting equation (3) into equation (2), we have
Simulation model of the structure
Disassembling of the graded lattice structure
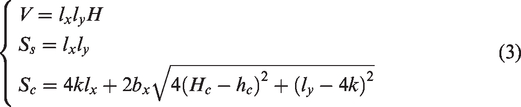
The disassembling of the graded lattice structure aims to improve the quality of the geometric model, which will be helpful to obtain better finite element meshes. The upper and bottom skins are disassembled into 16 parts based on the parameter k and bx, as shown in Figure 2(a) and (b). Firstly, the core is disassembled by the bonding area and the sandwich bar. Then the bonding area is disassembled into eight parts based on the width of sandwich bar, as shown in Figure 2(c). Each part is disassembled into several layers as shown in Figure 2(d). The number of the layers relies on the laminate material of the skins and the core.
Disassembling of the graded lattice structure. (a) Upper skin of the structure. (b) Bottom skin of the structure. (c) Core of the structure. (d) The lattice structure.
Mesh control of the lattice structure
The structures in this paper are meshed by 8-node solid elements. The parts of the structure from the disassembling in the former steps are well connected by controlling the number of the elements on the edge. The structure can be meshed as shown in Figure 3.
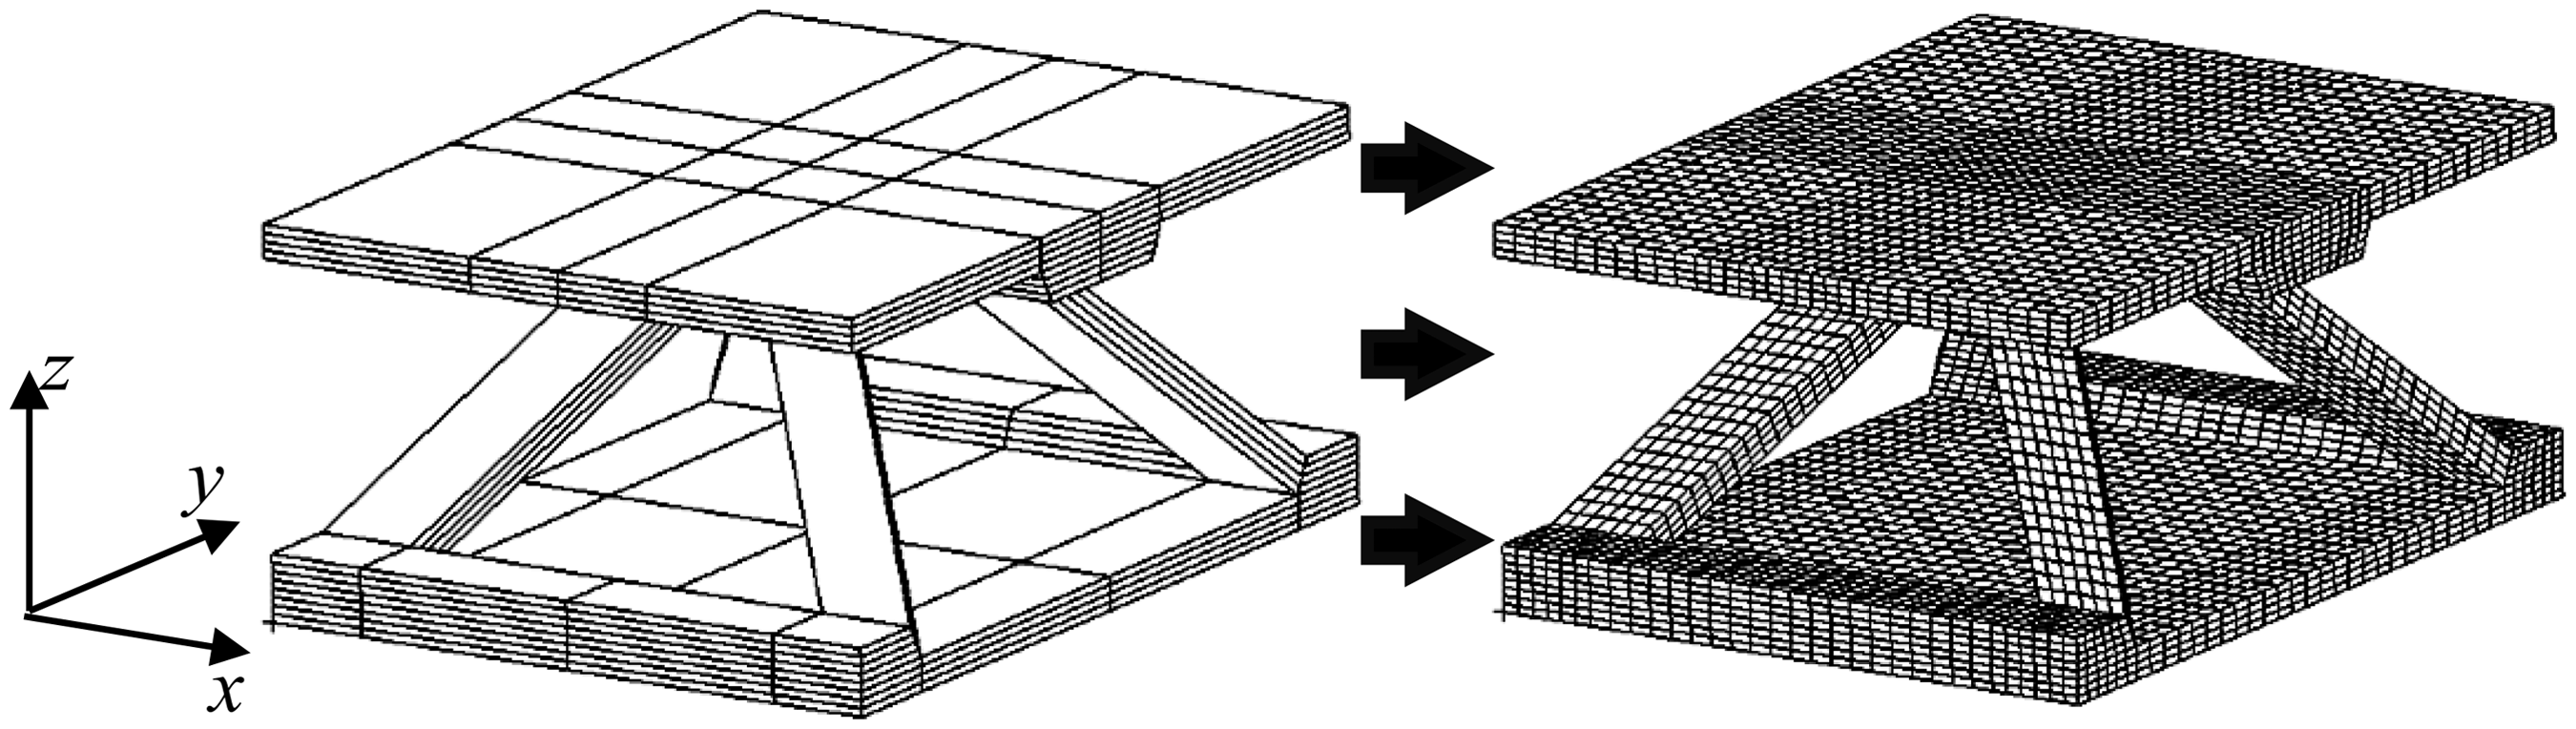
The mesh of the graded lattice structure.
The material direction of the graded lattice structure
The unit direction vector of the material of each layer in the graded lattice structure can be obtained as

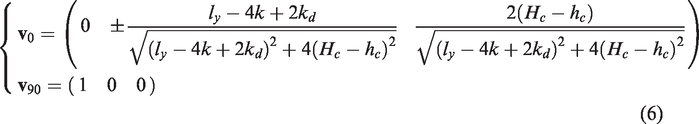
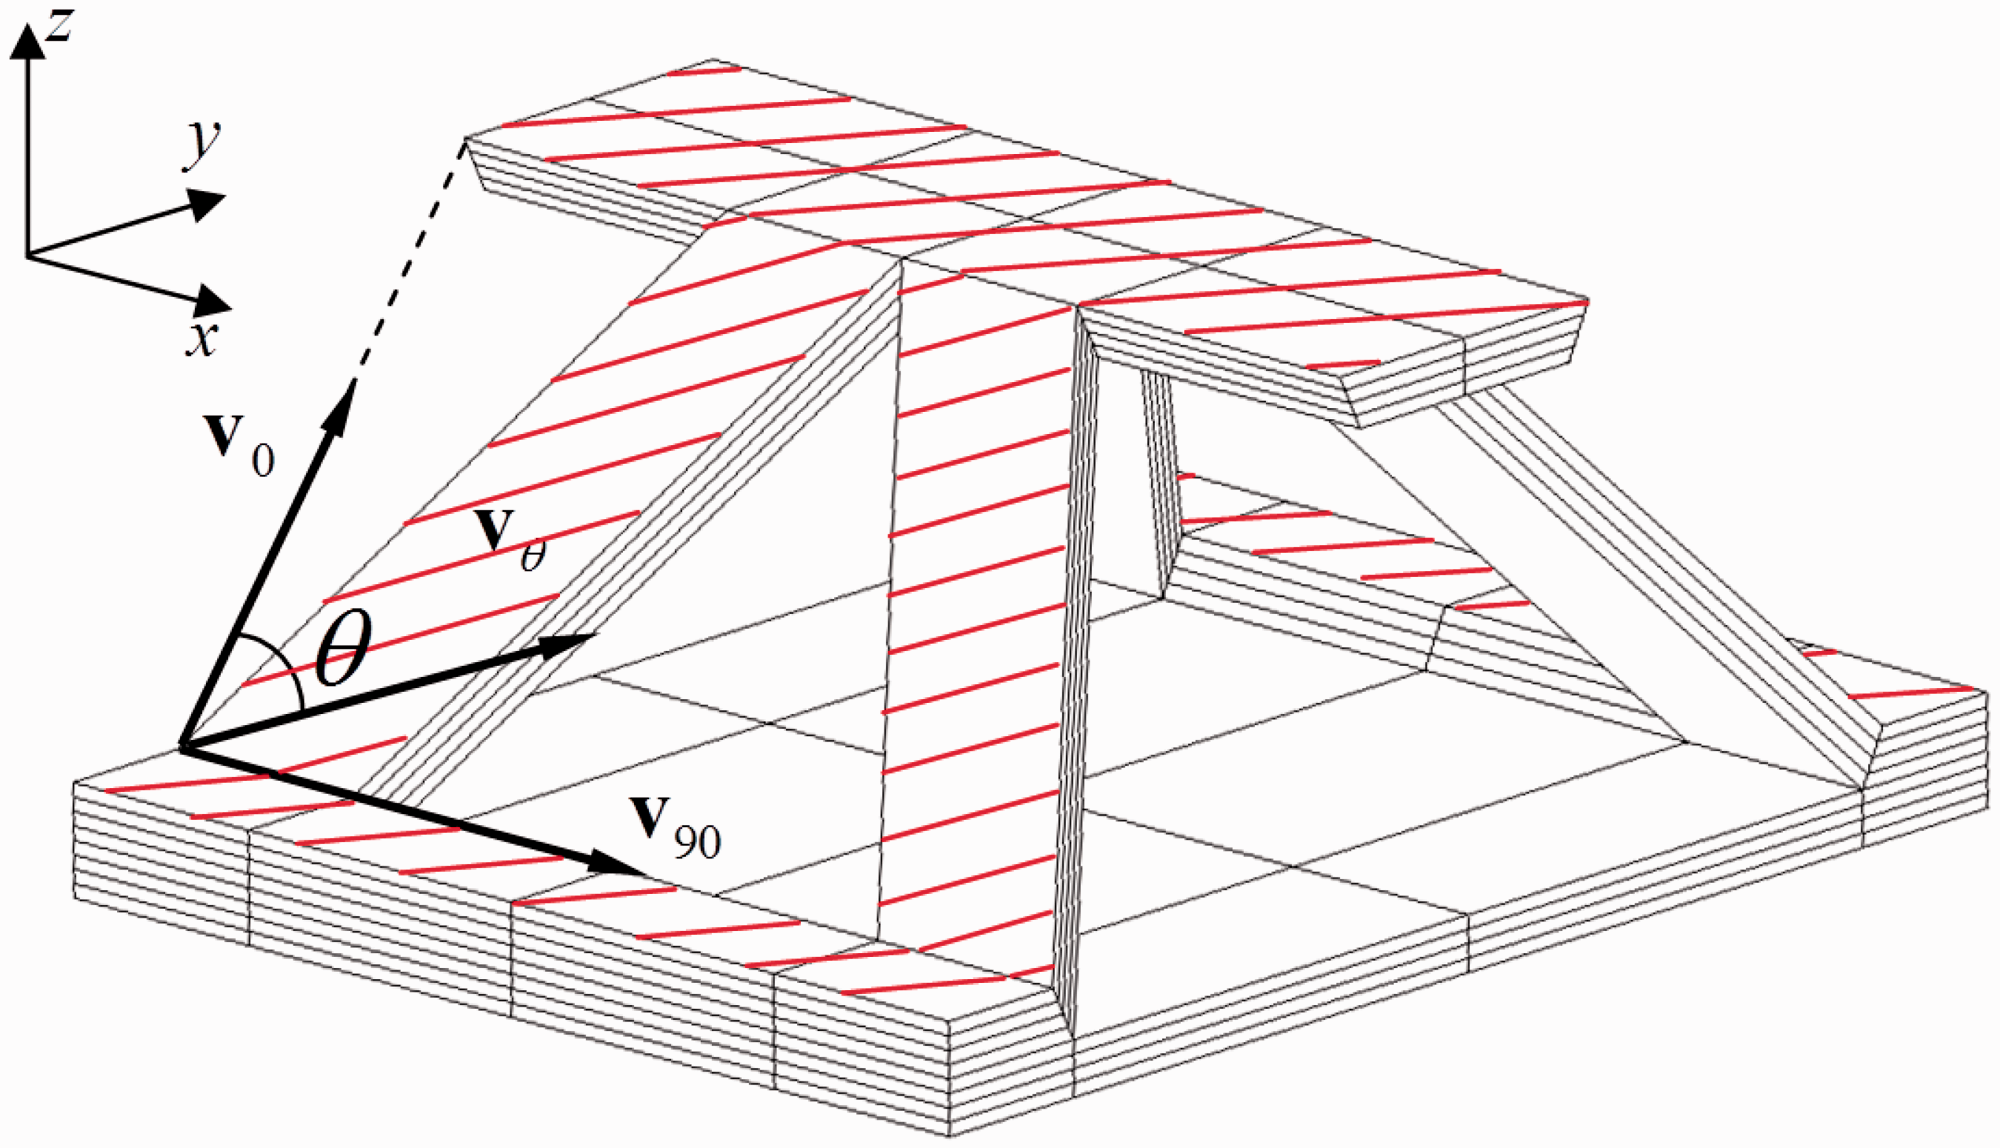
the vector of the material in the core of the sandwich structure.
The continuum damage model
The continuum damage model based on the work of Zhong et al. [20] is used to predict failure load and damage distribution of structures in this paper. The calculation flow chart of the damage model is as shown in Figure 5.
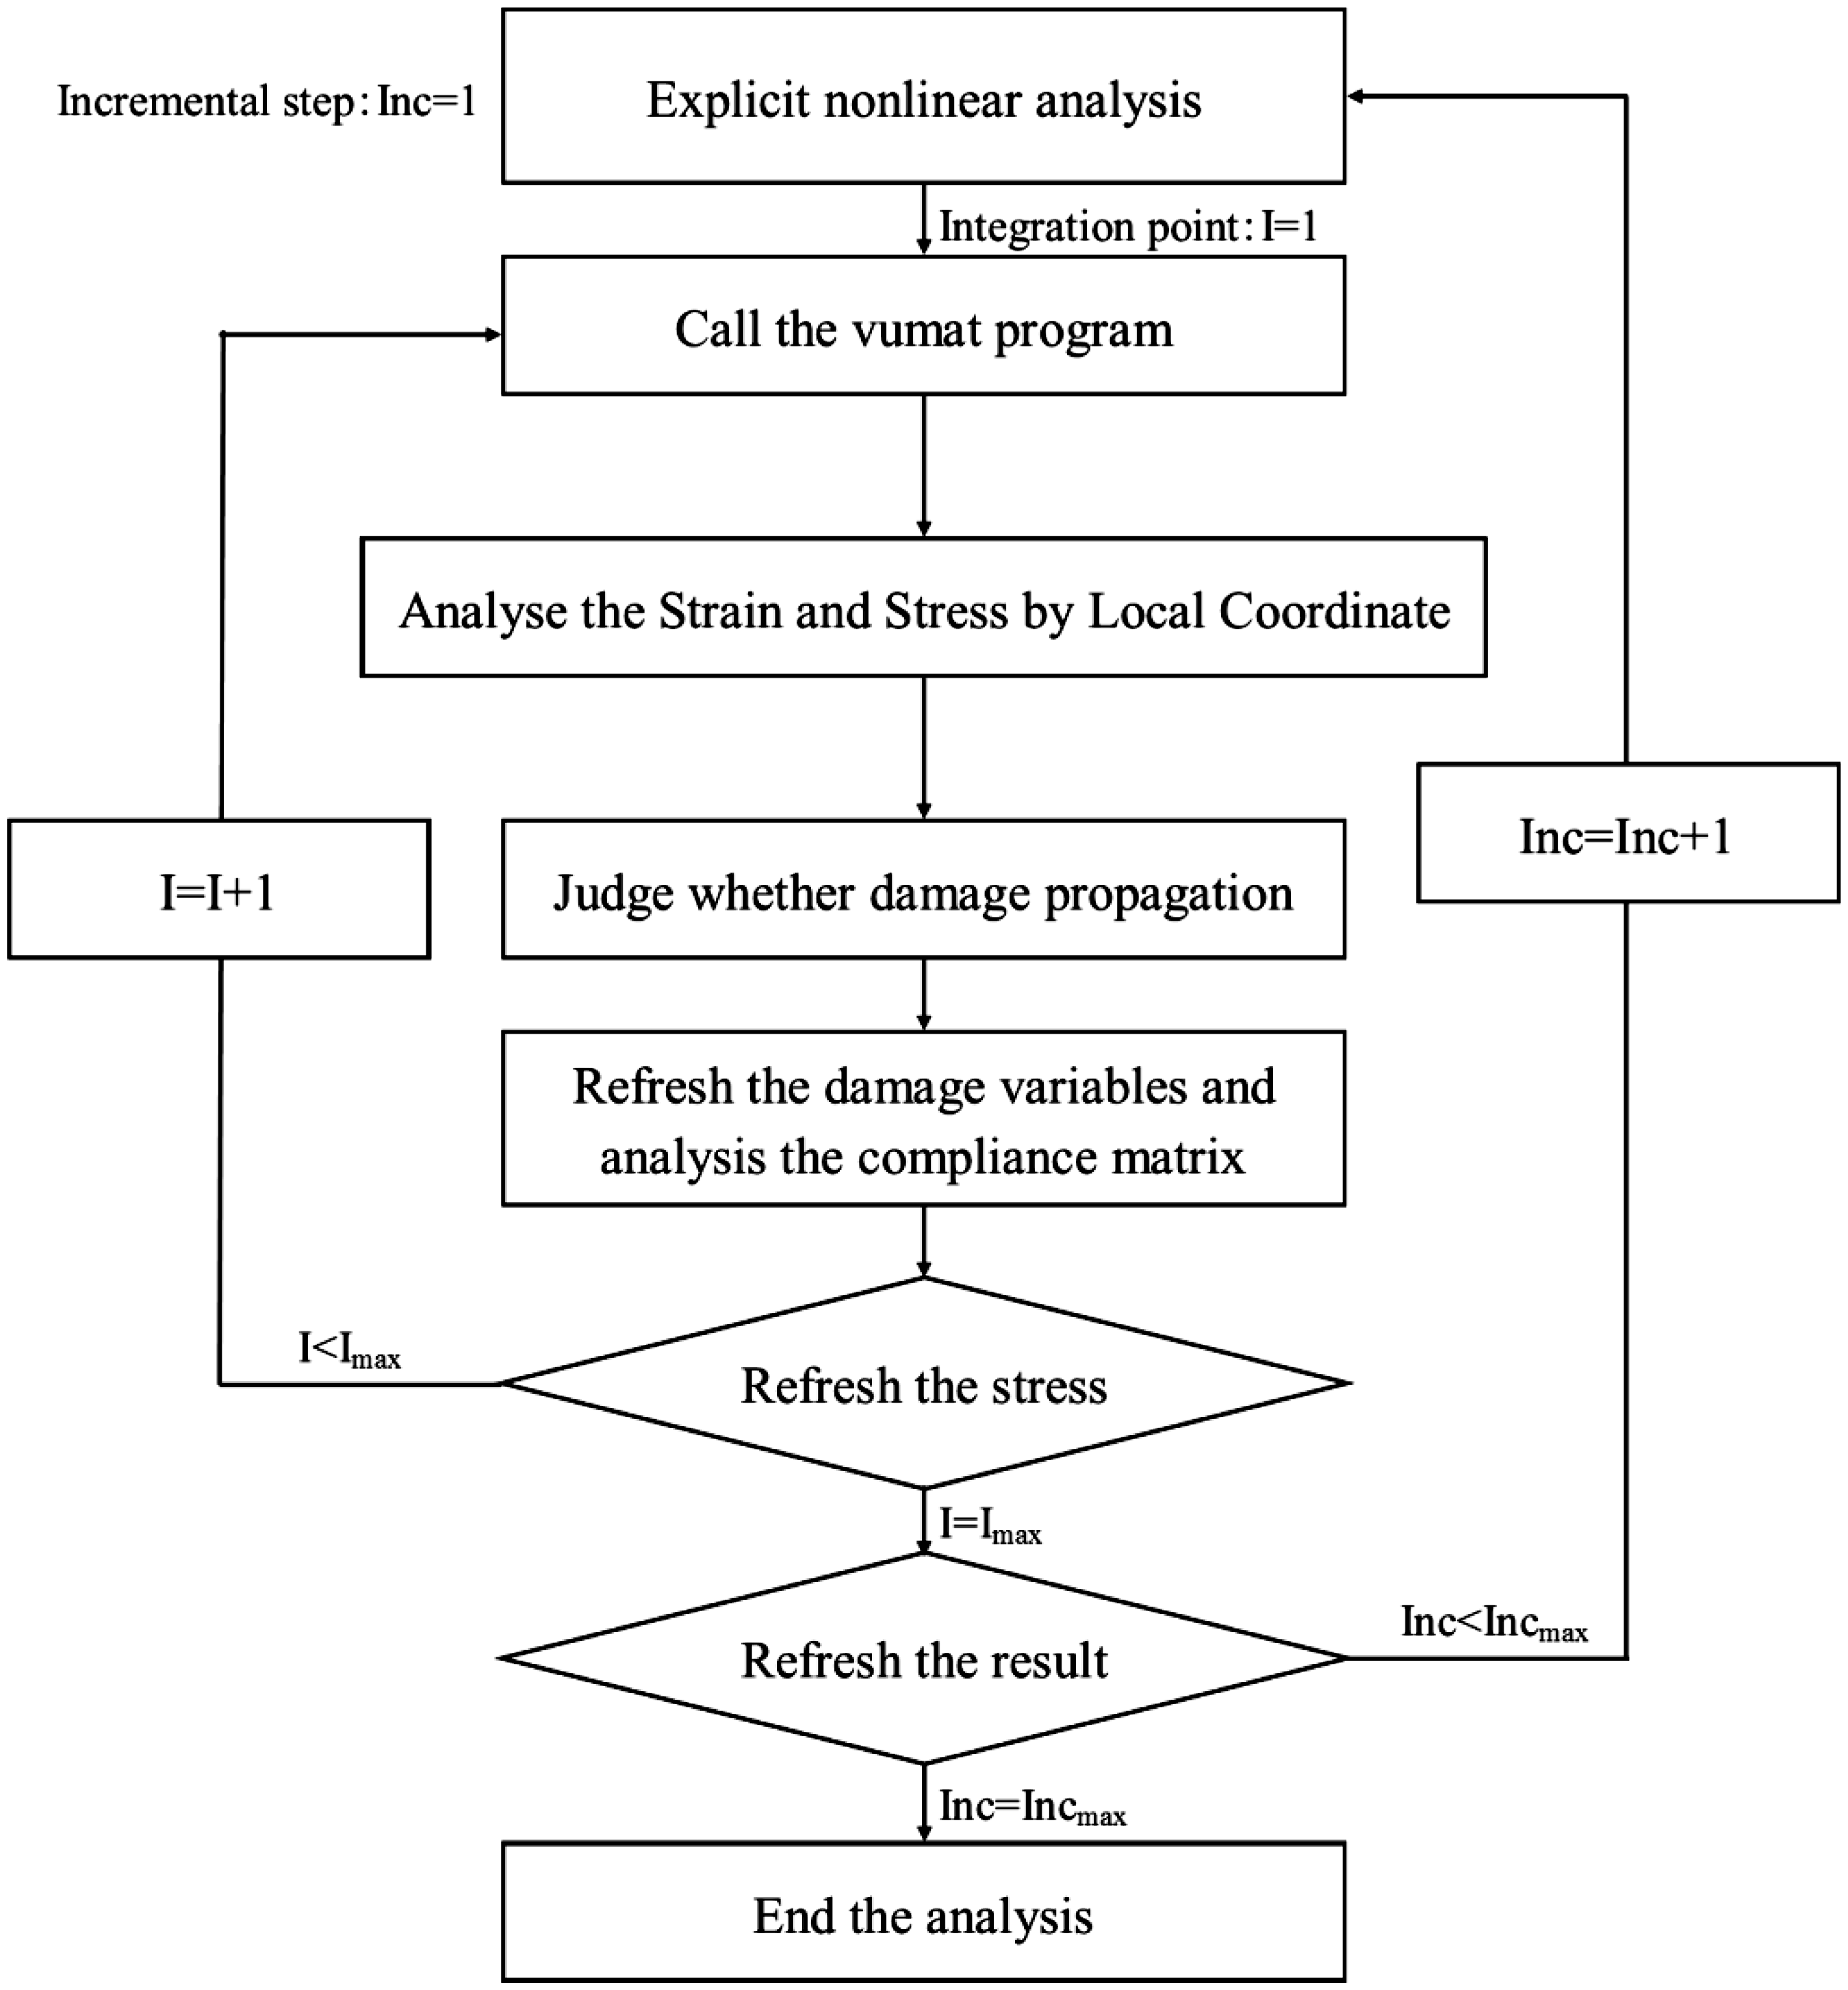
The calculation flow chart of the damage model.
When the damage occurs, the constitutive equation of the material can be written as

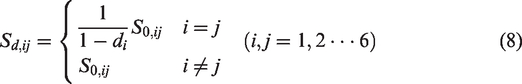
The effective stress after damage is defined as
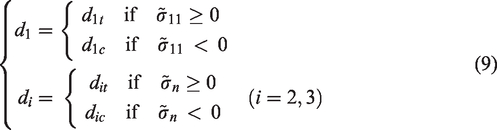
The damage initiation and propagation of the material can be written as

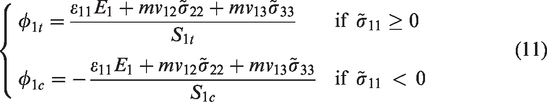
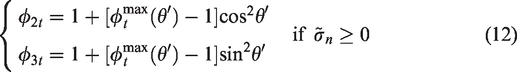
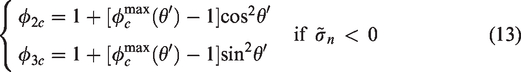
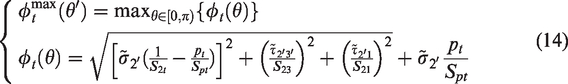
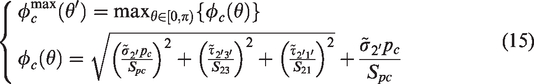
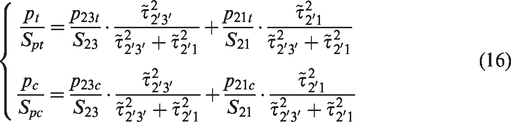
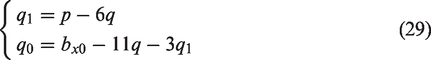
The damage threshold value

The exponential damage evolution law is used in this paper to describe the damage evolution of the material, and the damage parameters can be written as

Then the shear damage variables d4, d5, and d6 can be written as
Typical graded lattice structures produced by PM method
Two kinds of the typical graded lattice structures, which are built by PM method are designed in this part. Firstly, the reference cell is defined. It is used to define the structural parameters of the graded cells. All the parameters in the reference cell are denoted by subscript 0 to distinguish them from those in the unit cells in the studied graded lattice structure.
Cell-size-changed graded lattice structure with constant equivalent density
The cell-size-changed graded lattice structures are designed with constant equivalent density. Based on equation (4), the relationship between the core area of the unit cell and the core area of the reference cell is obtained by the following
Then from equations (21) and (22), bx and k of each unit cell can be obtained as
Bar-width-changed graded lattice structure with constant mass
The bar-width-changed graded lattice structures are designed with constant mass. The control parameter of the structures is bx, and the other parameters are same as the ones in the reference cell, and the relation between the bx and bx0 can be written as
Numerical simulation of the bending failure load of the typical graded lattice structures
The parameters of the graded lattice structure
The parameters of the reference cell are shown in Table 1. The graded lattice structure consists of 10 unit cells arranged along the x-direction (corresponding to X-type structure) or the y-direction (corresponding to Y-type structure). The X-type structure and Y-type structure are shown in Figure 6. The size of the X-type structure is
The simulation model of the graded lattice structures.
The parameters of the reference cell.
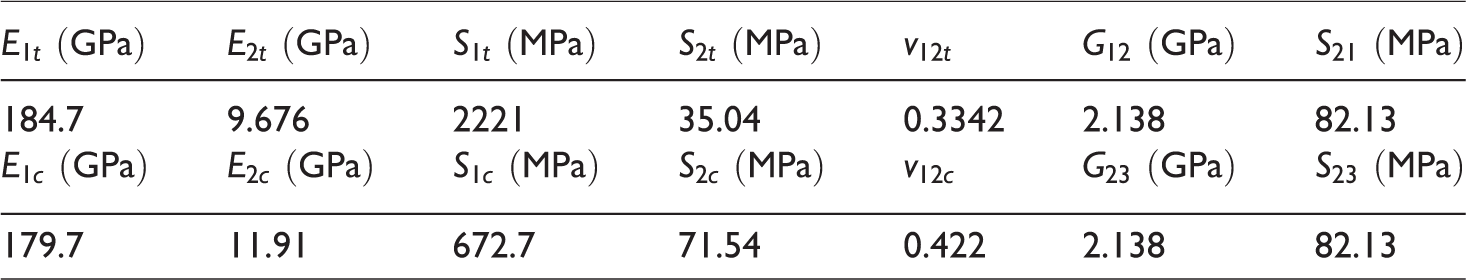
The graded lattice structure is assumed to be made of laminate with nonsymmetrical stacking sequence [45°/0°/−45°/90°]. The thickness of each layer is 0.25 mm. The adopted properties of the laminate are shown in Table 2.
The properties of the carbon fiber reinforced composite material.
The three-point bending test standard ASTM D790 is adopted. The radii of the loading nose and the supports are 5 mm, and the two supports are set on the edges of the graded lattice structure. They are all rigid body and in contact with the lattice structure, and there is no more boundary condition on the lattice structure. To prevent the beam from slipping during loading, one extra cell is added at each edge of the structure. The length and width of the extra cells are the same as the reference cell, and the core of the extra cell is filled with rigid body.
Results of the uniform lattice structure
The load–displacement curve of the uniform lattice structure is shown in Figure 7. For the X-type structure, the load first increases linearly to the peak value, and then begins to drop. For the Y-type structure, the load first increases linearly to the peak value, and then remains almost steady. The two types of structure have different failure modes. The failure mode of the X-type structure is sandwich bar buckling, as shown in Figure 8(a).The failure mode of the Y-type structure is face wrinkling, as shown in Figure 8(b). This is due to the reason that the bending stiffness of the skins in x-direction is stronger than that in y-direction. The different failure loads and failure modes are because of the bonding area increased the bending stiffness of the skins.
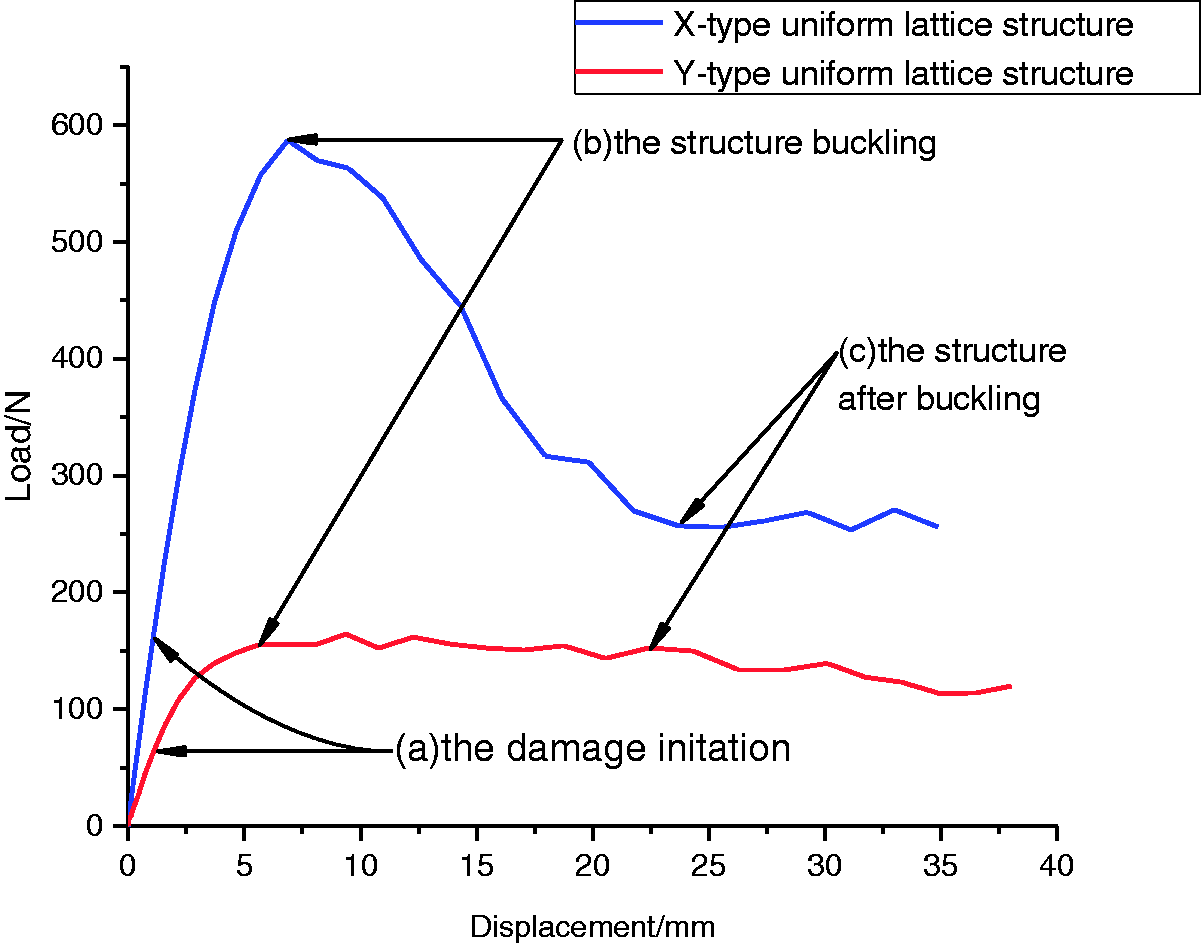
The load–displacement curves of the uniform lattice structure.
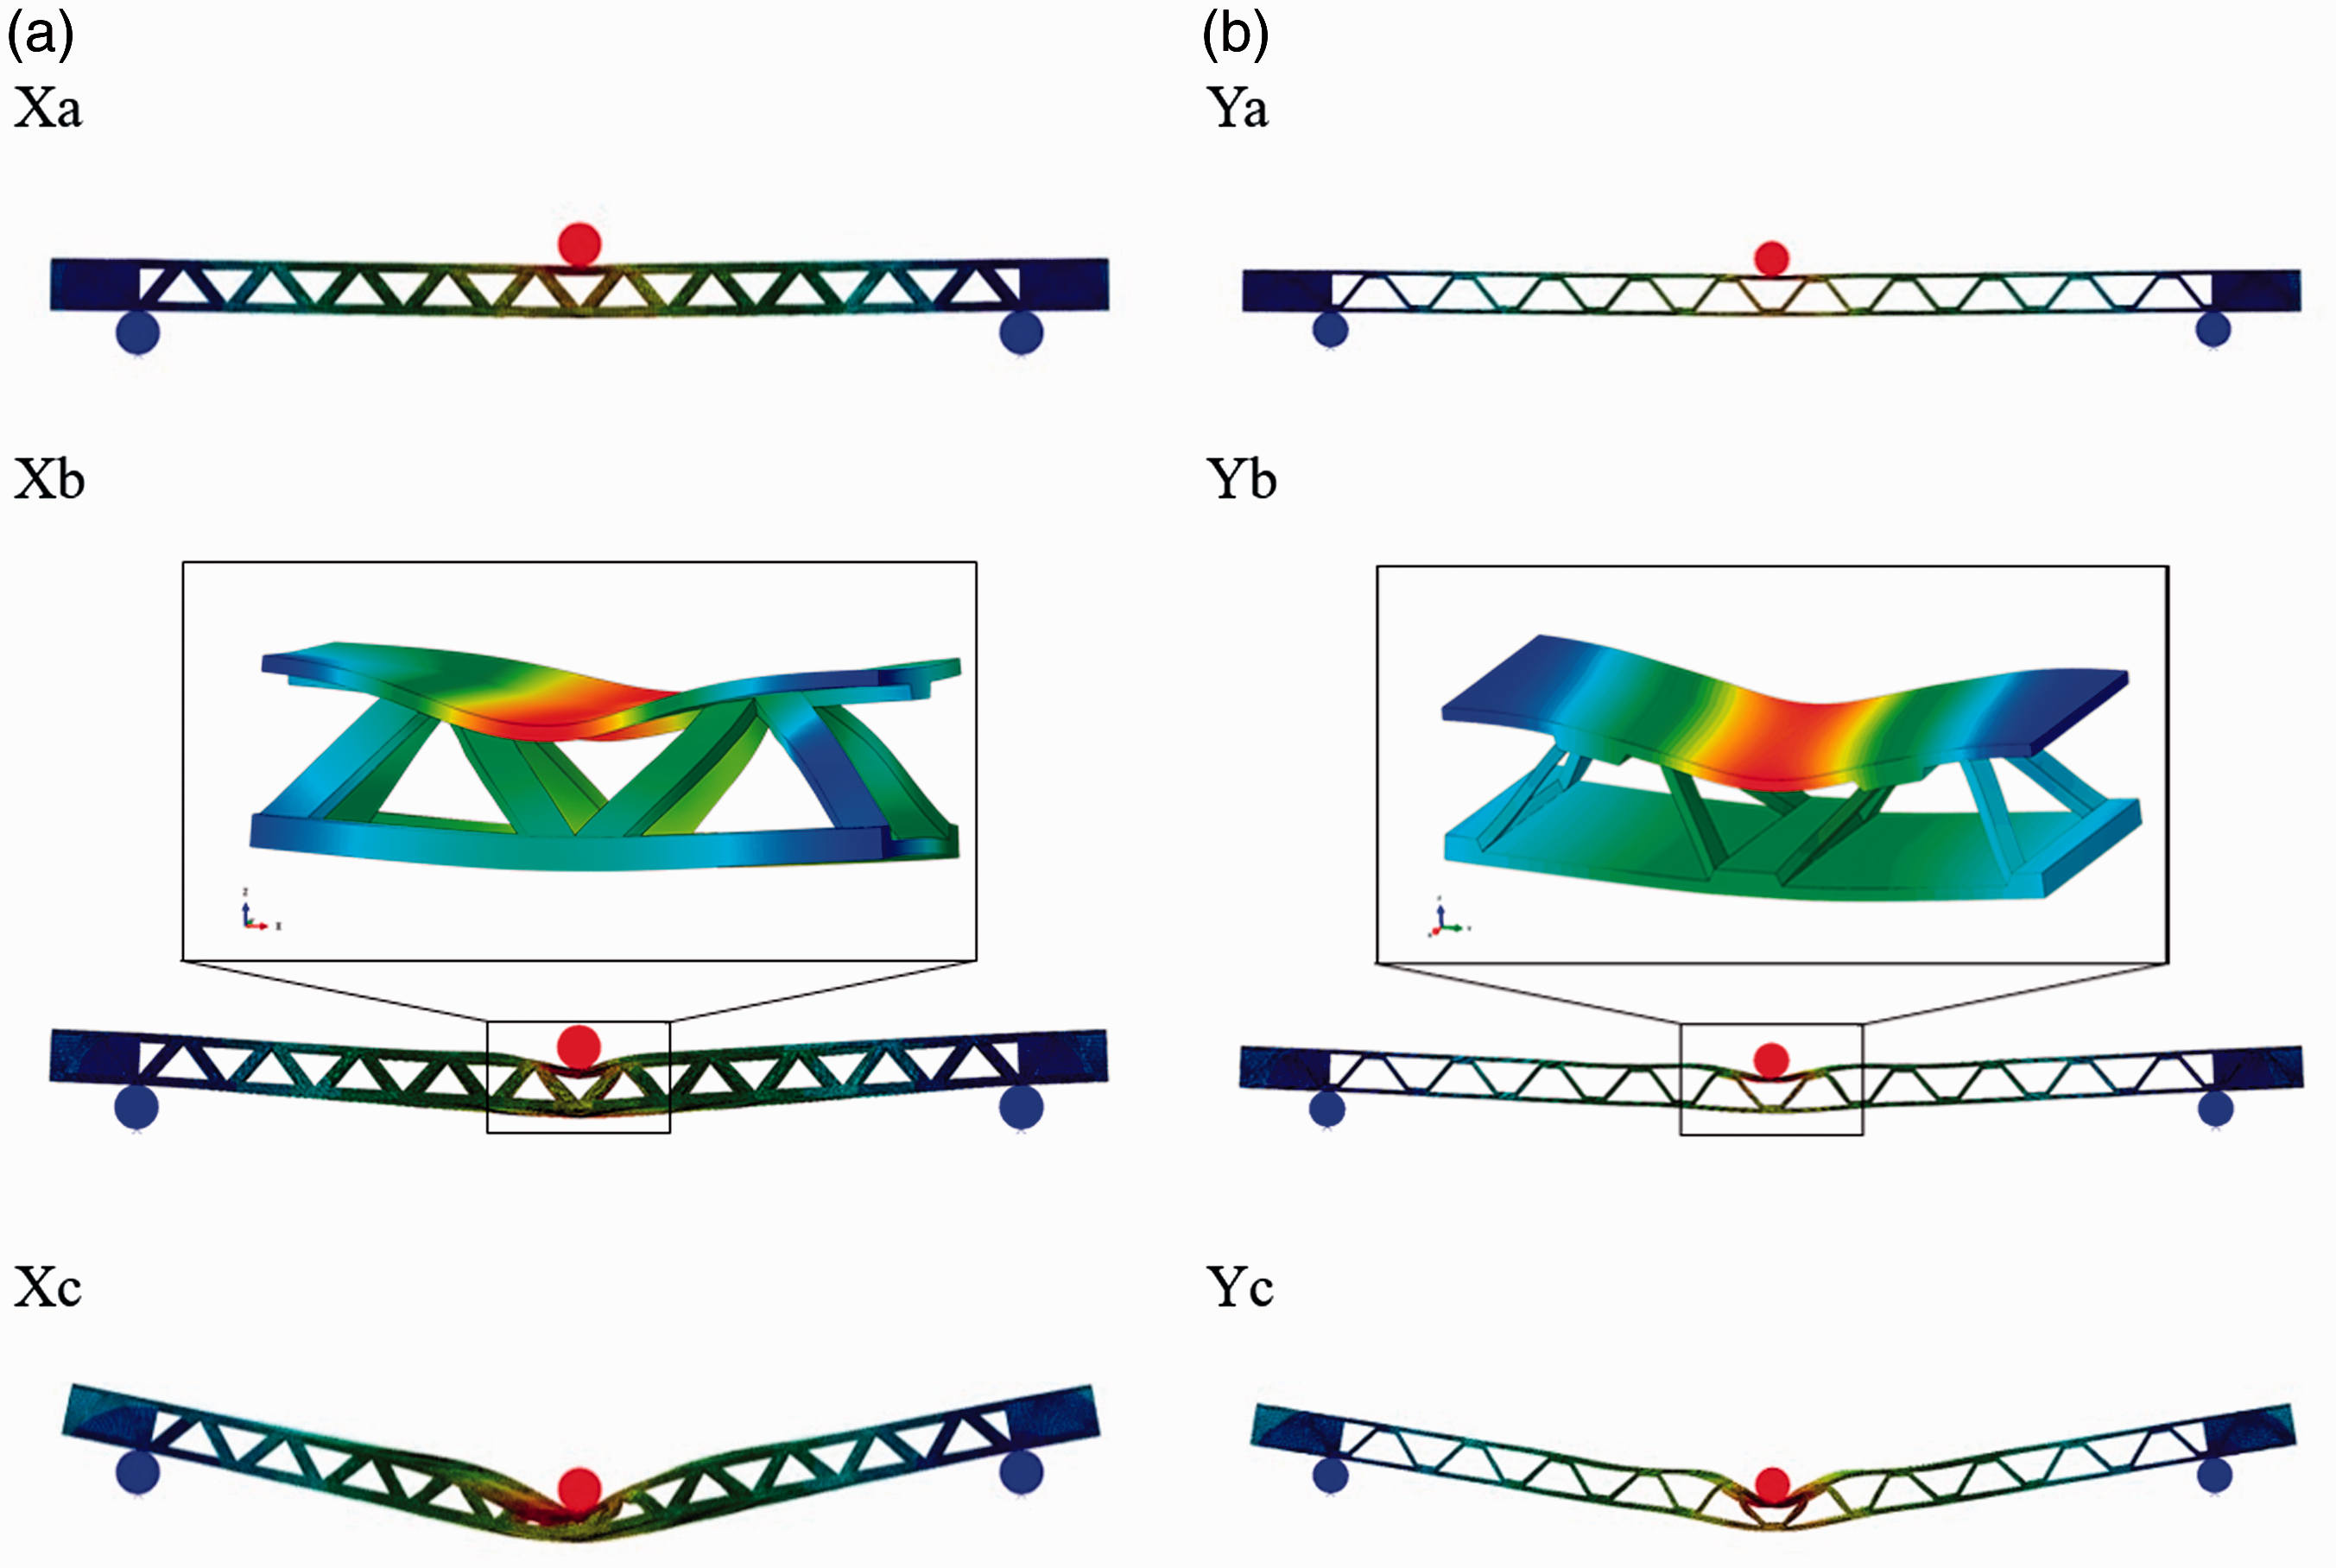
The failure modes of the uniform lattice structure: (a) the failure mode of the X-type structure; (b) the failure mode of the Y-type structure.
The damage distribution in the middle cells is shown in Figure 9. From Figure 9(a), it can be found that the damage mostly occurs in the connection between the bonding area and the sandwich bar, the type of it is the damage in transverse fiber direction; and the bonding area of the Y-type structure prevent the damage from occurring in the upper skin. From Figure 9(b), it can be found that the damage has occurred in the longitudinal fiber direction, and the damage on the upper skin of the Y-type structure is more serious. This means the upper skin has lost its bending stiffness. Comparing Figure 9(b) with Figure 9(c), we can find that the damage in X1 and X2 propagate much faster than that in Y1 and Y2. This is the reason why the load of the X-type structure drops a lot from the peak point and that of the Y-type structure then remains almost steady.
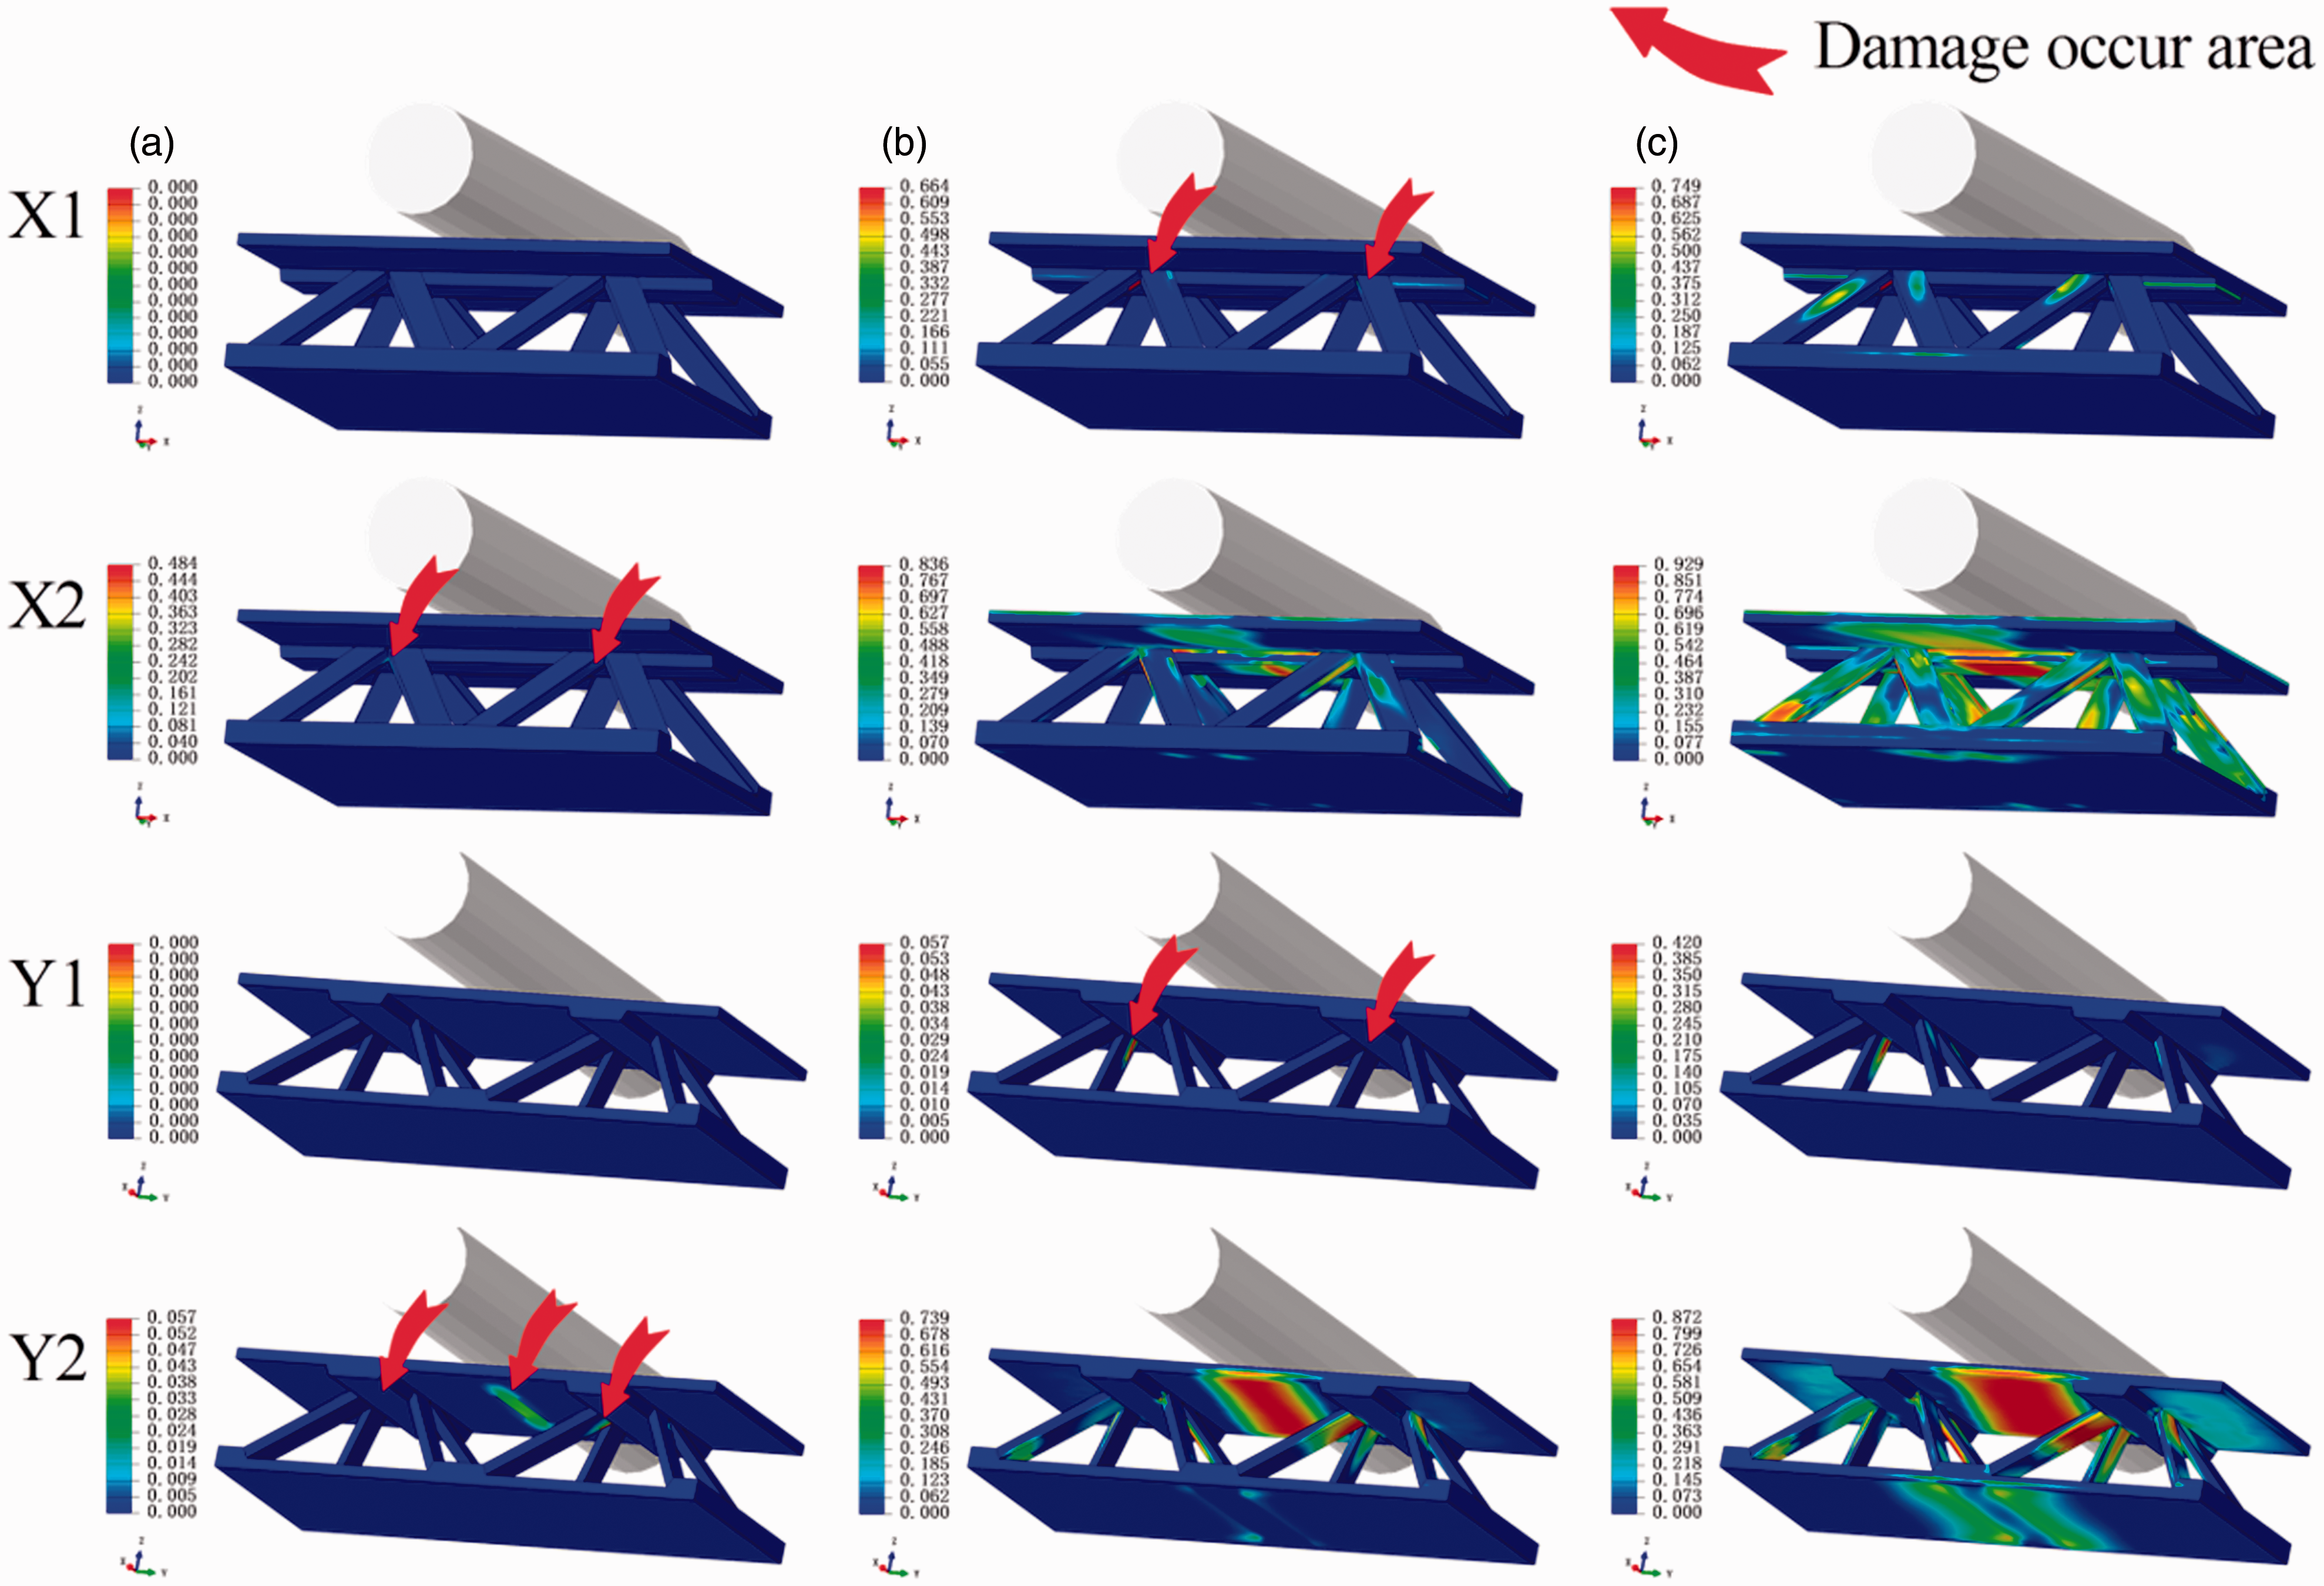
Damage accumulation in the middle cells. X1 and X2 denote the damage parameters d1 and d2 of the X-type structure; Y1 and Y2 denote the damage parameters d1 and d2 of the Y-type structure; a, b, and c are the points in Figure 7.
Results of the cell-size-changed graded lattice structure with constant equivalent density
The geometrical parameters of the cell-size-changed graded lattice structure can be designed by a control equation, which is given as follows. The controlled parameters k and bx are obtained by equation (23)

The results of the analysis are shown in Figure 10. It can be found that the failure load of the graded lattice structure is improved with the increasing of the parameter p. This means that the smaller the middle cell is, the stronger the structure is. The reason being the smaller cell means the shorter core bar and skin, and this increases the buckling load of the cell. Compared with the uniform lattice structure with p = 0, the failure load of the X-type structure is improved by about 20%, and the failure load of the Y-type structure is improved by about 52%. The failure modes of all the graded structures are similar to the ones of the uniform lattice structures.
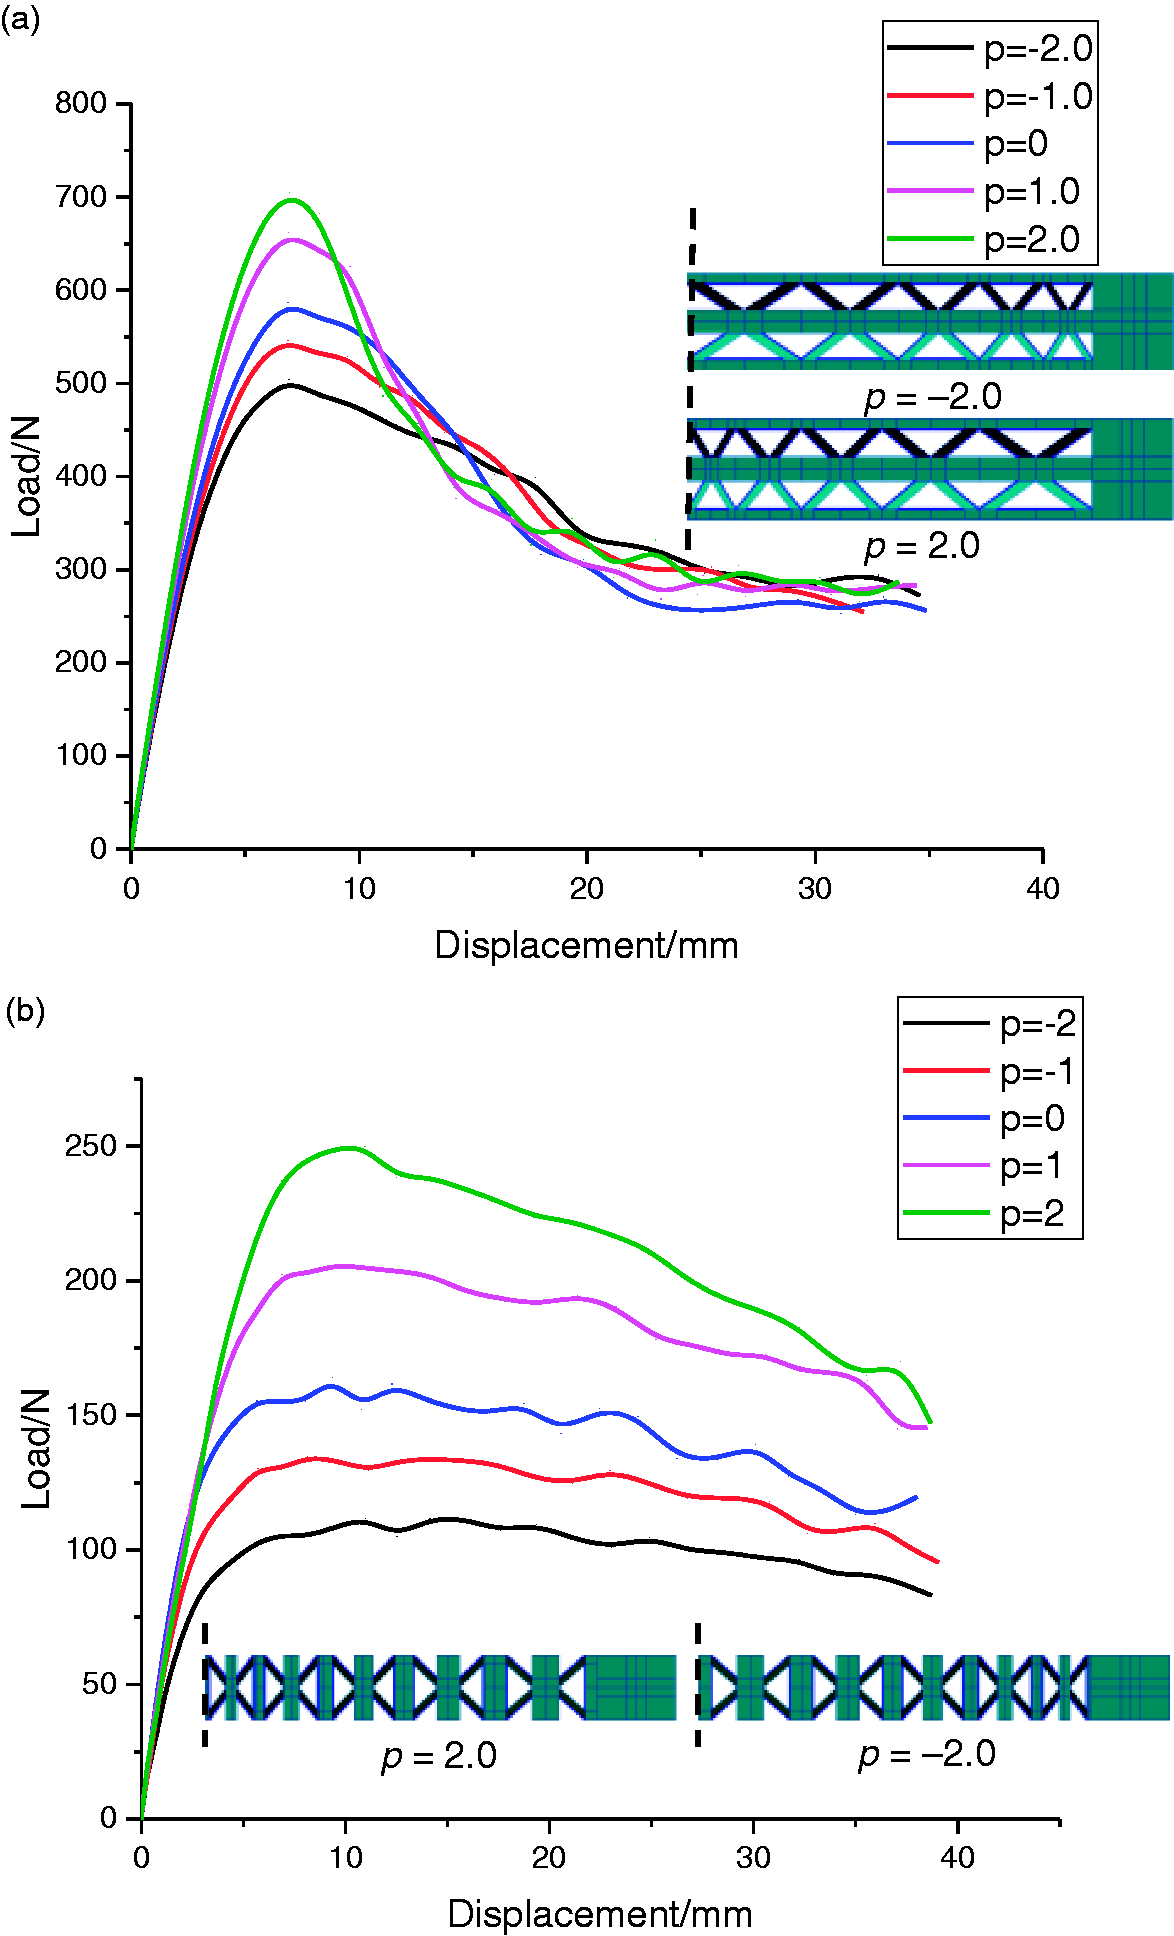
The load–displacement curves of the cell-size-changed graded lattice structure: (a) the X-type lattice structure; (b) the Y-type lattice structure.
Results of the linear bar-width-changed graded lattice structure with constant mass
The width of sandwich bar has a great influence on the load capacity of lattice structure. For the linear bar-width-changed graded lattice structure, the relation between bx and bx0 can be described as


The simulation results are shown in Figure 11. It can be found that the failure load of the lattice structure is improved with the decrease in the parameter p, which implies the wider the sandwich bars of the middle cell is, the stronger the structure is. The reason being the buckling load of the bar is increased by improving its width. Compared with the uniform lattice structure with p = 0, the failure load of the X-type structure is improved by about 31%, and the failure load of the Y-type structure is improved by about 20%. On comparing the results with the experiments by Xu et al. [12], it is found that the influence of the graded is the same. However, because their graded parameter is not big enough, the curve with p = 1 did not appear.
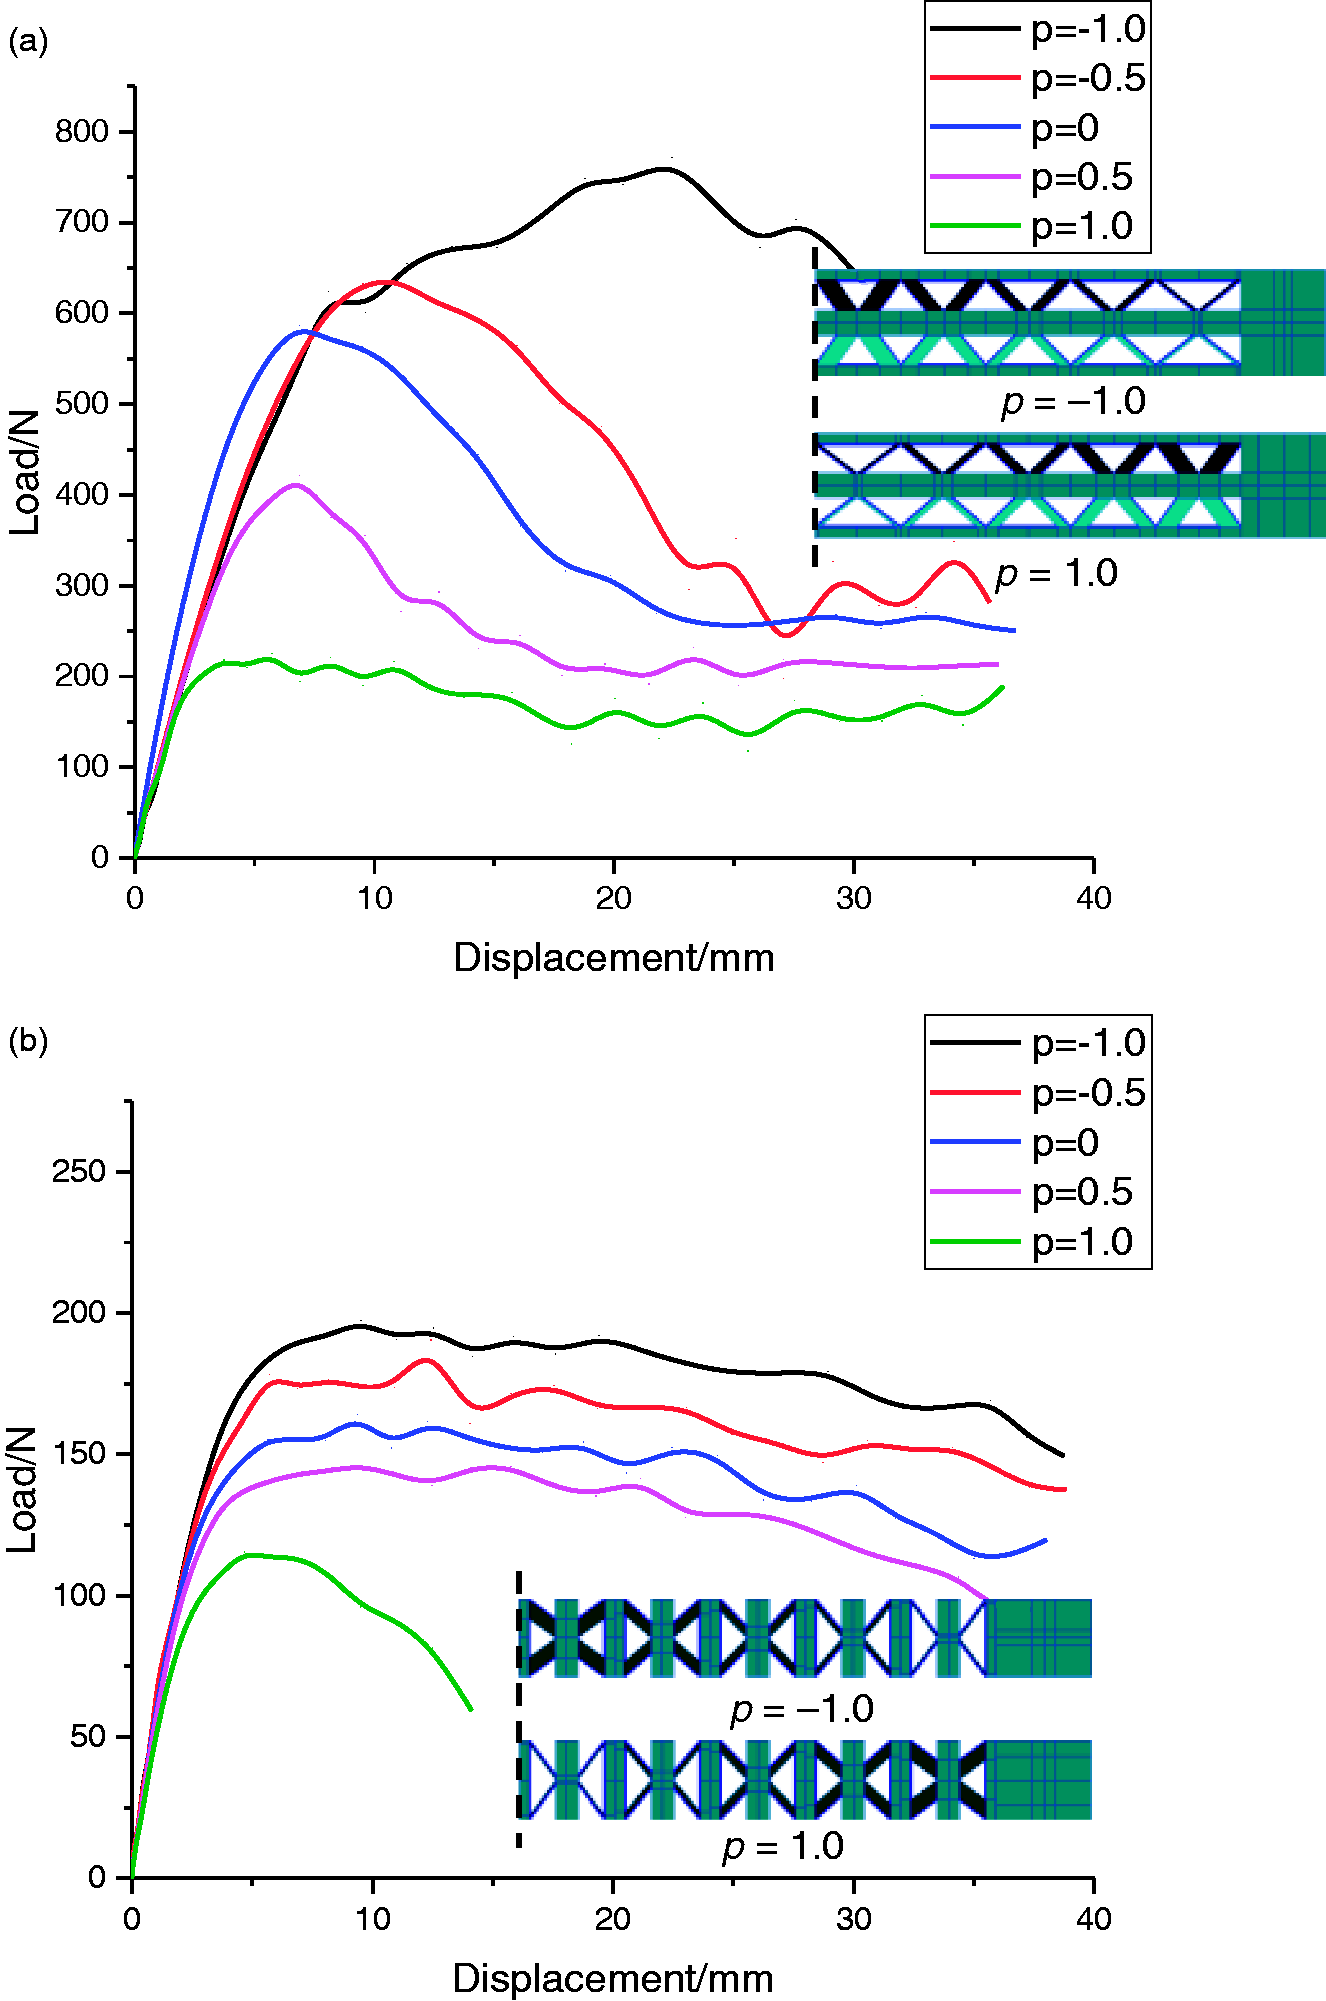
The load–displacement curves of linear bar-width-changed graded lattice structure: (a) the X-type lattice structure; (b) the Y-type lattice structure.
The curves of the X-type lattice structure in Figure 11(a) show that the difference between the peak load and the final residual failure load decreases with the increase in p. This causes the curve with p = 1 to look like most of the curves of Y-type lattice structure in Figure 11(b). However, the failure model of the X-type structure is still sandwich bar buckling as shown in Figure 12(a). The curve with p=−1 shows that there is another buckling next to the place for the initial buckling in the lattice structure. The final failure modes are shown in Figure 12(c). Therefore, it can be concluded that the failure mode changes from the sandwich bar buckling of the middle cell to that of the end cells with the change in p from 1 to −1.
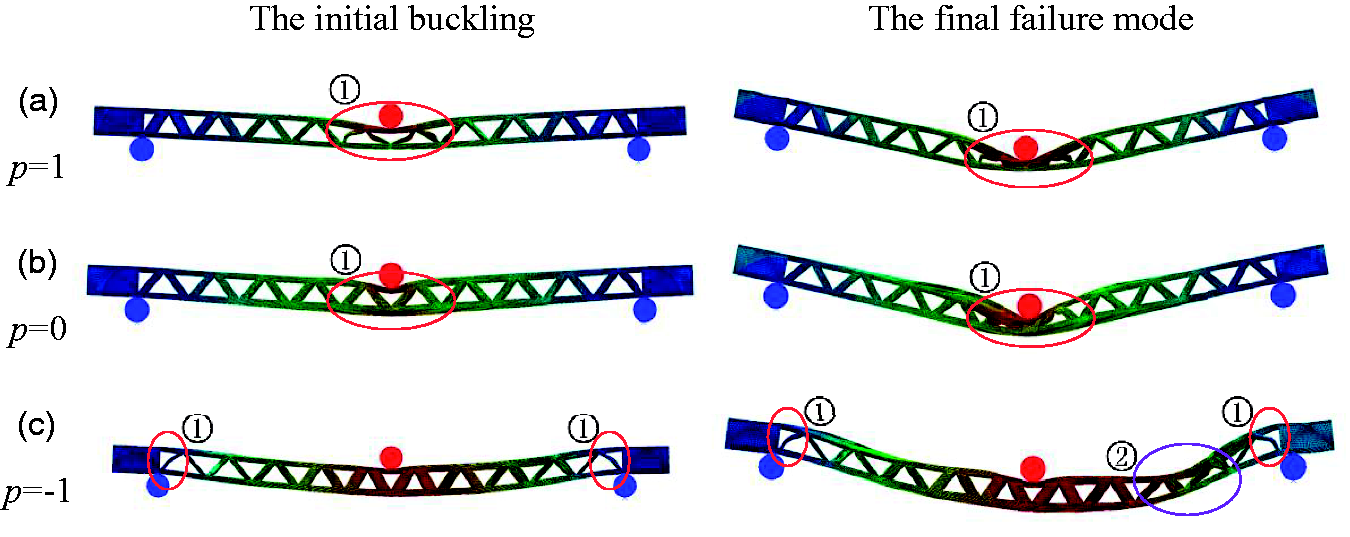
The failure modes of the X-type structures: ① and ② denote the initial buckling and the second buckling.
The curves of Y-type lattice structure in Figure 11(b) show the changing of failure modes with the change of p. The final failure modes are shown in Figure 13. Therefore, it can be concluded that the failure mode changes from the face wrinkling to the sandwich bar buckling of the middle cell when p changes from 1 to −1.
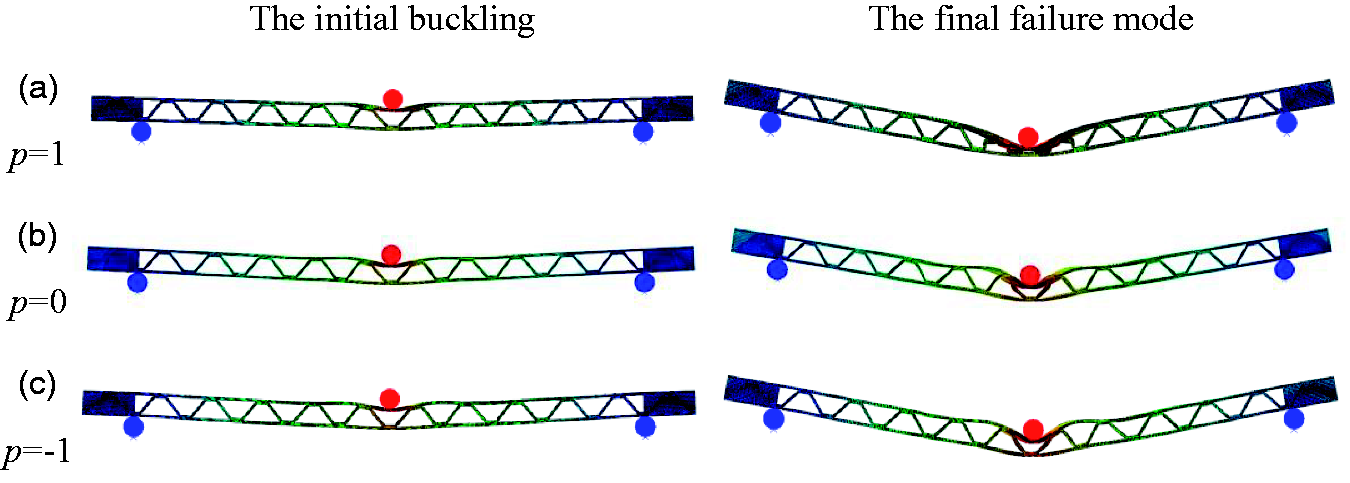
The failure modes of the Y-type structures.
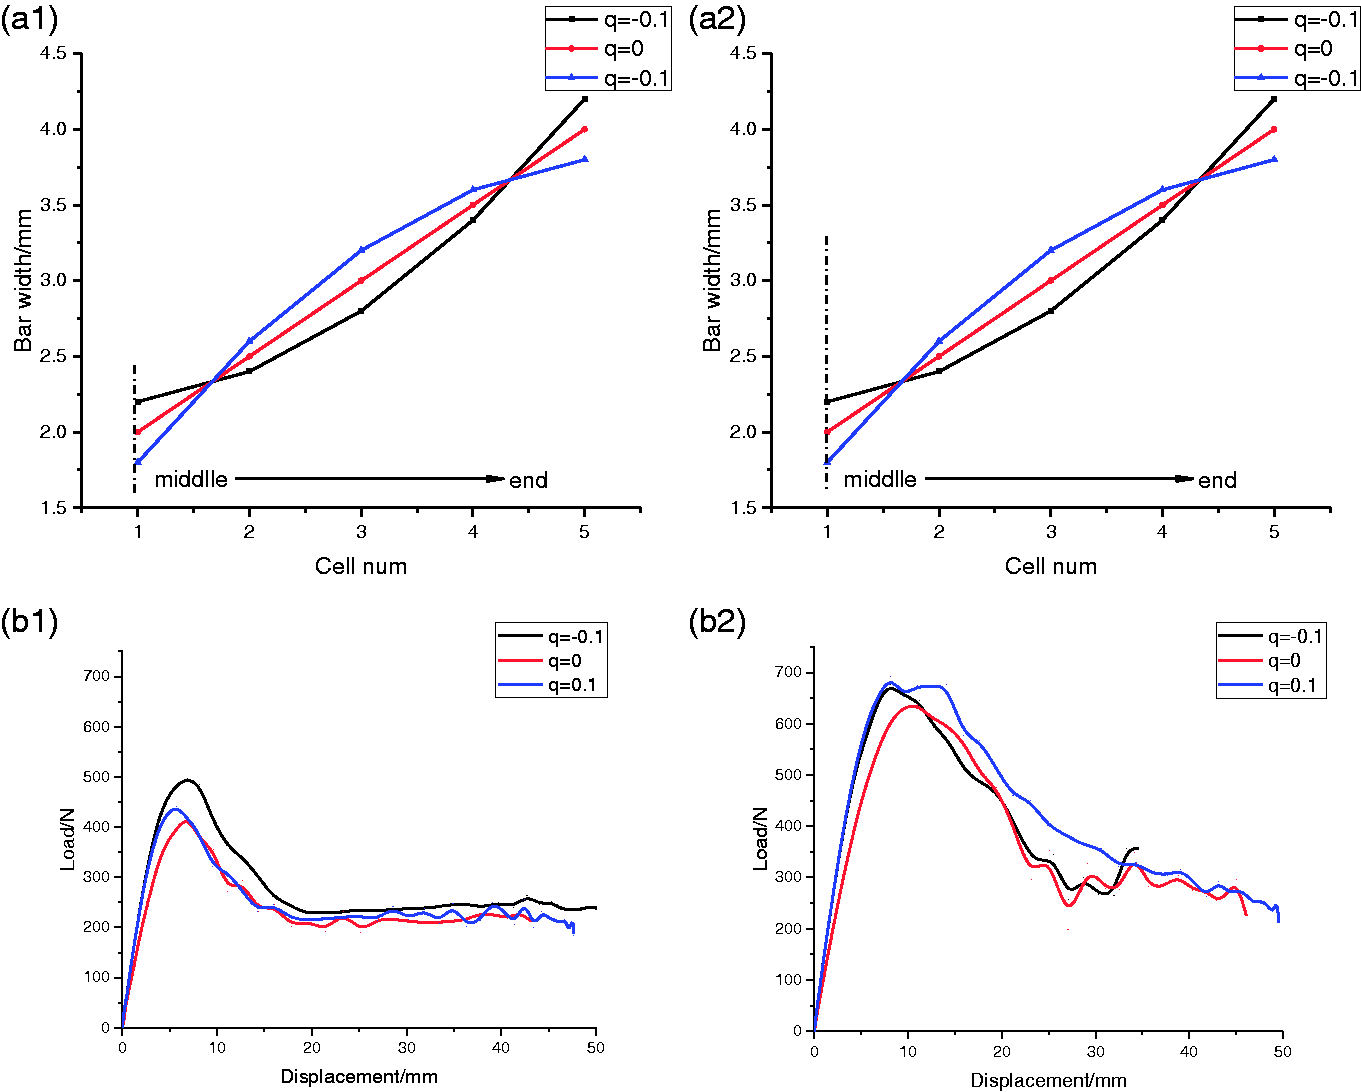
Nonlinear bar-width-changed graded lattice structure load–displacement curves: (a1) the bar width for the structure with p = 0.5; (a2) the bar width for the structure with p = −0.5; (b1) the load–displacement curves for the structure with p=0.5; (b2) the load–displacement curves for the structure with p = −0.5
Results of the nonlinear bar-width-changed graded lattice structure with constant mass
A quadratic function can be used to design the variation of graded sandwich bar width, which is used to analyze the effect of the arrangement of graded sandwich bar width, which is shown as the following

The results in Figure 14 show that the wider bar in the middle and ends of the structure will increase the failure load of the structure. The reason being the damage and failure of the structure mostly happens in the area near the loading nose.
Results of the bar-width-changed graded lattice structure with constant mass under different loading methods
The load-bearing capacity of the graded lattice structure is affected by the loading method. The loading method in the previous simulation calculation is Type A as shown in Figure 15, the upper loading nose is supported by the upper skin, where this method achieves the structure’s minimum load-bearing capacity. In this part, we change the loading method to Type B in Figure 15 by rotating the structure, and the upper loading nose is supported by the upper skin and the core, where this method achieves the structure’s maximum load-bearing capacity. Then we use this method to simulate the X-type linear bar-width-changed graded lattice structure.
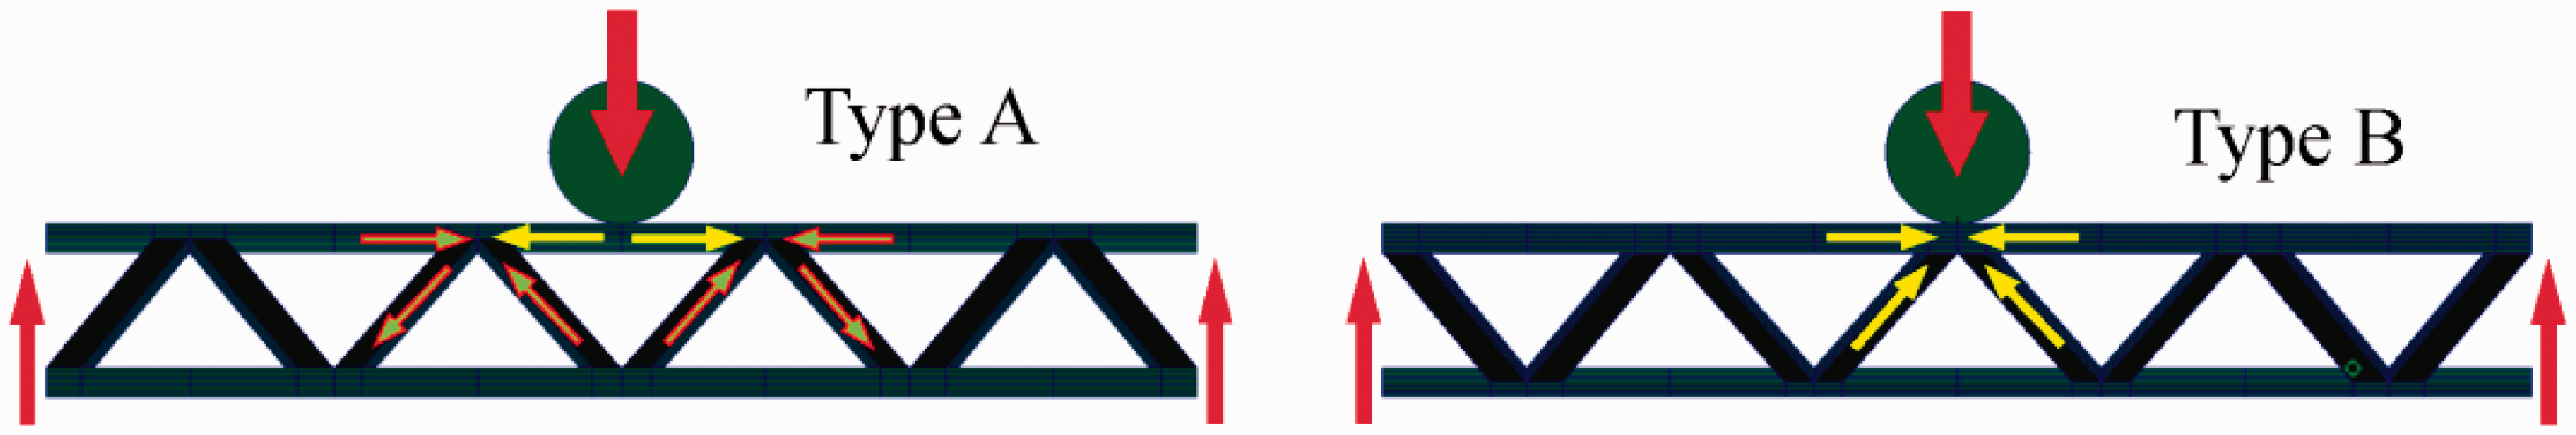
The two types of loading methods.
The curves of the graded lattice structures in Figure 16 show that the different loading method can significantly improve the resistance to buckling and the load-bearing capacity of the structures. The failure loads of the structures are improved by about 20% by changing loading type. The reason why the curves with p = −1 are similar is that the failure mode of the structures is the sandwich bar buckling of the end cells as shown in Figure 13(c).
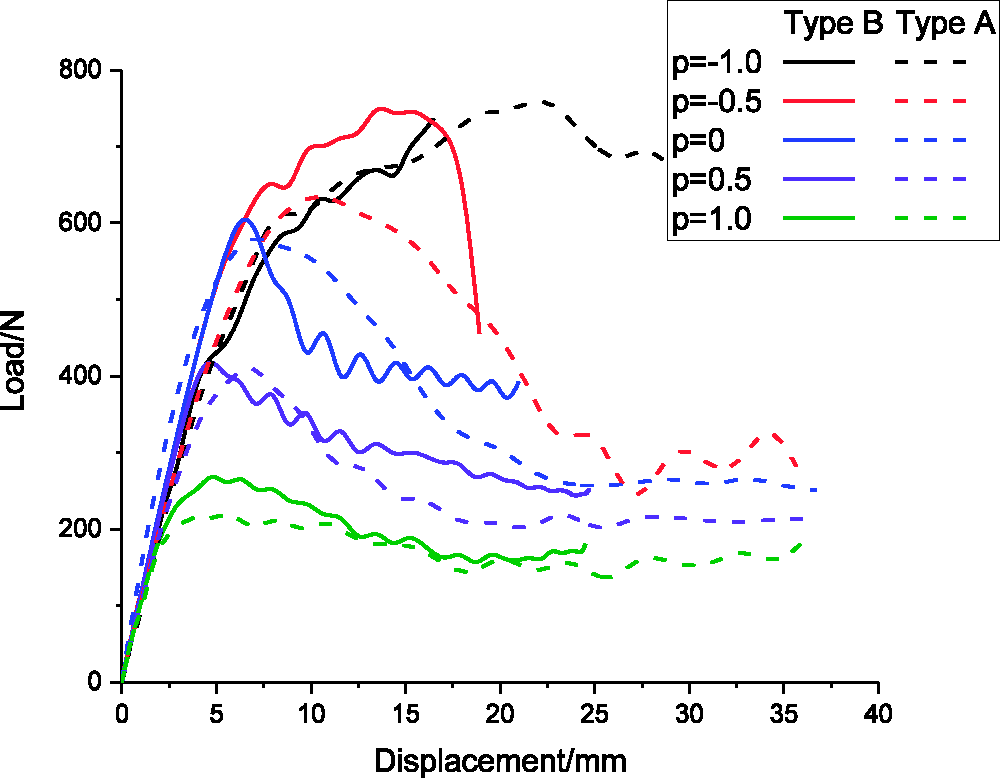
The load–displacement curves of linear bar-width-changed graded lattice structure under the two types of loading methods.
Conclusion
In this paper, a PM method of graded lattice structure has been proposed. The lattice structure with graded cell size or graded sandwich bar width has been built by PM method, and the continuum damage model has been used to evaluate the failure load of the structures. The failure load of the structure under three-point bending load is investigated.
A PM method has been proposed for the graded lattice structures. The failure mode of the structure is predicted by using a continuum damage model. The damage mainly happens in the area between the sandwich bars and the bonding area. Based on the PM method and damage model, the cell-size-changed graded lattice structures with constant cell density are designed and simulated under three-point bending. The results show that the smaller the middle cell is, the stronger the structure is. The graded parameters improve the failure load of the X-type structures by up to about 20% and that of the Y-type structures by up to about 52%. The bar-width-changed graded lattice structures with constant structure mass are designed and simulated under three-point bending. For the linear graded structures, the wider sandwich bar in the middle of the structure improves the failure load of the structure. The graded parameters improve the failure load of the X-type structures by up to about 31% and that of the Y-type structures by up to about 20%. For the linear graded structures, the quadratic equation can further optimize the failure load of the structure. Particularly, the failure modes can be changed by the graded parameters.
Footnotes
Declaration of Conflicting Interests
The author(s) declared no potential conflicts of interest with respect to the research, authorship, and/or publication of this article.
Funding
The author(s) disclosed receipt of the following financial support for the research, authorship, and/or publication of this article: This work was sponsored by NSFC (No. 11432005).