
Abstract
Composite honeycomb sandwich structure is widely used for aircraft structures such as control surfaces, radomes, engine cowls, and aircraft interior structure because of its lightweight and high strength characteristics. One of the disadvantages of honeycomb sandwich structure is that they are prone to fluid intrusion. The purpose of this study is to determine if the structural properties of honeycomb core are affected by contact with a fluid. The test specimens were manufactured of fiberglass prepreg for the facesheets and Nomex® honeycomb core for the core material in accordance with ASTM C-365/365M. Test specimens were soaked in several different kinds of fluids, such as aircraft fuel, turbine engine oil, hydraulic fluid, and water for a period of 60 days. Some of specimens were tested right after soaking period ended, and some of them were dried before they were tested. A flatwise compressive test was performed, and the test results were analyzed to determine how the contact with aircraft fluids affected the compressive strength of the Nomex® honeycomb core and how the strength was recovered when the specimens were dry. In addition, the investigation of de-bonding between facesheet and core material after soaking was performed to support the study.
Introduction
The use of composite sandwich structures has increased significantly. The main application of composite sandwich structure is in the aerospace industry because a high stiffness-to-weight ratio of a structure is one of the most critical factors during the aircraft design process [1–7]. An aircraft design requires the aircraft structure to resist various kinds of loads that are applied to the aircraft structure. One of the most effective ways to stiffen the structure and to resist a deforming force is to use a honeycomb sandwich structure [8]. For this reason, composite sandwich structure is used not only in primary structure of the aircraft, such as wings, fuselage, flaps, rudder, and fairings, but also for engine cowls, nacelles, radomes, floors, doors, and overhead storage bins [1,2,9–11]. Besides the high strength-to-weight ratio, composite sandwich structure has many other advantages, such as corrosion resistance, design flexibility, fatigue resistance, and high temperature resistance [1,3,4,9,12]. Because of these advantages, traditional materials such as aluminum and steel have been replaced by composite materials. Sandwich structure can be divided into three different sections: facesheets, core, and adhesive [3,5,9]. The facesheet is a thin rigid panel with a relatively high elasticity modulus [3,13]. A facesheet is usually made out of fiberglass, carbon fiber, or Kevlar-reinforced laminate [3,5,13]. The core material is a thick and low density material that provides stiffness normal to the face direction [5,13]. The most common core materials used are aluminum honeycomb, Nomex® honeycomb, and foam core [3,5,6,9,13]. Nomex® honeycomb core is often used in the aerospace and automotive industry [6,10,14]. Nomex® honeycomb consists of a phenolic resin-coated Nomex® paper which is made of aramid fiber [6,10,12]. The mechanical property of Nomex® honeycomb is determined by the material properties and proportion of aramid fiber and phenolic resin of the honeycomb. The bonding strength between the fibers also affects the properties of the Nomex® honeycomb core material [10]. Nomex® honeycomb has several advantages such as flammability and dielectric, and it is corrosion resistant with the face material [12].
Honeycomb sandwich structure used in aircraft structures is exposed to various kinds of loads during application, such as impact loading, concentrated loading, and vibration [9,12]. In addition, composite honeycomb sandwich structure is often used in various environmental conditions during the operational use of the aircraft [2,9,11]. In certain conditions, the structure is exposed to fluids such as water, moisture, oil, or solvent [9]. The structural behavior of the sandwich structure under these loads with various environmental factors must be tested and analyzed before the structures are introduced to a real environment [6,12]. There are many possible ways that fluids can intrude into a honeycomb sandwich structure. Fluid ingresses into the structure through joints, closeouts, and inserts of sandwich structure [11,15]. Skin damage, such as a crack, can provide an intrusion path for moisture [1,7,11,15,16]. Possible pathways of moisture ingression are negative gage pressure in the cell caused during the curing process, which draws the moisture into the cell [7]. Even when there is no damage to the skin panel, moisture can diffuse through porosity and micro-cracks that are induced from thermal cycles [7,15,16]. When moisture ingresses into a honeycomb structure, the pattern of the infiltration is very random and unpredictable [17]. The speed of moisture infiltration through the honeycomb is very slow. Infiltration to the first row of the core on the exposed side is relatively fast, but after the first row, diffusion rates are significantly slower and inconsistent. Diffusion rates vary with the type of test samples [18]. Moisture absorption is a common behavior for composite materials [2,3,14,19]. Compared to the other structural materials, polymeric materials absorb more water, hydraulic fluid, and solvents [9]. Cise and Lakes [19] reported that epoxy matrix composites can absorb water by 5 wt%. The liquid absorption rate of the honeycomb core is higher than the facesheet laminate because the core has a lower density than the facesheets [9]. Paper honeycomb core in particular is very sensitive to temperature and humidity [20]. It changes its mechanical properties dramatically when the environment changes. Although it cannot achieve its design capability in changing environmental conditions, not many of them account for moisture ingression during the design phase [19,20].
Several research studies have shown the adverse effects of water or fluid intrusion into honeycomb core [3]. They reported that absorbed liquids can degrade the mechanical, thermal, electrical, or physical properties of the structure [9]. If a honeycomb part is exposed to a humid environment for a long time, the moisture ingresses into the honeycomb panel, and the water will cumulate inside the honeycomb core cells. This water increases the weight of the part, and it makes the honeycomb structure lose its main beneficial aspect, light weight [21]. Yeo et al. [14] showed the degradation of flatwise tension strength and compression after impact strength of Nomex® honeycomb sandwich test specimen in hot/wet condition. Wang et al. [20] reported that a higher moisture content decreases the critical stress and plateau stress of the honeycomb during compressive test with paper honeycomb. Semple et al. [4] showed that paper honeycomb losses its flexural stiffness, shear strength, and compressive strength significantly in high humidity (95% RH) compared to normal humidity (65% RH). Allred and Roylance [22] and Yin et al. [23] reported that degradation of mechanical property of Nomex® honeycomb core is caused by water molecules which destroy hydrogen bond network of the aramid fiber. If a composite structure absorbs moisture, the polymer matrix can be plasticized which degrades the structure (physical aging). Plasticization of the polymer matrix decreases the glass transition temperature (Tg) of a composite material, and a decreased Tg leads to a decrease in stiffness of the composite material and increases mechanical damping [19]. Moisture ingression can cause degradation of the adhesive bond of the panel and could lead to a complete debonding between facesheet and the core of the honeycomb sandwich structure [3,11,14,21]. If there is moisture inside the honeycomb cell, repeated freeze and thaw mechanism caused by temperature change cause destruction of the honeycomb core and the bond between facesheets and the core [1,7]. However, Fogarty [15] reported that honeycomb sandwich structure can trap some moisture in a real operational environment, but it is not true that wide spread ingression of moisture for entire structure is inevitable. Fogarty [15] showed that many researchers found that moisture ingression can be prevented. Even if there is moisture ingression into the structure, it does not cause progressive weight increase and strength degradation [15]. Also, Kim et al. [24] reported that flexural strength and impact resistance strength of Nomex® honeycomb sandwich structure which was soaked in fuel, oil, hydraulic fluid, and water did not show a significant degradation after 30 days of draining period. This study demonstrated the influence of aircraft fluids such as fuel, oil, hydraulic, and water on mechanical properties, especially the compressive strength of Nomex® honeycomb sandwich structure. Also it showed how the fluids affected the bonding area between facesheets and the core.
Experiment
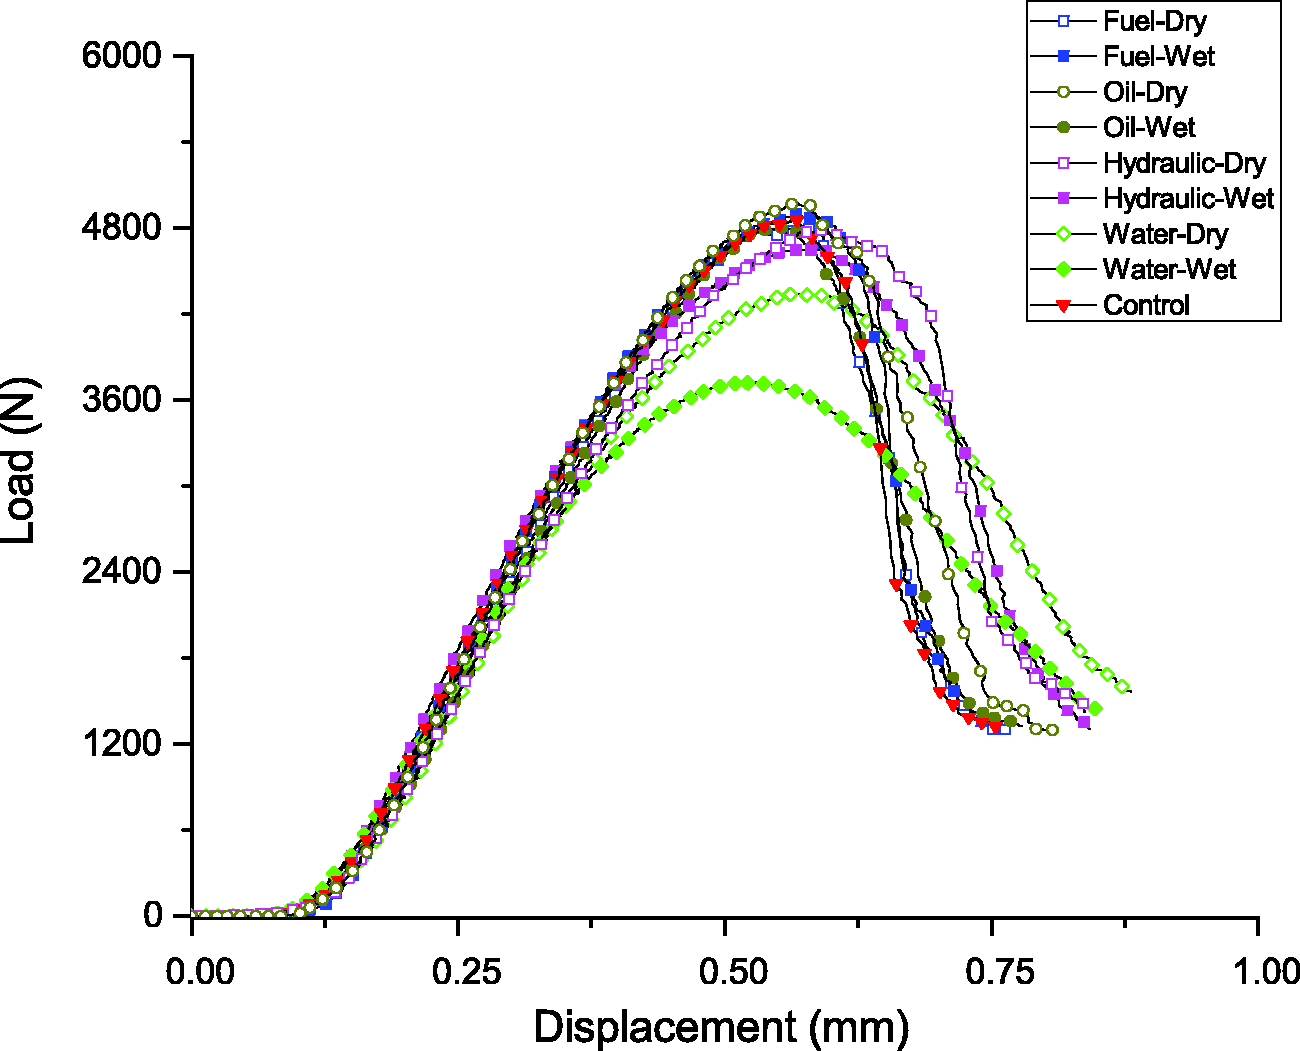
Honeycomb structure test specimens were prepared in accordance with ASTM C365/C365M-16 standard. The test specimen consisted of three different components: facesheets, honeycomb core, and film adhesive. A facesheet for both sides of the specimen was needed to prevent local crush of the honeycomb core. Facesheets were made of HexPly F155 fiberglass prepreg material. Fiberglass facesheet provided transparency to see through the facesheet to check the liquid pooling in a honeycomb cell during the soaking period. Two layers of prepreg material with a [0/90] orientation were laid up and cured. The 1.27-cm thick hexagonal Nomex® honeycomb core was bonded to the facesheets using AX 2114 epoxy film adhesive. The specification of the film adhesive which was used in this study is attached in Appendix 1. The density of the core was calculated using following equation [25]
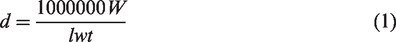
Honeycomb sandwich panel assembly drawing and the test specimen.
Four different kinds of fluids were used for this research: Jet-A fuel, Mobile Jet oil, Skydrol LD-4 hydraulic fluid, and distilled water. These four fluids are most commonly used in aircraft, and they are prone to ingress into the core through skin panel damage [9]. The specification of each fluid is attached in Appendix 2. The test specimens were placed in a glass container, and the applicable fluid was poured in it. The jar was filled, so that all specimens were completely covered. The extra honeycomb core was placed on top of the specimens inside the container to keep the specimens covered and to prevent them from floating. All containers were sealed and stored for 60 days.
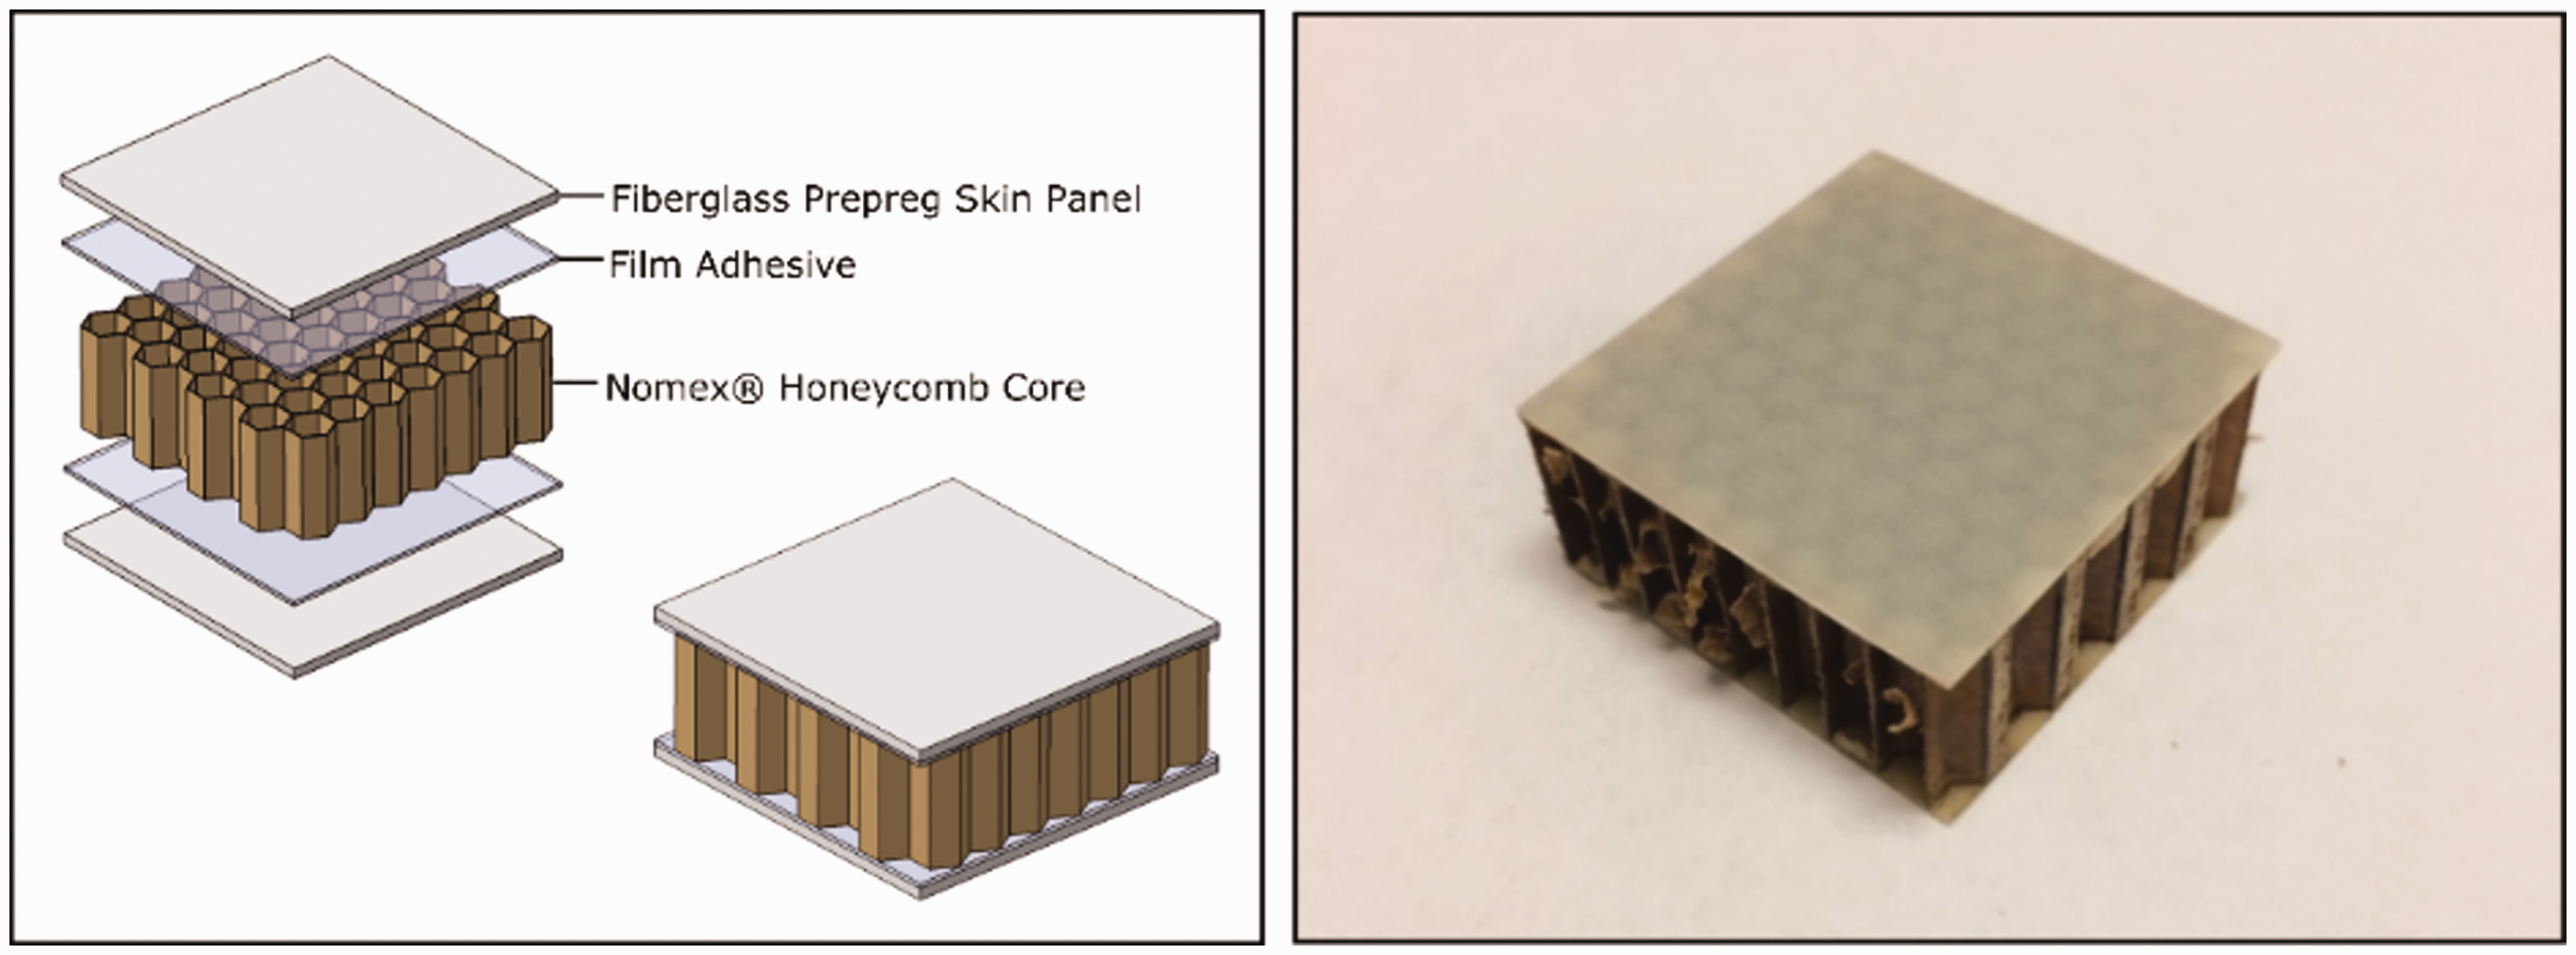
The test specimens were divided into two different groups: wet group and dry group. Wet group specimens were removed from the container after they were soaked and tested right away. Dry group specimens were left outside for one week after they were removed from the fluid container to drain the fluid out from the inside of the core before they were tested. The authors designed the test to investigate how honeycomb sandwich structure recovers its mechanical strength when it dried. Each specimen was weighted right before it was tested to check fluid content of each specimen. A MTS 810 test machine was used for the test. A self-aligning flat table was used as the bottom fixture, and a fixed head flat fixture was used for the top fixture. The test speed was set at 0.50 mm/min. Time, displacement, and load were measured, and the sampling rate was three data records per second. Figure 2 illustrates the test fixtures and testing process.
Test settings and the compressed test specimen.
Results
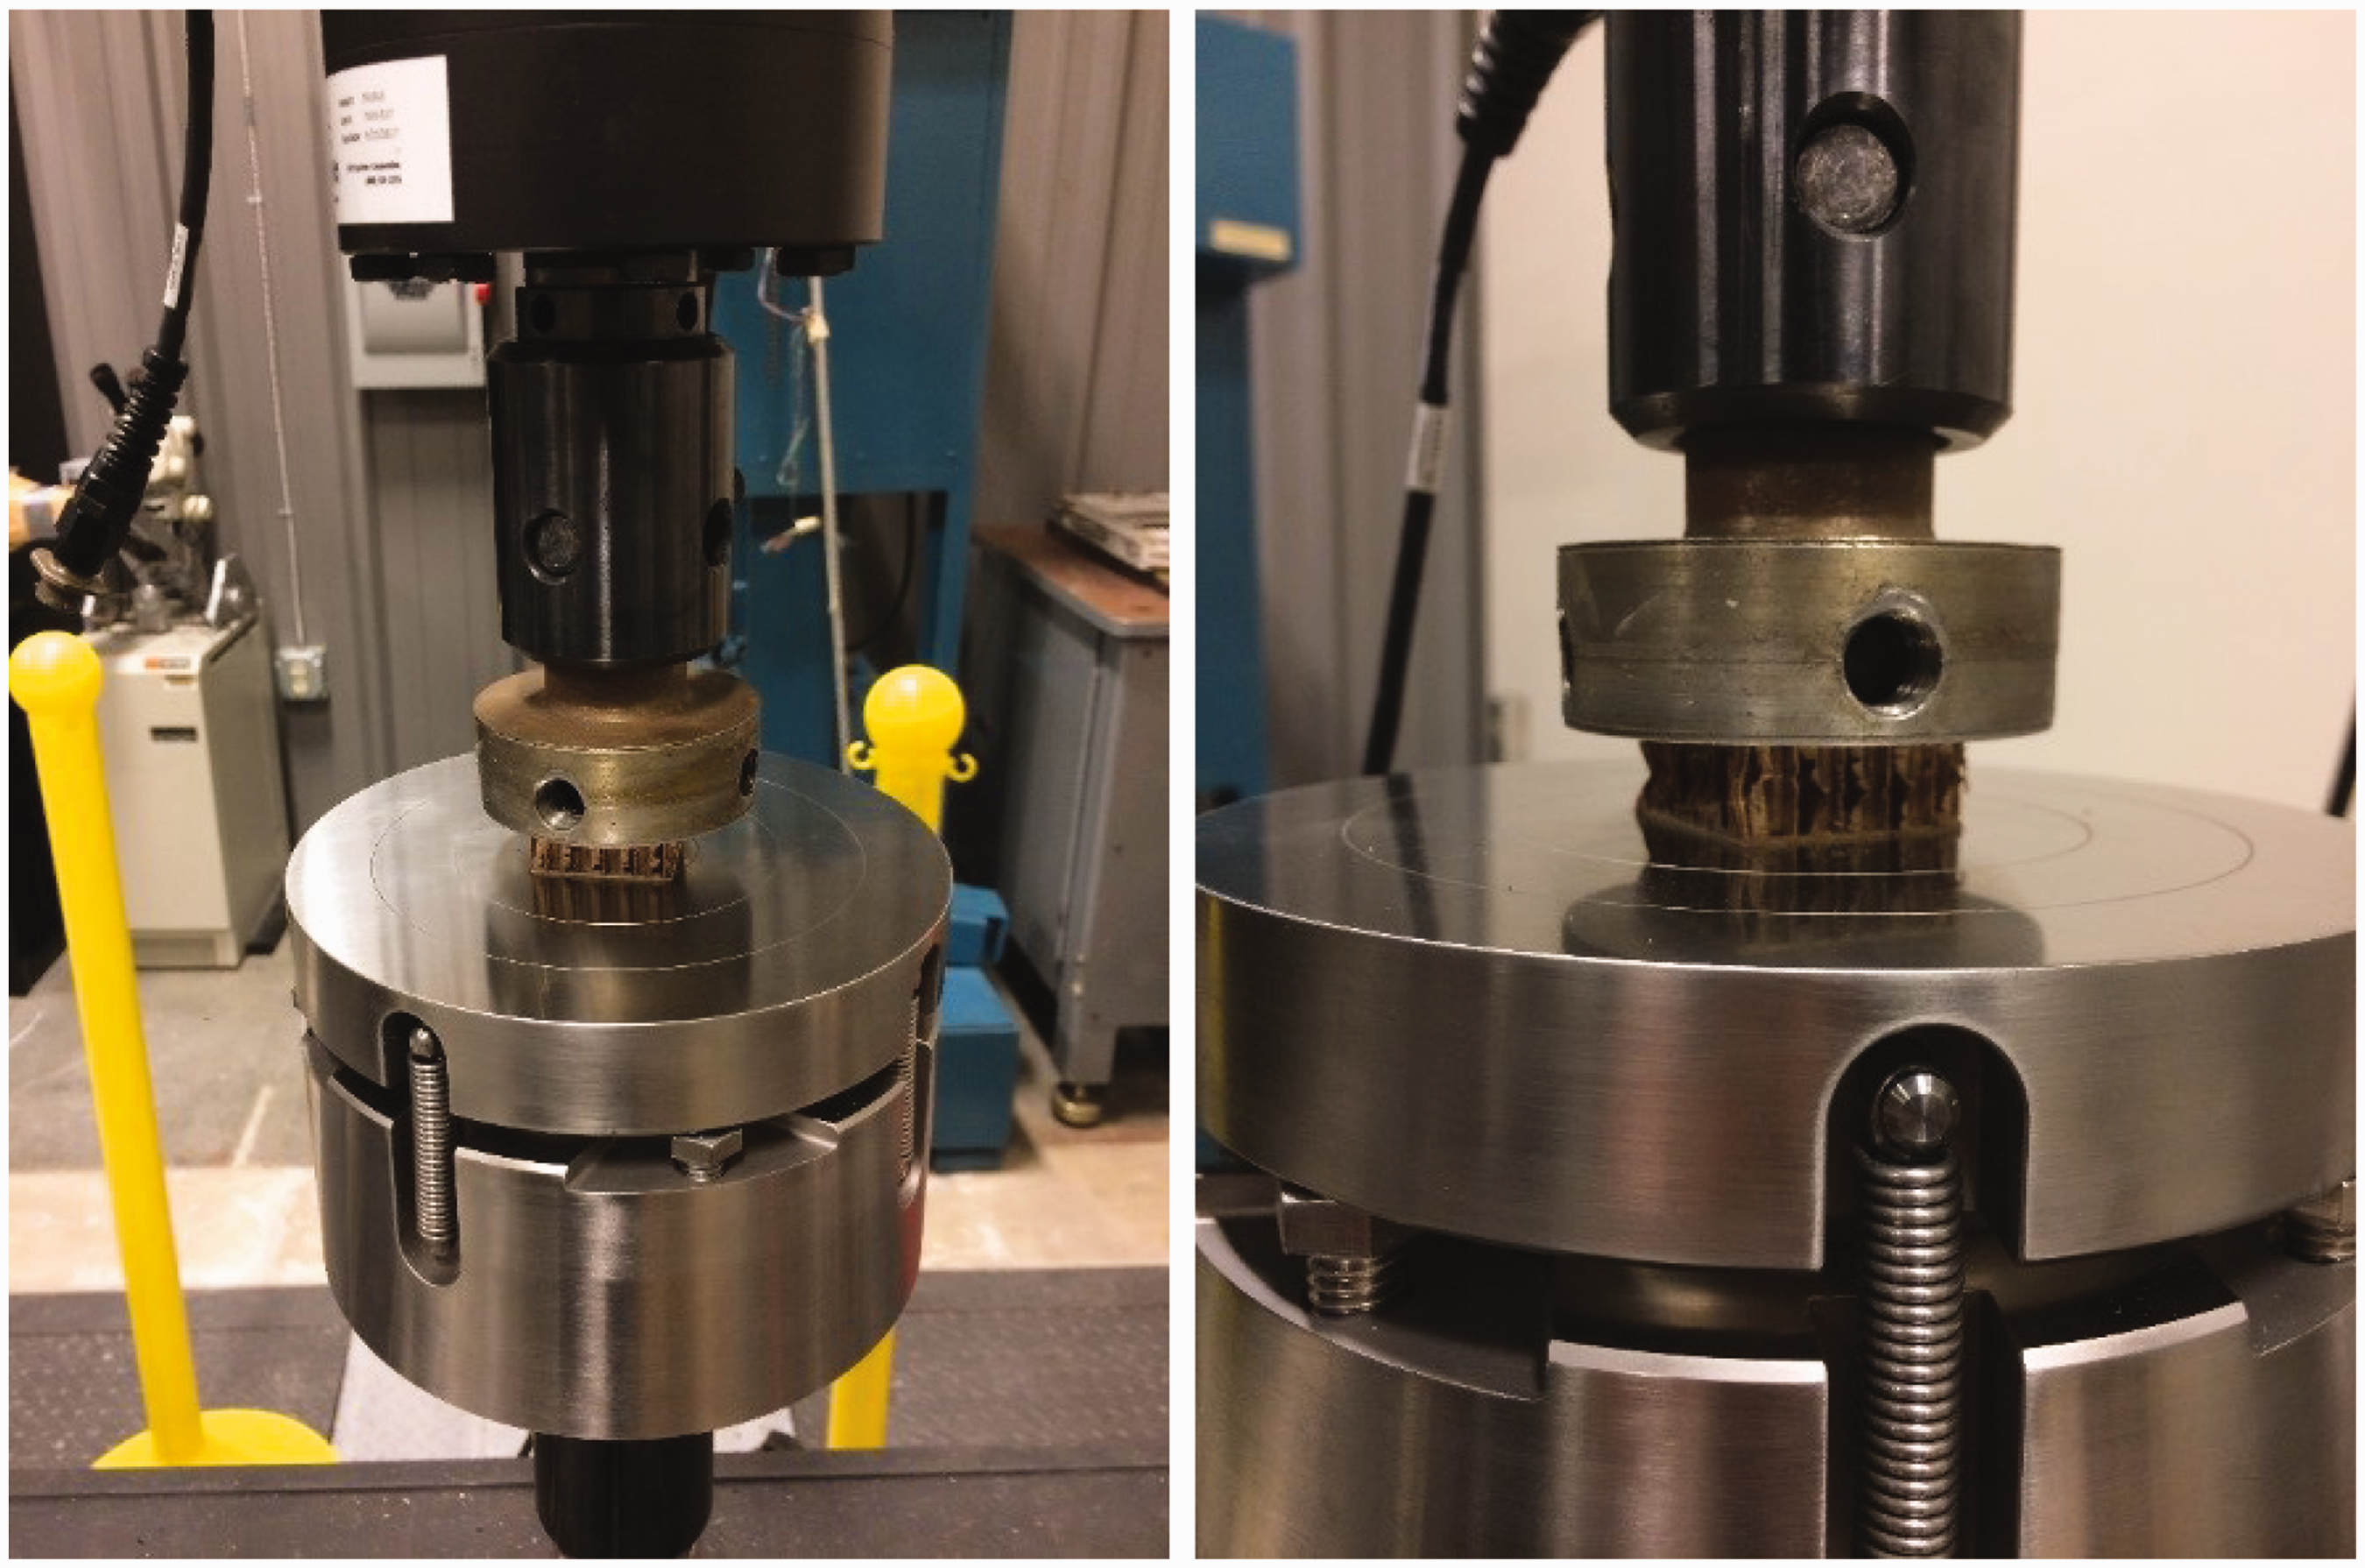
There were nine subgroups of test specimen: fuel-wet, fuel-dry, oil-wet, oil-dry, hydraulic-wet, hydraulic-dry, water-wet, water-dry, and control group. In each subgroup, there were 10 test specimens, except for the control group which had only eight test specimens in the group. A total of 88 test specimens were prepared and tested. A compressive test was performed on each test specimen, and the time, displacement, and load data were collected. OriginPro was used as the data analysis program. For smoothing data and reducing the noises, a five-point adjacent-averaging smooth function with weighted average option was used. Figure 3 shows the load versus displacement plot for representative specimen in each group. Representative specimens were selected for the ones that had the closest ultimate strength to the average ultimate strength for each group.
Load versus displacement plot for representative specimen in each group.
ASTM C365/C365M-16 described using two different values to analyze compressive strength of the honeycomb sandwich structure: ultimate strength and compressive modulus. Ultimate strength of the test specimen was calculated using the following equation [26]

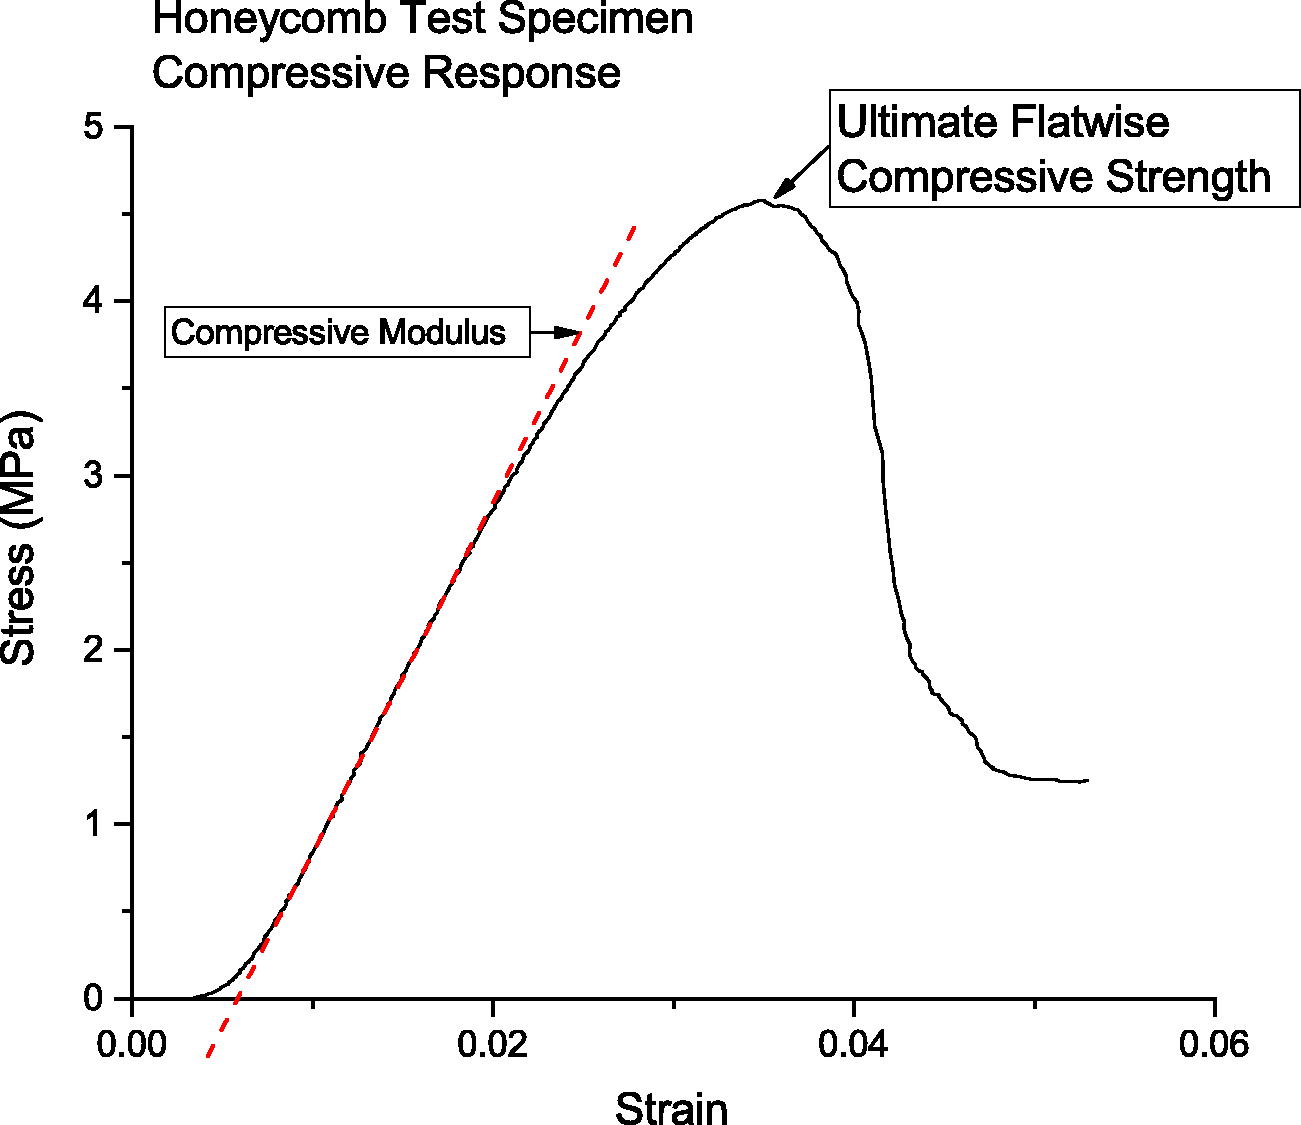
Ultimate flatwise compressive strength and compressive modulus in stress versus strain graph.
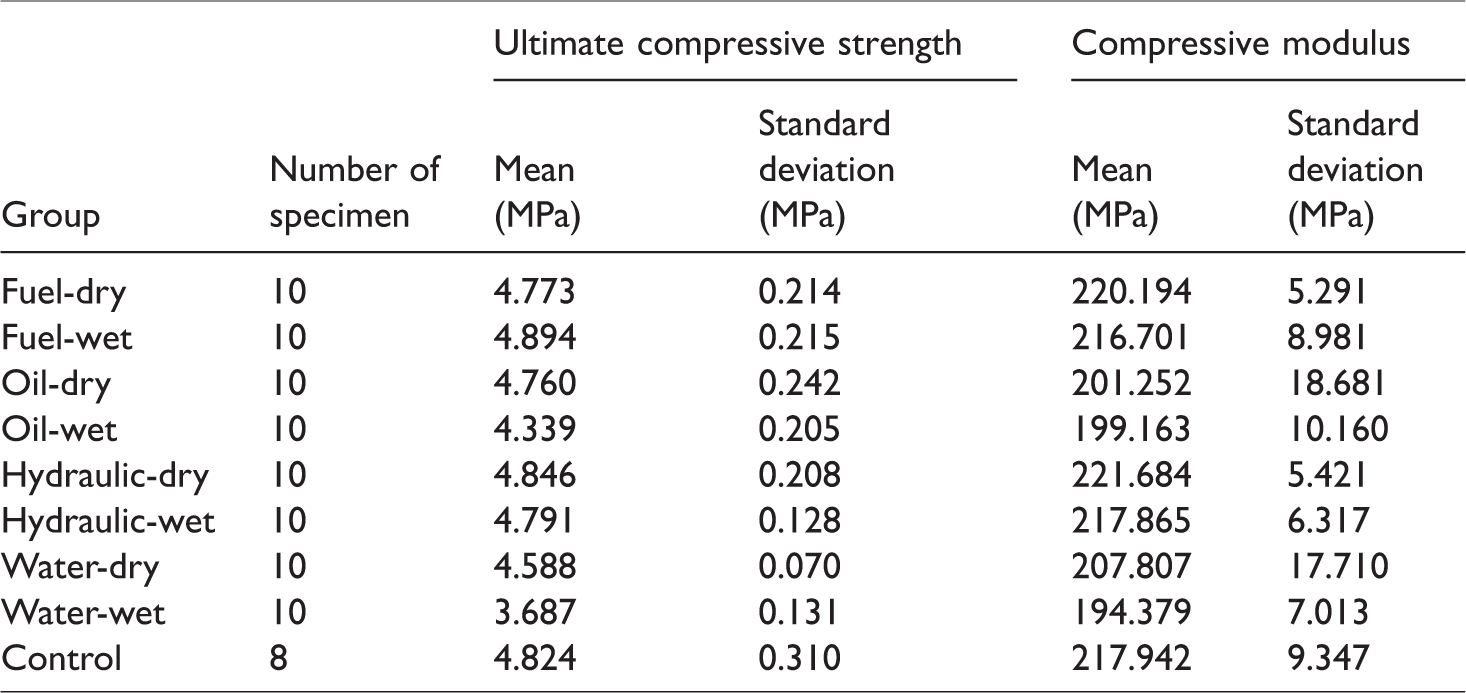
Mean and standard deviation of ultimate compressive strength and compressive modulus of each fluid group.
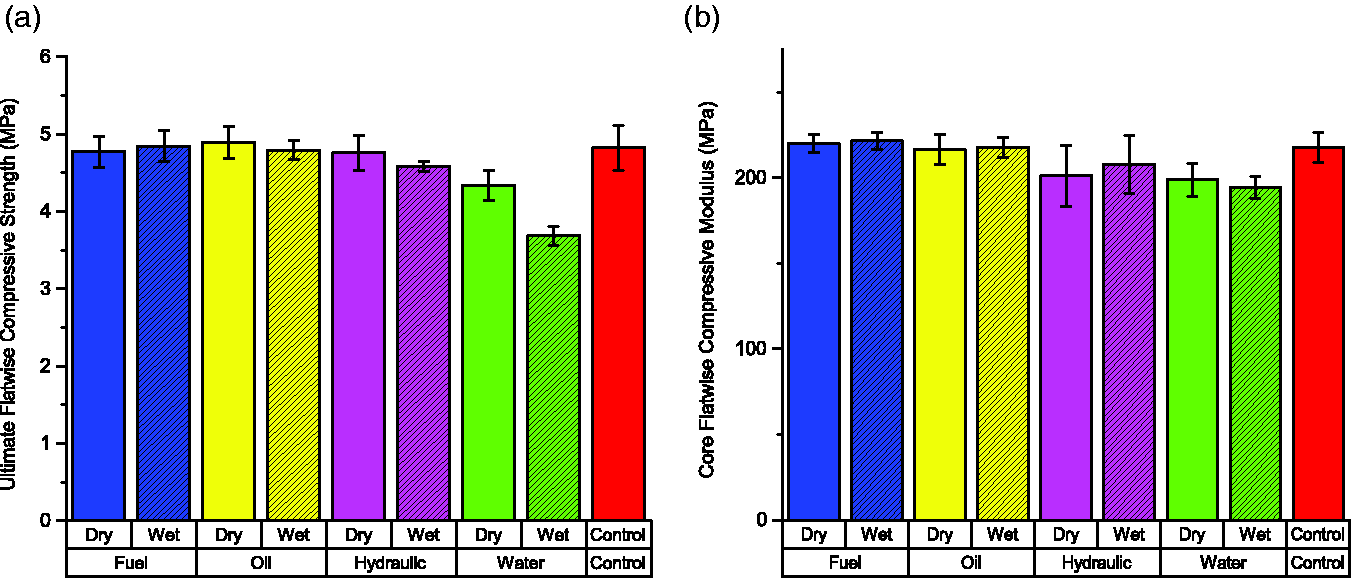
Ultimate flatwise compressive strength (a) and compressive modulus (b) for each test group.
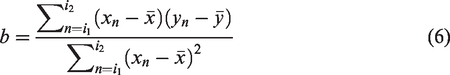
Statistical analysis was performed to find if there was any significant difference on ultimate flatwise compressive strength and the compressive modulus between each specimen group. Since the normality test indicated that not all the data in each specimen group was normally distributed, the authors decided to use the Mann–Whitney test which does not need normality assumption of the data to find any significant degradation of each fluid groups compared to the control group. Significance level of 0.05 with Bonferroni correction was used, 0.05/m, m is number of comparison = 8, 0.05/8 = 0.00625. According to Mann–Whitney test, both water dry (p-value = 0.00513) and wet group (p-value = 4.48668E-4) had significantly lower ultimate flatwise compressive strength than control group. The mean ultimate strength of the water wet group was decreased by 23.57% compared to the control group. Also, the mean ultimate strength of water dry group was decreased by 10.05% compared to the control group. Other fluid groups did not show any significant degradation on ultimate strength of specimen. Statistical data analysis results were described in Appendix 3. The Mann–Whitney test also showed compressive modulus of water dry group (p-value = 0.00388) and water wet group (p-value = 0.00161) were significantly lower than the control group. The water dry group had an 8.62% lower compressive modulus, and water wet group had a 10.81% lower compressive modulus than the control group. Other fluid groups had no significantly lower compressive modulus than the control group. Statistical data analysis results were described in Appendix 3.
Water-wet and water-dry groups showed a significantly lower ultimate compressive strength and compressive modulus. Also, the water-dry group showed a higher compressive strength and modulus than the water-wet group. The test results showed that a Nomex® honeycomb panel recovered its compressive mechanical property after a one-week draining period. Therefore, the relationship between the moisture content of the test specimen and its compressive mechanical property was studied. The moisture content was calculated using the following equation

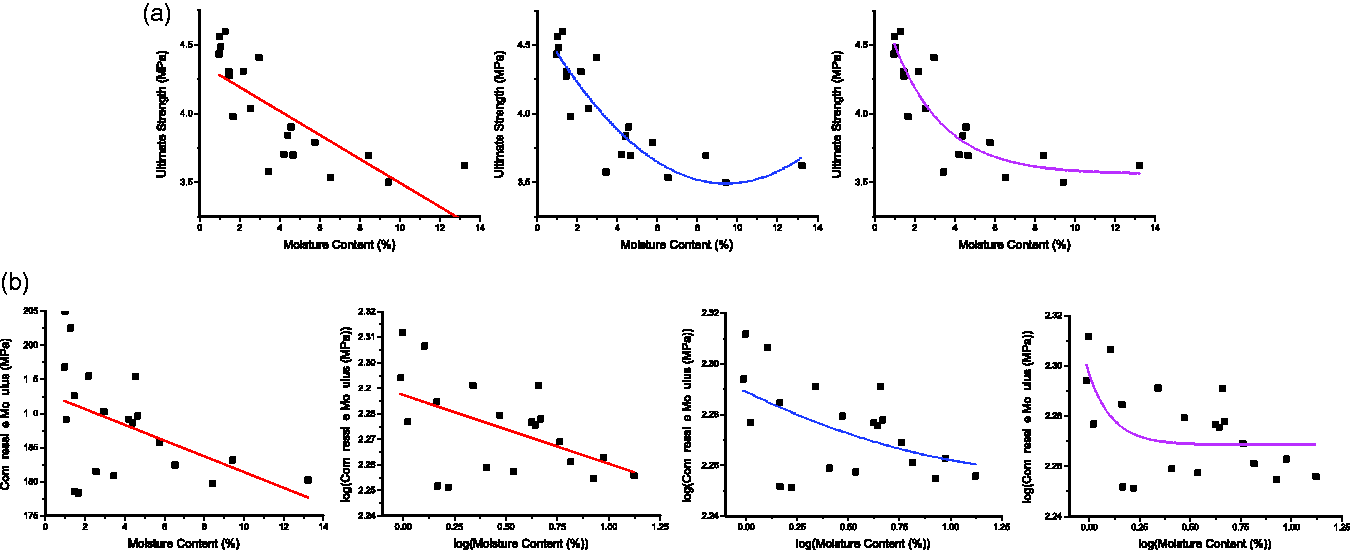
Linear (a-1), polynomial (a-2), exponential (a-3) regression analysis of moisture content versus ultimate strength. Linear regression analysis of and moisture content versus compressive modulus (b-1), and linear (b-2), polynomial (b-3), exponential (b-4) regression analysis of log(moisture content) versus log(compressive modulus).
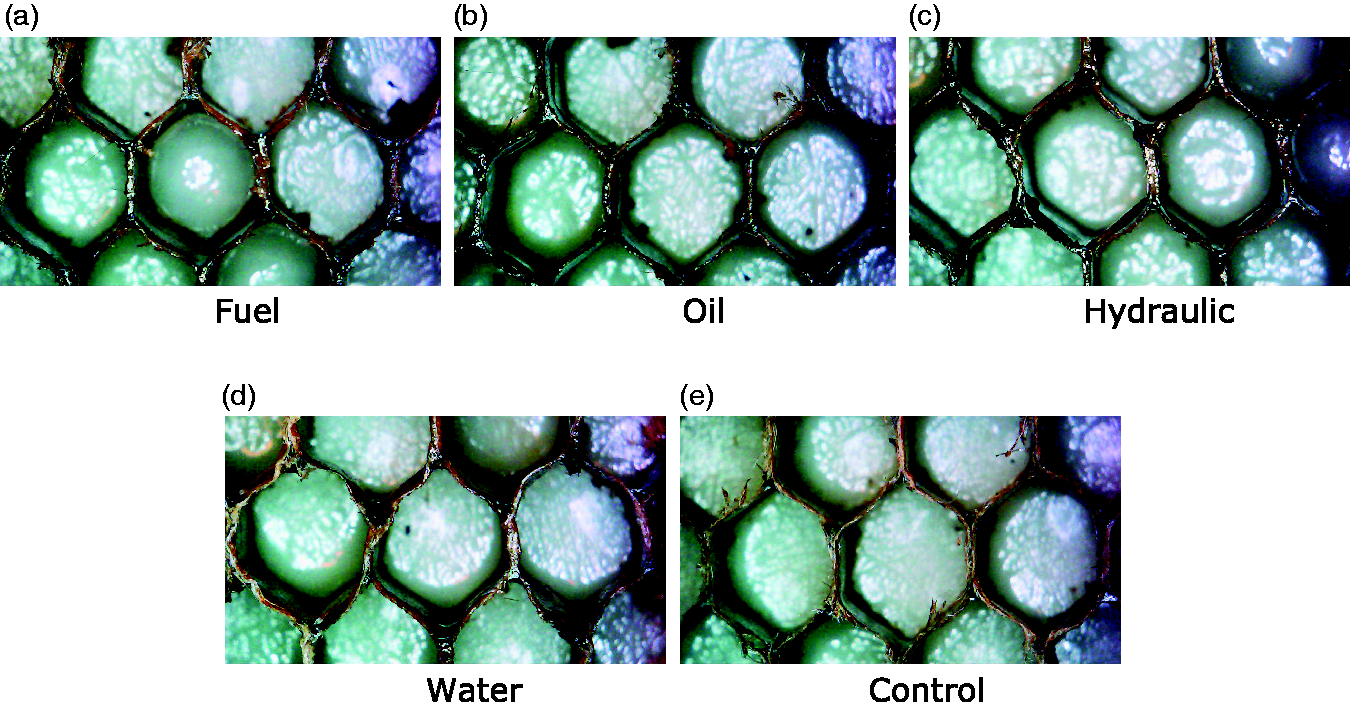
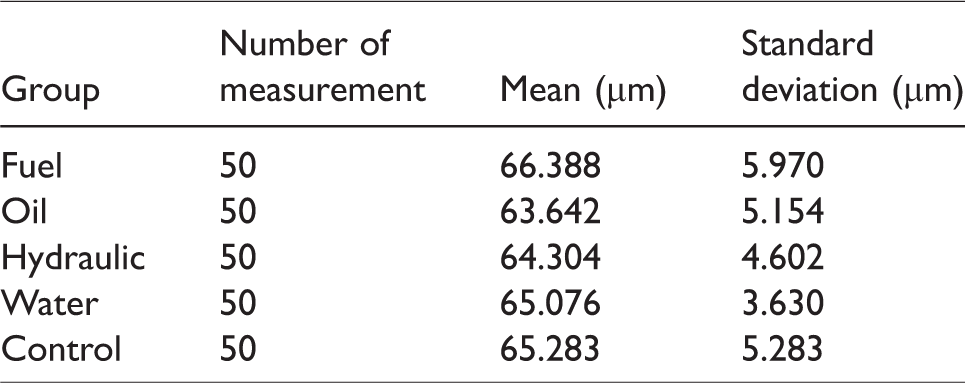
After the test, specimens in each group were cut in half, and the inside of the specimens was inspected to determine how the fluids intruded into the honeycomb core. The liquid pooling in the cells was limited to the first and second row of the cells from the edge of the specimens. The cut cross-sectional area of the core showed that the absorbed fluid intruded all the way to the middle section of the specimen. The honeycomb cell was discolored by the fluids. Figure 7 shows a cut cross-sectional area of tested specimen from each fluid group. The cross-sectional area of the specimen was observed using a microscope to check if there was any significant erosion on the honeycomb wall. The microscopic picture of the specimen from each fluid group did not show any significant erosion on the honeycomb wall. Figure 8 shows the microscopic picture of cross-sectional area of the core for each fluid group. Table 2 shows the wall thickness measurements for each fluid group. Fifty different thickness measurements for a single wall across the cut area were collected, and the Mann–Whitney non-parametric test was used to compare each group to the control group with a Bonferroni correction for a significant level of 0.0125. The Mann–Whitney test showed no significant difference on the wall thickness between each group and the control group. The Mann–Whitney test result is attached to Appendix 4.
The cut honeycomb test specimens after testing.
The microscopic picture of cross-sectional area of honeycomb core from fuel (a), oil (b), hydraulic fluid (c), water (d), and the control group (e).
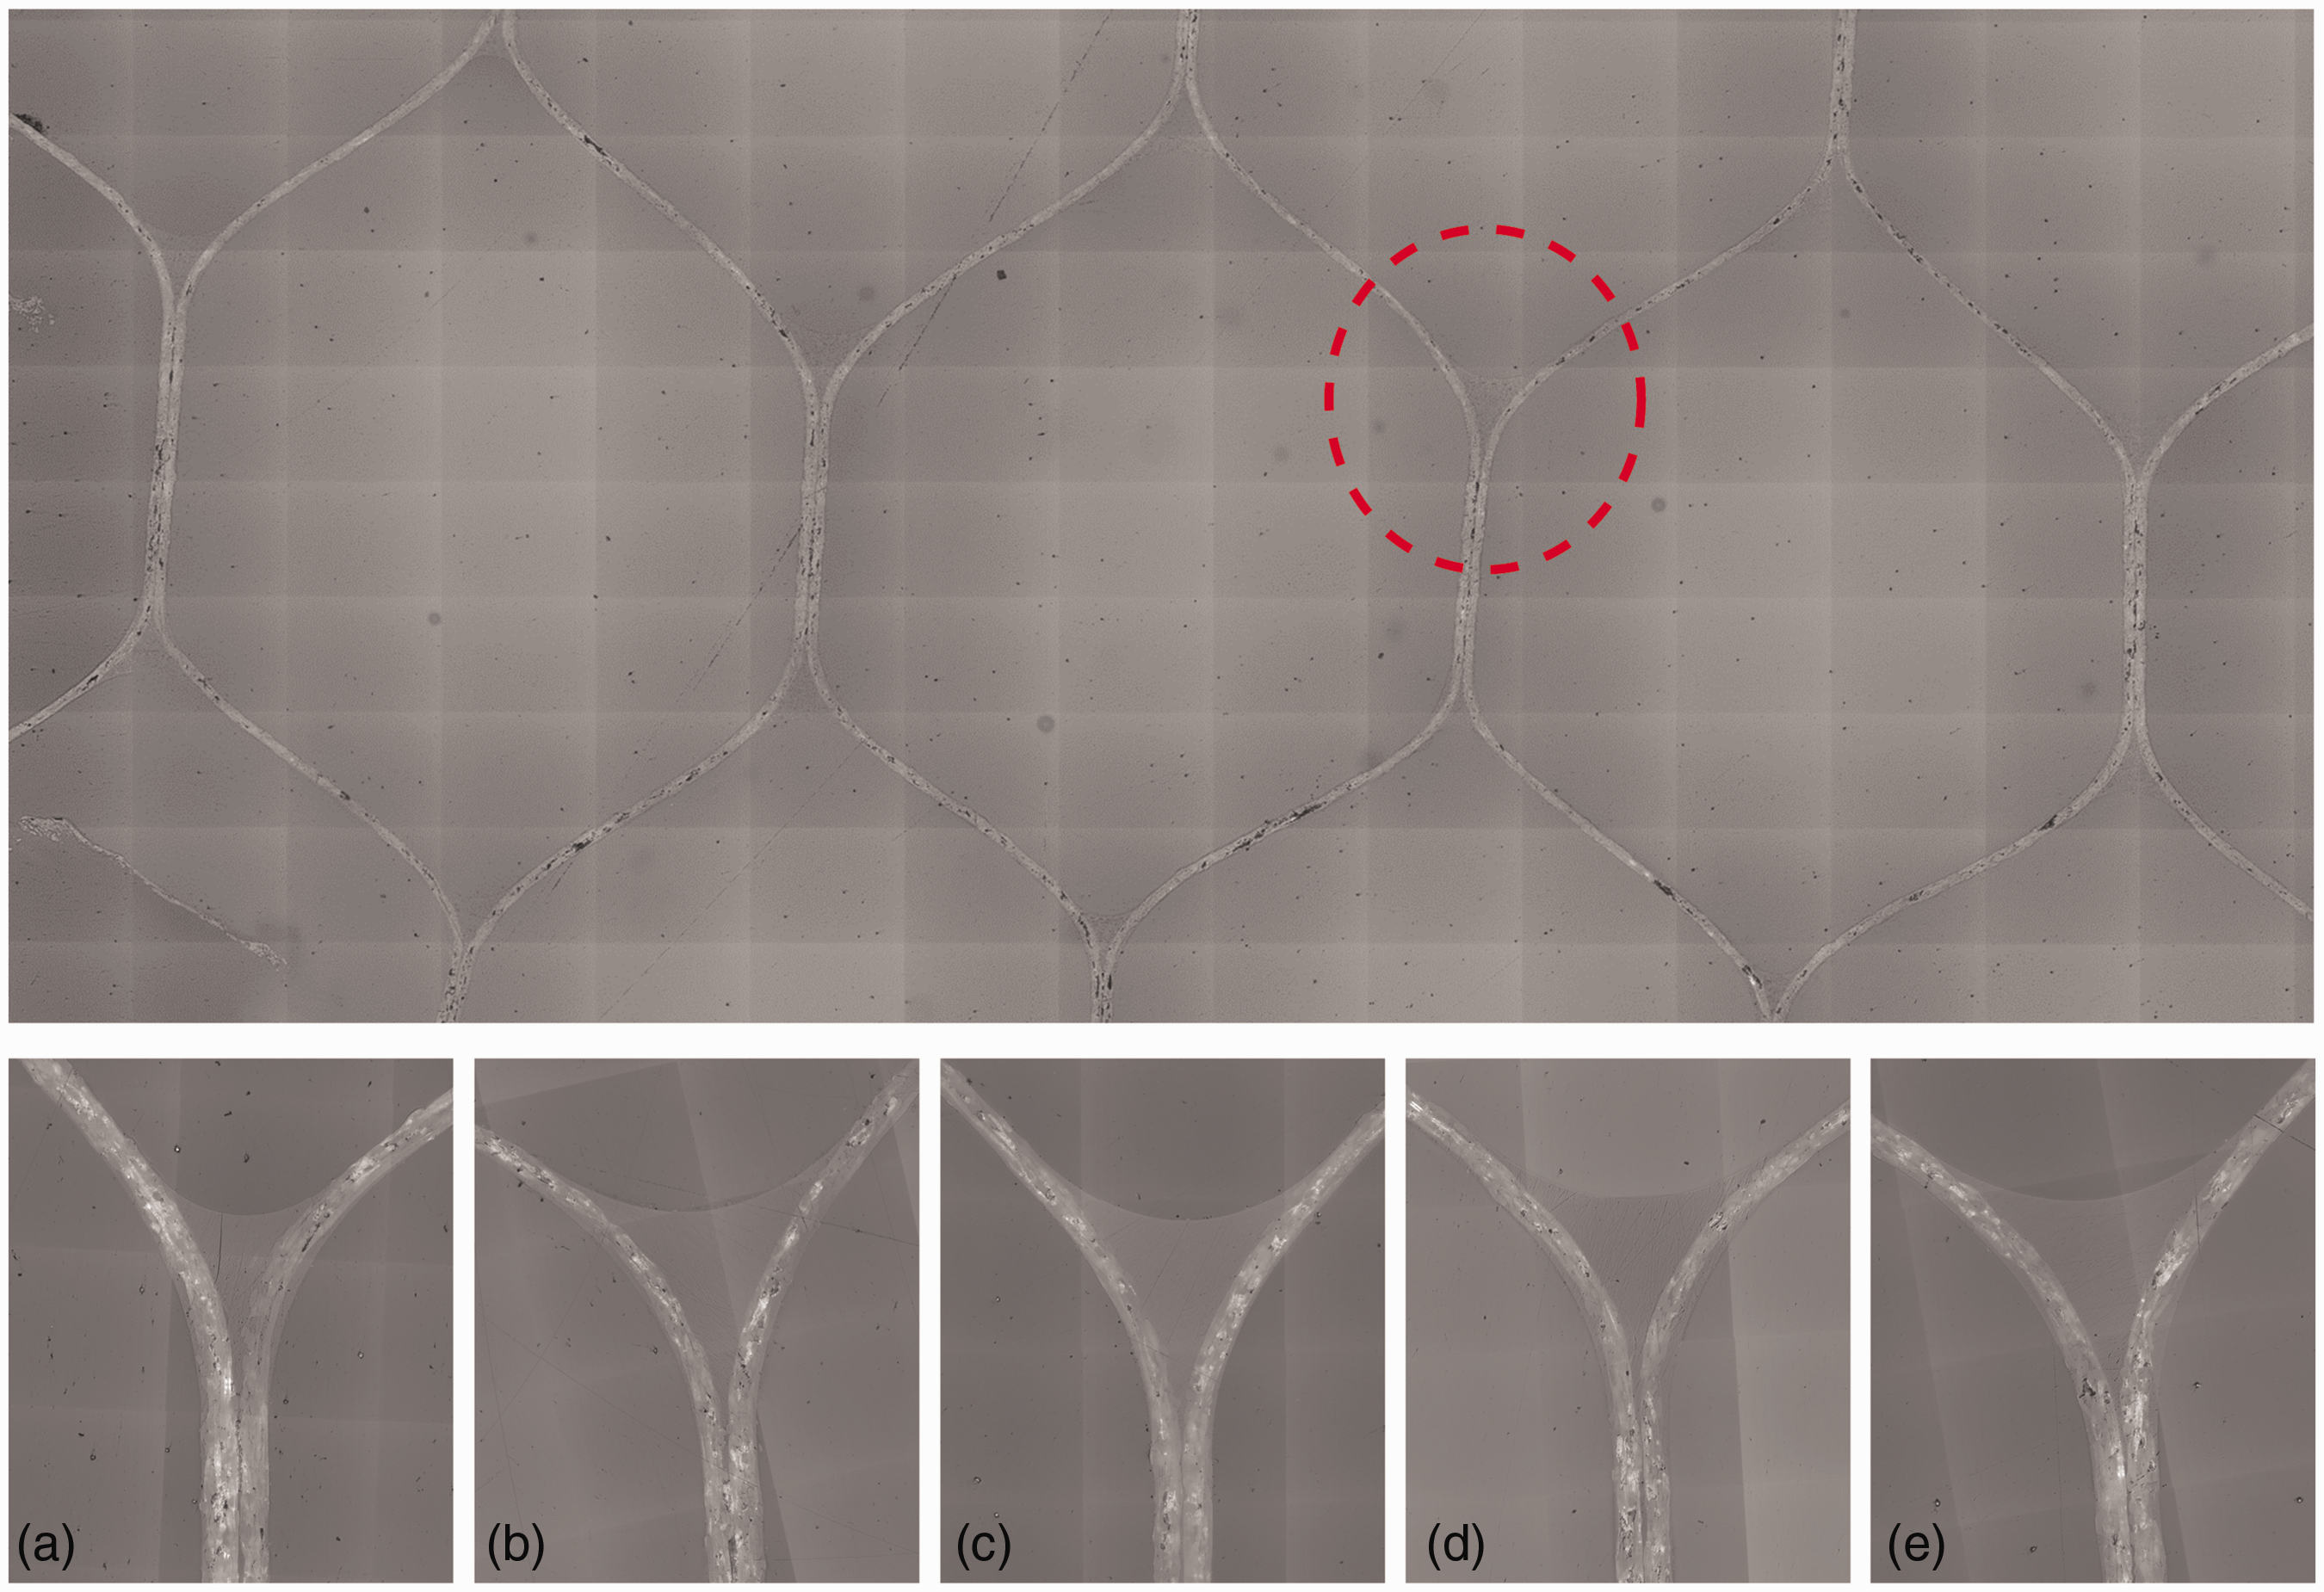
After the test, it was observed that the facesheets of the specimen were detached from the core for the hydraulic group specimen. Therefore, microscopic pictures were taken on the bonding line between the core and facesheet for each group and compared. The microscopic pictures showed the deterioration of the bonding in the hydraulic group specimen, and the deterioration occured from the end tip of the core. Figure 9 shows the microscopic pictures of bonding area for each fluid group.
Wall thickness measurements for each fluid group.
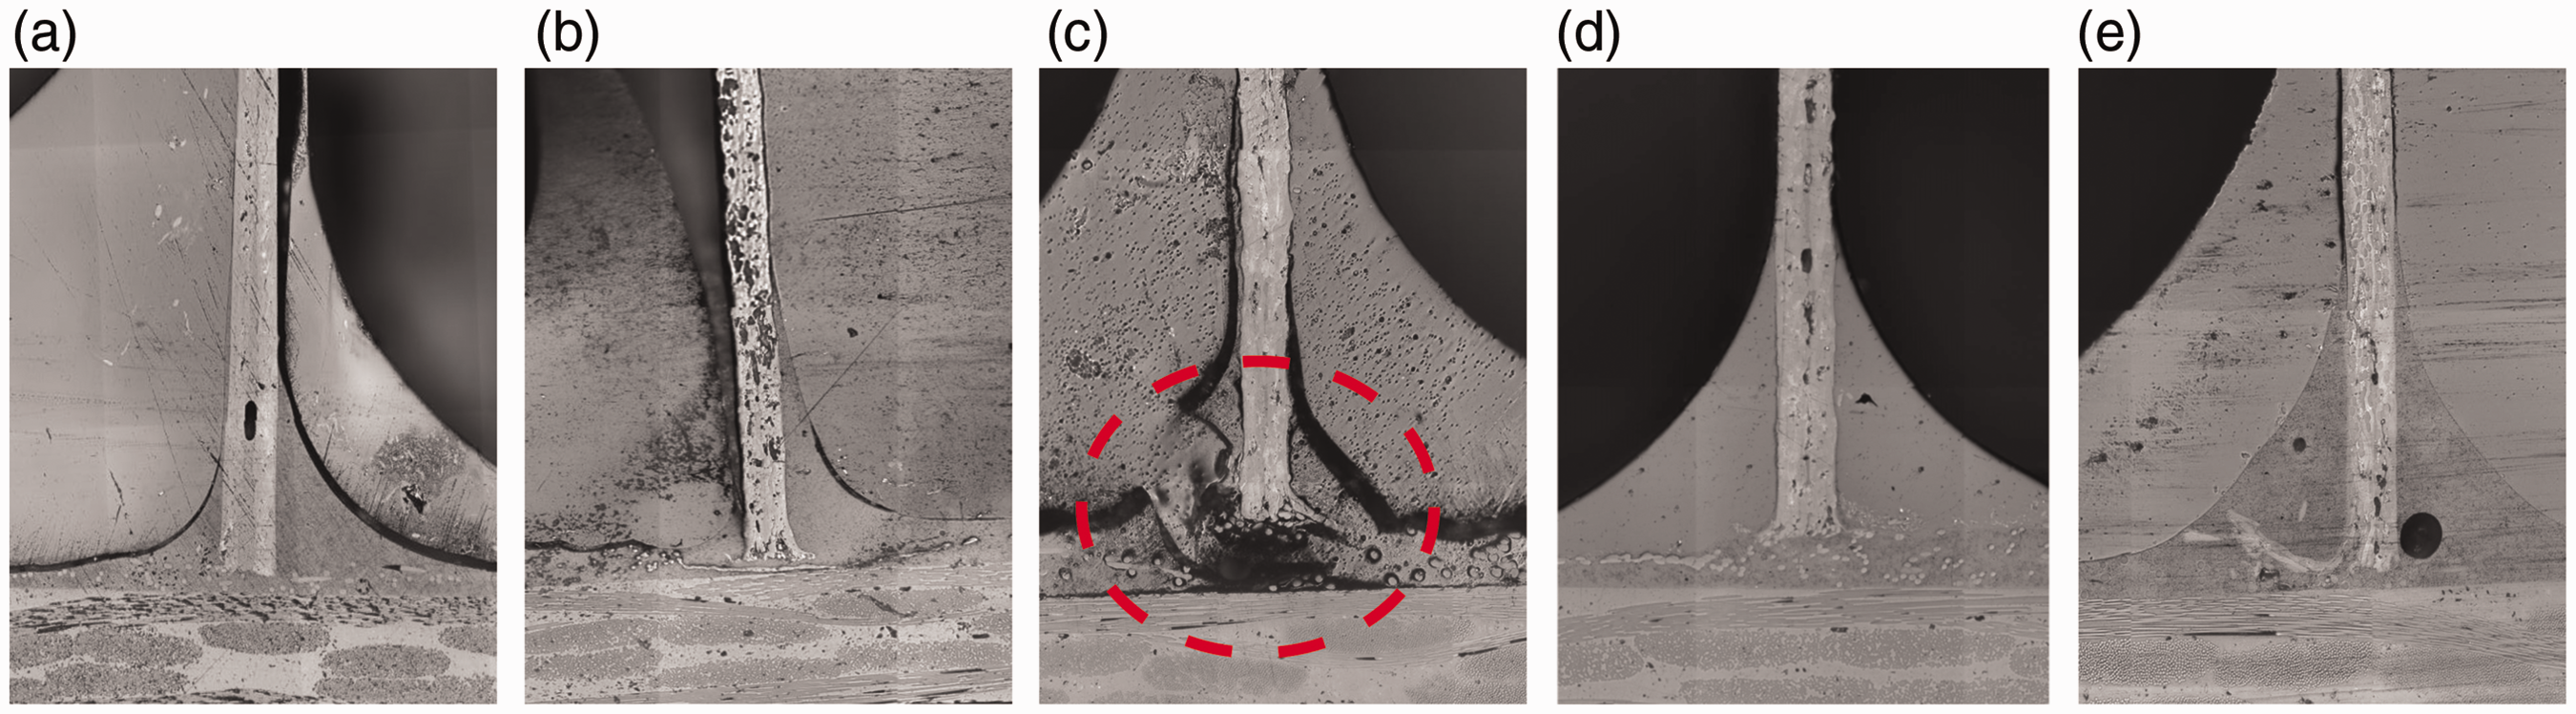
Microscopic picture of the bonding line for fuel (a), oil (b), hydraulic (c), water (d), and the control (e) group.
Conclusion
The honeycomb compressive test on test specimens which were soaked in various types of aircraft fluids was successfully performed. Water ingress in honeycomb core sandwich panel significantly lowered the compressive strength and modulus of the specimens. However, jet fuel and oil did not affect the compressive strength of the honeycomb sandwich specimen significantly. Comparing water-wet and water-dry sample groups showed that honeycomb core recovered its compressive strength when it dried. Although water-dry sample group recovered some of its mechanical property, it still had a significantly lower ultimate compressive strength and modulus than the control group. Based on the moisture content analysis, the one-week drying period was not enough to dry all the fluids inside the core. Additional research with longer drying period will be necessary to determine if a honeycomb panel recovers its full compressive strength when it is fully dry.
The regression analysis showed that the moisture content negatively affects to ultimate strength and compressive modulus of Nomex® honeycomb sandwich structure during compressive test. The ultimate strength versus moisture content and the compressive modulus versus moisture content scatter plot showed a non-linear pattern. The non-linear curve fits, polynomial, and exponential regression line showed higher R2 value than linear regression line for both ultimate strength versus moisture content and compressive modulus versus moisture content. Also, the regression analysis showed higher R2 value in the relationship between ultimate strength and moisture content than the relationship between compressive modulus and moisture content. The results showed that the moisture content affects the ultimate compressive strength of Nomex® honeycomb structure more than flatwise compressive modulus.
Even the statistical analysis test did not show a significant influence of hydraulic fluid on ultimate flatwise compressive stress and flatwise compressive modulus of Nomex® honeycomb, the hydraulic group showed relatively lower ultimate flatwise compressive stress and flatwise compressive modulus than the other fluid groups. The microscopic picture analysis showed that absorbed hydraulic fluid deteriorated the bonding between facesheets and the core. Therefore, hydraulic fluid inside of a Nomex® honeycomb sandwich structure must be removed as soon as possible. Further research will be conducted to investigate in more detail the influence of hydraulic fluid on the bonding between Nomex® honeycomb core and facesheets. In this research, only one type of fuel, oil, and hydraulic fluid was used, and therefore, the results of this study cannot be generalized to all types of fluids used in aircraft systems.
Footnotes
Declaration of Conflicting Interests
The author(s) declared no potential conflicts of interest with respect to the research, authorship, and/or publication of this article.
Funding
The author(s) received no financial support for the research, authorship, and/or publication of this article.