
Abstract
In this paper, theoretical analysis, numerical simulation and mechanical test on the 3D printed lattice sandwich structures are carried out to study the buckling performance. 2 types of lattice structures, body centered cubic (BCC) and rhombic dodecahedron (DOD) are included. The lattice sandwich panels are made of ALSi10 Mg alloy materials and manufactured using the selective laser melting technique. The comparative results show that DOD lattice sandwich panel not only has higher bearing capacity, but also shows stronger toughness in the post-buckling stage than BCC type panel, even they have the same characteristic size. The buckling mode depends on the topology of the unit cell. For BCC and DOD type panels, the main buckling modes are local buckling and global buckling respectively. The reasons of different buckling modes are discussed. Moreover, the buckling evolution and failure modes of the two types of panels in the post-buckling stage are investigated.
Introduction
Lattice materials are novel materials with a periodic, three-dimensional (3D) truss-like structure. It can be regarded as a 3D superposition of representative cells with a variety of lattice type like body centered cubic (BCC), dodecahedron (DOD), etc. Sandwich structure is generally composed of two thin facesheets and a thick core. The facesheets have large modulus and high strength, mainly bearing in-plane load while the core is usually made of porous materials and mainly bears the shear load. 1 Lattice sandwich structure has a stronger bearing capacity than stiffened plate, foam sandwich structure and honeycomb sandwich structure under the same mass. 2 3D printed lattice sandwich has the advantages of lightweight, integrated design of structure and function (load bearing, cooling, vibration absorption and other functions), and has a good potential in aviation and other fields, especially being used in high temperature region of hypersonic aircraft wing. 3 Its development and application are hot topics in recent years.
Atsushi Shitanaka, Takahira Aoki et al. 4 studied the critical buckling load of lattice cylindrical shells. Lei Zhang 5 et al. suggested a design method to improve the critical buckling load of the Kagome three-dimensional lattice sandwich structure obtained from free-shape trusses. Deshpande and Fleck 6 proved the failure of the sandwich plate is related to the yield strain of the material and the topological configuration of the lattice cell. Evans and Wang 7 performed shear and compression tests of the Kagome lattice sandwich plates and analyzed its failure mechanism. Currently, for the buckling problem of lattice sandwich structure under in-plane load, there is not plenty of work. However, the progress of study on buckling of foam or honeycomb sandwich structure can be used for reference, since they have similar structures.
Generally, the core of a sandwich structure is soft and the ratio of thickness to length cannot be ignored, so shear deformation must be considered. Therefore, the classical Euler formula may not accurately predict the critical buckling load of sandwich structure. Haringx 8 and Engesser 9 derived the critical load formulas of sandwich structure when global buckling occurs under in-plane compression load.10–14 Later, Bazant 15 explained the relation and difference between the two formulas. He considered the two formulas are mutually equivalent. Allen 16 derived the critical load formula for the global buckling of sandwich structure in the case of thick and thin facesheets. Attard and Hunt 17 considered the shear deformation both of the core and the facesheet, and studied the global buckling of the structure using the Timoshenko first-order beam theory. Kardomateas 18 gave the elastic solution of the critical load corresponding to the global buckling of the sandwich structure, and found that the result is in good agreement with Allen’s thick facesheet structure formula. Kadomateas et al. 19 also investigated the global buckling of foam and honeycomb sandwich structures. They considered the critical buckling load predicted by Euler formula was high as the shear action of cores was not considered. Vadakke and Carlsson 20 studied the foam core sandwich structure with initial defects. It’s found that the local buckling occurred around the defects. Gdoutos et al. 21 predicted and compared the failure modes of sandwich structures made of foam and honeycomb respectively. Zhang 22 Xiaobo et al. combined theoretical solution and finite element method to analyze the static buckling performance of honeycomb sandwich structure. Zhu Xiang et al. 23 studied and simulated the global stability of composite honeycomb sandwich structures.
In this paper, based on 3D printing technology, the lattice sandwich panel structure is designed and manufactured. Two types of cores, BCC (body-centered cubic) and DOD (rhombic dodecahedron) are included. Theoretical analysis, numerical simulation and experimental verification are adopted to systematically study its deformation procedure and failure mechanism under in-plane compression load. In addition, digital image correlation (DIC) technology is used to measure full-field deformation of the panel.
Geometry and fabrication of specimens
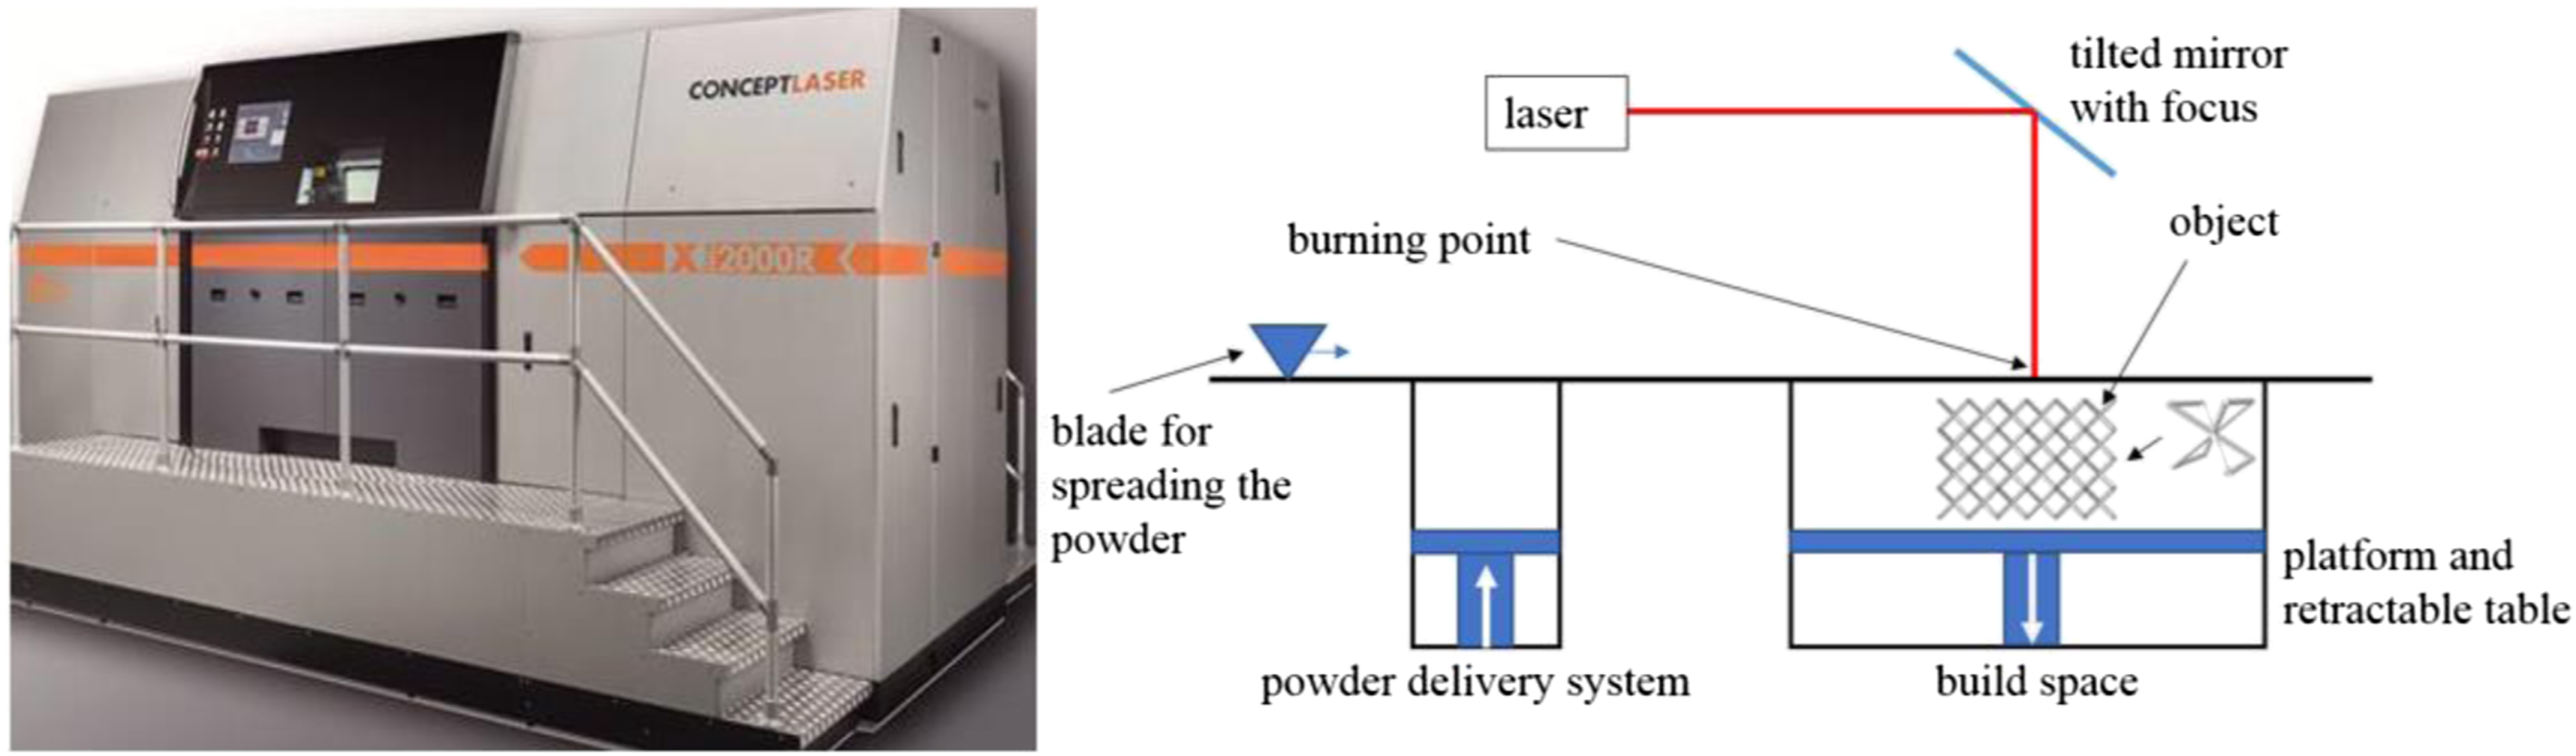
The specimens are manufactured by SLM (selective laser melting) process at one time. Laser is used as energy source to melt the metal powder layer by layer according to the path planned in CAD layered data. The melted powders solidify rapidly to produce the metal parts. SLM technology overcomes the trouble in traditional technology caused by the complex shape of metal parts, directly producing metal parts with nearly final shape and good mechanical properties. The 3D printing machine and fabrication process are showed in Figure 1. 3D printing manufacturing machine (model: CONCEPT LASER XLINE 2000R) and schematic diagram of fabrication process.
28
In order to examine the effect of geometries of lattice structures on buckling behaviors, two type of lattices are included in our work. Basic geometric configurations of unit cells are body centered cubic (BCC) and rhombic dodecahedron (DOD), which are very common in lattice structure fabrication by SLM technology.
24
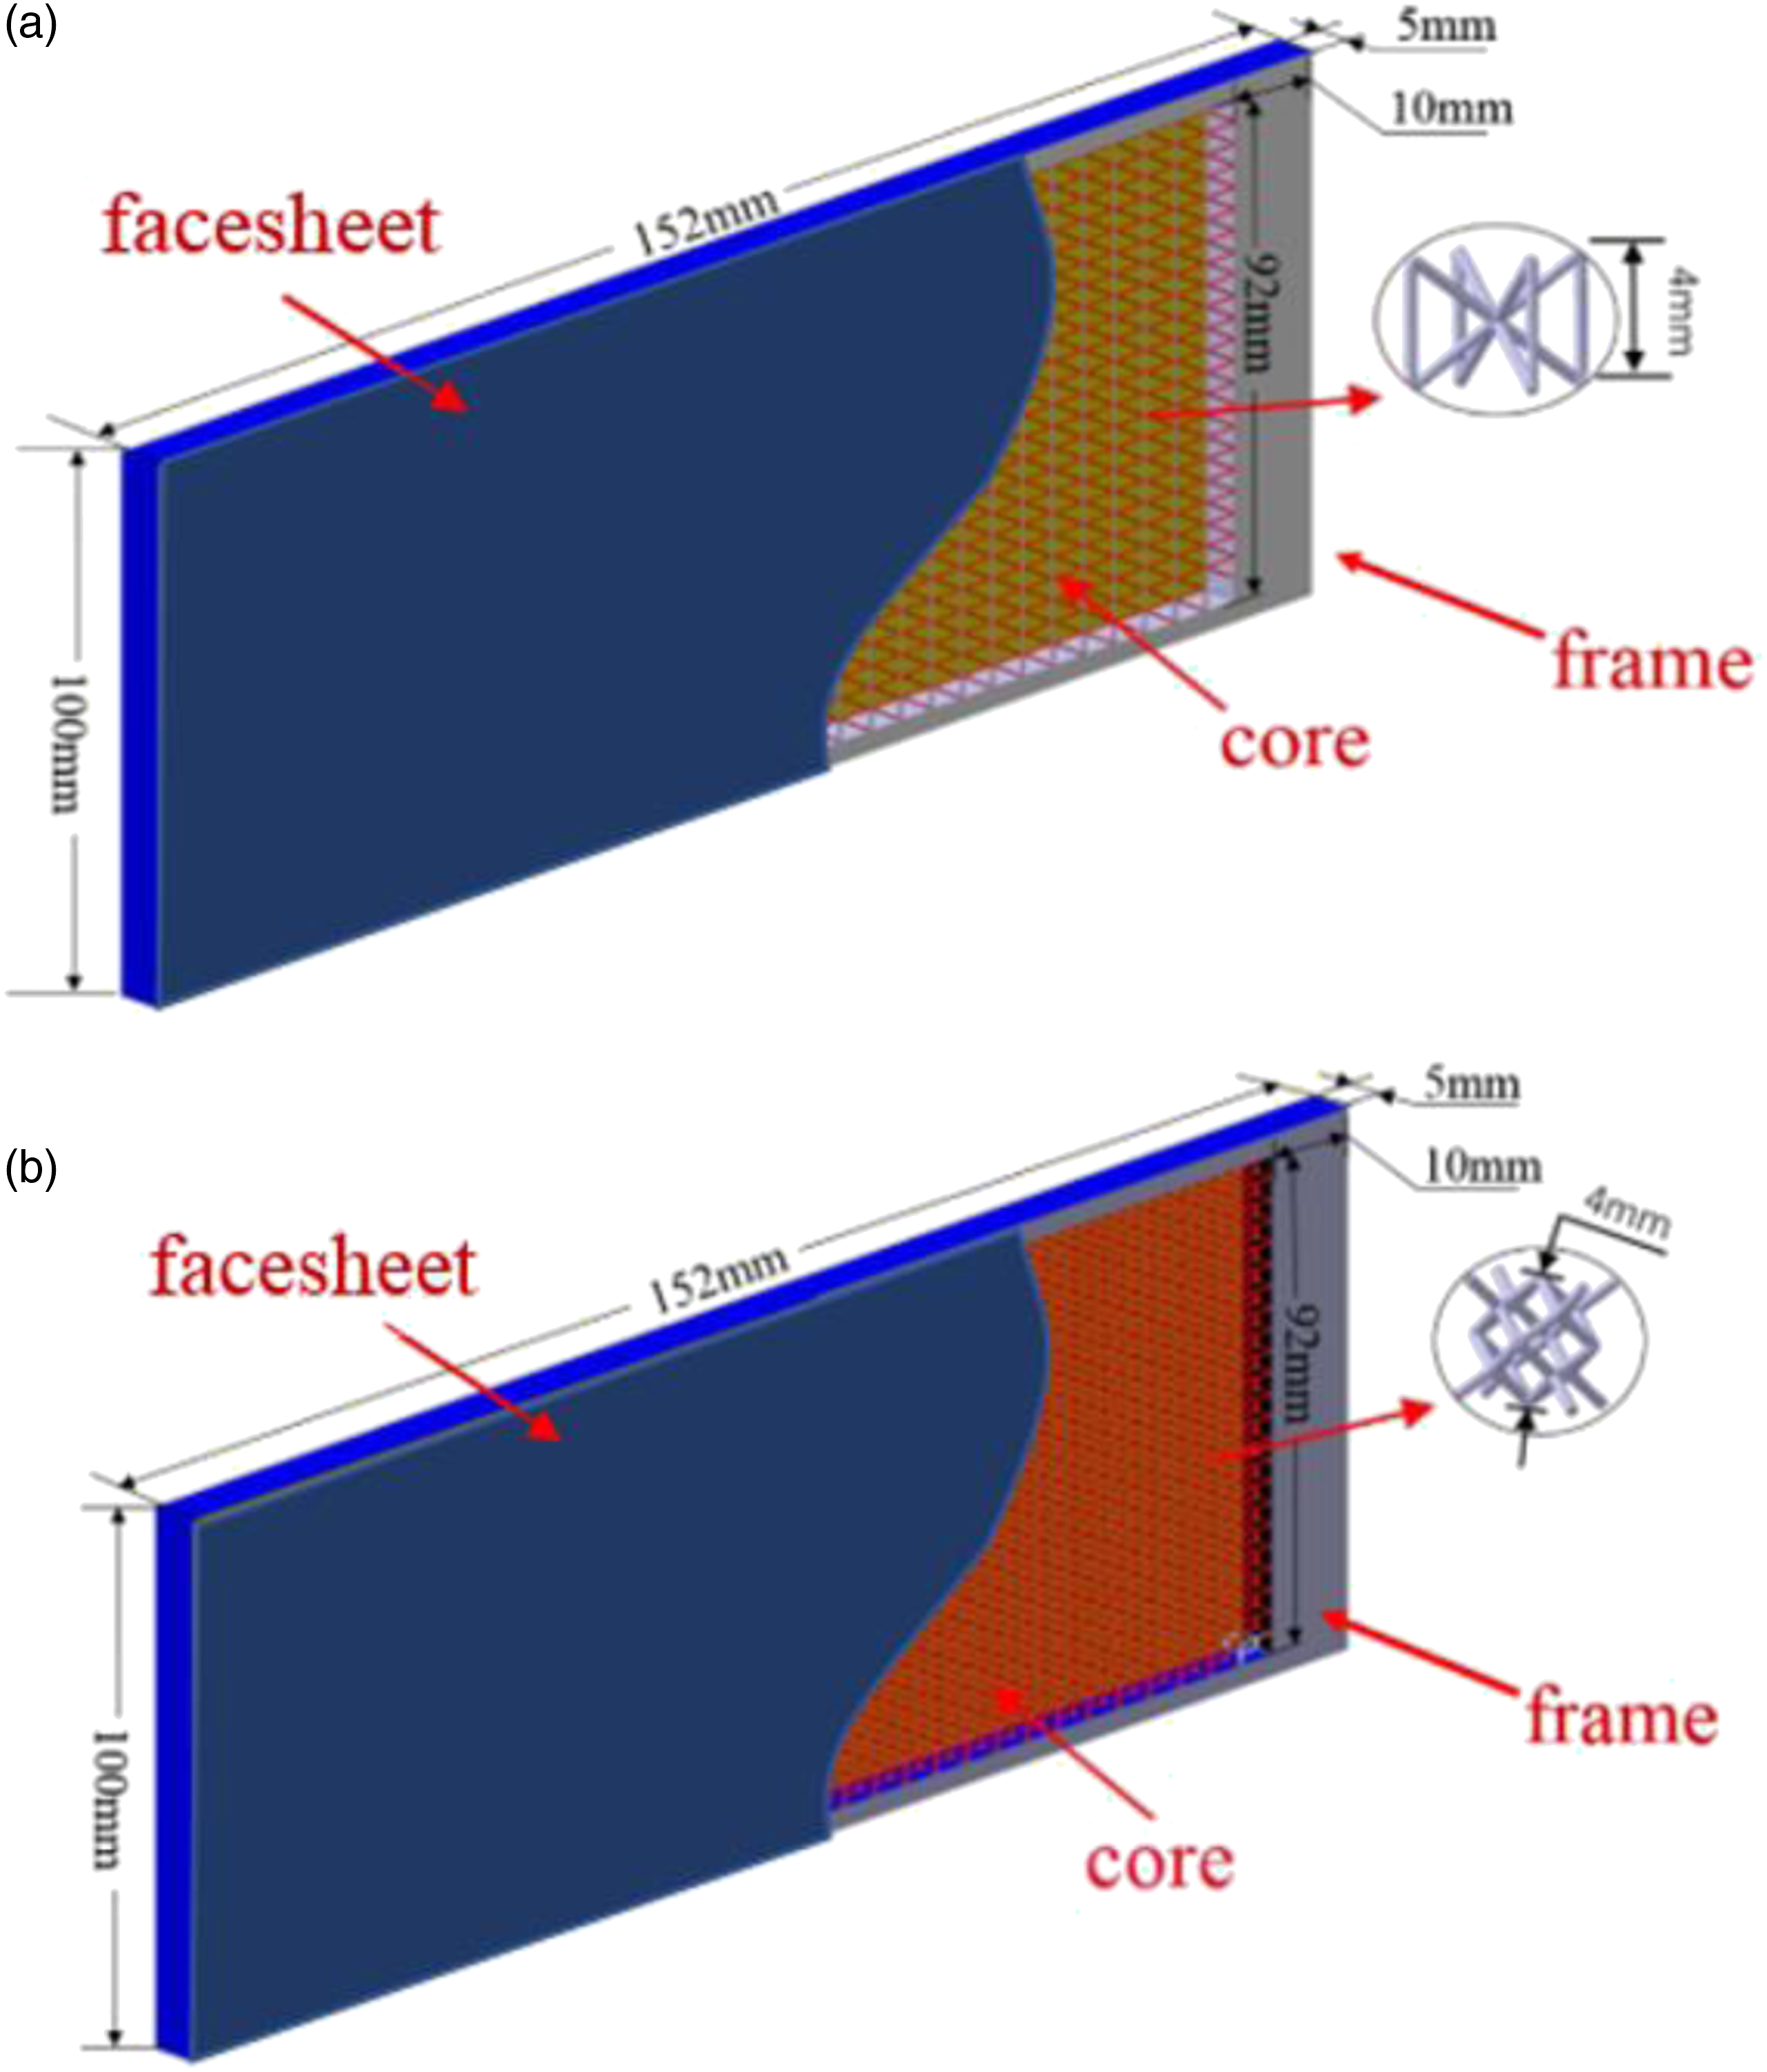
The number of struts for BCC and DOD cells are 12 and 32 respectively. The characteristic size of both unit cells is 4 mm, and the diameter of the struts is 0.5 mm, other dimensions are presented in Figure 2. These unit cells, being duplicated in two directions as shown in Figure 3, form the core of different sandwich panels. The panel, which consists three components, face sheets, core and frame, are printed simultaneously (see Figure 3). The shape and dimensions of unit cells. (a) DOD types, (b) BCC types. The structure of lattice sandwich panel. (a) BCC type, (b) DOD type.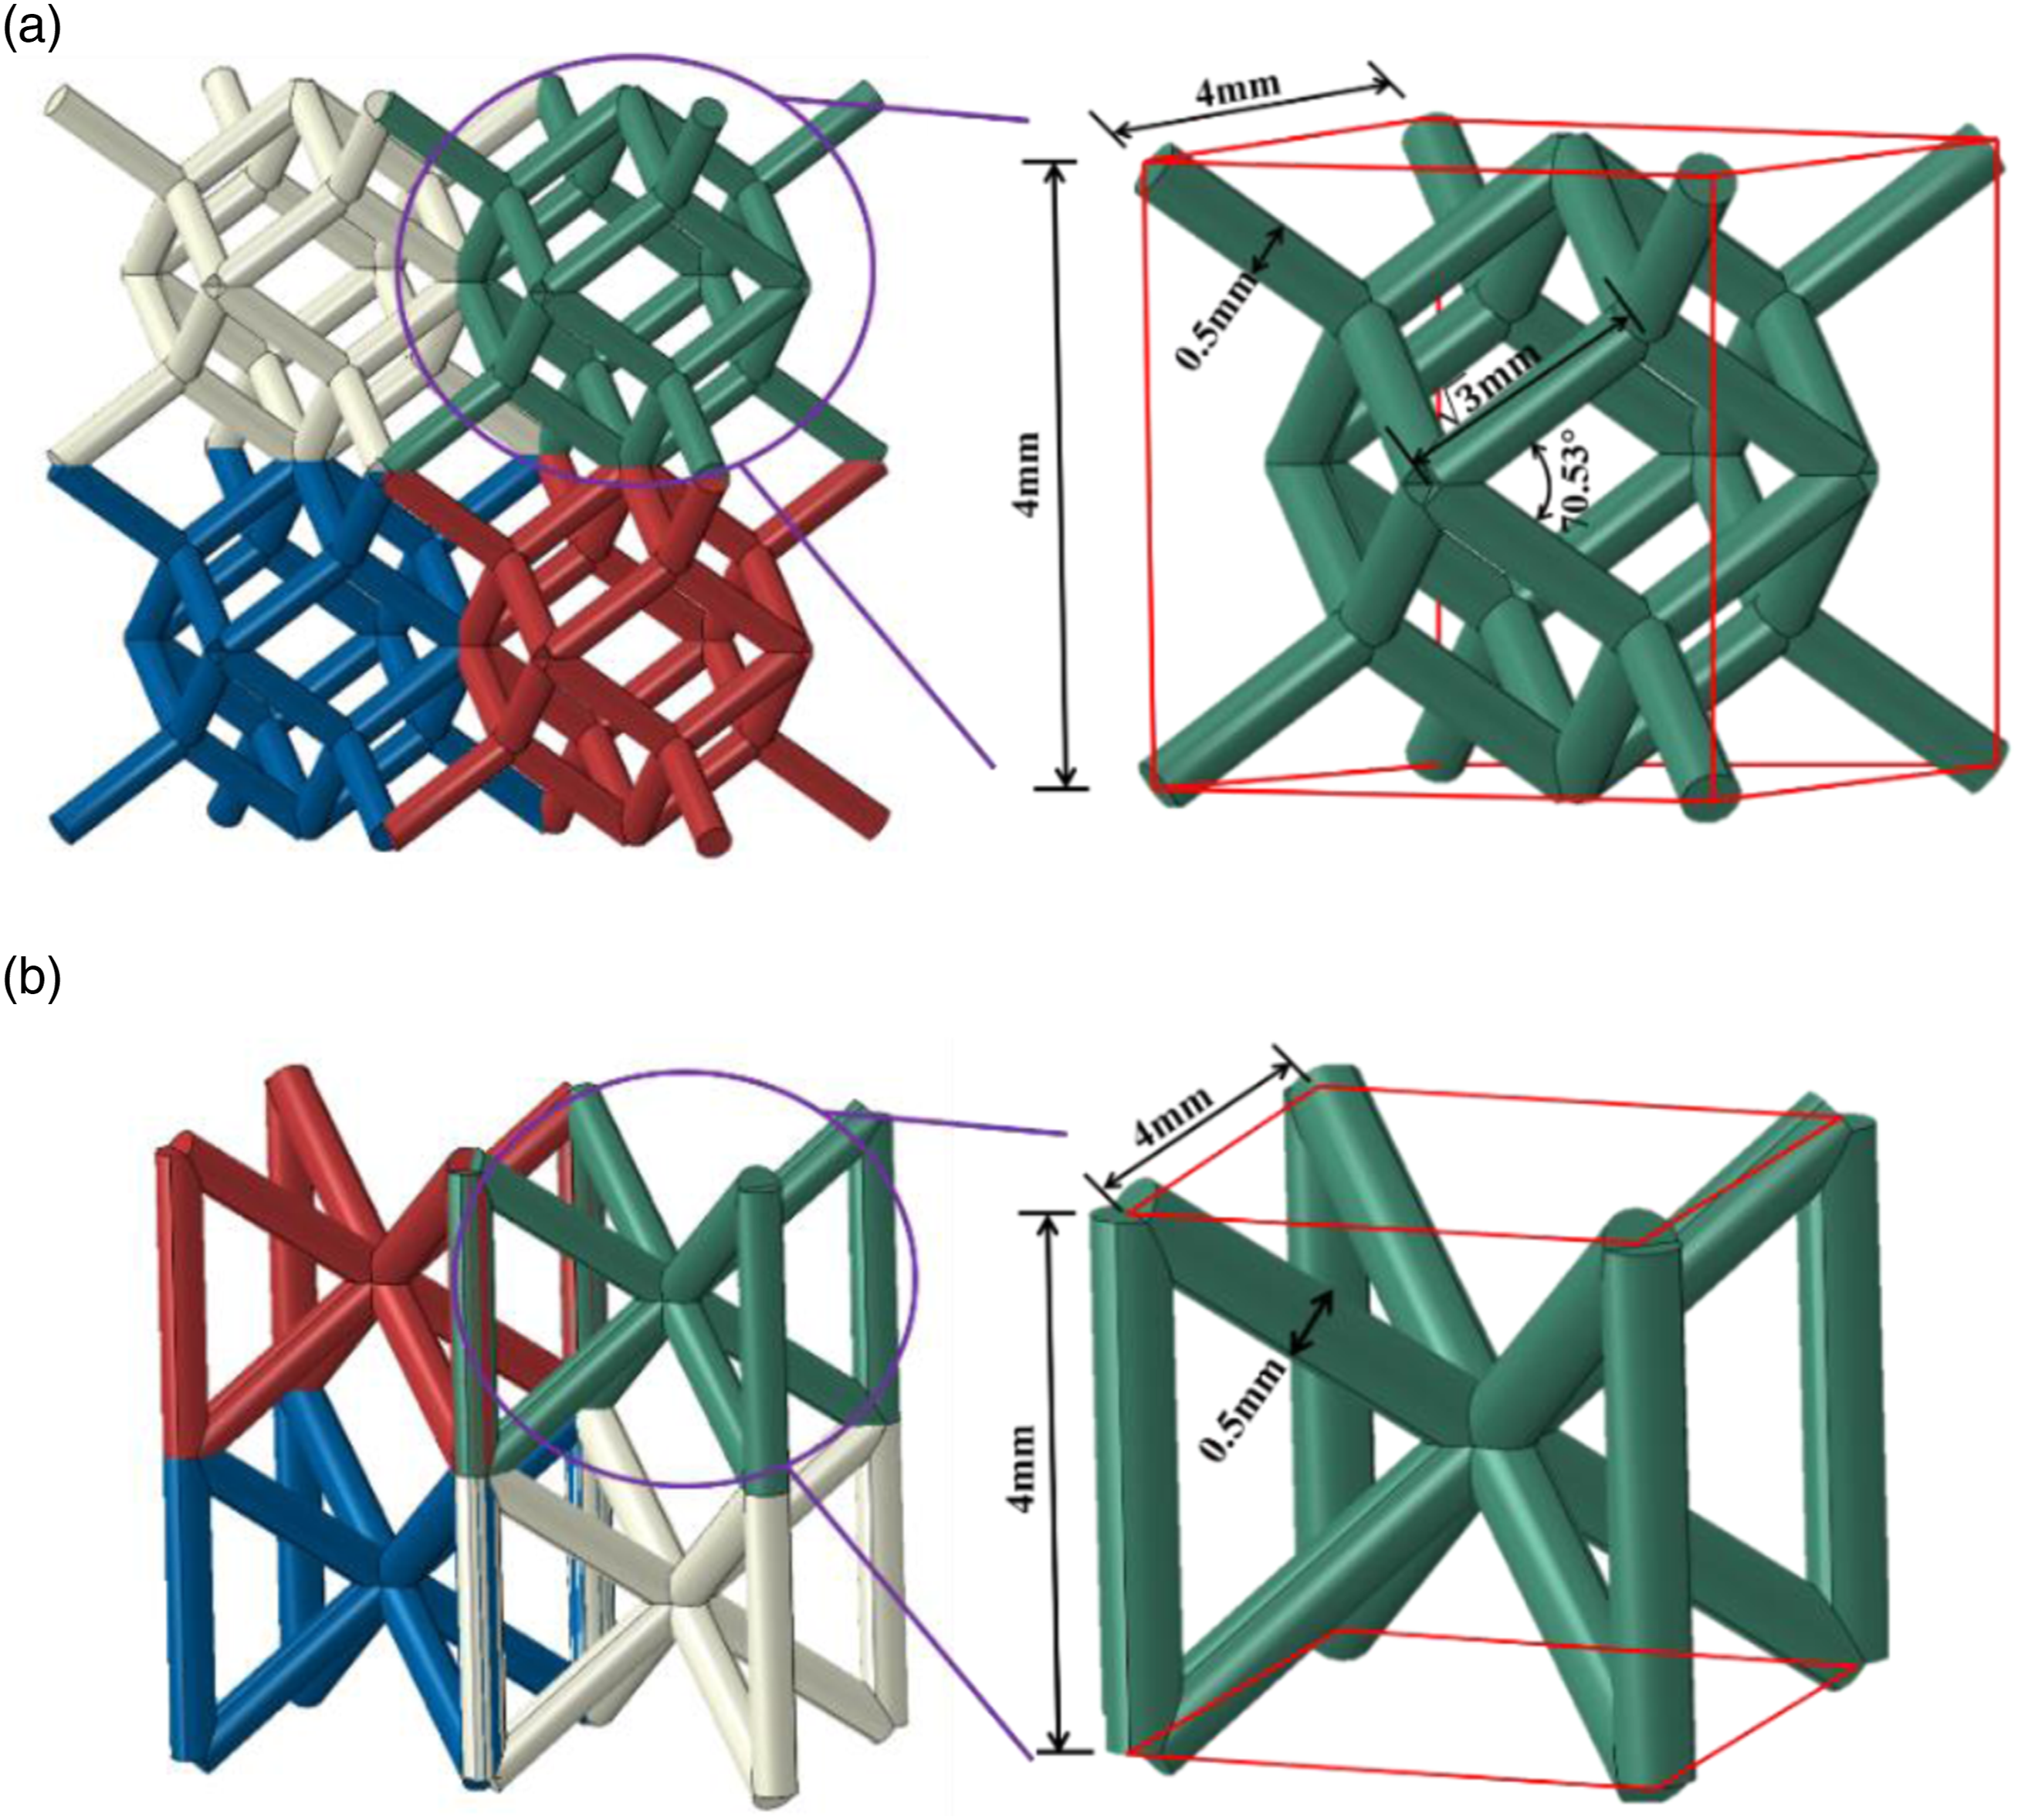
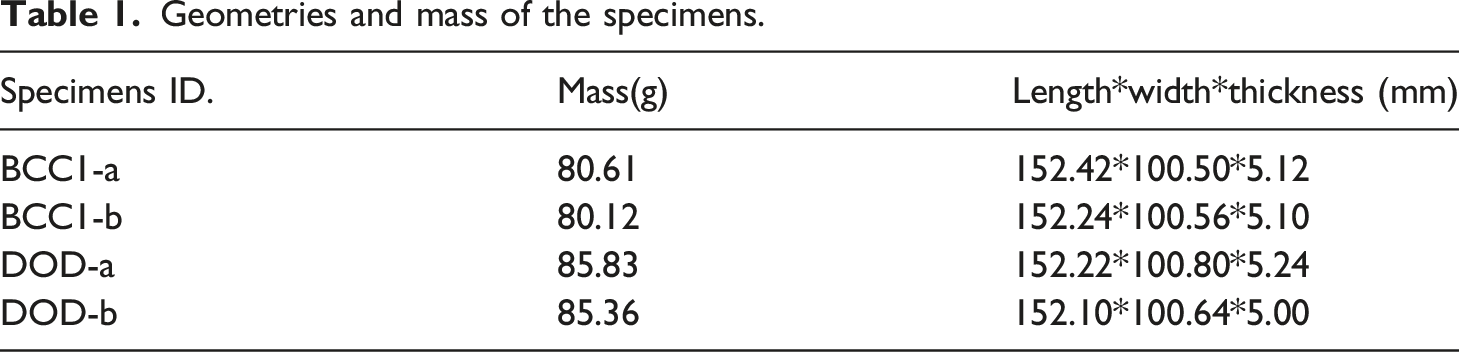
Geometries and mass of the specimens.
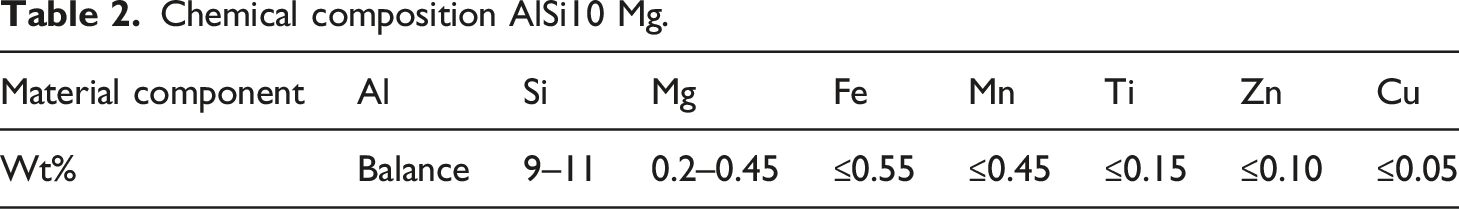
Chemical composition AlSi10 Mg.
The tensile test of typical samples fabricated by the same process was carried out in our research group
25
to obtain the nominal stress-strain curve of the 3D printed material. As our previous tests on the mechanical properties of specimens with different printing directions prove that there is no significant difference was observed, the isotropic hypothesis of such material is used. The Young’s modulus is 68 GPa, the yield stress is 232 MPa and the Poisson’s ratio is 0.3. Using the Bridgeman formula,
26
the true stress-strain curve in Figure 4, is deduced for subsequent simulations. The stress-strain curve of 3D printed AlSi10 Mg alloy material.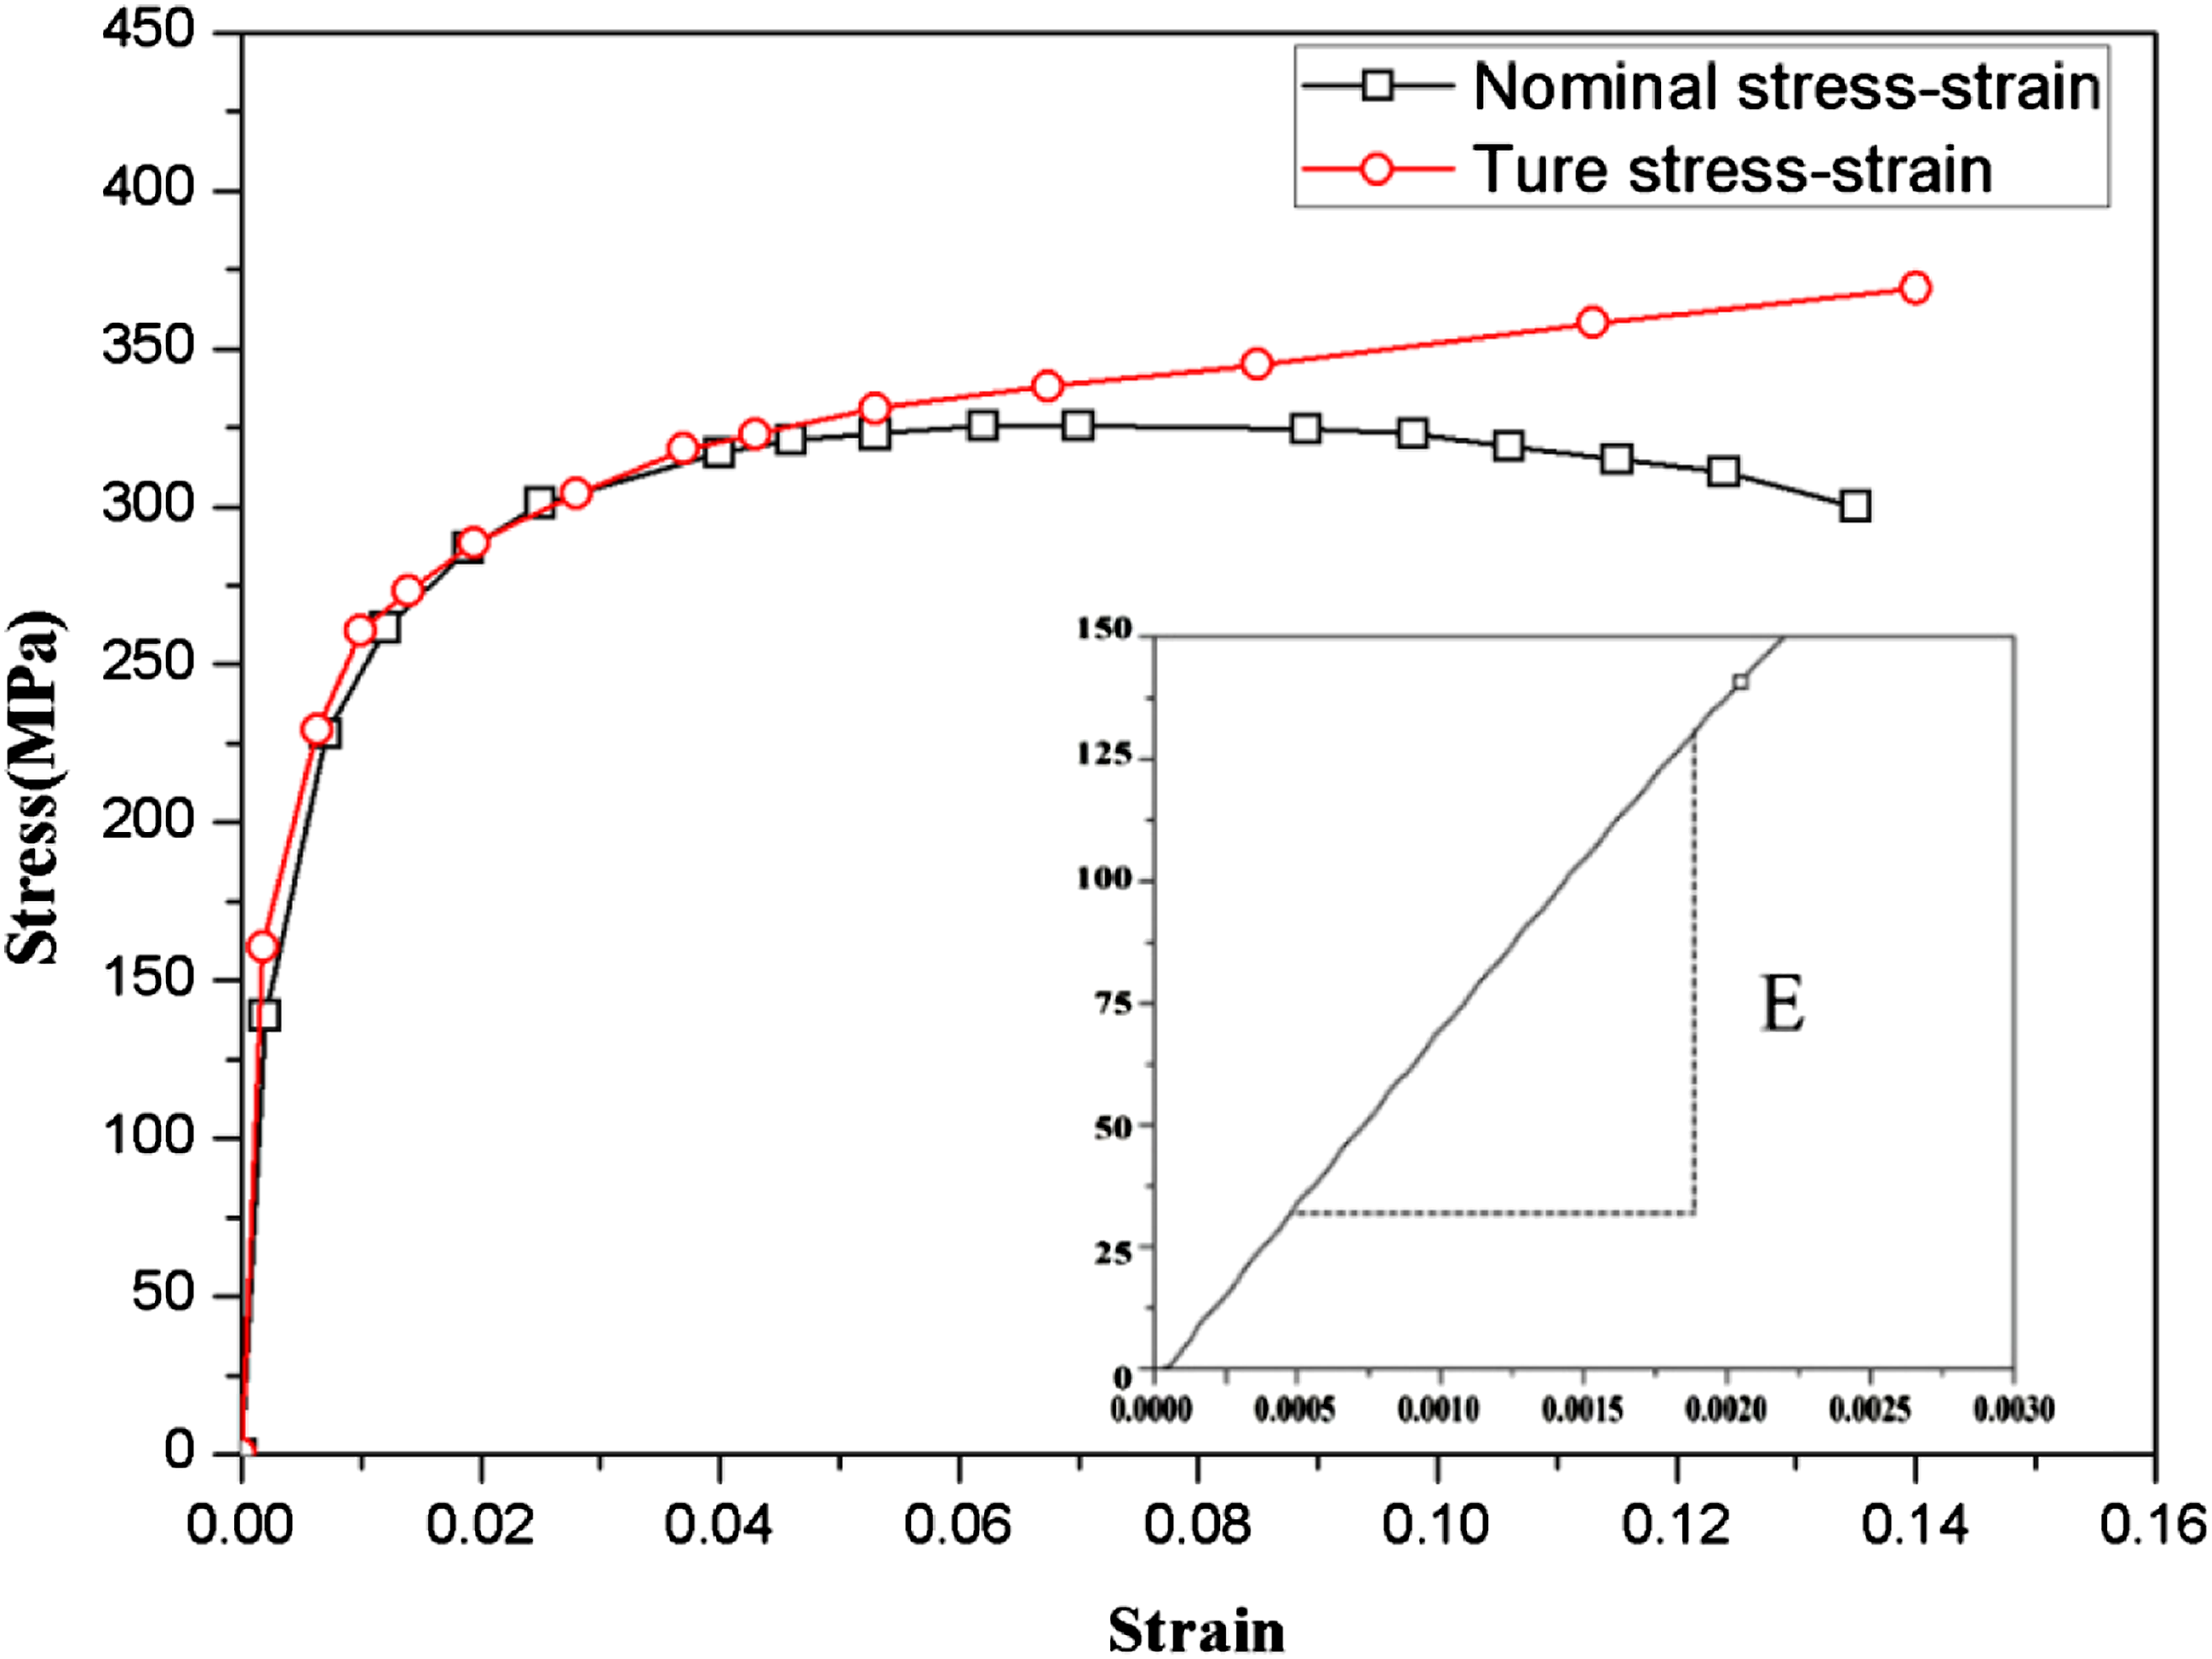
Critical buckling load calculation
It’s useful for engineering application to get a predicted critical buckling load based on theoretical buckling model, which could present an acceptable result efficiently and speed up design iteration. However, the current pure theoretical model is created to analyze sandwich panels with solid core. As to the panel with lattice core, it’s very difficult to derive a pure theoretical model if geometrical details of the core are considered. So, a semi-empirical method, based on combination of theory and experiment, is relatively simple and convenient for critical load estimation. In such method, some stiffness parameters are obtained by tests on the lattice cells directly to reduce the complexity. Referring to the buckling solution for honeycomb sandwich structure, the critical global buckling load of lattice sandwich structures is calculated. 27
Transverse shear stiffness of the core could significantly affect the buckling behavior of sandwich structures. In reference,
27
based on the derivation of isotropic beam, the critical buckling load 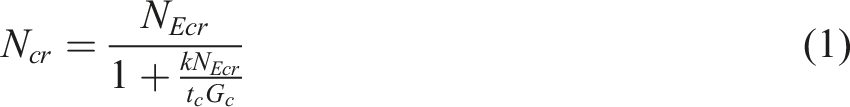


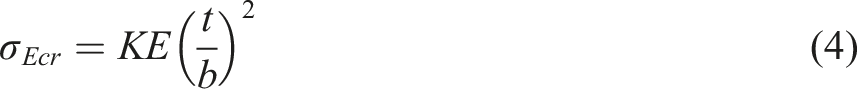
The buckling coefficient of panel
Using the above equations, the critical buckling loads of lattice sandwich structures are calculated. The results of BCC type and DOD type are 19.1 kN and 22.8 kN respectively. Because an actual buckling procedure is very complex, the semi-empirical equation cannot predict the local buckling mode and the post-buckling process beyond the initial buckling.
Finite element modeling method
Two finite element analysis methods are used for simulating the complex buckling based on a finite element software, ABAQUS 6.14. Firstly, linear (eigenvalue) buckling analysis is performed using ABAQUS/Buckle module, and the estimated value of the critical buckling load and the corresponding buckling mode are obtained. This method supposes the material is elastic and the initial structure is defect-free, so it could not predict the post-buckling behavior. Secondly, ABAQUS/Explicit module, which uses a consistent, large-deformation theory to overcome large rotations and large deformation problem, is used to predict whole buckling procedure and ultimate load of the sandwich structure, revealing the mechanism of deformation and failure.
According to the geometric features of lattice sandwich structure components, various types of element are used. For the facesheets of the panel, the thickness is significantly smaller than the other dimensions, and the stress at the thickness direction can be ignored, so shell element (S4R) is selected for simulation. For the frame of the panel, solid element (C3D8R) is adopted. With regard to the core, as small ratio of the diameter to length, it is appropriate to assume a strut as a Timoshenko beam element with linear interpolation (i.e. B31 element in ABAQUS). The geometric models of the different parts are merged together. Accordingly, connections between different types of elements share the same nodes.
The typical size of beam elements, shell elements and solid elements are 0.5 mm, 2 mm and 2 mm, respectively. The numbers of elements are 85,928 (BCC type) and 121,672 (DOD type). The boundary conditions applied to the model are as follows (see Figure 5): The bottom of the sandwich panel is fixed supported and the six degrees of freedom of the top are constrained except the direction of load. The left and right edges of the panel are simply supported. Mesh and boundary conditions.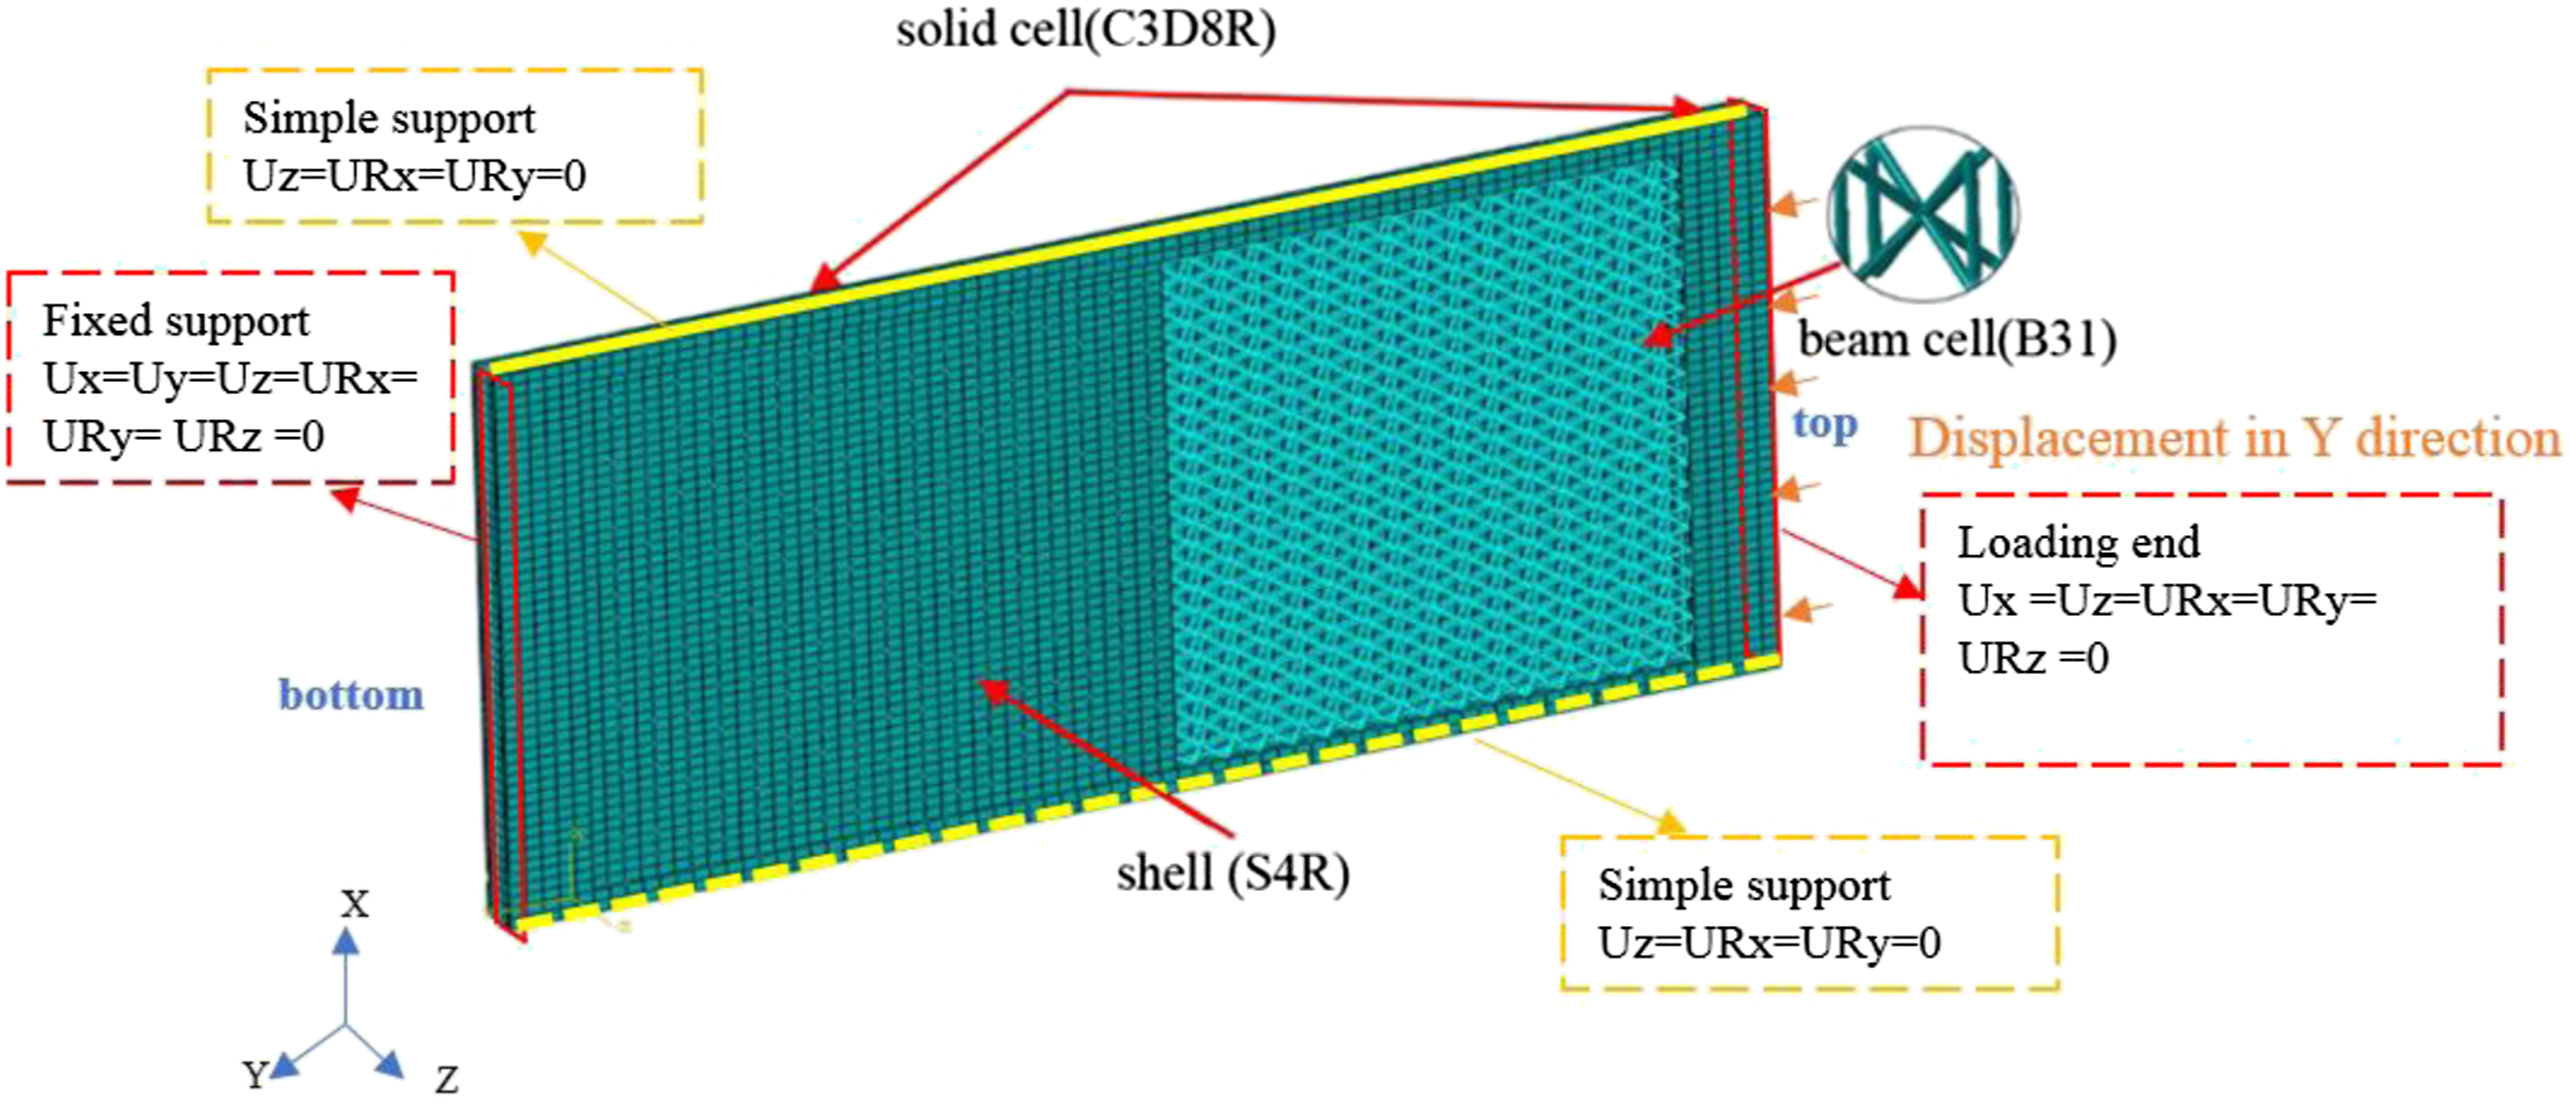
Experimental set-up of In-plane compression of lattice sandwich structure
The panel is installed in a fixture in order to satisfy the boundary conditions. The upper and lower ends are completely fixed. Left and right sides are simply supported by knife-edge fixture. The test fixture is illustrated in Figure 6. Seven strain gauges are bonded on the panel surfaces, whose positions are shown in Figure 6. Test fixture and strain gauge installation.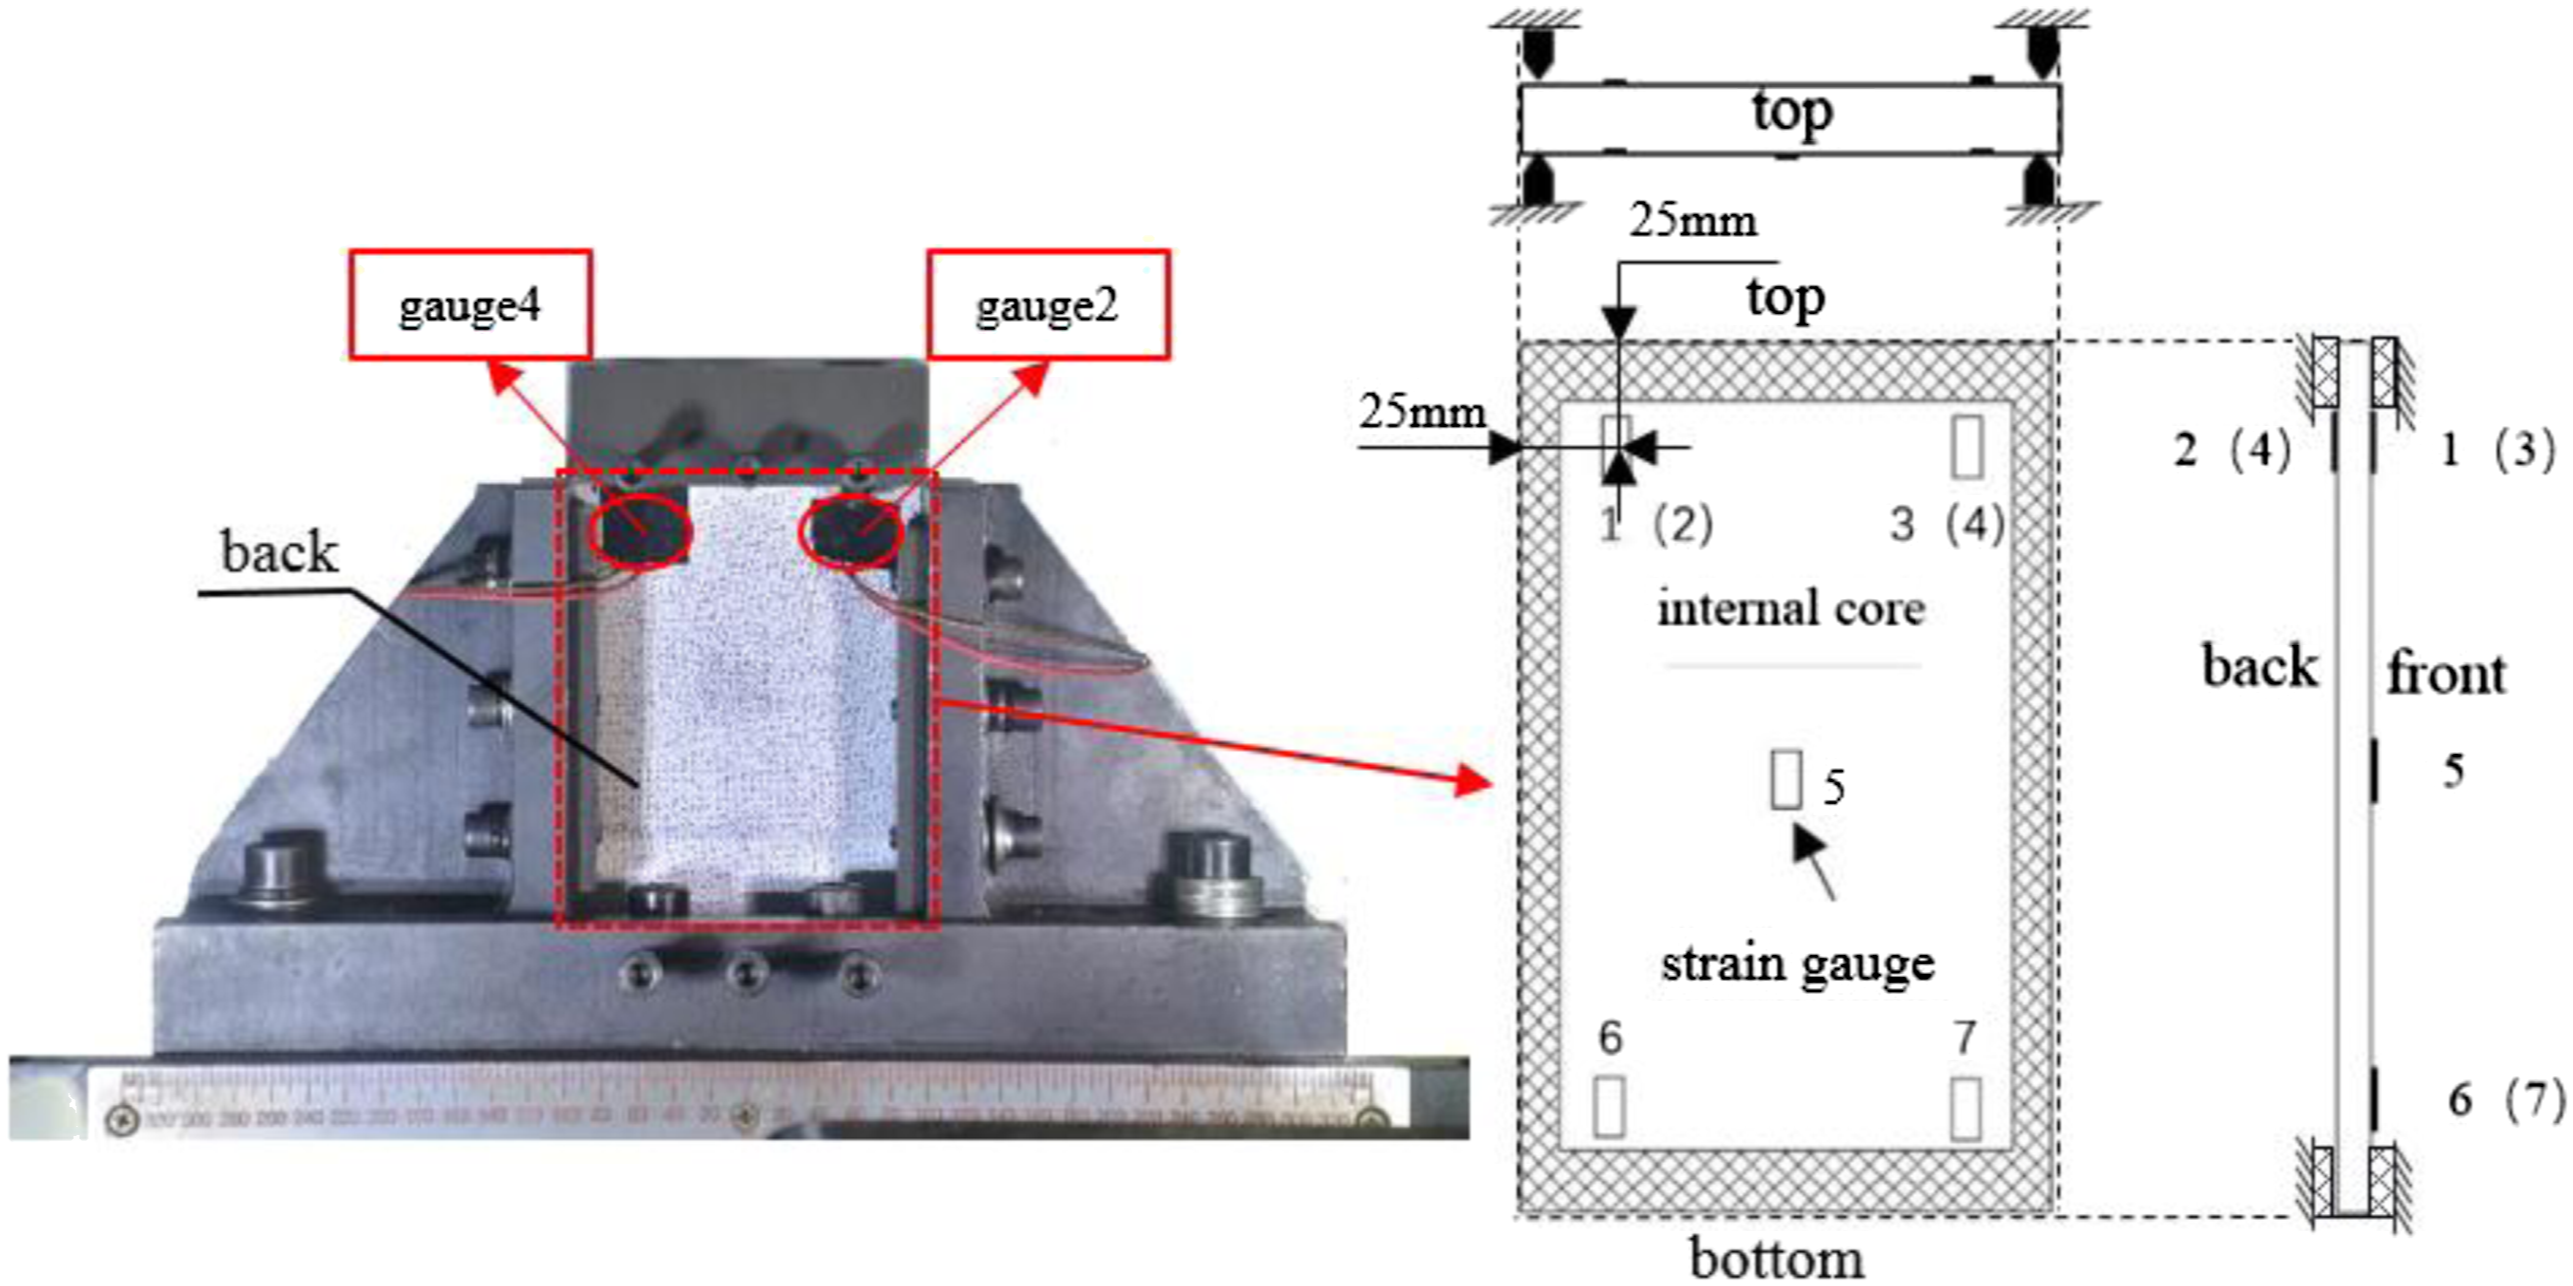
In addition, digital image correlation (DIC) measurement system (VIC-3D) is also used in this experiment to capture the full strain filed. This system is a powerful solution for measuring and visualizing full-field, three-dimensional displacement and strain based on the principle of digital image correlation. As one side of the specimen needs to be observed by the DIC system, only two strain gauges (gauge 2 and 4) are placed near the upper end of the specimen.
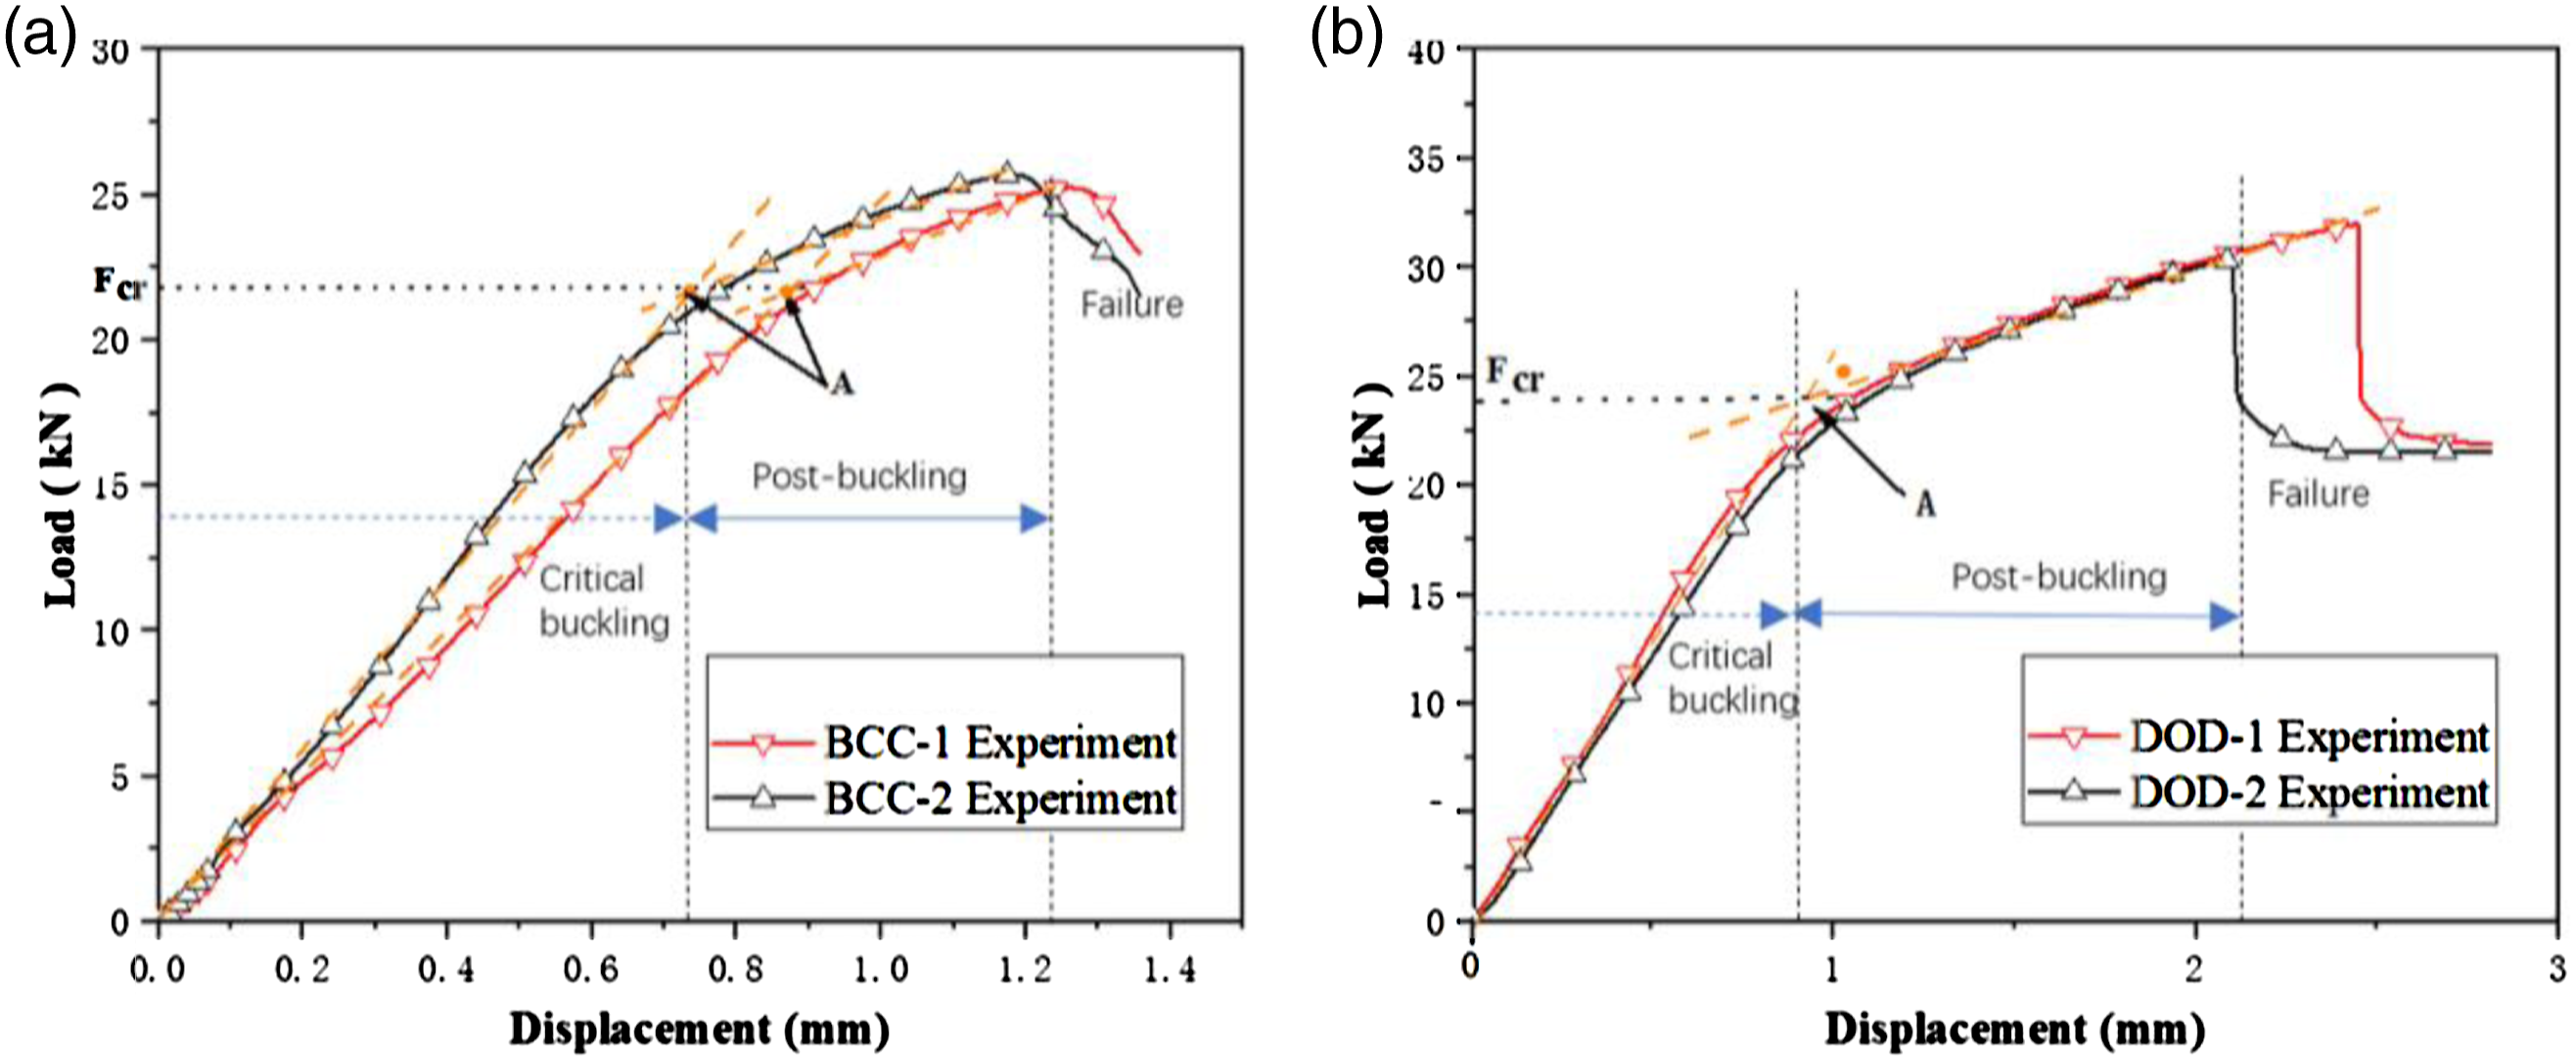
The test is carried out in an electronic universal testing machine at room temperature as shown in Figure 7. The movement velocity of the crosshead is set to 1.0 mm/min. The capacity and precision of load-cell are 100 kN and 0.5% respectively. The load-displacement curves of all specimens collected by the testing machine are shown in Figure 8. The initial buckling load Fcr of the structure can be empirically obtained by making a tangent line to the linear segment of the curve. Experimental setup. Load versus crosshead displacement curve. (a)BCC type, (b) DOD type.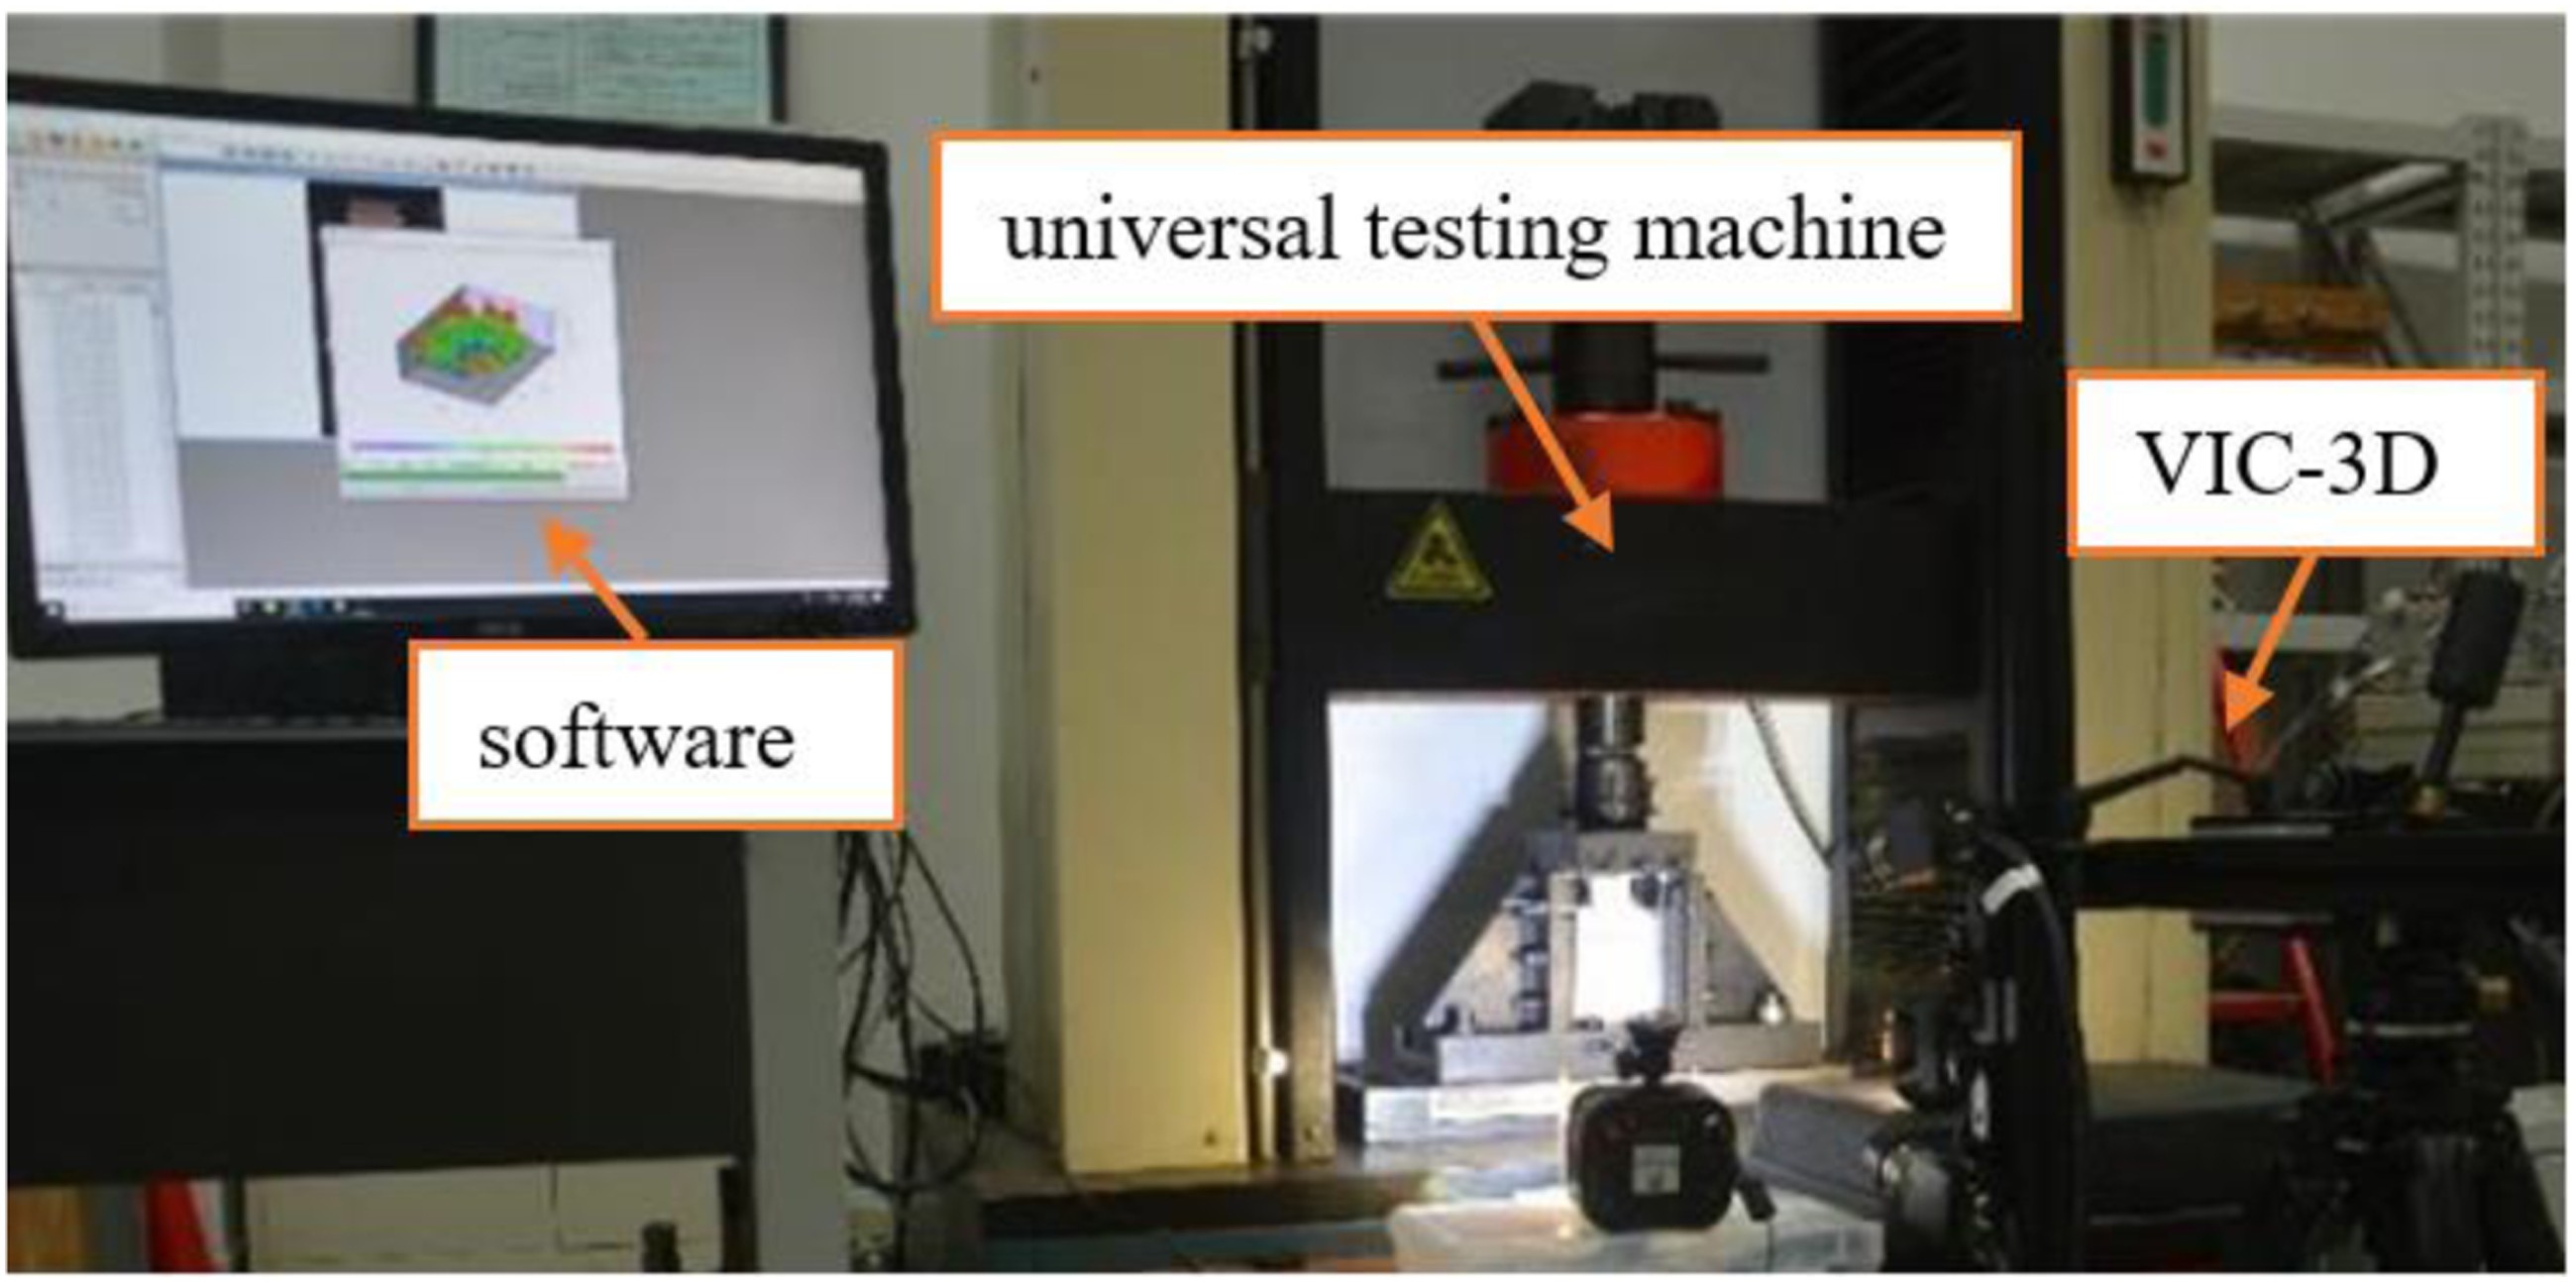
Results, comparisons and discussions
In this section, the buckling behaviors of the two sandwich structures are analyzed and discussed by comparing the results of numerical simulation, experiment and semi-empirical method.
Results
BCC type
Modern instability theory can be divided into Euler bifurcation instability (corresponding to the ideal system) and Karman-Qian extreme point instability (for the system with initial defects such as eccentric load and initial curvature), which constitute two basic forms of instability.
In this work, because all panels are 3D printed, they have inaccurate geometries and rough surface. These problems make some inevitable defects in the panel so the panels exhibit an extreme point instability feature. The critical buckling loads for such tests are determined according to the local nonlinear changes in load-strain curves.
The critical buckling load and failure load of BCC lattice sandwich panel in simulation are about 22.3 kN and 26.9 kN respectively. Meanwhile, the simulations show that the buckling mode of BCC type is symmetrical wrinkling with a wavy shape on facesheets. The short buckling wavelength illustrates this buckling mode can be considered as local buckling. As the top and bottom of the panels are not symmetrically constrained, the deformation mainly located at the upper part of the panel. The out-of-plane displacement field of initial buckling can be seen in Figure 9. Simulated first order buckling modes (BCC type).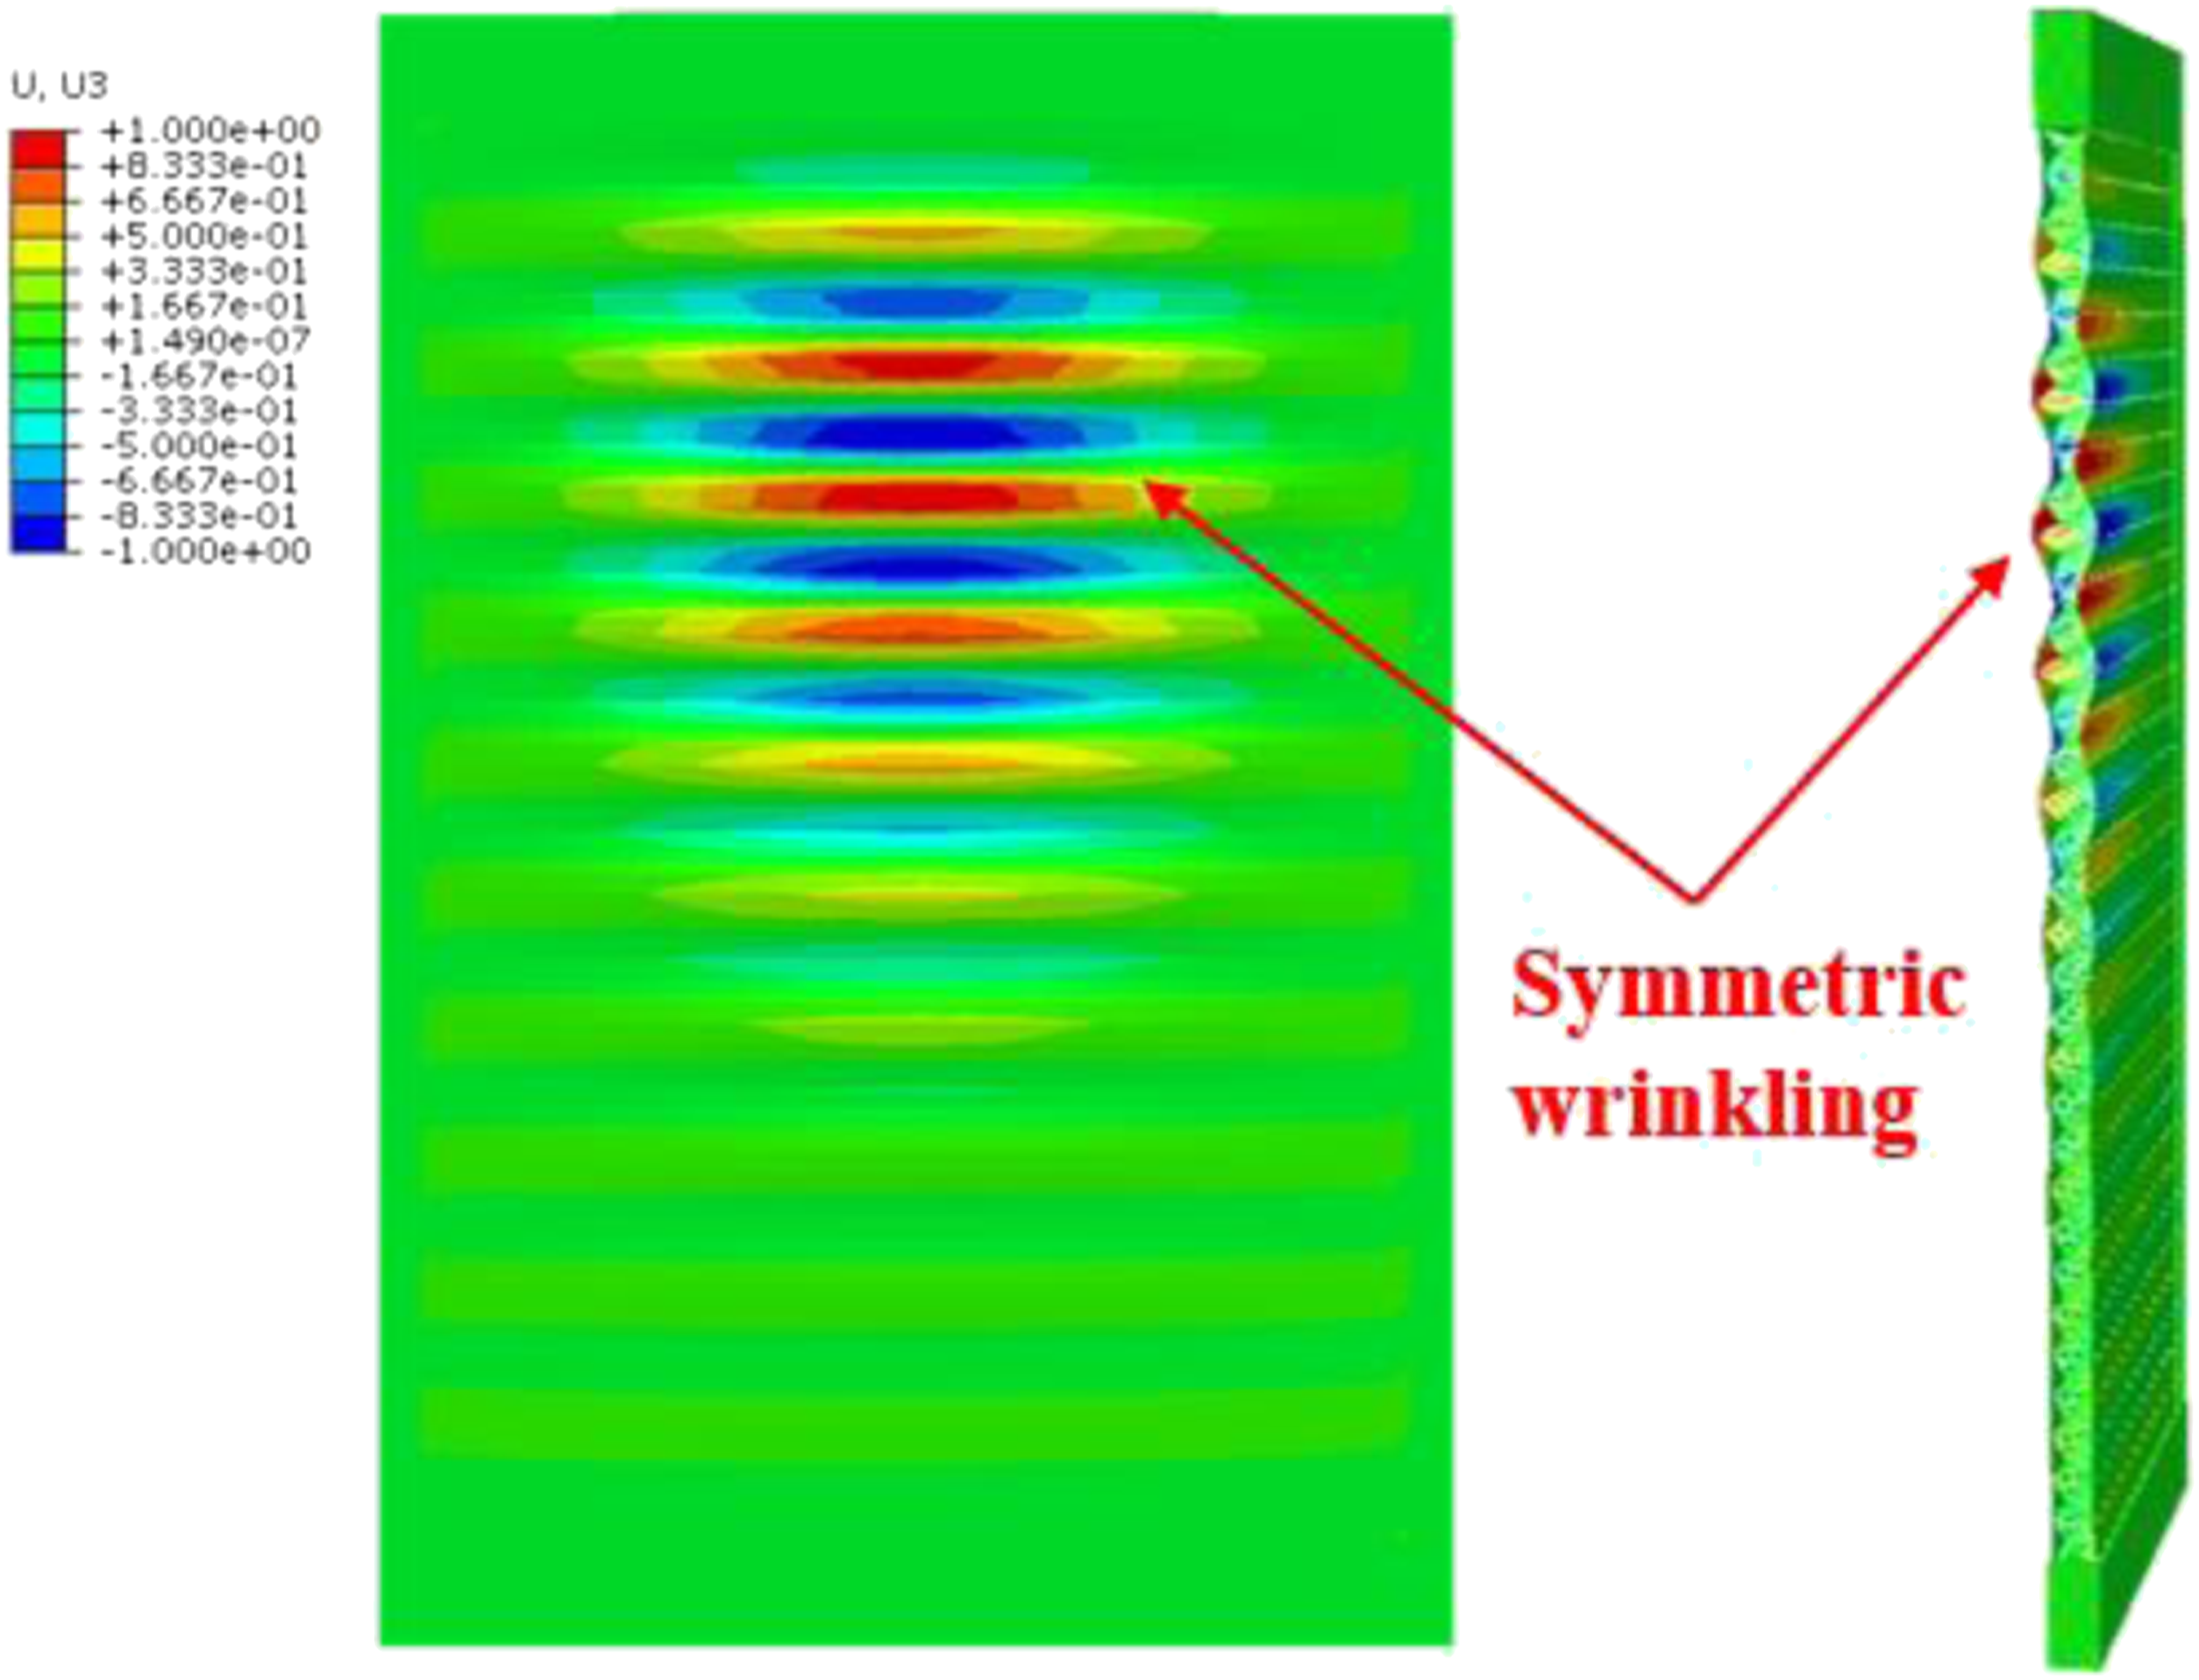
Figure 10 exhibits the evolution of out-of-plane displacement field of BCC type panel from post-buckling to failure. With increasing load, the buckling area extends to whole panel. Then the buckling waveform gradually concentrate to form an obvious wrinkle, along with load dropping, indicating the final failure of the panel. The similar phenomena (Figure 10(c) and Figure 10(d)) could be observed in corresponding tests. The evolution from post-buckling to failure (BCC type). (a) Displacement field in simulation, (b) morphology and stress distribution of panel section, (c) displacement field in experiment (DIC), (d) failure mode in experiment.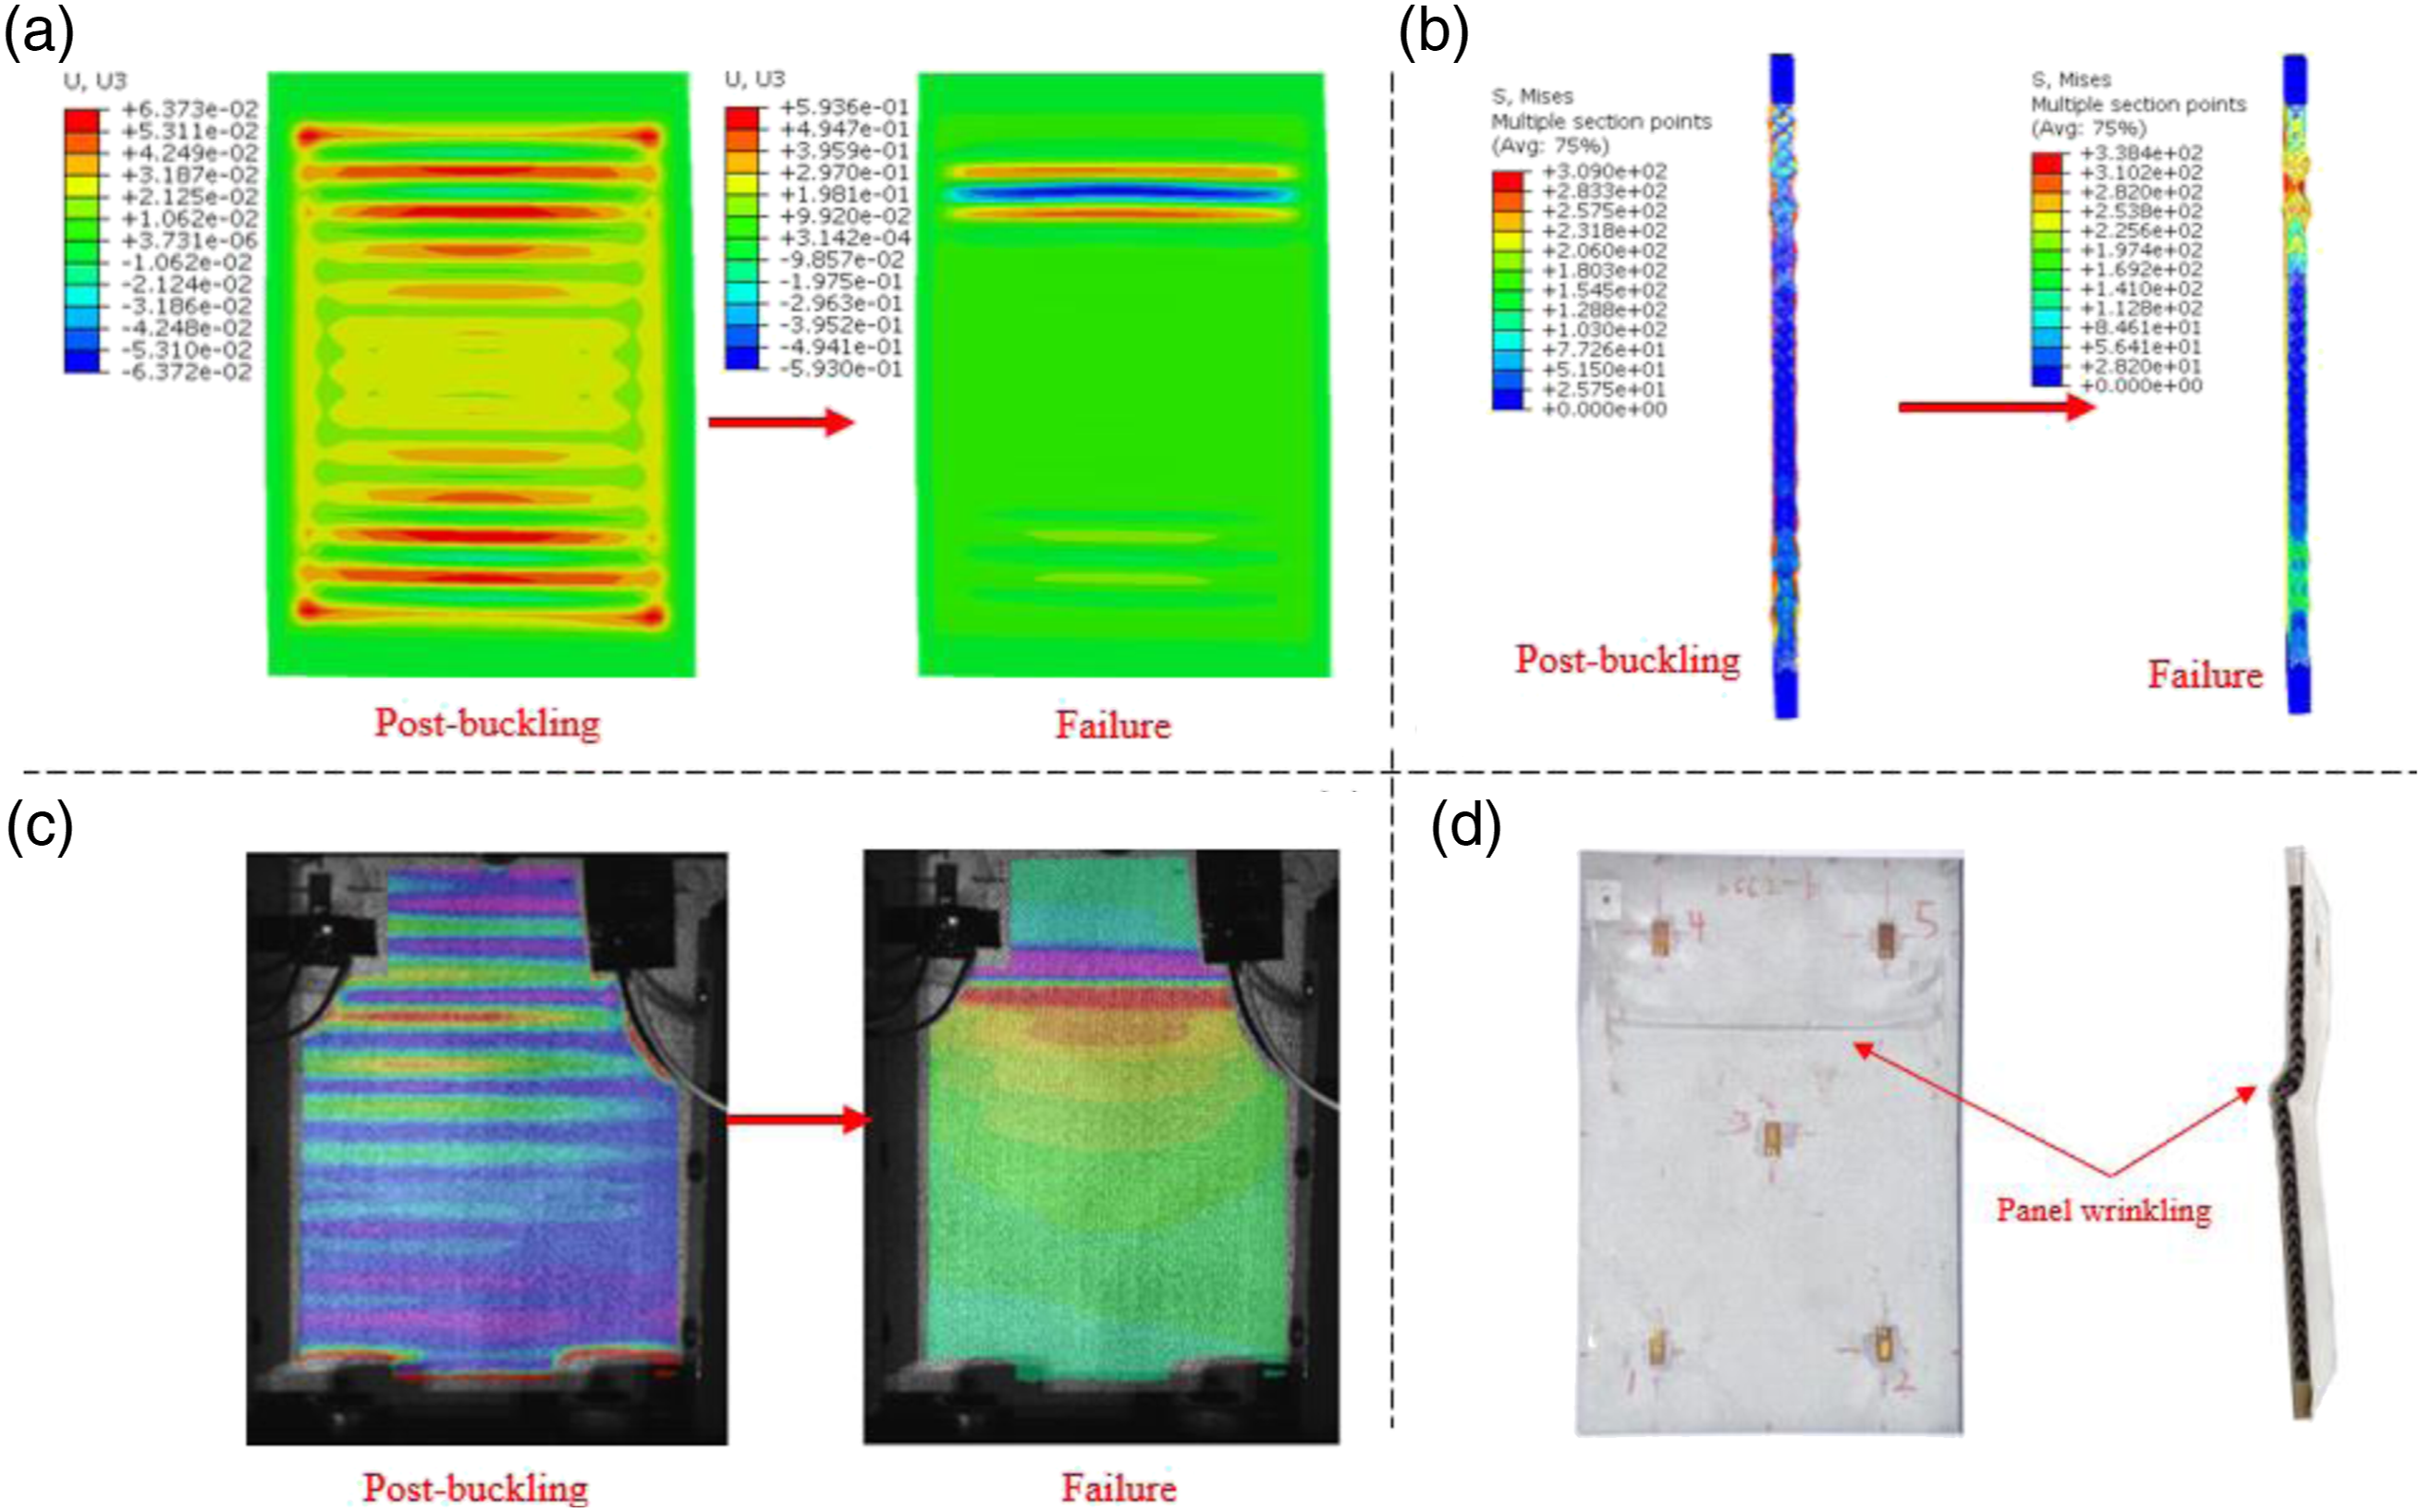
As plotted in Figure 11, the experimental critical buckling load is extracted from the curves empirically. The trend of strain values of all gauges has a good consistency, and the shift points of the curve almost have the same load. Strain-Load curves of BCC structures.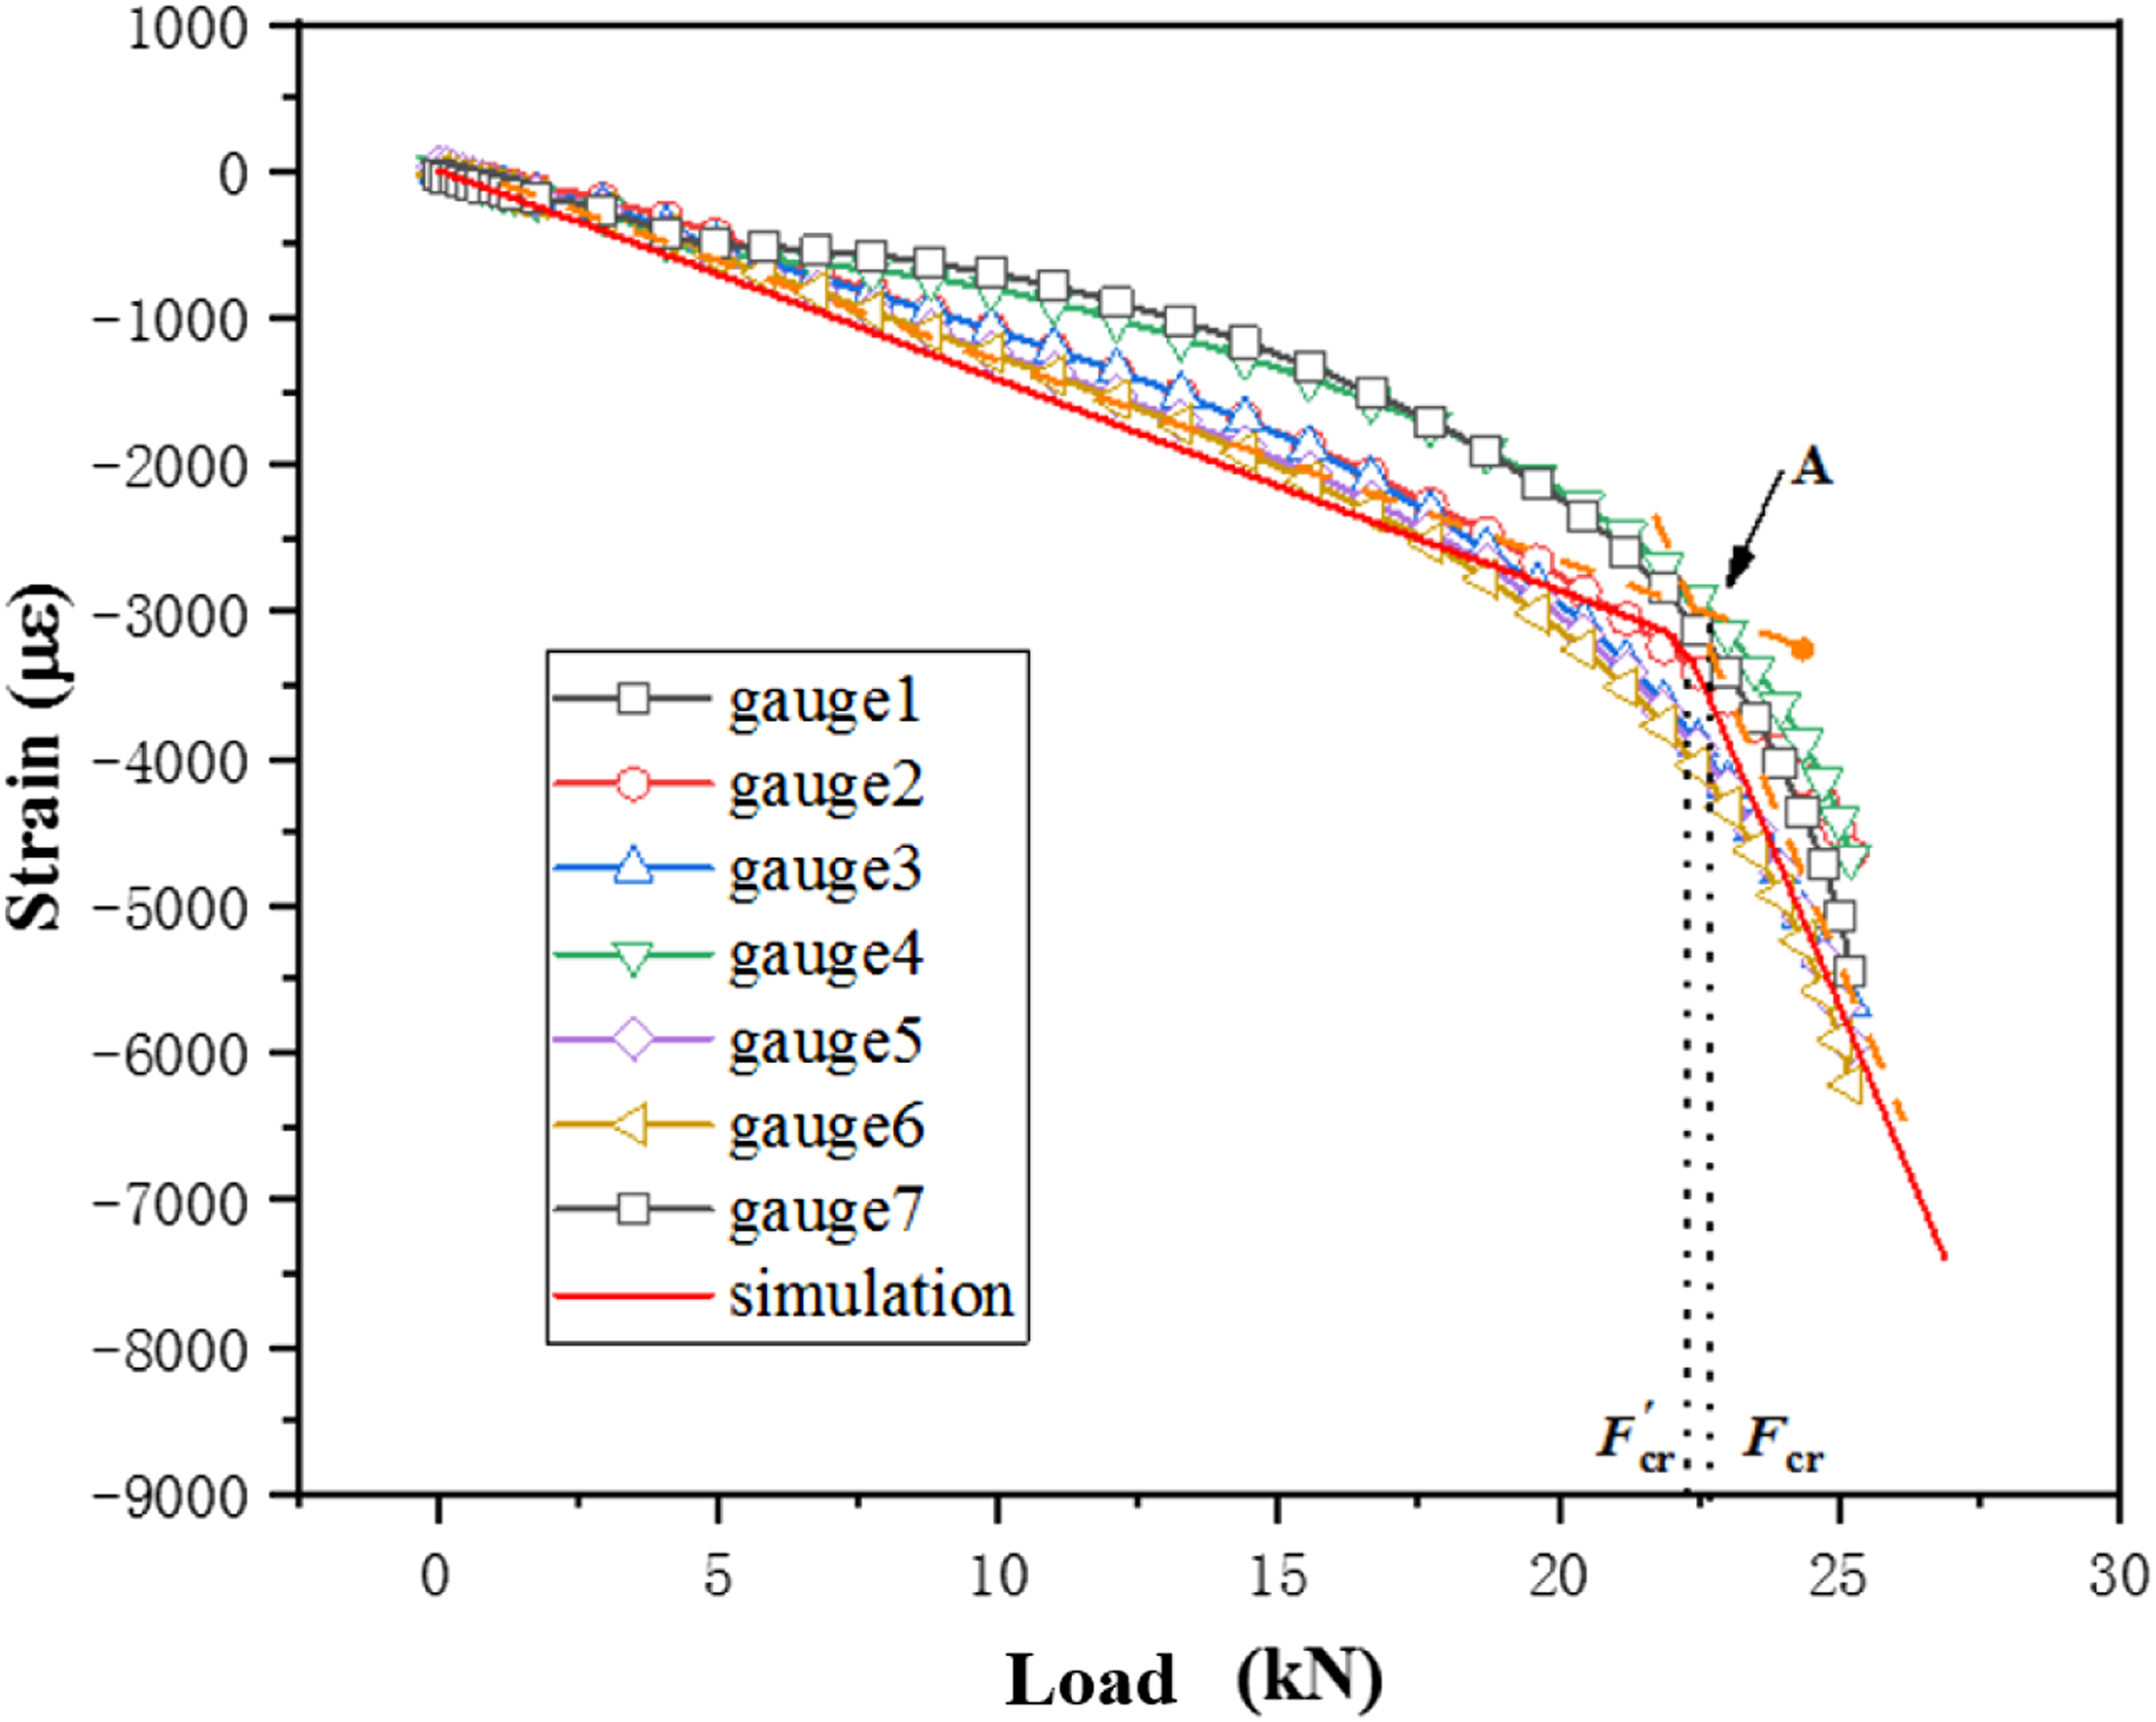
The critical buckling load and failure load of test results (BCC) are about 22.4 kN and 25.2 kN respectively. By comparing the load-strain data curves obtained by test and simulation, it can be found that the simulation result (F’cr) is slightly lower than the test value (Fcr), thus the simulation accuracy can be verified.
DOD type
In the case of DOD lattice sandwich panel, the critical buckling load and failure load in simulation are about 23.6 kN and 32.3 kN respectively. The deformation mainly appears on the upper part of the panel (see Figure 12). Besides, this buckling mode is different from the BCC type, exhibiting a global buckling with long buckling wavelength. Simulated first order buckling modes (DOD type).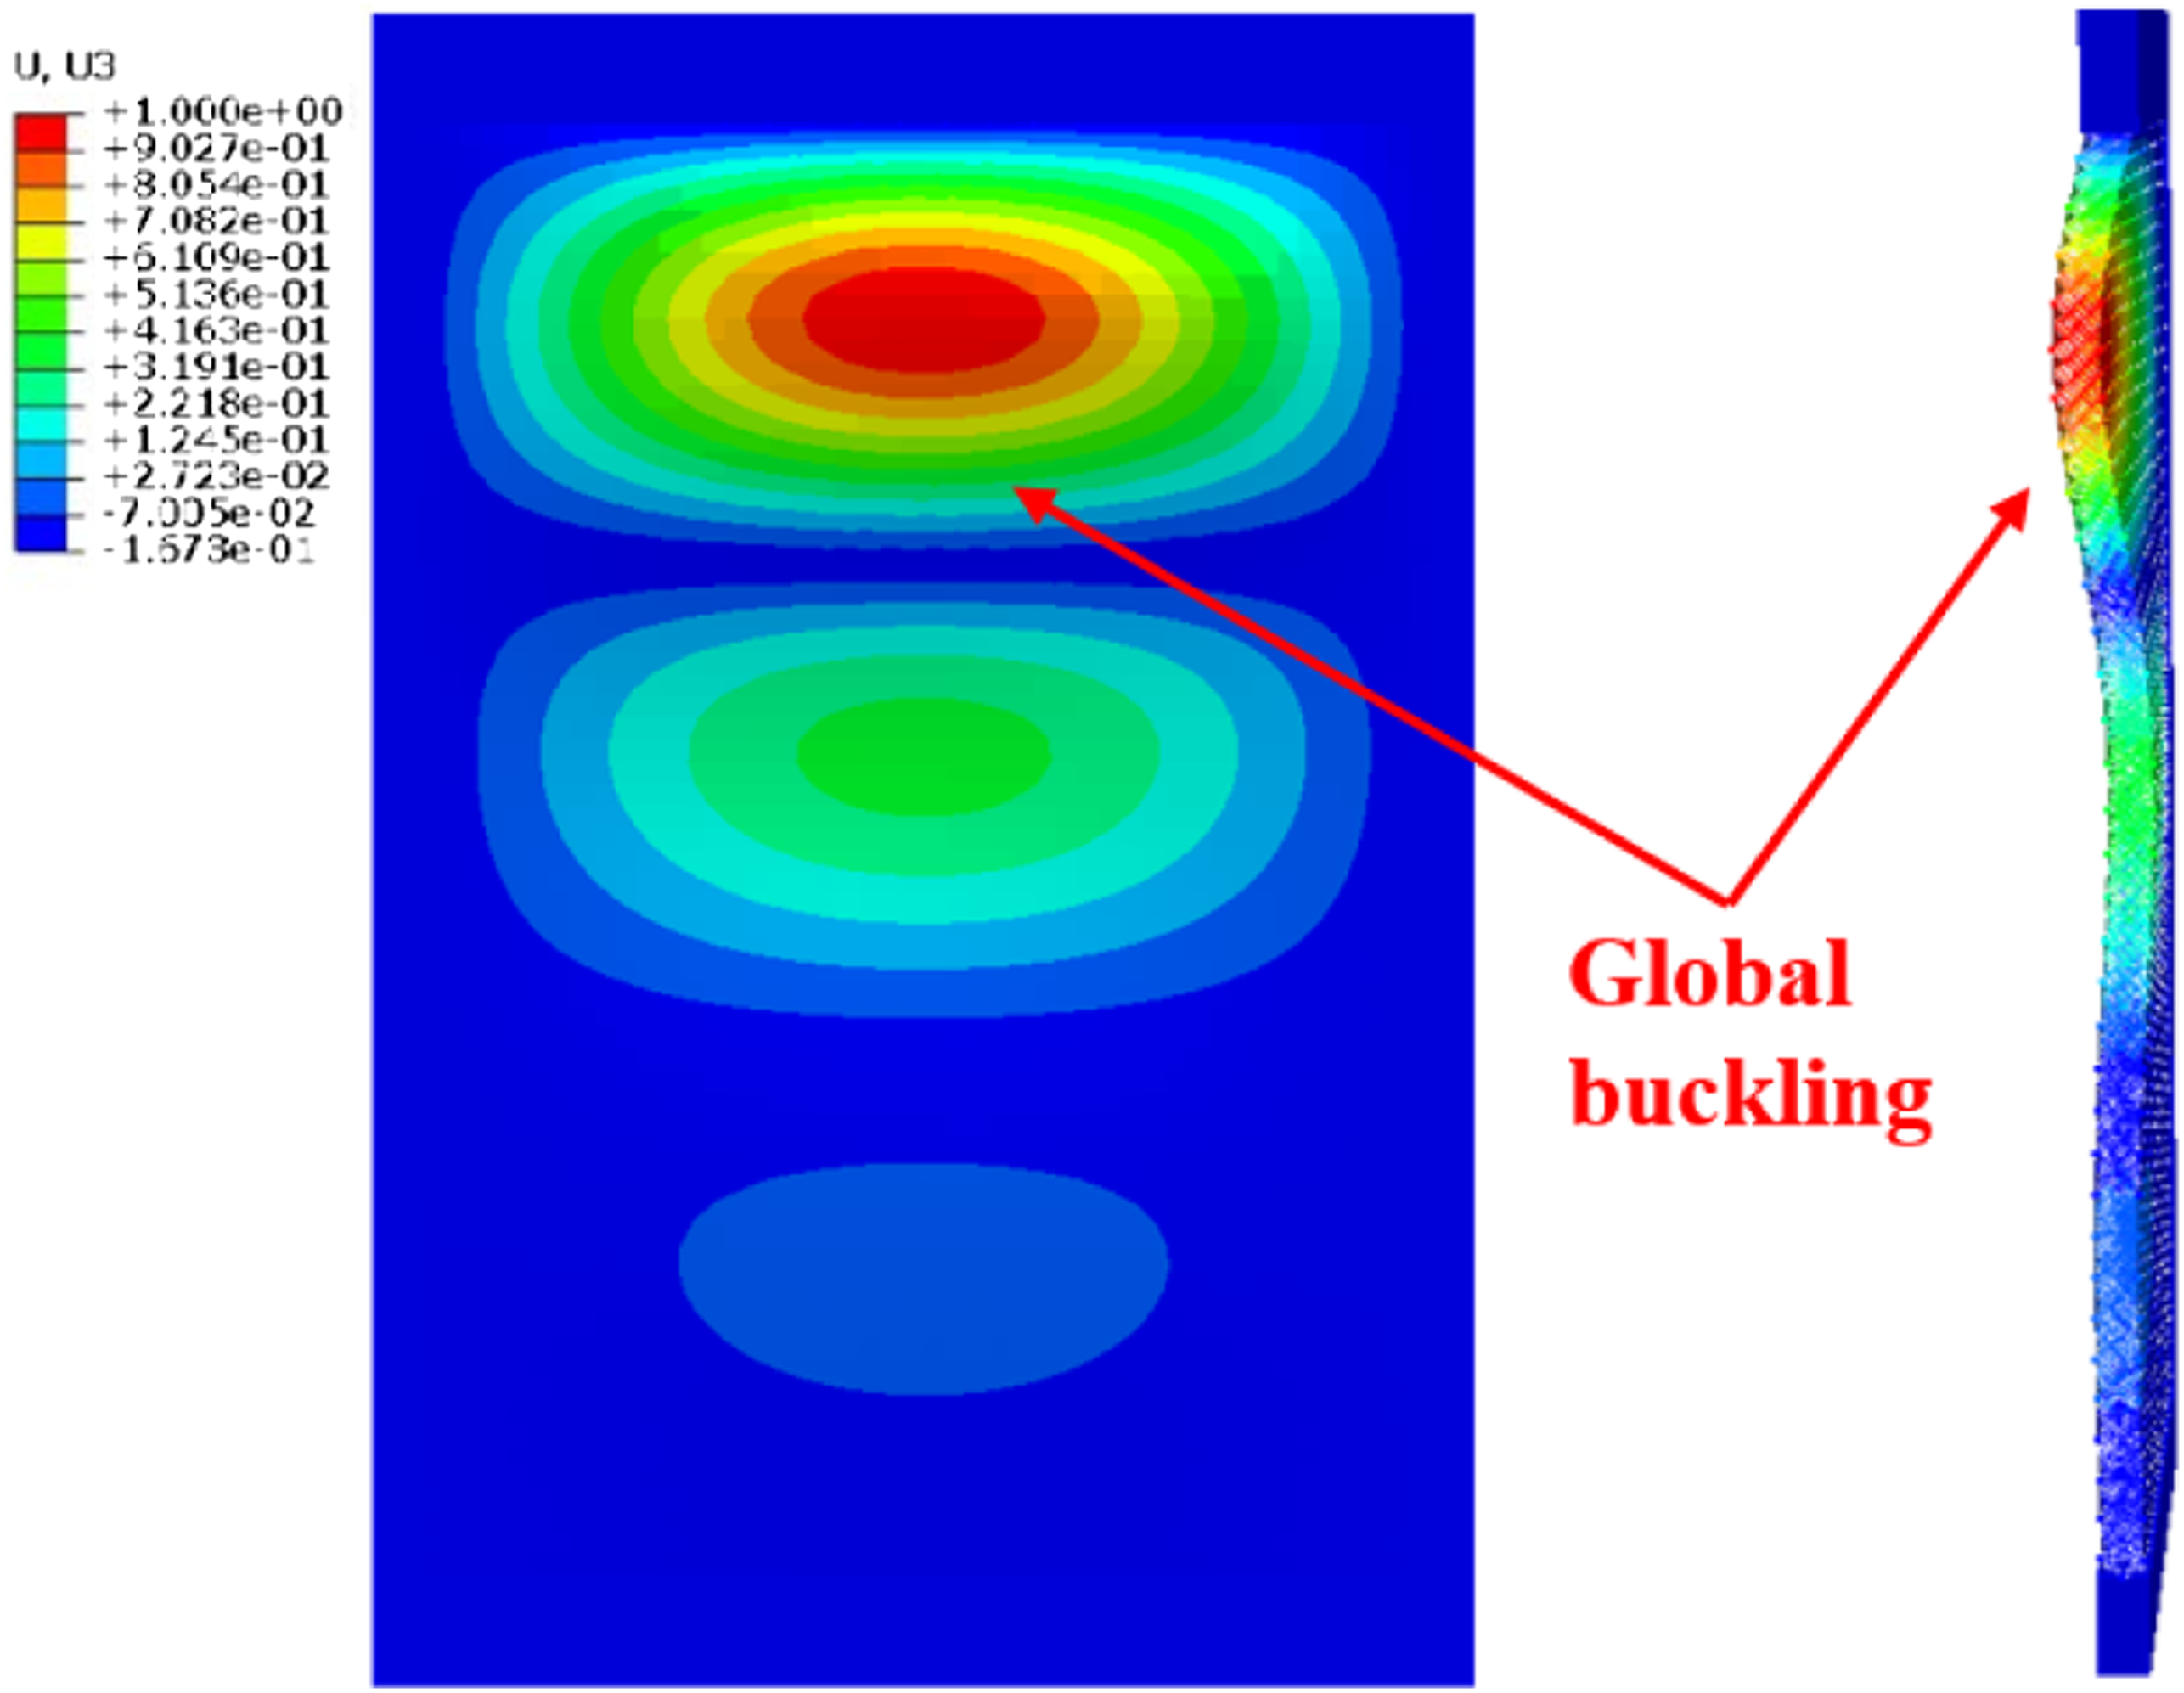
Figure 13 displays the change of DOD type panel from the post-buckling to failure. After initial buckling, the buckling area extends and two global buckling waves appear with the increasing load. Then the buckling deformation is gradually concentrated in the lower part of the panel. Finally, shear crimpling occurs locally, resulting in structural failure. The displacement field (DIC) and failure mode in experiment are consistent with the simulated results. The evolution from post-buckling to failure (DOD type). (a) Displacement field in simulation, (b) morphology and stress distribution of panel section, (c) displacement field in experiment (DIC), (d) failure mode in experiment.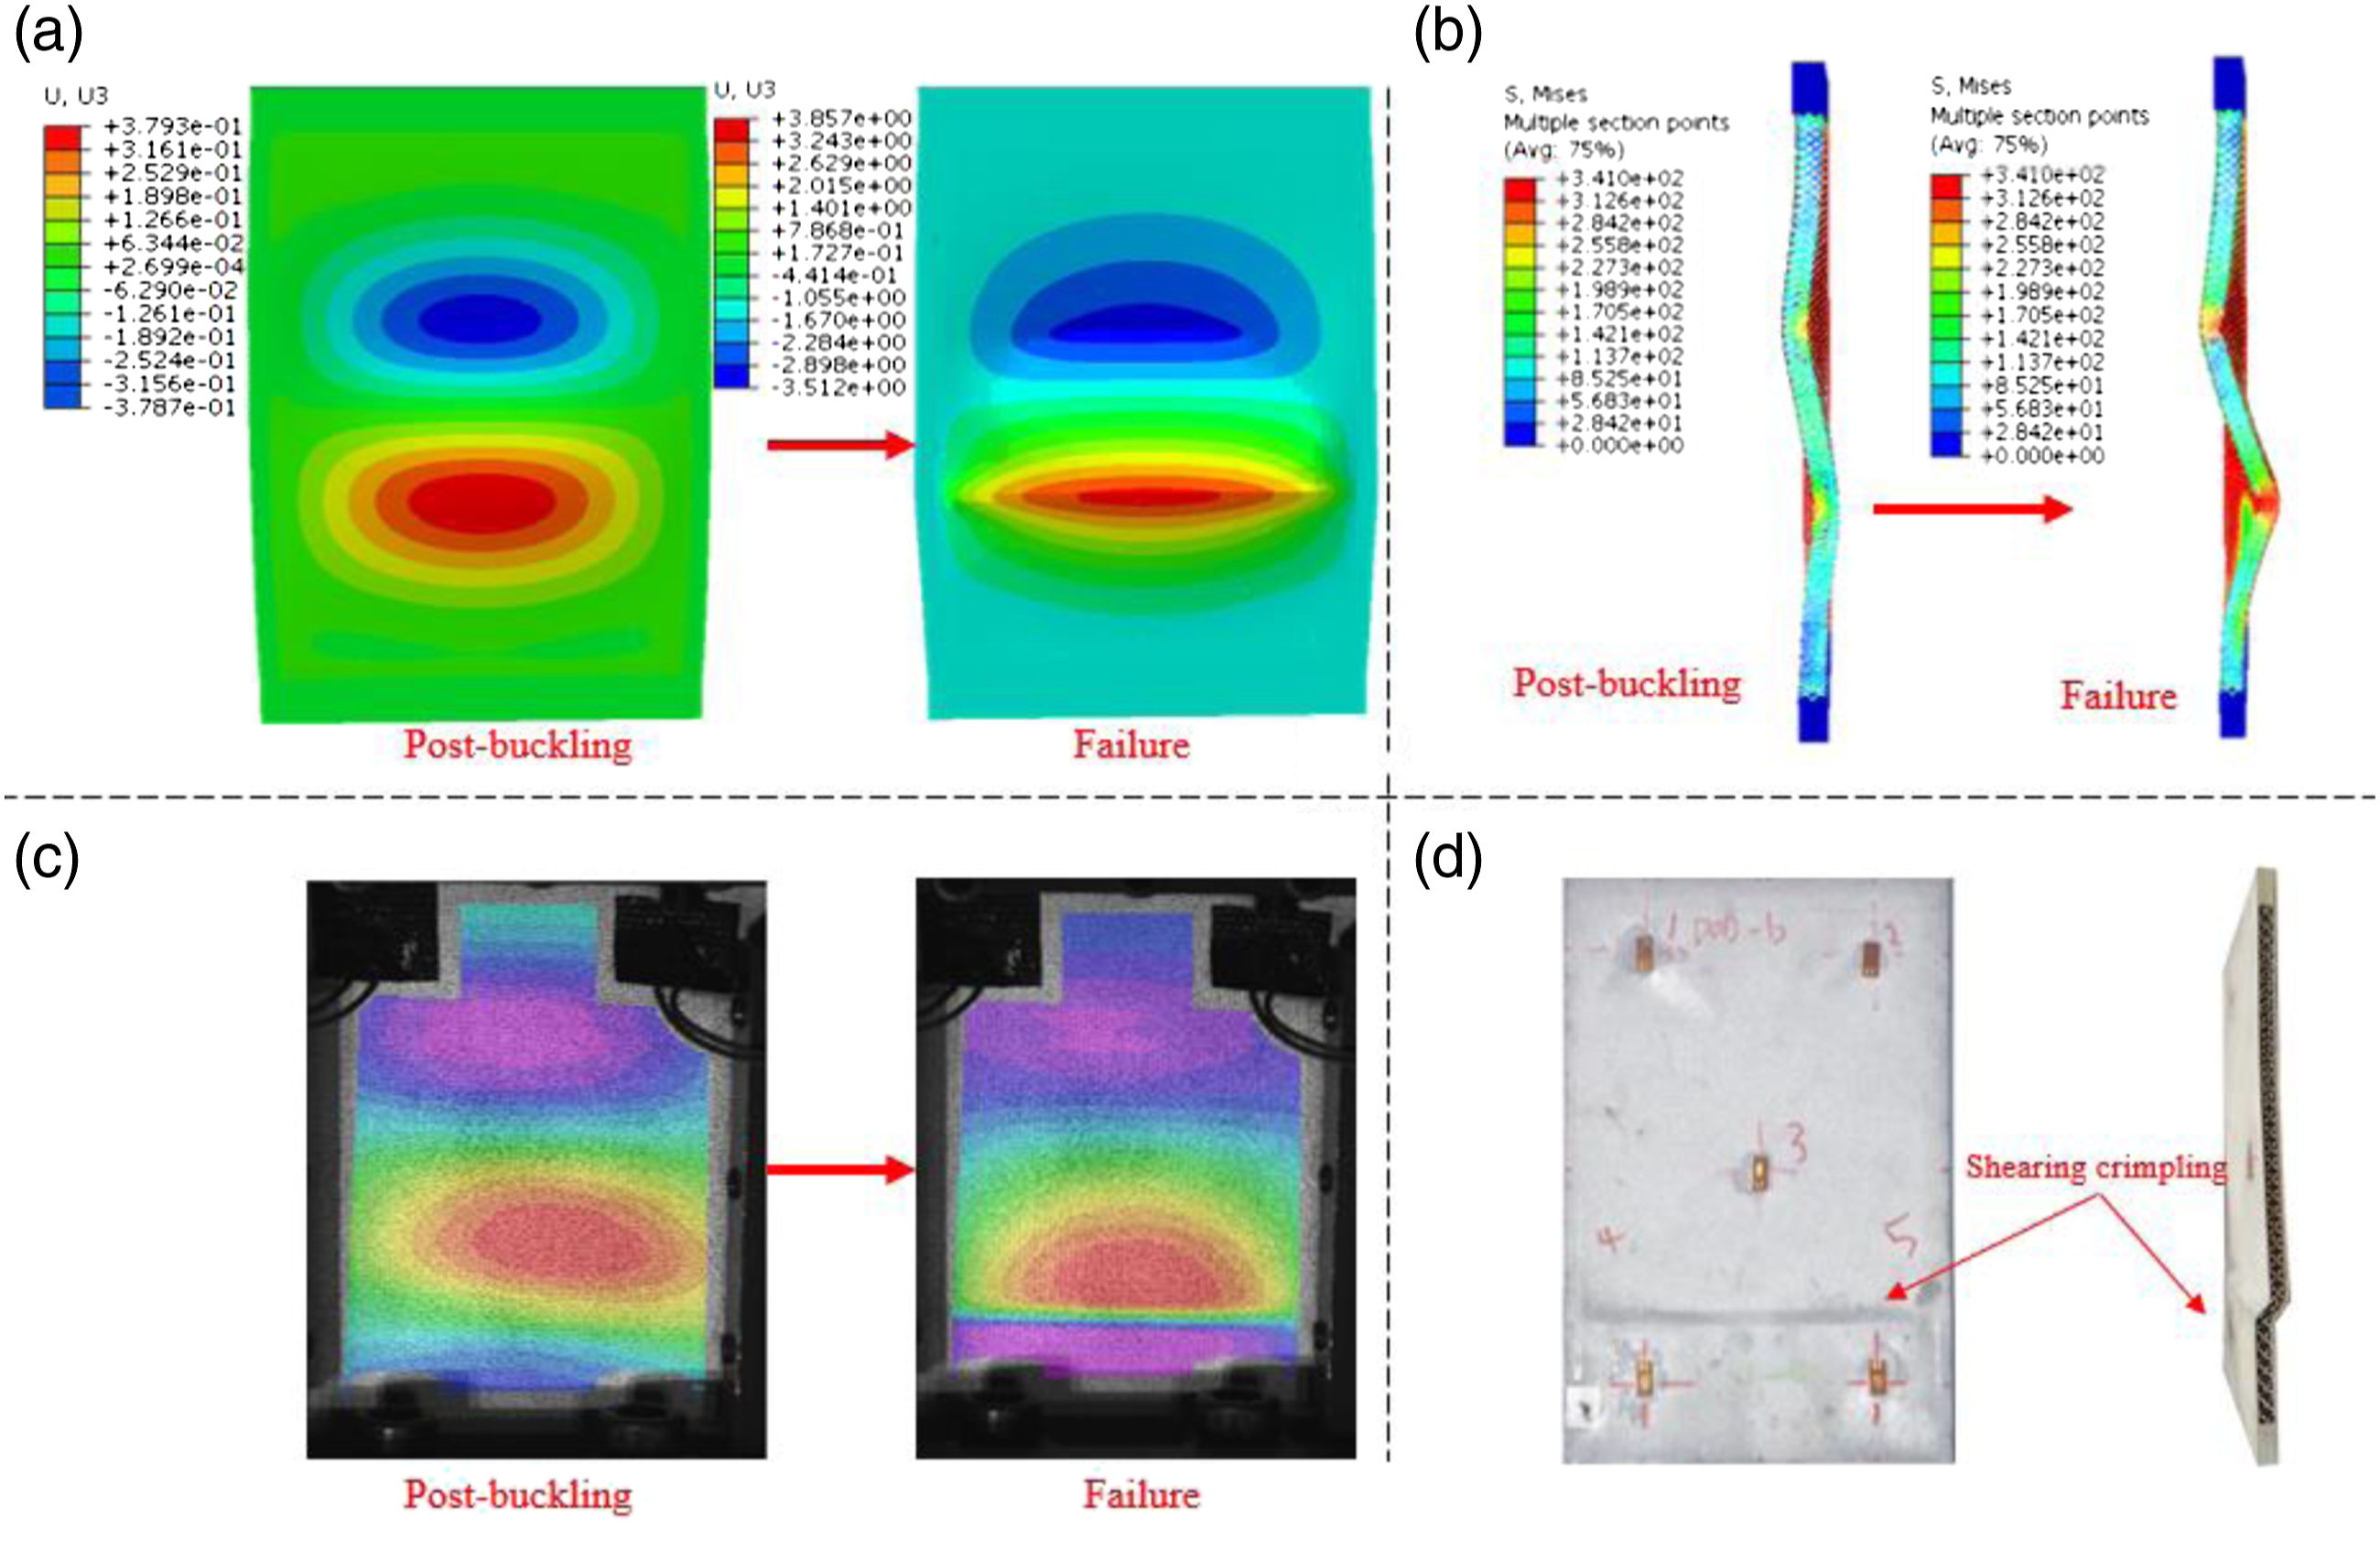
The critical buckling load and failure load of test (DOD) shown in Figure 14 are about 24.0 kN (point A in the figure) and 31.8 kN respectively. It can be found that the actual critical buckling loads obtained by the two methods is almost the same, and the simulation result (F’cr) is slightly lower than the experimental value (Fcr). Strain-Load curves of DOD structures.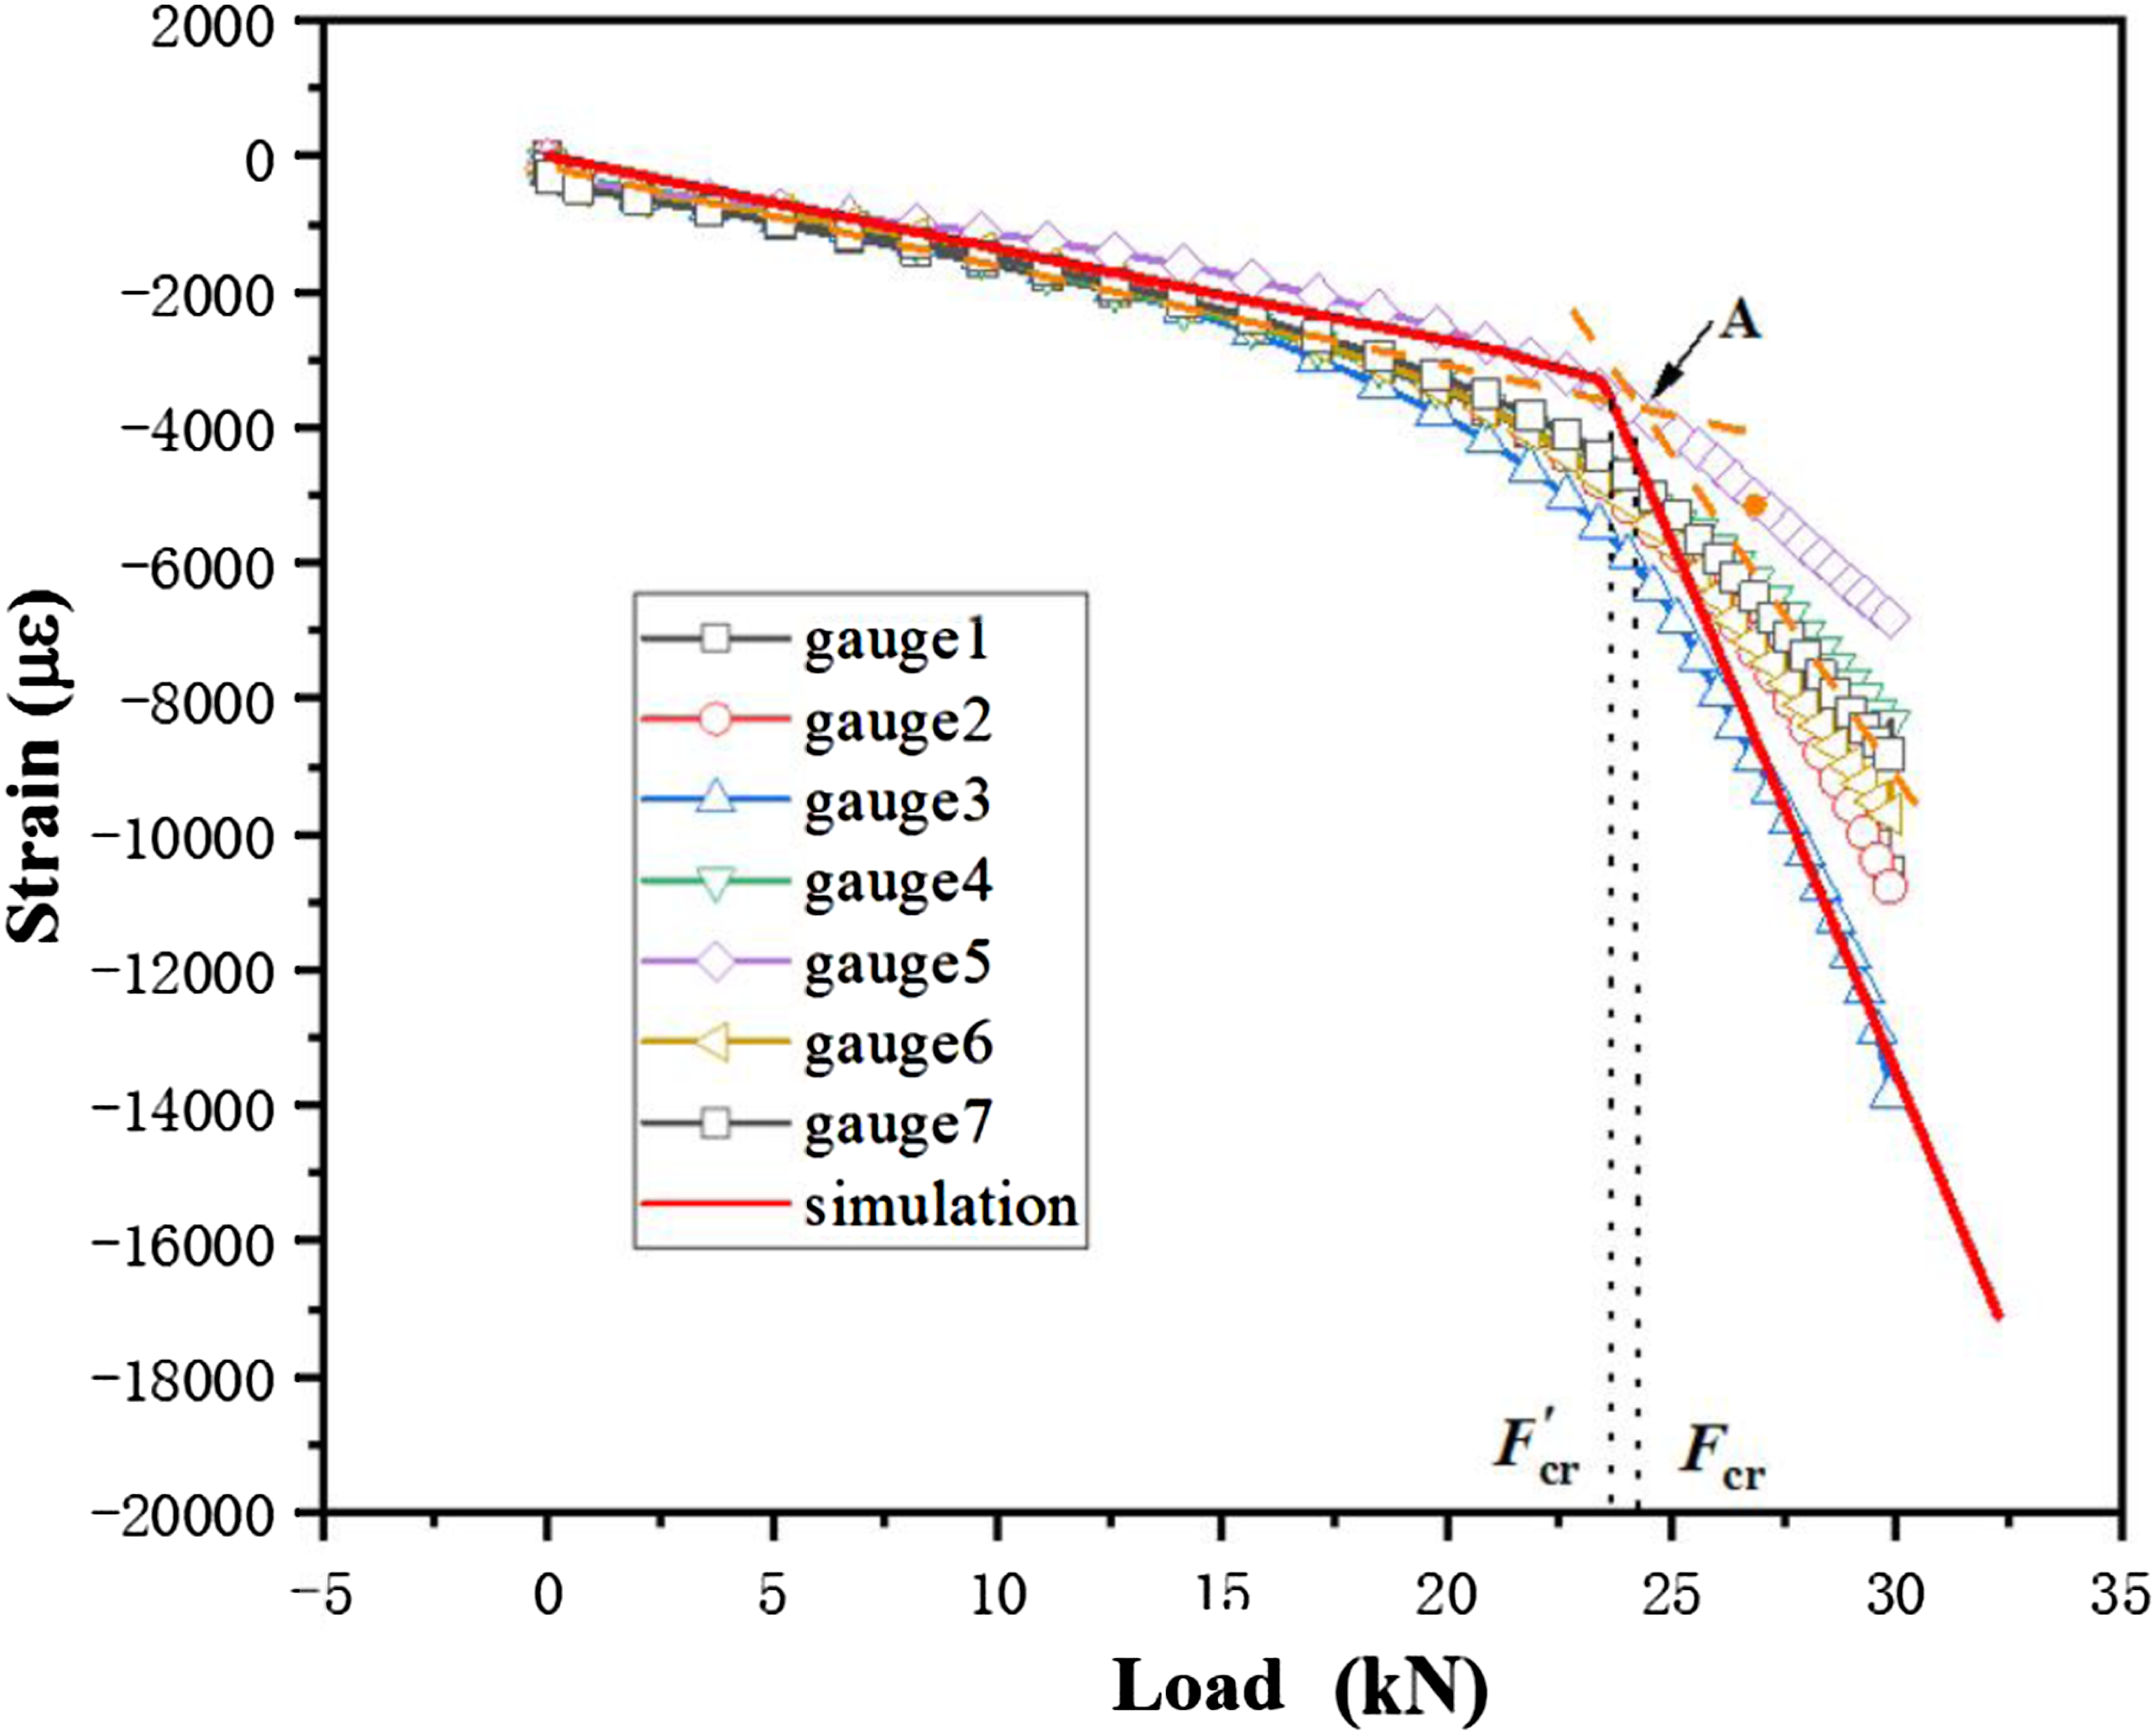
Comparison and discussion
Comparison between different structures
Comparison of buckling load and fracture load obtained from semi-empirical method (Emp.), finite element method (FEM) and experimental test (Exp.).
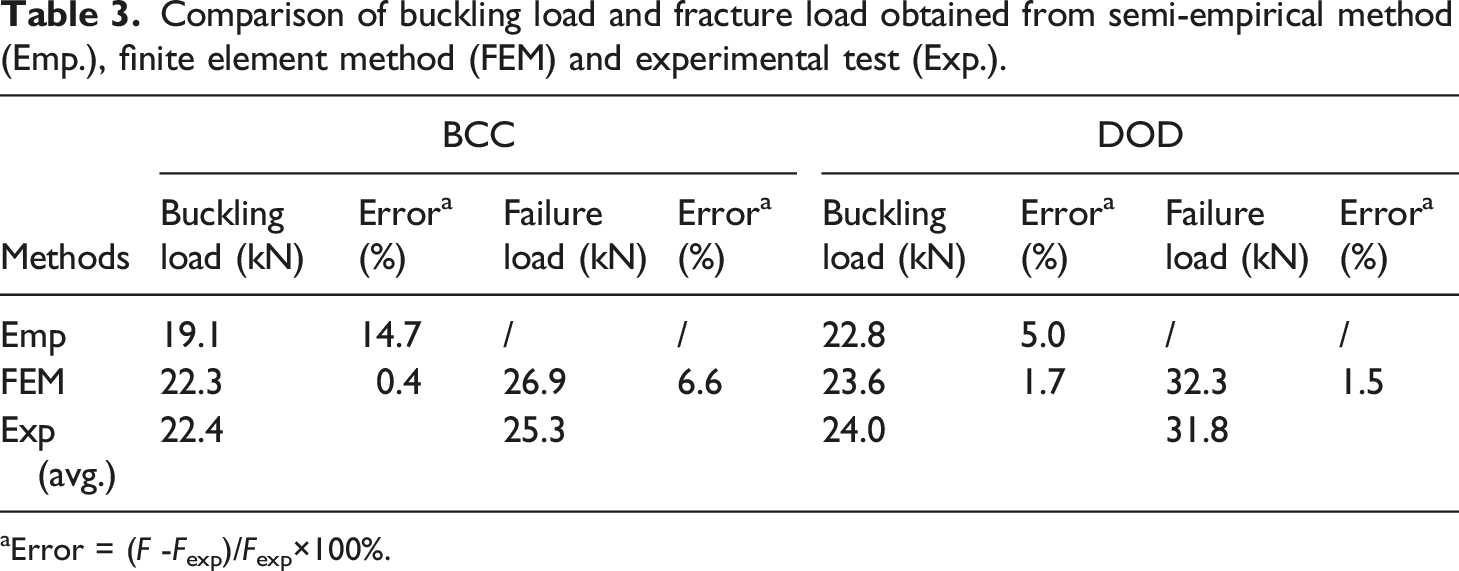
aError = (F -Fexp)/Fexp×100%.
It is speculated that the difference of buckling mode between two kinds of structure is caused by the different span of the facesheets connected by two adjacent struts. The span of BCC unit cell is larger than that of DOD unit cell. At the post-buckling stage, with the extension of the wrinkles on facesheets, one wrinkle will eventually change into a final failure place on the BCC lattice sandwich panel. In contrast, after the initial buckling step, the core of DOD type panel mainly bears the shear deformation with the increase of load, and finally the panel forms shear crimpling due to the insufficient shear strength of the core.
The load applied on each strut can be observed during the load process in simulation (see Figure 15). At the elastic stage, the stress distribution of core is uniform. Once structural buckling occurs, the axial load of the struts located in the buckling deformation area increase rapidly. For BCC type panel, there is a symmetrical and periodic wrinkling pattern at the facesheets, also, the struts are subjected to the symmetrical and periodic tension or compression stress condition, depending the place of the struts. For the DOD type panel, the struts located at the center of the buckling area bear the highest stress. Stress condition of struts in post-buckling stage (Enlarge the deformation by 8 times). (a) BCC, (b) DOD.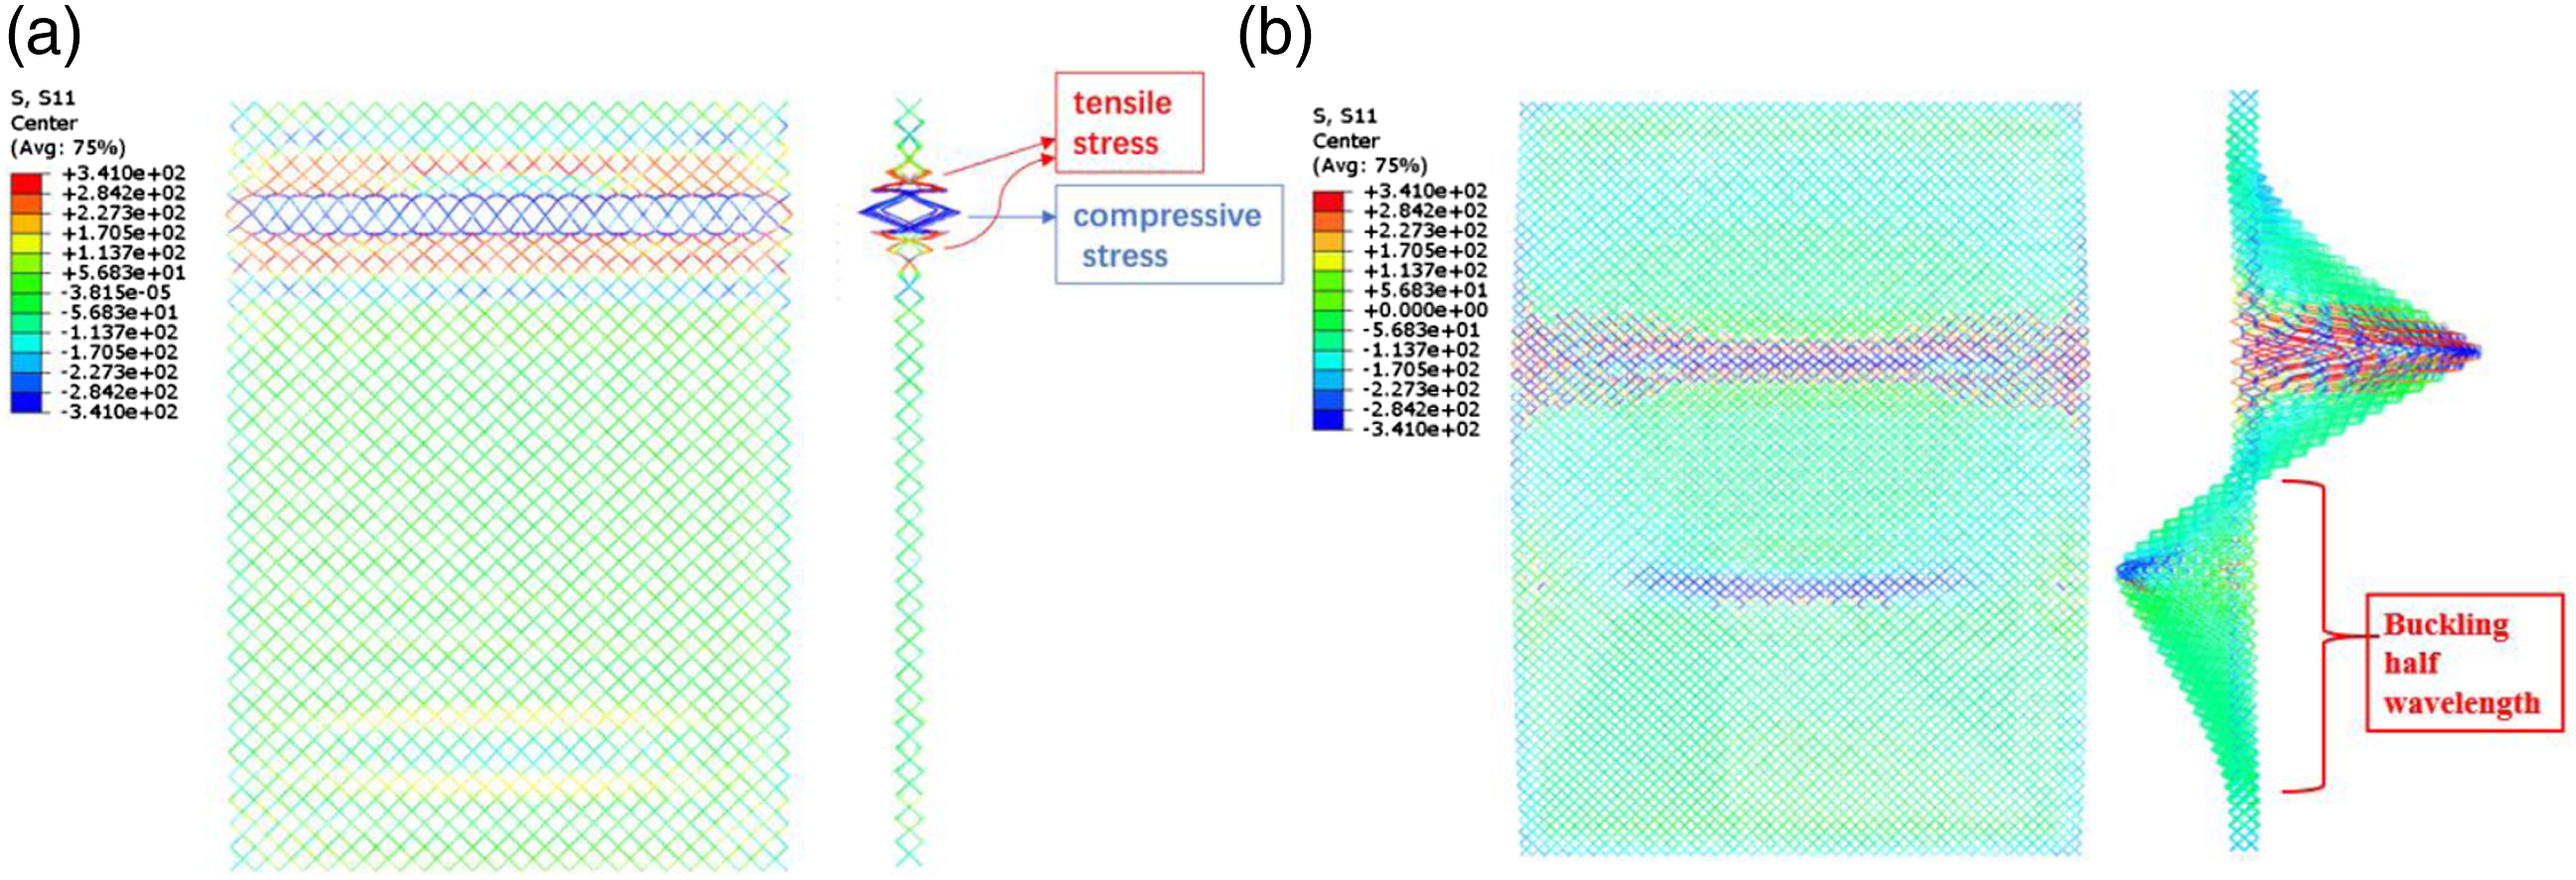
Discussion on results from different methods
Compared with experimental results, we can find that semi-empirical method has a larger error than numerical method. The main reason is that the many parameters in the empirical formulas, such as plasticity correction coefficient and average buckling coefficient are obtained from experimental curves and data, while these curves and data usually are created based on conventional sandwich structures, so it has limitations to be used to exactly describe current lattice structure, but it is still an economical and effective method to make a preliminary prediction.
As for the results of finite element analysis, it can be found that the critical buckling load, failure load predicted by FEM have slightly deviations (less than 7%) to experimental values. But we can learn that the experimental buckling load is higher than the FE results whereas the failure load of the FE code is higher than the experimental one. It seems like a confused result, but it depends on many factors. Generally, the experimental buckling load couldn’t be determined accurately as the real buckling is a progressive procedure. We used a common determining method based on intersection of an elastic stage and a non-elastic stage (see Figure 8), which leads overestimate the value slightly. As for the failure load, it could be determined without doubt in the test. In addition, the surface of a 3D printed component is usually rough and could not be finish machined to reach the ideal condition; the fixture could not provide perfect constraints to the specimen; the 3D printing process is apt to produce micro-voids in melted material. The above factors usually make the experimental failure load less than the predicted one. Even so, The FE model is found to be in a good agreement with the experimental results, not only they have similar values, but they exhibit similar buckling responses as well.
Conclusions
In this work, the buckling behaviors of two types of lattice sandwich panels fabricated by SLM technology are investigated by theoretical analyses, numerical simulations and experiments. From the above studies, the following conclusions can be drawn: 1. The experimental critical buckling loads of BCC type and DOD type lattice sandwich panels are about 22.4 kN and 24.0 kN respectively, and the failure loads are 25.3 kN and 31.8 kN. DOD type lattice sandwich panel not only has higher bearing capacity, but also shows better toughness and energy absorbing capacity at the post-buckling stage, while the two configurations have the same unit cell characteristic size. 2. The buckling modes depend on the structural topology of the unit cell. For BCC lattice sandwich panels, it shows symmetrical wrinkle with a wavy shape on facesheets, while the DOD panels shows a global buckling mode with long wavelength. 3. At the post-buckling stage, a main wrinkling failure between the local buckling waves eventually occurs on the BCC lattice sandwich panel, while the DOD type panel exhibits shear crimpling due to the insufficient of shear strength of lattice core.
Footnotes
Declaration of conflicting interests
The author(s) declared no potential conflicts of interest with respect to the research, authorship, and/or publication of this article.
Funding
The author(s) disclosed receipt of the following financial support for the research, authorship, and/or publication of this article: Fund of Key Laboratory of Equipment Pre-research (6142704200405).