
Abstract
To develop a new type of bionic curved sandwich plate, it is necessary to first develop experimental methods and evaluation criteria for curved plates. Thus, this paper focuses on an aluminum cylindrical honeycomb plate and proposes two types of clamping methods for radial compression tests. Using finite element simulation, radial compression tests were carried out, and the mechanical characteristics under different clamping methods were studied. The results showed that (1) the two types of clamping methods have significant effects on the radial compression performance, and each has its own characteristics. The influence mechanism was explored from the perspective of the deformation shape of the sample and the sliding direction of the foot. (2) Clamping methods were given with regard to different experimental purposes or engineering application objects (backgrounds), and three clamping methods that are easy to prepare and have great universality were also presented. This research provides an important theoretical basis for the development of curved plates, radial compression test methods for curved plates and the formulation of corresponding test standards.
Introduction
Honeycomb sandwich plates, as typical lightweight, high-strength and cushioning structures,1–3 were first applied in 1938. The four-engine Havilland Albatross aircraft made in Germany and the circular fuselage part of the British mosquito bomber took the lead in adopting this structure, 4 which can reduce the aircraft’s mass while increasing the aircraft’s carrying capacity. Since then, the aluminum honeycomb has been fabricated into precise shapes to enhance the various structural areas of aircraft, ranging from the engine cell to the fuselage. It has also been widely used in many other industries, such as transportation 5 and building structures. 6 In addition, sandwich plates with different core layer designs and various superior performances 7 are also emerging. And most of the sandwich plates that are widely used are flat (or nearly flat).
However, as is well known, curved structures often have better mechanical advantages than flat structures,8–10 and they can be designed into an appealing and fluid shape, which can fulfill people’s expectations of various products in terms of desired performance, unique functions and preferred appearance. 11 Therefore, bending the flat sandwich plate into a curved one is an effective way to concentrate strengths and quickly optimize the structural performance. 12 There have been studies on the mechanical behavior under radial loading of curved plates with different core layers, such as polyurethane foam cores, 13 pyramid lattice cores, 14 and foldcores. 15 To more scientifically and effectively utilize the indexes to reflect the mechanical behaviors and compare different structures, the establishment of a rigorous and effective test system has become an urgent problem to solve and a prerequisite for the systematic study of mechanical properties.
In view of this, based on existing experimental, simulation and theoretical research on the radial compression performance of planar honeycomb plates,16,17 this work took the most commonly used aluminum cylindrical honeycomb plate (CHP) as the subject and investigated its radial compression properties, which is the most basic static behavior of the curved plate. Additionally, corresponding test methods through the finite element method (FEM) from the unique perspective of different clamping methods (constraints) were also studied, which will shed light on the development of the radial compression test method, the formulation of test standards and the engineering application of curved surface sandwich plates.
Model design and test methods
As mentioned earlier, curved sandwich plates were studied from the unique perspective of different clamping methods. To implement the radial compression experiment, the following two schemes were designed and determined after preliminary assumptions and preliminary work of finite element analysis. The first scheme explored the impact of different supporting tables for curved plates, such as flat plates or V-shaped fixtures (with different inclinations), on structural testing. Natural placement is adopted, that is, it was only supported by the normal direction and can move freely in the tangential direction, while the corner of the foot was restricted (in an ideal situation, it can be characterized as a sliding support). The other scheme was to further consider the influence of constraints or clamps on compression performance. A tangential constraint was added on the basis of the first scheme (in an ideal situation, it is characterized as a fixed support).
3D model design of the specimens
The structural parameters of the designed 3D model (Figure 1(a) and (b)) were determined according to the structure of the optimized beetle elytron plate in earlier research.
18
It should be pointed out that (1) although this test was not flat compression, considering the force range of the actual loading device, the size of the specimen referred to ASTM C365-03.
19
(2) Bending will cause the upper and lower layers of the bending specimens to have different sizes or lengths (and the honeycomb size is not constant in the thickness direction). To eliminate the difference as much as possible, the middle layer was chosen as the reference plane (red dotted line in Figure 1(a) and (b)), and then the core layer was designed considering its unfolded length, as shown in Figure 1(b). After that, it was bent into a semicircle, and the upper and lower skins were added to obtain the CHP model, as shown in Figure 1(a). Figure 1(a), (c)–(e) shows the CHP models corresponding to fixtures at 0° (i.e., flat plate), 30°, 45° and 60° inclinations (referred to as the 0°, 30°, 45° and 60° models, respectively). Considering that the foot is a weak position during compression, edge seals with a thickness of 2 mm were designed on the end faces in contact with the fixture (Figure 1(a), (c)–(e)). 3D model of the specimens. (a) Cylindrical honeycomb plate, 0° model, (b) core layer before bending, and (c–e) 30°, 45° and 60° models (due to symmetry, the 1/4 model is used for illustration).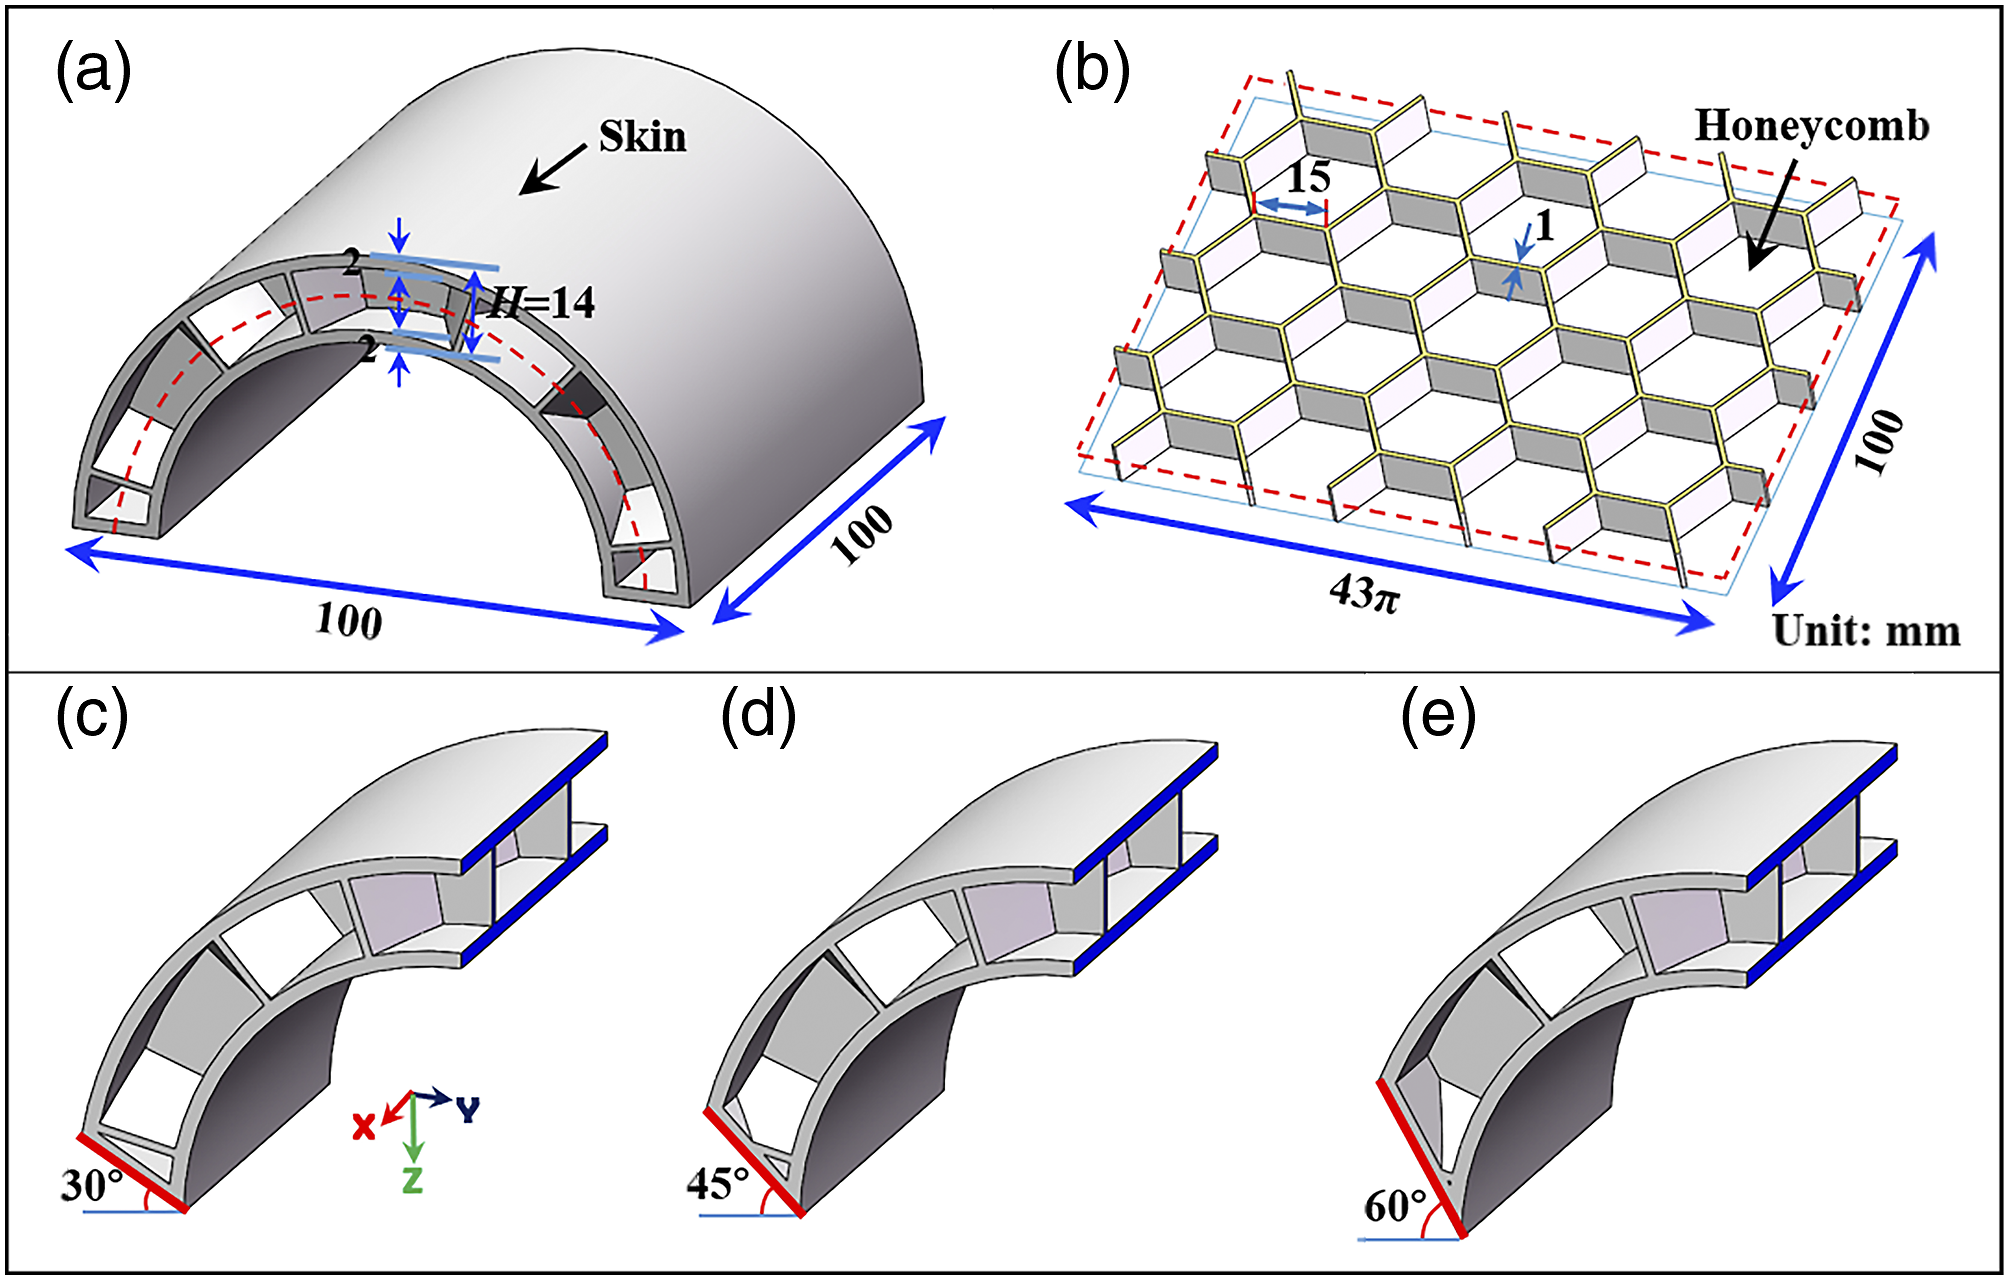
Finite element simulation method
For the two different clamping methods, each had four specimens of the aforementioned 0°, 30°, 45° and 60° models. Thus, there were eight analytical models in total. In view of the symmetry of the structure and constraints, only 1/4 of the structure was taken as the analytical object for each model. Figure 2(a) and (b) illustrates the mesh segmentation and constraints of the model. Considering the complex self-contact situation of this model in the crushing process, the sample was divided by the C3D10M
20
in ABAQUS v6.16 (Dassault SIMULIA, USA) to improve the accuracy. Unit size and wall thickness exhibited the same order of magnitude, and the number of degrees of freedom was approximately half a million (Figure 2). Moreover, taking the 0° model as an example, Figure 2(a) shows the case of a rigid upper platform that is slightly larger than the normal projection area of the specimen. Figure 2(b) takes the 60° model as an example and gives two different constraints: one is the sliding support constraint (Figure 2(b), upper right), and the other is the fixed support constraint at the foot (Figure 2(b), lower right). The material selected was aluminum alloy AlSi10Mg, with a density of 2.705 × 10³ kg·m−3. For mechanical properties, 3D printing technology (T320, BLT, China) was adopted to prepare aluminum strips (Figure 2(c), right),
21
and the stress–strain curve (Figure 2(c), solid line) and Poisson’s ratio of the material were measured using a UTM5105 electronic testing machine and a DH3818Y static resistance strain gauge. Then, it was determined that the elastic modulus of the material was 20.63 GPa, and the Poisson’s ratio was 0.33. After that, the stress–strain curve was simplified to a polyline by selecting several control points (Figure 2(c), dot-dash line) and converted into real stress and strain for numerical simulation. For loading, the upper platform was controlled to load only along the positive direction of axis Z (Figure 2(a)) with a total compression displacement of 10 mm, and the standard solver was used for calculation. Standard contact was adopted between the rigid part and the surface of the specimen and the specimen itself, and the friction coefficient was set to 0.15 according to the range given in the handbook.
22
FEM and its validation. (a) 0° model and rigid upper platform, (b) 60° model (illustration of the 1/4 model) and two types of constraints, (c) stress–strain curves of AlSi10Mg, (d) comparison of load–displacement curves obtained from the physical test and the FEM, where P1-P3 (blue circles) mark three pairs of key points, respectively, (e) comparison of deformation modes between the physical test and FEM at P1-P3. FEM: finite element method.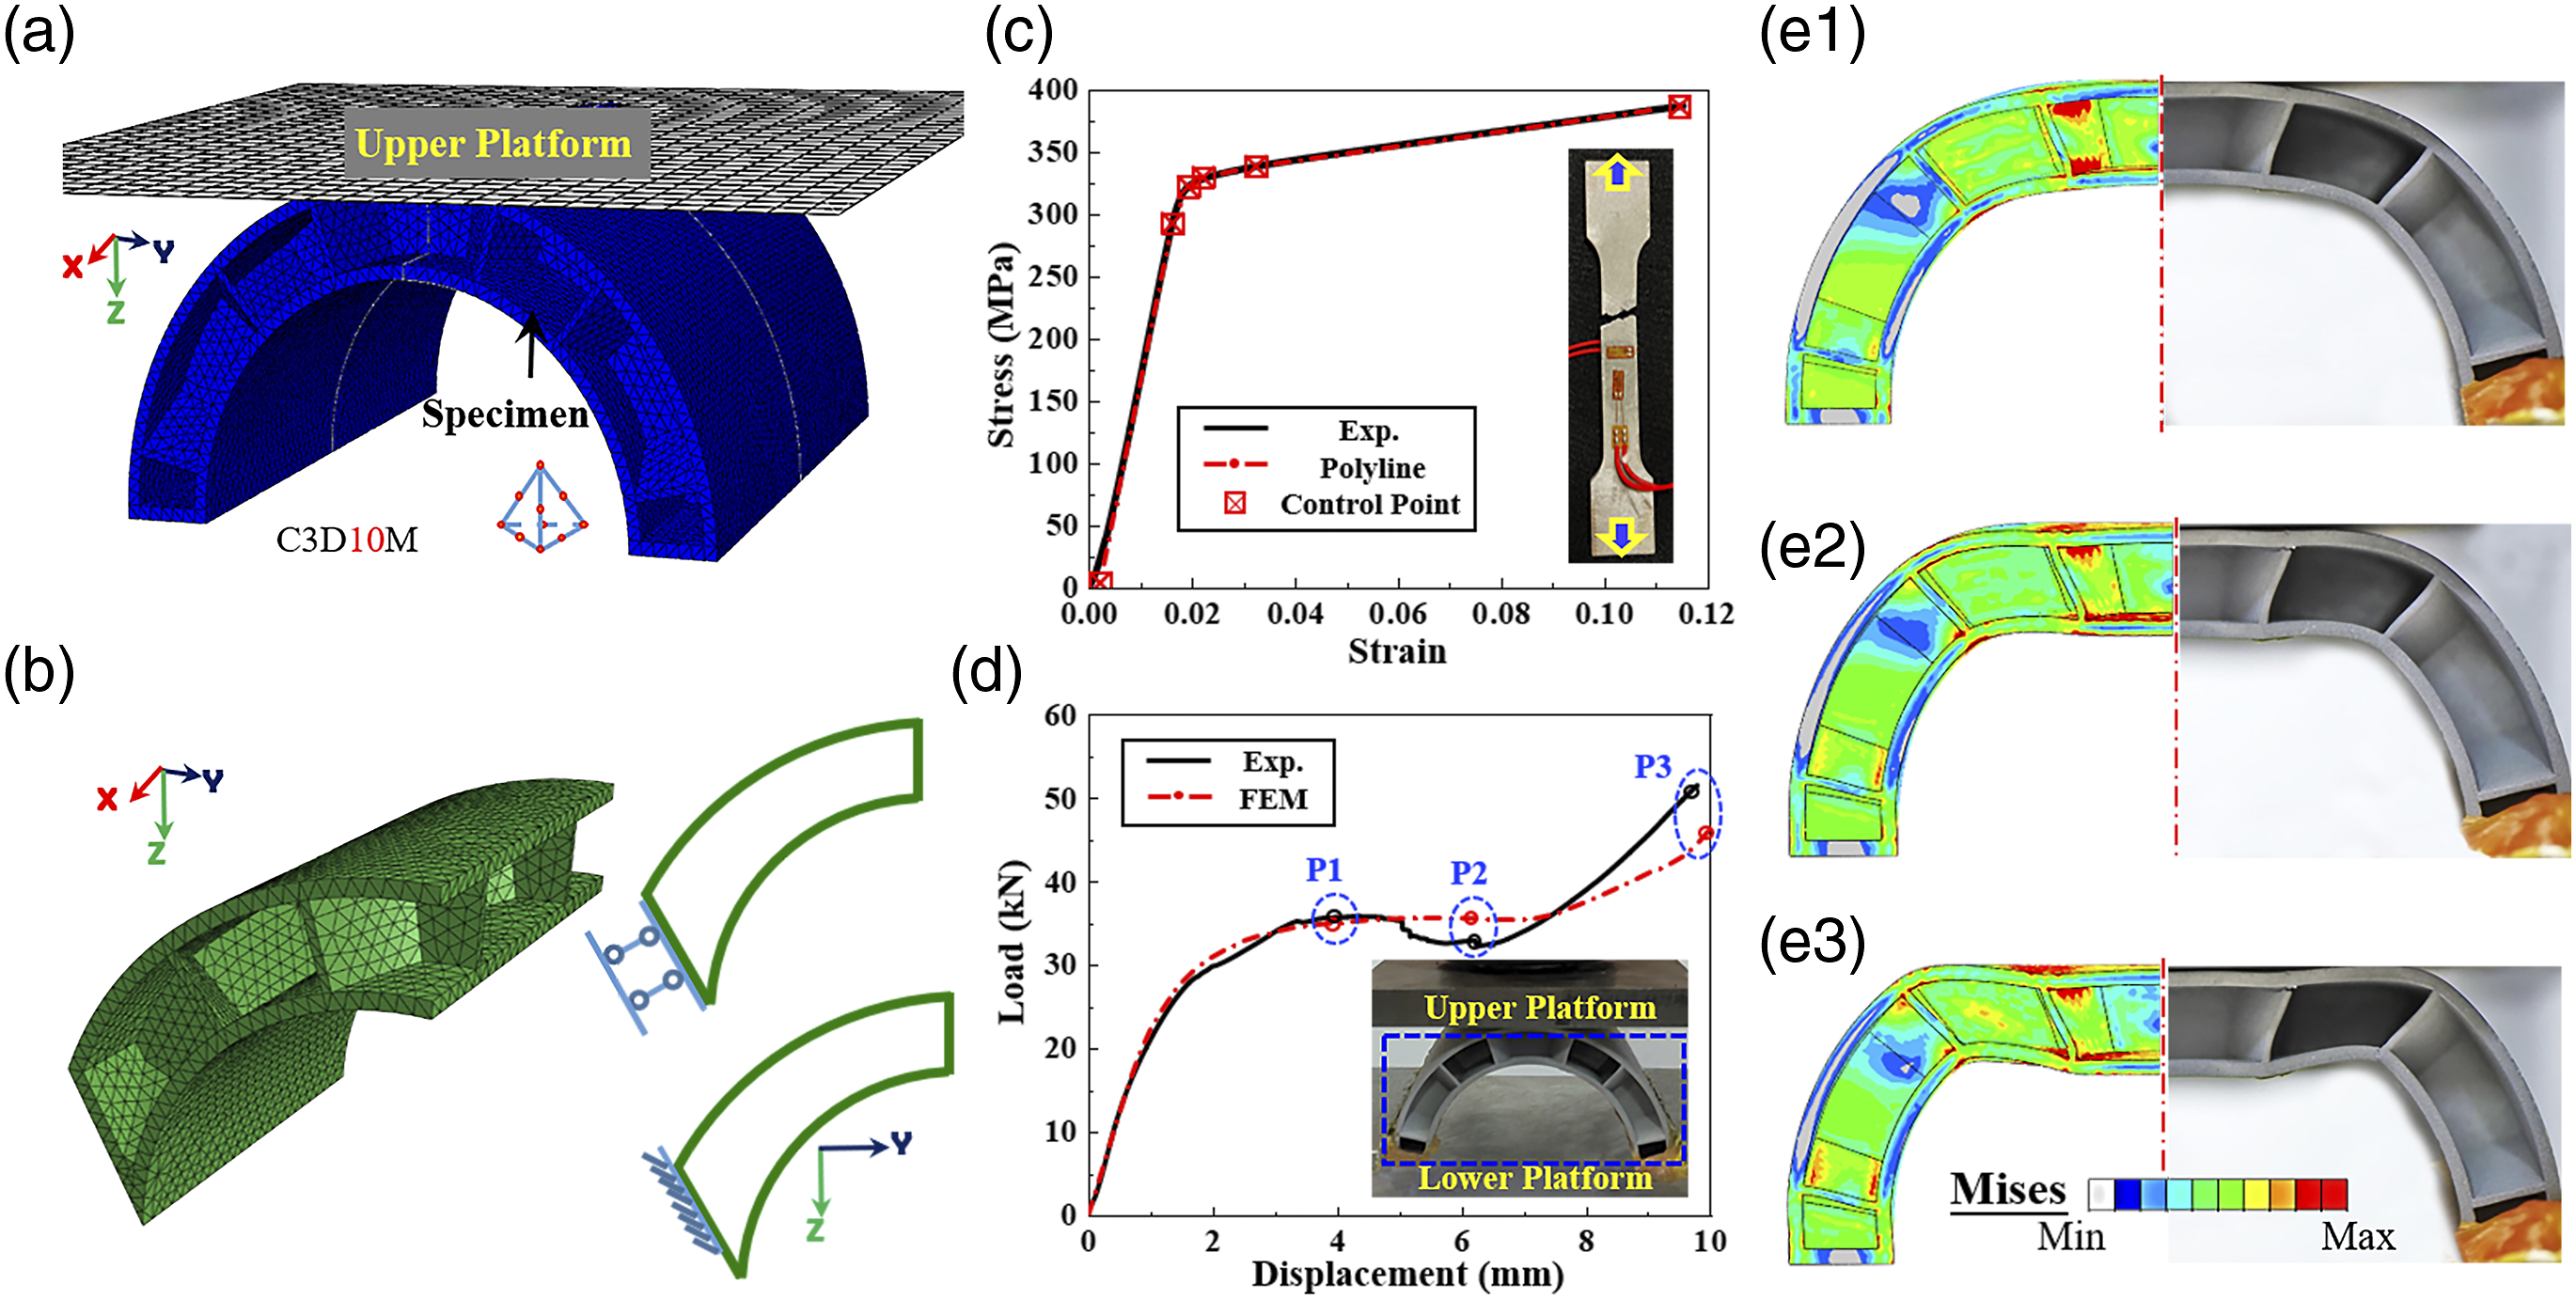
Validation of the finite element modeling
The aforementioned 0° fixed support model was selected, and the physical test of radial compression was carried out, the results of which were used for comparison with and validation of FEM. To ensure the consistency of material properties and processing accuracy, the specimen was made of the same metal powder as the strips for material property tests described in the section of Finite Element Simulation Method, and was 3D printed in the same batch. Before the test, the bottom surface of the specimen was polished with fine sandpaper and evenly spread with toughened acrylic structural adhesive (Araldite 2021-1, USA) to bond with the lower platform. And it was cured at room temperature for 7 days to obtain sufficient bond strength. Afterwards, as shown in Figure 2(d), lower right), the specimen was placed on a CMT5105 electronic testing machine for formal radial loading (the loading rate was 1 mm/min). Figure 2(d) also shows the load–displacement curves obtained from the physical test and the FEM. Regardless of the load value at each segment or the shape of the curve (slope of each segment, etc.), the results of the physical test and FEM are in great agreement, and the deviation is within the acceptable range of error. Additionally, three pairs of key points, P1-P3 (Figure 2(d), circles), were selected, and the corresponding deformation modes were given. As shown in Figure 2(e), due to the symmetry and for the convenience of comparison, the resulting pictures of the physical test and the FEM were taken in half and arranged symmetrically. At these key point pairs, their results show general agreement in details as the global deflection and local deformation. Therefore, the finite element modeling in this paper can be used in the following study of cylindrical honeycomb plates with different clamping methods.
Results and discussion
Mechanical properties and characteristics under radial compression with different clamping methods
This section examined the radial compression load–displacement curves with a sliding support and a fixed support (Figure 3(a) and (b), respectively), as well as the mechanical properties and characteristics presented by the specific capacity (SC) and specific energy absorption (SEA) (Figure 3(c) and (d)). Numerical simulation results. The left column (a, c) is the sliding support groups. The right column (b, d) is the fixed support groups. The upper row (a, b) is the load–displacement curve. The lower row (c, d) shows the SC and SEA. SC: specific capacity, SEA: specific energy absorbed. The peak bearing capacities are indicated by arrows.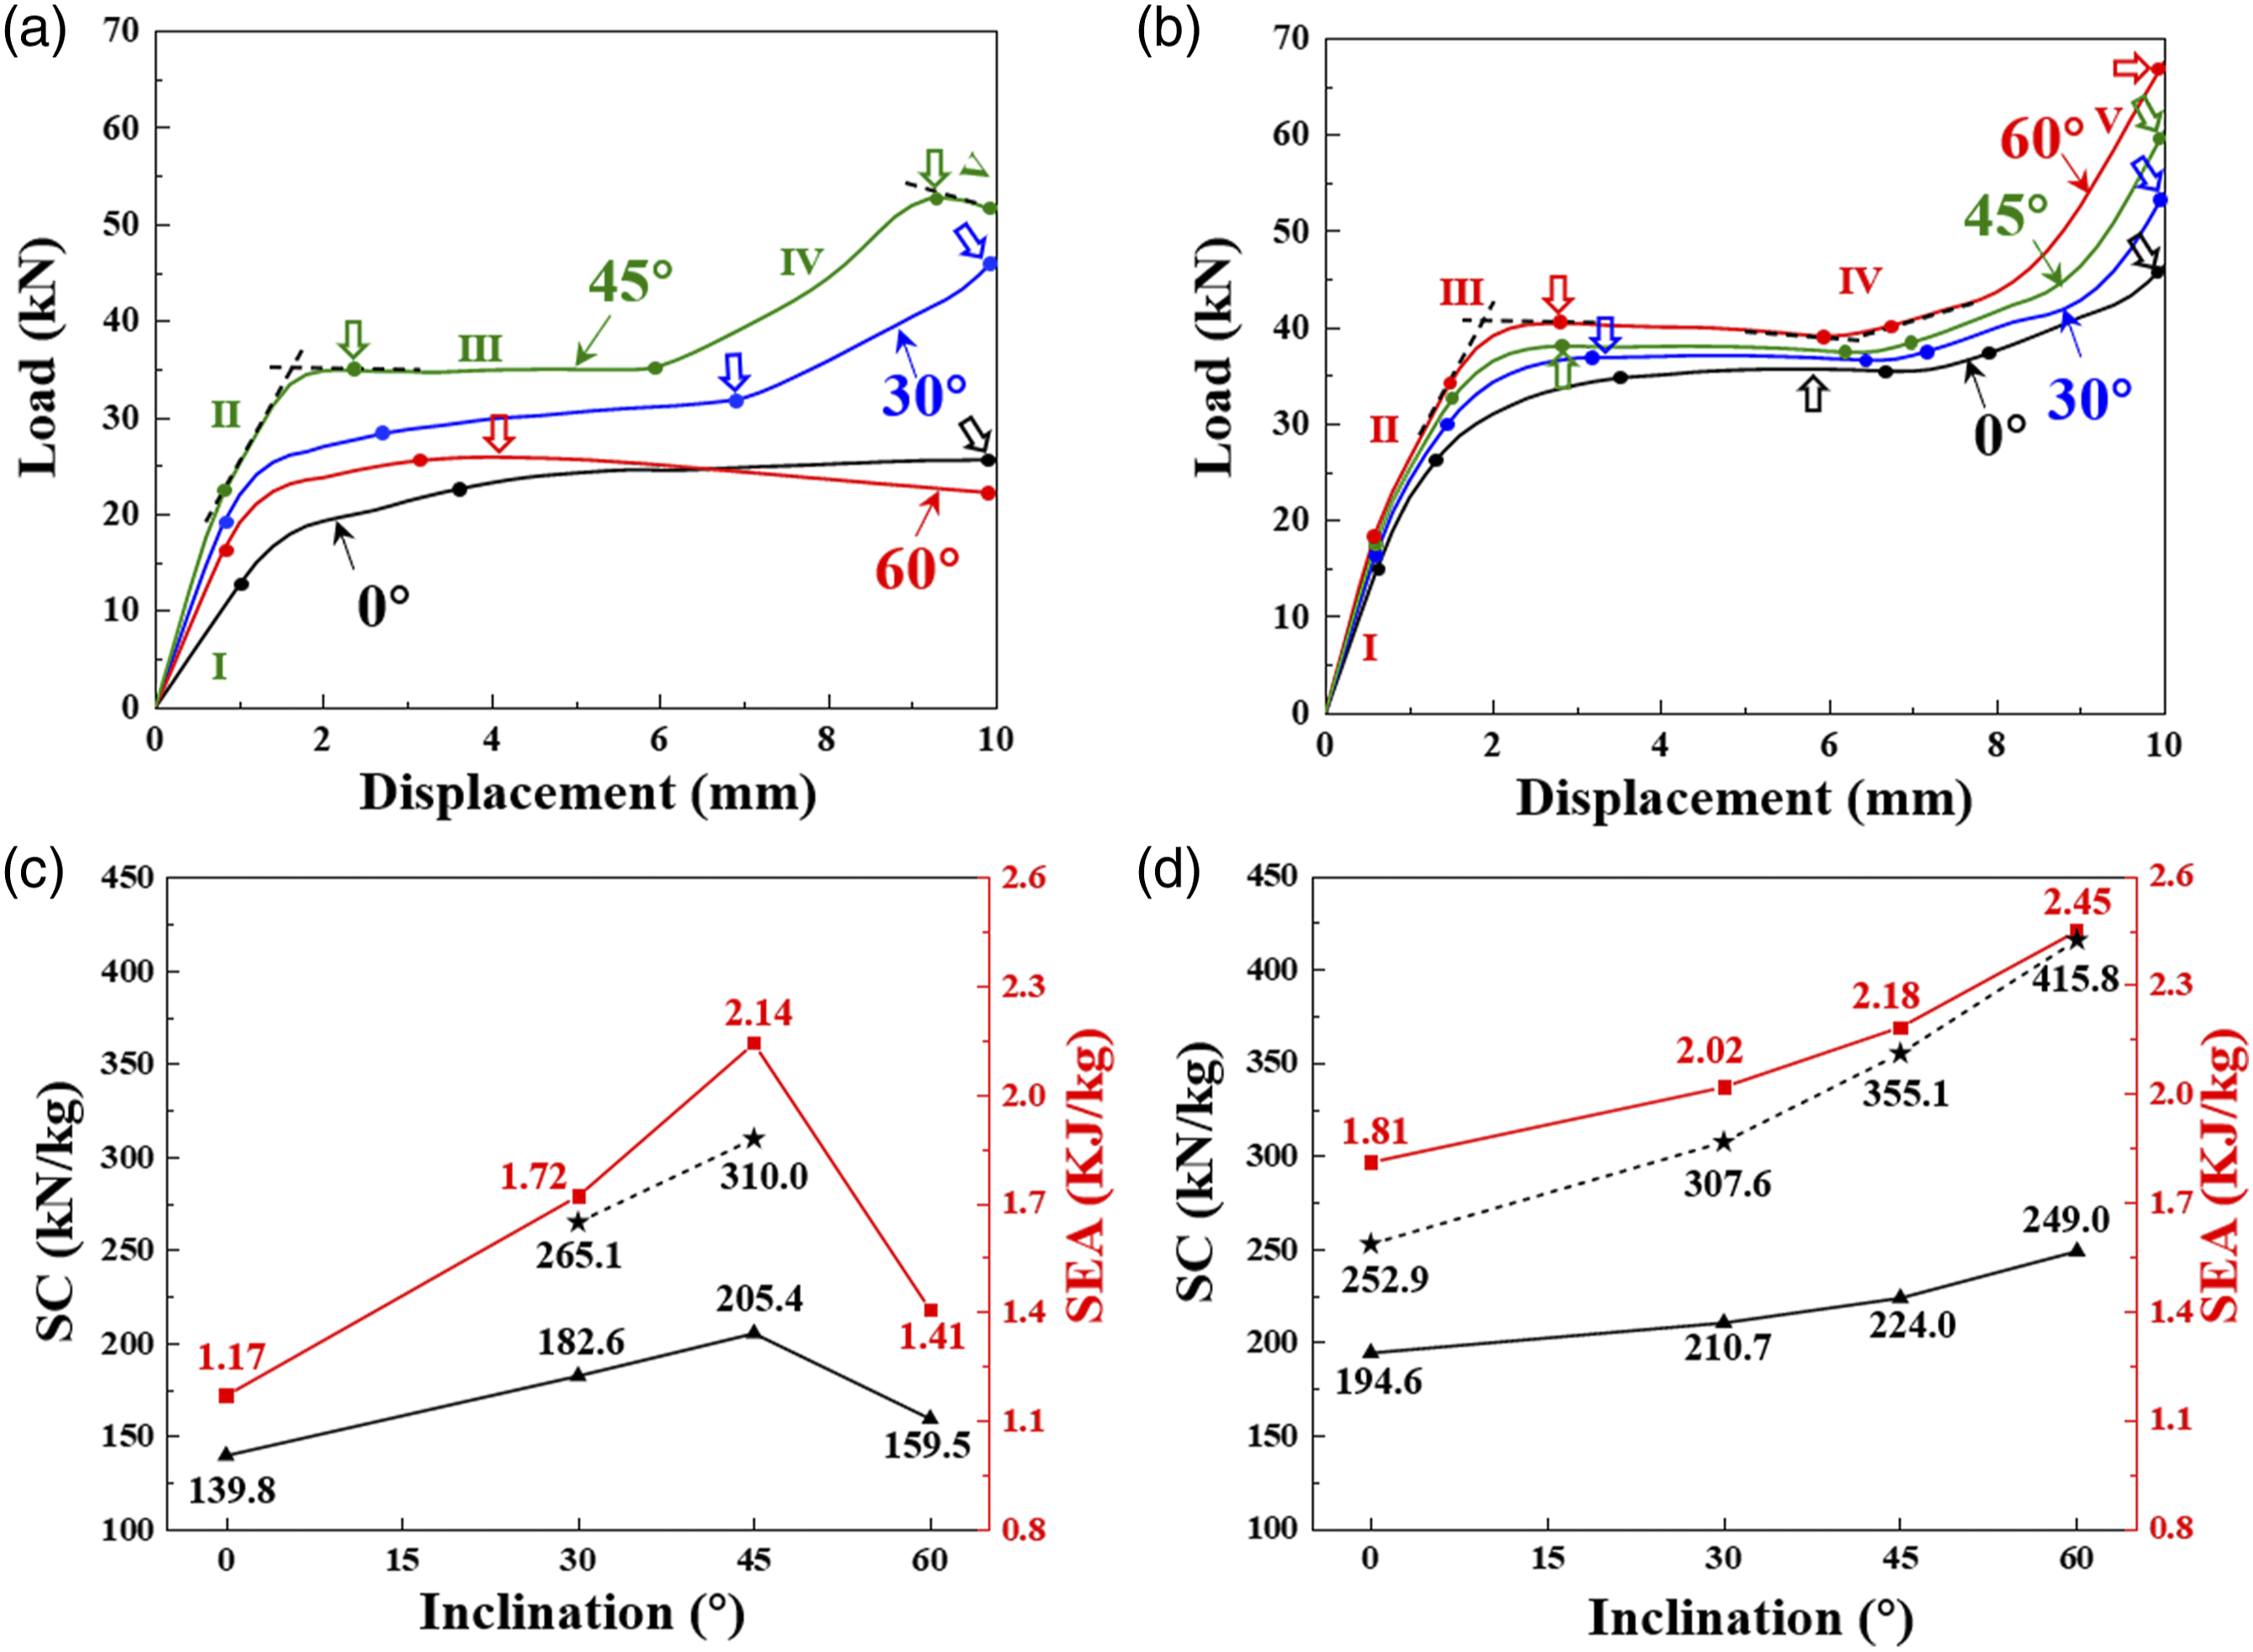
First, the differences between the four models in the sliding support and fixed support groups were analyzed. For the sliding support group, it can be seen from Figure 3(a) that the capacity of the 30° and 45° models was much greater than that of the 0° and 60° models, and there was a strengthening stage with a rapid rise and considerable increase in the later stage (the star indicates the highest SC point during a 10 mm displacement, which is recorded as the second peak). However, the curves of the 0° and 60° models changed slowly after the elastic stage, especially the 60° model, which dropped directly, showing an abnormal phenomenon. In terms of the SC and SEA index (Figure 3(c)), with increasing inclination, a parabolic change of 45° is observed (Figure 3(c)). Compared with the 0° model, its SC and SEA peak values (45° model) increased by 47% and 83%, respectively (Figure 3(c)). For the fixed support group, both the SC and SEA rose gradually with increasing inclination within the range of 0°–60°, and the trend was similar. Compared with the 0° model, the 60° model increased by approximately 28% and 35% respectively in the above two indexes (Figure 3(d)).
Second, the similarities and differences between the two clamping methods were compared. The similarities are as follows. As shown in Figure 3(a) and (b), the radial compression performance under the same clamping method was affected by different inclinations. The curve shapes of the 30° and 45° sliding support models were similar to that of the fixed support group, and both had obvious strengthening stages. Especially for the 30° models of two different constraints, there was almost no difference in the second peak in this stage. The differences are as follows. The compression performance of the fixed support models (Figure 3, the right column) was significantly better than that of the sliding support models (Figure 3, the left column), and the trends of the curves with different inclinations were much more similar (reflected in clusters, Figure 3(b)). Particularly, the second peak (Figure 3(c) and (d), dotted line) appeared in each model of the fixed support group and gradually increased with increasing inclination, while the sliding support group only had the second peak in the 30° and 45° models. Thus, the clamping method has a great influence on the curves.
The above analysis results show quite intriguing phenomena. The two types of clamping methods have a significant impact on the radial compression performance, and each has its own features. In combination with the compression deformation modes, the following will continue to conduct an in-depth analysis on the influence mechanisms of the mechanical properties.
Radial compression deformation modes and their internal influence mechanisms on the mechanical properties
This section discusses the internal mechanical response of the curved plate from the deformation modes of the radial compression process to clarify the influence mechanism of the two types of clamping methods on the mechanical properties.
Regarding the sliding support group, because there is no tangential displacement constraint at the foot, it is a geometric transient system. First, for the horizontally placed 0° model, since its support did not provide a horizontal reaction force, the foot always slid outward. So it had a simple deformation mode with the worst mechanical properties. With increased constrained inclination, the support produced a horizontal reaction force, consequently causing the diversity of the deformation modes and their respective mechanical characteristics with different inclinations. Specifically, from the perspective of the foot movement direction during the compression process, there were three sliding modes, always upward (Figure 4(a), 30° model), first upward and then downward (Figure 4(b), 45° model), and always downward (Figure 4(c), 60° model). Clearly, the aforementioned phenomenon of upward sliding (the whole process of the 30° model and the first stage of the 45° model) occurred because as the inclination increased, the horizontal reaction force provided by the boundary also increased. In this case, the structure exhibited excellent arch characteristics, that is, by moving upward through the foot to reduce the rise of the arch axis, the overall axis was close to the reasonable arch axis, and therefore, the effect of the bending moment on it was eliminated more effectively.
23
In contrast, the aforementioned phenomenon of sliding downward (the whole process of the 60° model and the second stage of the 45° model) was due to the excessive horizontal reaction force when the inclination increased to this extent, which further led to the large stress in the foot, as shown in Figure 4(b) and (c), (star), which in turn caused larger extrusion deformation (circle) and local damage from the outside to the inside. Thus, the models were forced to slide downward, and the arch axis was farther away from the reasonable arch axis as the capacity decreased accordingly. Therefore, it can be concluded that a higher capacity can be obtained by upward deformation, and a lower capacity can be reduced by downward deformation. This not only satisfactorily explains why the compression performance of the 30° and 45° models was much better than that of the 60° model and the existence of the strengthening stage but also reveals the reason why the capacity of the 45° model increased first and then decreased. Deformation modes of three sliding support models under radial compression. (a) 30° model, (b) 45° model, and (c) 60° model.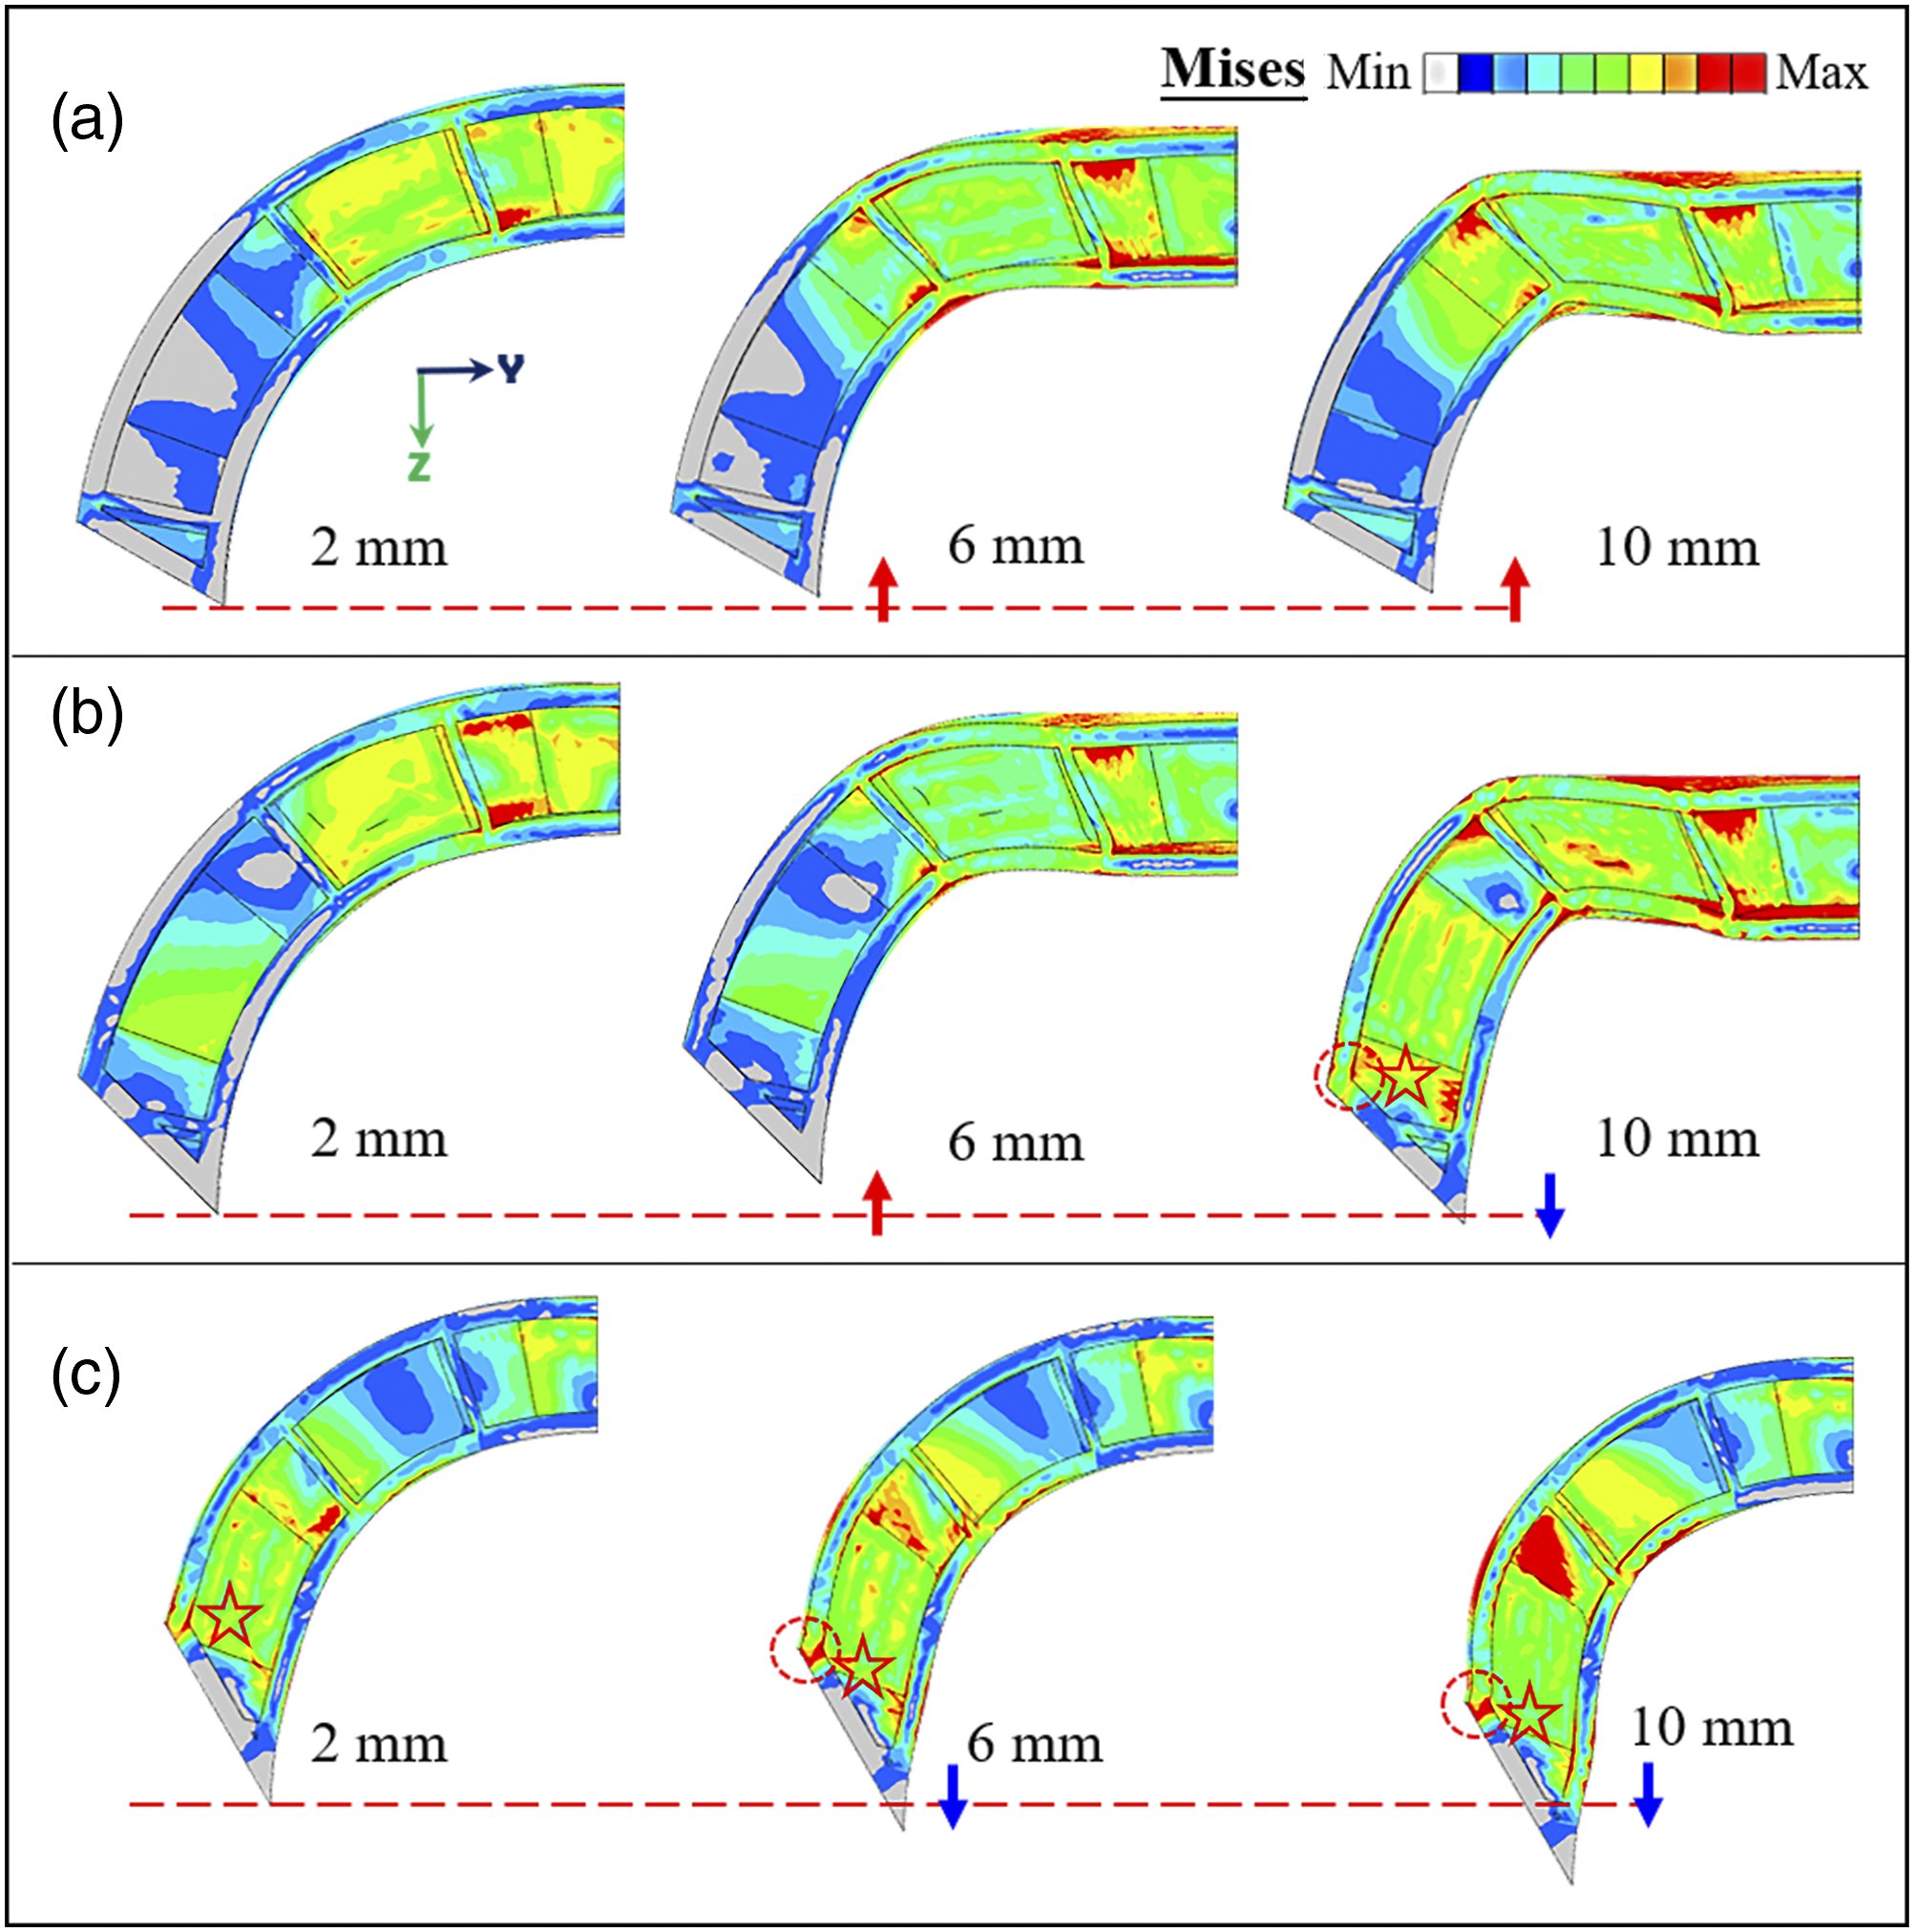
Second, for the fixed support group, because its tangential displacement was constrained, the reaction force it could provide increased with increasing inclination and could be allocated on demand. Even at a large inclination, it could also provide an outward horizontal force to protect the foot from the inward deformation trend, so the compression performance gradually increased with the increasing inclination.
It can be seen that the 30° and 45° models under the sliding support reached a reasonable state through the dynamic balance between the force and the reaction force of the support in the compression process, which achieved an effect similar to that of the fixed support group. Especially for the 30° sliding support model, whose foot kept sliding upward, and the displacement of which was small (Figure 4(a)). Its stress and deformation were less different from those of the 30° fixed support model, and its compression performance was more similar. The fixed support group belongs to the geometrically stable system due to its reliable constraints, which allocates horizontal reaction force on demand. Therefore, the deformation modes of the fixed support group were all always upward mode, and all exhibited a second peak. Thus, it has been well explained why the capacity of the fixed support group is significantly higher than that of the sliding support group.
Selections of the clamping method for curved plates under radial compression
On the basis of clarifying the radial compression performance phenomena and the mechanisms of fixed and sliding supports, several practical suggestions for choosing the clamping method within the range of inclinations set in this study when carrying out the corresponding experimental research are given in this section, because both types of supports are commonly used in engineering. (1) If the design of the sandwich plate structure is conservative (with a high safety factor), then the current and simplest 0° non-inclination sliding support clamping method is recommended. If it is necessary to ascertain the ultimate compression performance (not the ultimate strength), then a 60° inclination fixed support is recommended. (2) If the design is required to take advantage of the more compressive properties stored by the structure to be tested, or to optimize the structure and increase the material utilization rate (cost-effectiveness), then the 45° inclination sliding support, which is relatively easy to prepare, is recommended. The compression characteristics under this setting not only bring out the compression mechanical properties of the structure and material itself, but also have good representativeness. (3) If experimental research with specific constraints is being carried out, then it is recommended to refer to the research results in this paper and select a suitable clamping method. (4) If there is no specific target and high accuracy requirements, then constraint methods of the 0°, 45° and 30° sliding support can be selected first due to their ease of manufacture. Although when using the 30° or 45° sliding support instead of the fixed support, the experimental results are smaller than the actual value, it is a safe and conservative method. At the same time, it is a comprehensive and convenient way to understand the compression performance of the structure.
Conclusions
In this paper, the test methods of radial compression of an aluminum cylindrical honeycomb plate (CHP), which was characterized by two kinds of clamping methods with changeable inclinations, that is, fixed support and sliding support, are investigated and verified, and the internal influence mechanism is revealed.
Therefore, this paper explores the optimal curvature surface under different clamping inclinations for the testing of curved plates of various curvatures. In addition, it has a positive influence on determining the appropriate test method for radial compression of curved plates, including the formulation of corresponding test method standards and the conduct of academic research on curved plate structures in the future.
Footnotes
Declaration of conflicting interests
The author(s) declared no potential conflicts of interest with respect to the research, authorship, and/or publication of this article.
Funding
The author(s) disclosed receipt of the following financial support for the research, authorship, and/or publication of this article: This work was supported by the National Natural Science Foundation of China [Grant No. 51875102].