
Abstract
Variable stiffness Carbon/Carbon (C/C) honeycomb can be designed to exhibit varying stiffness based on the structural load gradient, facilitating a high degree of alignment between structural performance and function. The elimination of mass redundancy and achievement of extreme light-weighting confer promising applications in the aerospace sector. However, the universal preparation approach for variable stiffness honeycomb faces challenges related to material mass redundancy and susceptibility to cracking at the bonds. Consequently, addressing the integrated forming issues associated with variable stiffness honeycomb becomes urgent. In this study, firstly, the conventional honeycomb densification method and the CVI domain-limited reactor design approach for integrated forming of variable-stiffness honeycombs are discussed. Subsequently, a multi-physics field coupling model for C/C honeycomb forming is developed, and its accuracy is validated through honeycomb forming experiments. The influence of three key process parameters, gas residence time, temperature, and pressure, on the quality of honeycomb forming were explored. Following the influence laws, the study applies specific process parameters to the three distinct regions of the reactor. Through this meticulously regulated process, the final variable stiffness honeycomb attains a 17.6 % reduction in weight compared to a constant density honeycomb of the same volume.
Introduction
The implementation of a lighter airframe design enhances both the combat radius and maneuverability of fighter aircraft, essential for long-range air strikes, providing improved offensive and defensive capabilities.1–4 Therefore, in the field of aviation, research focuses primarily on achieving lightweight and high-strength aerospace materials.5,6 The pursuit of lightweight structures stands as a pivotal factor in enhancing the range and offensive as well as defensive capabilities of combat aircraft.7,8 Carbon fiber composites have emerged as extensively applied materials in aircraft manufacturing, owing to their exceptional mechanical and thermal properties.9–12 Honeycomb sandwich structures, inspired by natural honeycombs, are extensively employed as Lightweight load-bearing structure across diverse fields. In the aerospace field, it is often used on structures such as high-precision astronomical telescope tubes and satellite carrying platforms. For example, the European Space Agency’s GOCE (Gravity field and steady state Ocean Circulation Explorer) satellite, launched in 2007, made history as the world’s first satellite to utilize gravity gradient measurements. It employed a sophisticated Carbon/Carbon (C/C) honeycomb sandwich structure to support its primary payload, the gravity gradiometer.13–15 In the aviation sector, C/C honeycomb structures, illustrated in Figure 1(a) and (b), have gained popularity for their notable attributes, including high strength, excellent thermal properties, design flexibility, and lightweight characteristics. These features make C/C honeycomb structures suitable for enhancing various components of aircraft, such as nacelles and wings, thereby contributing significantly to aircraft advancement. Moreover, as depicted in Figure 1(f), the load distribution on the wing typically exhibits an ascending trend from the end to the root over the airplane’s service life. Consequently, achieving an optimal balance between extreme light-weight design and fulfilling the mechanical properties gradient from root to end is essential. This requires the design of a honeycomb structure that aligns with the load gradient distribution of the wing through variable stiffness forming. Such an approach ensures that the wing meets its service performance requirements without unnecessary mass redundancy. Variable Density C/C Honeycomb. (a) and (b) Application Scenarios in military aviation. (c) Variable density C/C honeycomb schematic. (d) Honeycomb structures in nature. (e) Schematic diagram of honeycomb sandwich structure. (f) Schematic sketch of wing forces.
To date, numerous scholars have conducted extensive research on structures like variable stiffness honeycombs. Cheng et al. 16 introduced an innovative approach by designing a 3D printed continuous ramie fiber reinforced variable stiffness composite honeycomb structure. The variable designability of honeycomb stiffness was achieved through the printing of distinct cell structures of varying sizes. In a similar vein, Squibb et al. 17 utilized the wall pinch angle of hexagonal honeycombs and the fiber volume fraction of the wall as design variables. They employed a genetic optimization algorithm to realize variable stiffness in the honeycomb structure. Different honeycombs with varying wall pinch angles and fiber volume fractions were interconnected through bonding. The approach to achieving variable stiffness in honeycombs involves assembling cellular elements with distinct binding parameters through bonding and mechanical connections. However, honeycomb structures prepared using such methods are susceptible to issues like structural cracking and debonding during the preparation process, compromising their overall structural reliability.
C/C honeycomb structures are predominantly fabricated using the chemical vapor infiltration (CVI) process. 18 Various deposition process parameters play a crucial role in determining the quality of honeycomb fabrication during this process. Inappropriate parameter settings can result in uneven density distribution within the honeycomb structure, leading to inhomogeneity in mechanical properties. This, at the same time, can cause deformation, cracking, and adversely impact the formability of the honeycomb product.19,20 Numerous researchers have investigated the densification of C/C structures concerning CVI process parameters. Gong et al. 21 enhanced the microstructure of C/C composites by incorporating carbon nanotubes, resulting in a characteristic smooth laminar flow-type coke and an overall improvement in composite quality. Luo et al. 22 applied a fast directional diffusion CVI process to densify four distinct 2D preforms, subsequently comparing the mechanical properties of C/C composites produced from these varied preforms. The findings indicate that samples prepared using 1 K plain carbon cloth exhibit a uniform microstructure. Huang et al. 23 explored the impact of varying propane gas concentrations on both deposited carbon and the fractions of resulting product gases. Their findings revealed an increase in methane proportion and a decrease in ethylene as the concentration of propane rose.
Ge et al. 24 introduced a novel numerical model designed to accurately forecast the effective elastic properties of anisotropic C/C composites via simulation methods. In a separate study, Luo et al. 25 delved into the influence of high-temperature treatment on the friction properties of 2D C/C composites during CVI. Their results indicated that adjusting the brake discs’ structure, specific pressure, and employing heat treatment could enhance the composites’ friction properties. Furthermore, Li et al. 26 established a CVI process parameter optimization model using a genetic algorithm. They meticulously analyzed the role played by various process parameters, such as residence time, temperature, and pressure, on the density and uniformity of density distribution in C/C composites. This analysis was based on experimental results serving as samples in their study. In summary, the investigation into the preparation of thin-walled C/C structures has predominantly centered on refining the product quality of thin-walled CVI molding. This is achieved through the control of individual parameters or by altering factors such as the fiber volume fraction of the preform and the weaving method. Notably, the exploration of preparing C/C honeycombs with variable stiffness through innovative methods of designing domain-limited reactors has not yet been found.
Variable stiffness honeycombs represent a constrained strategy for achieving remarkable light-weighting and expanding the operational capabilities, including range and strike radius, of fighter aircraft. Variable stiffness honeycomb prepared by conventional methods suffers from problems such as susceptibility to cracking at the bond and redundant quality at the joint. This will lead to problems such as structural failure and damage during service. To tackle the challenges mentioned earlier, this study introduces a pioneering integrated strategy for forming C/C honeycombs, employing a partitioned domain-limited reactor. In this study, we initially elucidate the preparation process for the C/C honeycomb preform and the honeycomb structure, alongside detailing the design scheme for a domain-limited CVI reactor tailored for variable stiffness honeycombs. Subsequently, we establish a multi-physics field coupling model for the CVI process and validate its accuracy through densification experiments on the C/C honeycomb structure. Following this, we delve into the investigation of the impacts of three key process parameters, residence time, temperature, and pressure, on the quality and efficiency of honeycomb formation through numerical simulations. Finally, leveraging insights gained from these investigations, we apply appropriate process parameters to different regions of the domain-limited CVI reactor, thereby realizing the integrated formation of variable stiffness honeycomb structures.
Material preparation and experimentation
Preparation of C/C honeycomb
Figure 2(a) illustrates the C/C honeycomb CVI process. In this process, precursor methane is introduced through the lower end of the reactor, with hydrogen serving as a dilution gas. The reactor’s pressure was meticulously regulated by a vacuum pump to establish the requisite pressure environment for the chemical reactions within. Simultaneously, a zonal heating system was employed to raise the reactor’s temperature, ensuring an optimal environment for the chemical reactions to take place. At the conclusion of the reaction, the gas overflowed and was subsequently recovered through the upper-end outlet. In Figure 2(a), the arrows denoted the direction of the gas flow. Notably, aside from the gas circulating around the honeycomb, a substantial volume of gas also traversed through the core of the honeycomb. Schematic diagram of C/C honeycomb preparation by CVI process. (a) Conventional preparation methods. (b) Variable stiffness honeycomb preparation methods.
Throughout the CVI deposition process, the honeycomb necessitated immobilization around the graphite core mold, as illustrated in Figure 2(a). The side length and thickness of the honeycomb structure were represented by the letter “h” and “t,” respectively. In this study, the prepared honeycomb boasts a thickness of 0.4 mm and a side length of 5 mm. The carbon fiber preform for the honeycomb core was prepared using a continuous carbon fiber fabric (T300-3K, Nanjing Fiberglass Research & Design Institute CO., LTD.).
Integrated forming strategy for variable stiffness honeycomb
Previous studies by our team have shown that C/C honeycombs with different densities have different mechanical properties. The mechanical properties of honeycomb are positively correlated with the density of honeycomb.18,27,28 Therefore, there is a factual basis for targeting density for variable stiffness C/C honeycomb preparation in this study. The attainment of a variable stiffness C/C honeycomb structure is realized through the innovative design of a unique CVI domain-limited reactor, as depicted in Figure 2(b). The interior of this reactor is strategically partitioned into three independent domains, each outfitted with discrete inlets, outlets, and heating layers. This distinctive design affords the provision of diverse reaction conditions, encompassing disparate reaction temperatures, pressures, and gas residence times within the CVI domain-limited reactor.
The diverse CVI process parameters exert distinct influences on the densification efficiency and density distribution of the C/C honeycomb. Consequently, by judiciously adjusting these process parameters in specific regions, targeted portions of the honeycomb can attain the desired level of densification. This strategic approach facilitates the integrated formation of C/C honeycombs endowed with variable stiffness.
Models
Chemical reaction model
In the CVI process, chemical reactions can be categorized into two main types: gas-phase chemical reactions taking place within the free domains and surficial chemical reactions occurring in the fabric. Within the free domain of the reactor and the core of the honeycomb, methane undergoes a series of chain chemical cracking reactions, leading to the production of ethylene, acetylene, benzene, and hydrogen. These particular reactions are commonly recognized as gas-phase chemical reactions.24–26 Within the fabric cloth of the honeycomb, the products resulting from gas-phase chemical reactions undergo surficial reactions. Figure 3 elucidates the chemical reaction mechanism of the CVI process. In the course of surficial reactions, organic gases release hydrogen, facilitating the deposition of carbon into the porous medium of the honeycomb wall, thereby forming the matrix. Schematic diagram of chemical reactions of CVI process.
The chemical reaction can be expressed by Arrhenius equation as
17

During the surficial reaction, the presence of hydrogen exerts an inhibitory effect on this process, necessitating the incorporation of a hydrogen inhibition factor. The expression for the hydrogen suppression factor is formulated as described in previous research.
29
The chemical reaction rates and hydrogen inhibition factor for the surficial reactions are detailed in reference 20,29. The carbon fiber fabric comprising the honeycomb wall serves as a porous medium, and throughout the densification process, its specific surface area undergoes changes in tandem with porosity as
29
Gas flow model
In the gas flow region, the fluid flow satisfies the Navier-Stokes equation and the continuity equation, expressed as


In the area of honeycomb preform, the flow of the fluid satisfies the Navier-Stokes equations for porous media as
30

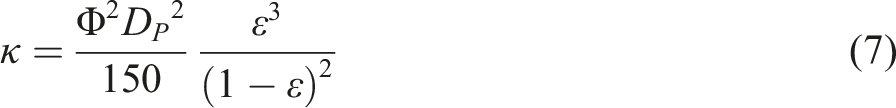
The permeability is related to the porosity, the geometry of the pores and the size of the particles. It can be described as
31
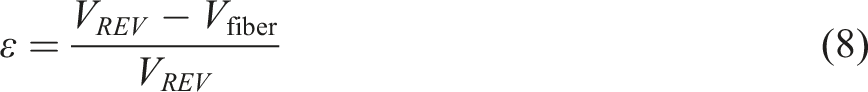
The porosity ε on the honeycomb preform is expressed as
32
The continuity equation in the region of the honeycomb preform is expressed as follows


Diffusion models
Inside the reactor, gas flow is accompanied by gas diffusion. Diffusion of gases satisfies Fick’s law as
30

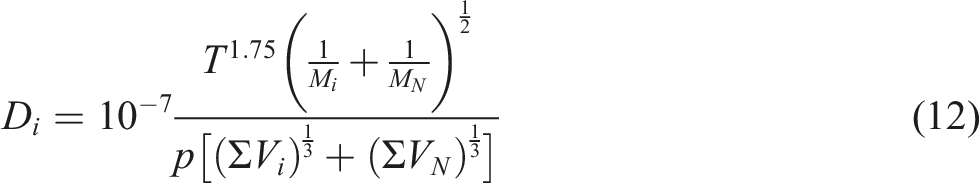
Gas diffusion in the free region within the reactor satisfies Fick’s law, which is expressed in terms of diffusion coefficients as
33
In the fabric, the gas diffusion satisfies Knudsen diffusion and can be expressed as
34
The rate of concentration changes in chemical reactions are given in reference 20,34. Within the honeycomb preform, porosity undergoes continuous alterations during the densification process. The diffusion coefficient within the preform also experiences variations and can be expressed as.
33

Densification modeling of honeycomb preform
As the surficial reaction progresses, the density of the honeycomb preform undergoes changes as.
35
The variation law of porosity with time can be expressed as
The equivalent density of ortho-hexagonal honeycomb structure is calculated as
Quantification of honeycomb forming quality
The density values of the simulated honeycomb structure are presented in terms of the average density as
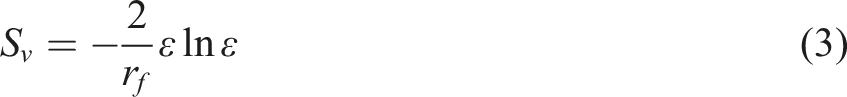
The uniformity of the density distribution within the simulated honeycomb structure is characterized by the density’s standard deviation as.
During the CVI densification process, the inhomogeneity of the deposition density distribution escalates with rising density, a phenomenon that is inevitable. Consequently, the assessment index β is defined as the increase in the standard deviation of the density distribution per unit density increment, serving as a metric to evaluate the efficacy of the CVI process parameter.
The assessment of the pros and cons of honeycomb structure densification primarily relies on three key indices,
Initial and boundary conditions
The initial porosity of the honeycomb preform used is 50% and the initial density of honeycomb preform is 1.8 g/cm3. The equivalent initial density of the honeycomb can be calculated to be 0.11 g/cm3. Different flow rates of gas are given at the inlet end as boundary conditions for different reaction pressures. Heat sources of different temperatures are given in the zone of heating to provide different reaction temperatures for the reactor. A schematic diagram of the boundary and initial conditions of the CVI process is given in Figure 4. Schematic diagram of initial and boundary conditions.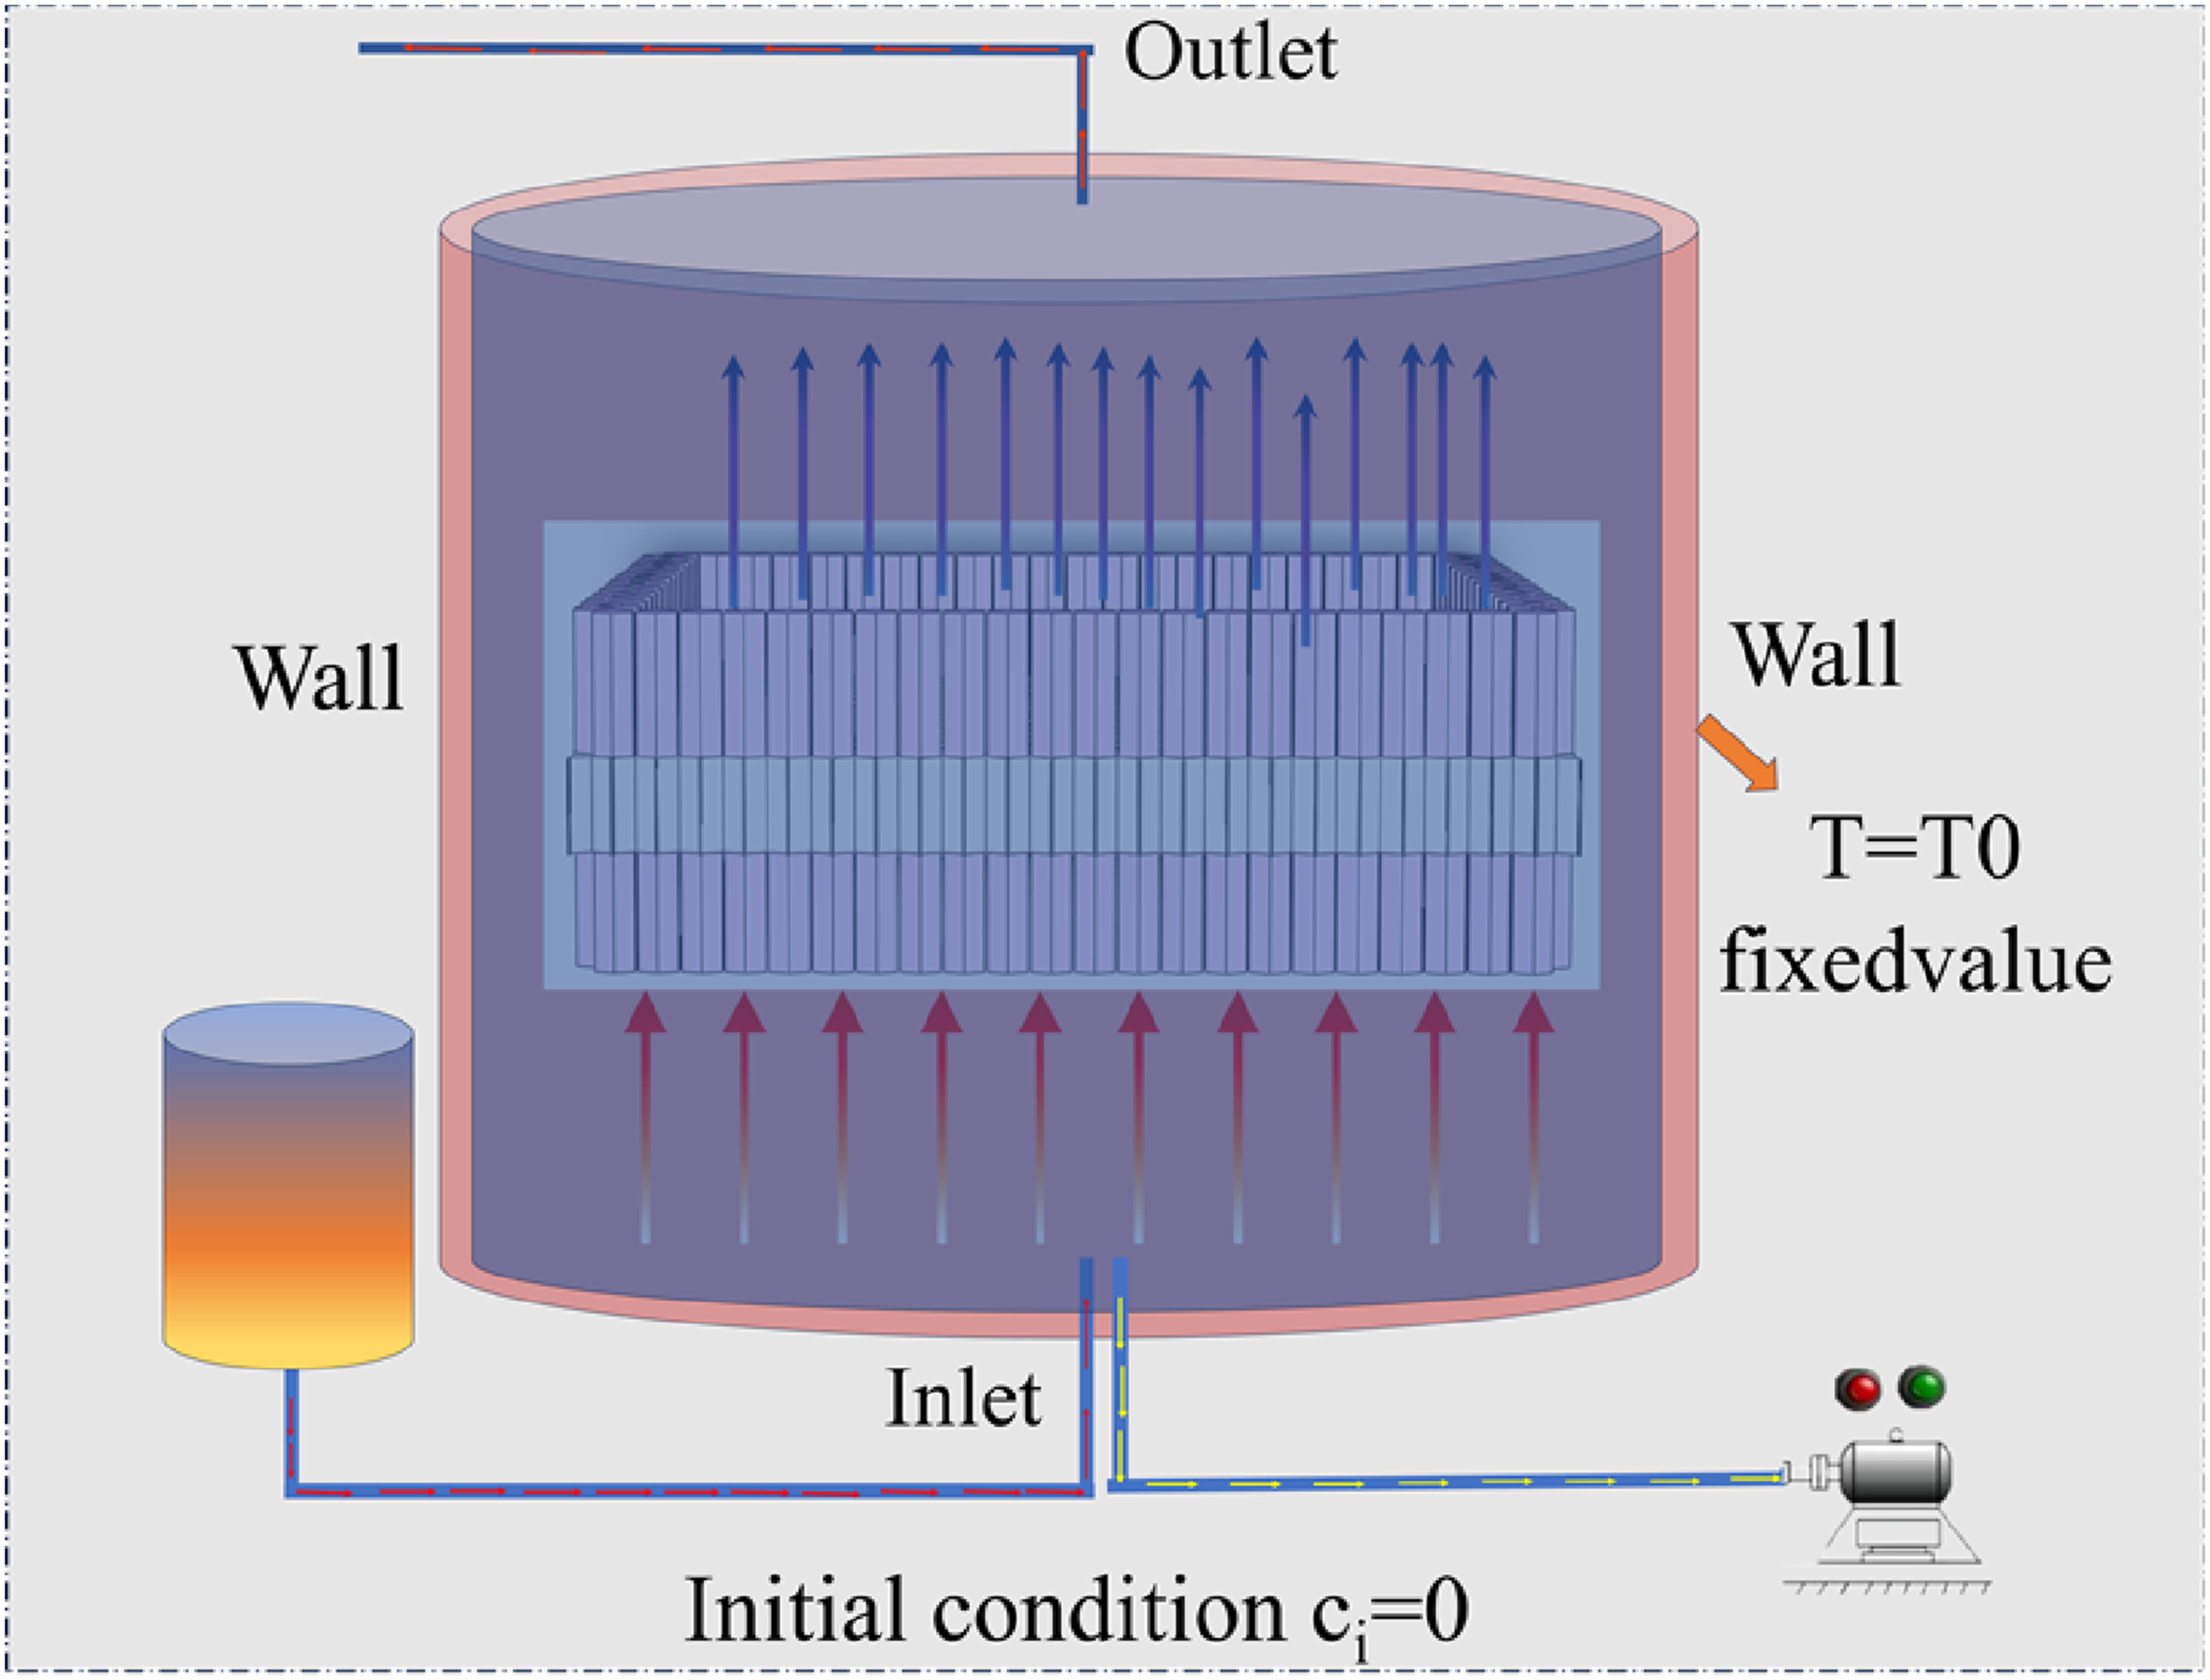
Validation
Determination of the size of the limit field
This research was conducted via numerical simulation using COMSOL Multiphysics finite element software to analyze C/C honeycomb by Chemical Vapor Infiltration (CVI). Three distinct modules were employed: laminar flow (spf), transfer of dilute substance (tds), and domain ordinary. In the course of numerical simulation, the choice of the size of the limit field surrounding the honeycomb significantly impacts the densification process. An excessively large limit field escalates computational costs and may lead to inefficiencies, whereas a limit field that is too small deviates from the actual project, resulting in substantial disparities between simulation and real-world outcomes.
As depicted in Figure 4(e), the gas ingress into the reactor occurs via the lower section, ascending along the limit field surrounding and within the honeycomb structure. Eventually, it exits from the upper end. Throughout this process, complex gas-phase and surface reactions take place, facilitating the densification of the C/C honeycomb.
Figure 4(a)–(d) illustrates the gas flow velocity distribution in the reactor for various thicknesses of the limit field. The velocity distribution tends to stabilize progressively as the limit field thickness increases from 10 mm to 20 mm, 30 mm, and 40 mm. With increasing thickness, the disparity in velocity distribution around the honeycomb preform in the reactor becomes more uniform. The maximum gas flow velocity reaches 50 × 10−3 m/s for thicknesses of 10 mm, 20 mm, and 30 mm. Upon reaching a 40 mm thickness for the limit field, the maximum gas flow velocity measures 40 × 10−3 m/s, while the minimum flow velocity around the preform registers at 30 × 10−3 m/s. The marginal difference between the maximum and minimum values is negligible. Consequently, the impact of this disparity on density inhomogeneity is minimal and can be disregarded. Thus, in numerical simulations for honeycomb densification, setting the thickness of the free limit field at 40 mm is appropriate.
In prior investigations, the influence of reactor length on thermal structure deposition was examined, leading to the determination that the optimal reactor length is 3.4 times the thermal structure length. 20 Consequently, a reactor length of 260 mm was employed in this study to ensure comprehensive gas development throughout the reactor’s length.
Mesh sensitivity analysis
The mesh size has a significant impact on the results of finite element simulations. Here the effect of different mesh sizes on CVI simulation results is analyzed to determine the optimum mesh size. A mesh size that is too large will affect the accuracy of the calculation, and a mesh that is too small will affect the efficiency of the calculation. The computational convergence plots and the quality of the grid distribution for different numbers of horizontal grids are given in Figure 5. In order to take into account the computational efficiency and reduce the dependence of the results on the mesh, the mesh type used in this study is a tetrahedral mesh with 959,039 mesh cells and an average cell quality of 0.4935. Mesh sensitivity analysis diagram.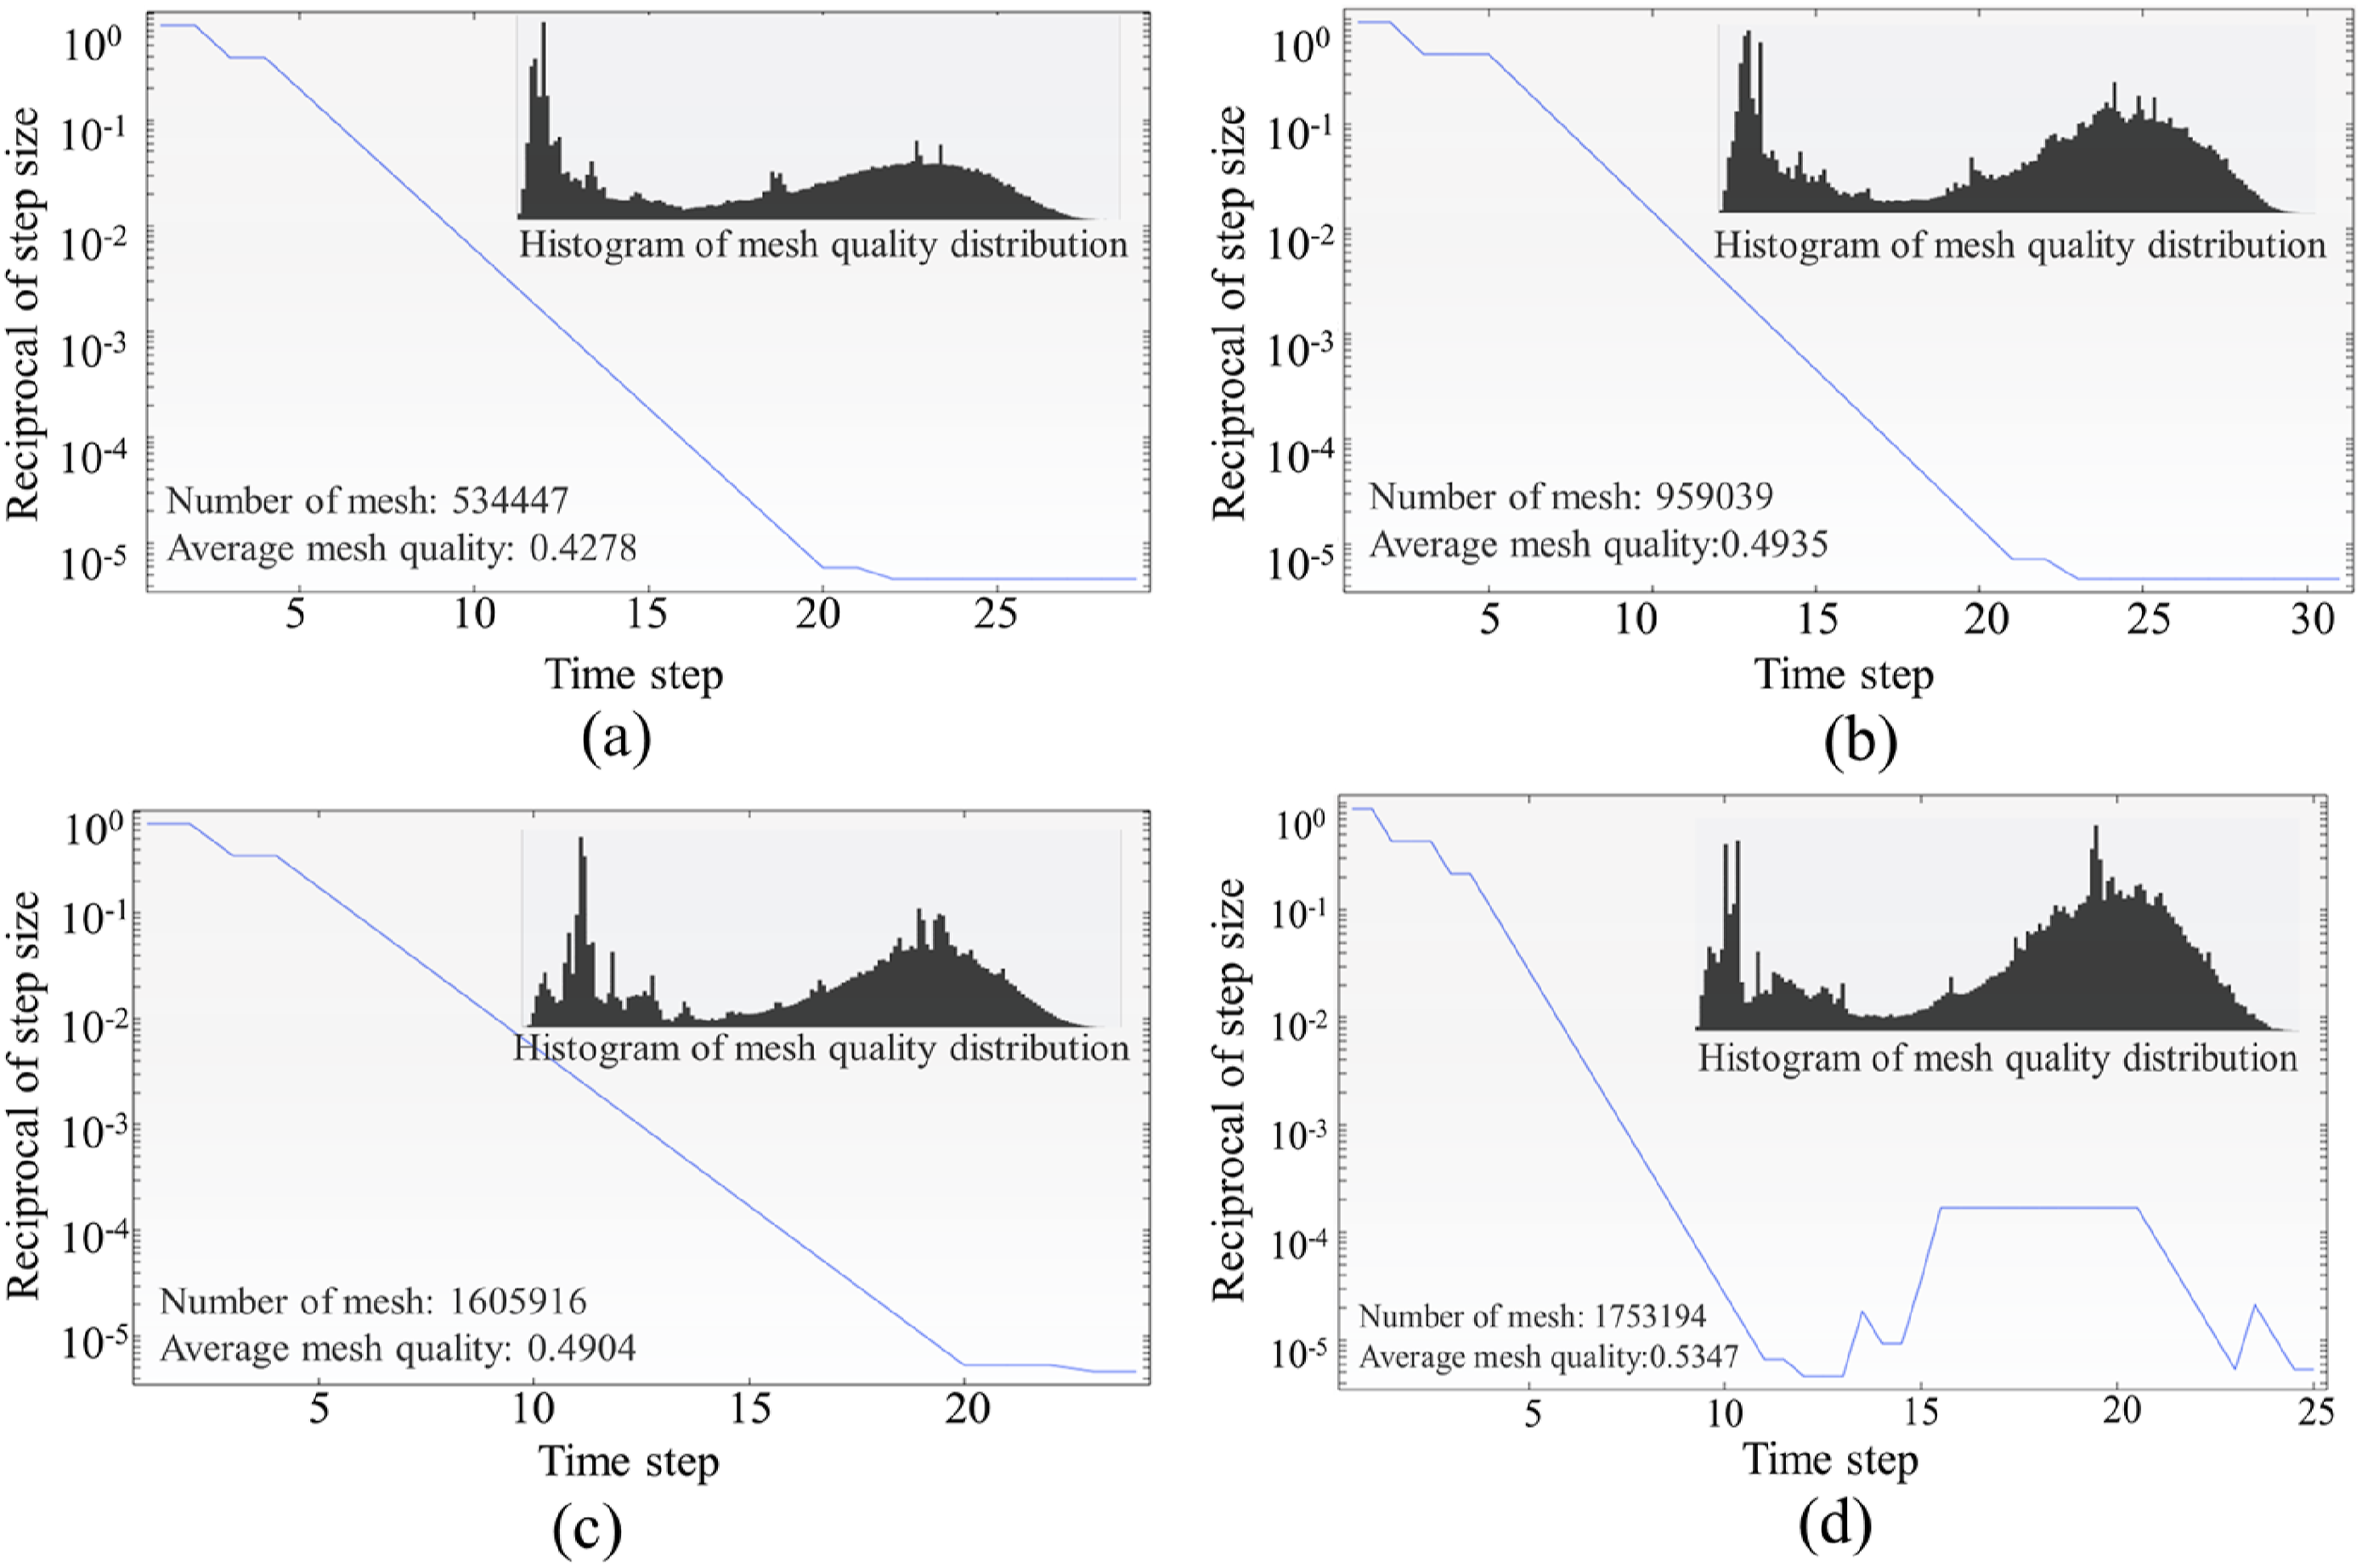
Validation of model
A simulation model mirroring the experimental conditions outlined in Chapter 2 is formulated to simulate the density progression of the honeycomb after 600 h of CVI process. The results of the simulation are compared with the results of the experiment to verify the accuracy of the model. Figure 6(f) illustrates the density growth curve for honeycomb densification over 600 h in both experimental and simulation scenarios. Early in the densification of CVI, the rate of density increase in the honeycomb is fast. As densification proceeds, the rate of densification slows down. This is due to the fact that the reduction of pores inside the precast body hinders the chemical reaction. The observed densification rate, indicating an increase in density over time, closely aligns with the simulated density growth curve. The consistency between experimental and simulation results fully demonstrates the reliability of the multi-physics field model. Experiment validation of C/C honeycomb densification. (a)–(d) Streamflow distribution in a 10 mm,20 mm, 30 mm and 40 mm free limit field; (e) Gas flow for densification simulation; (f) Density growth curve of experiment and simulation.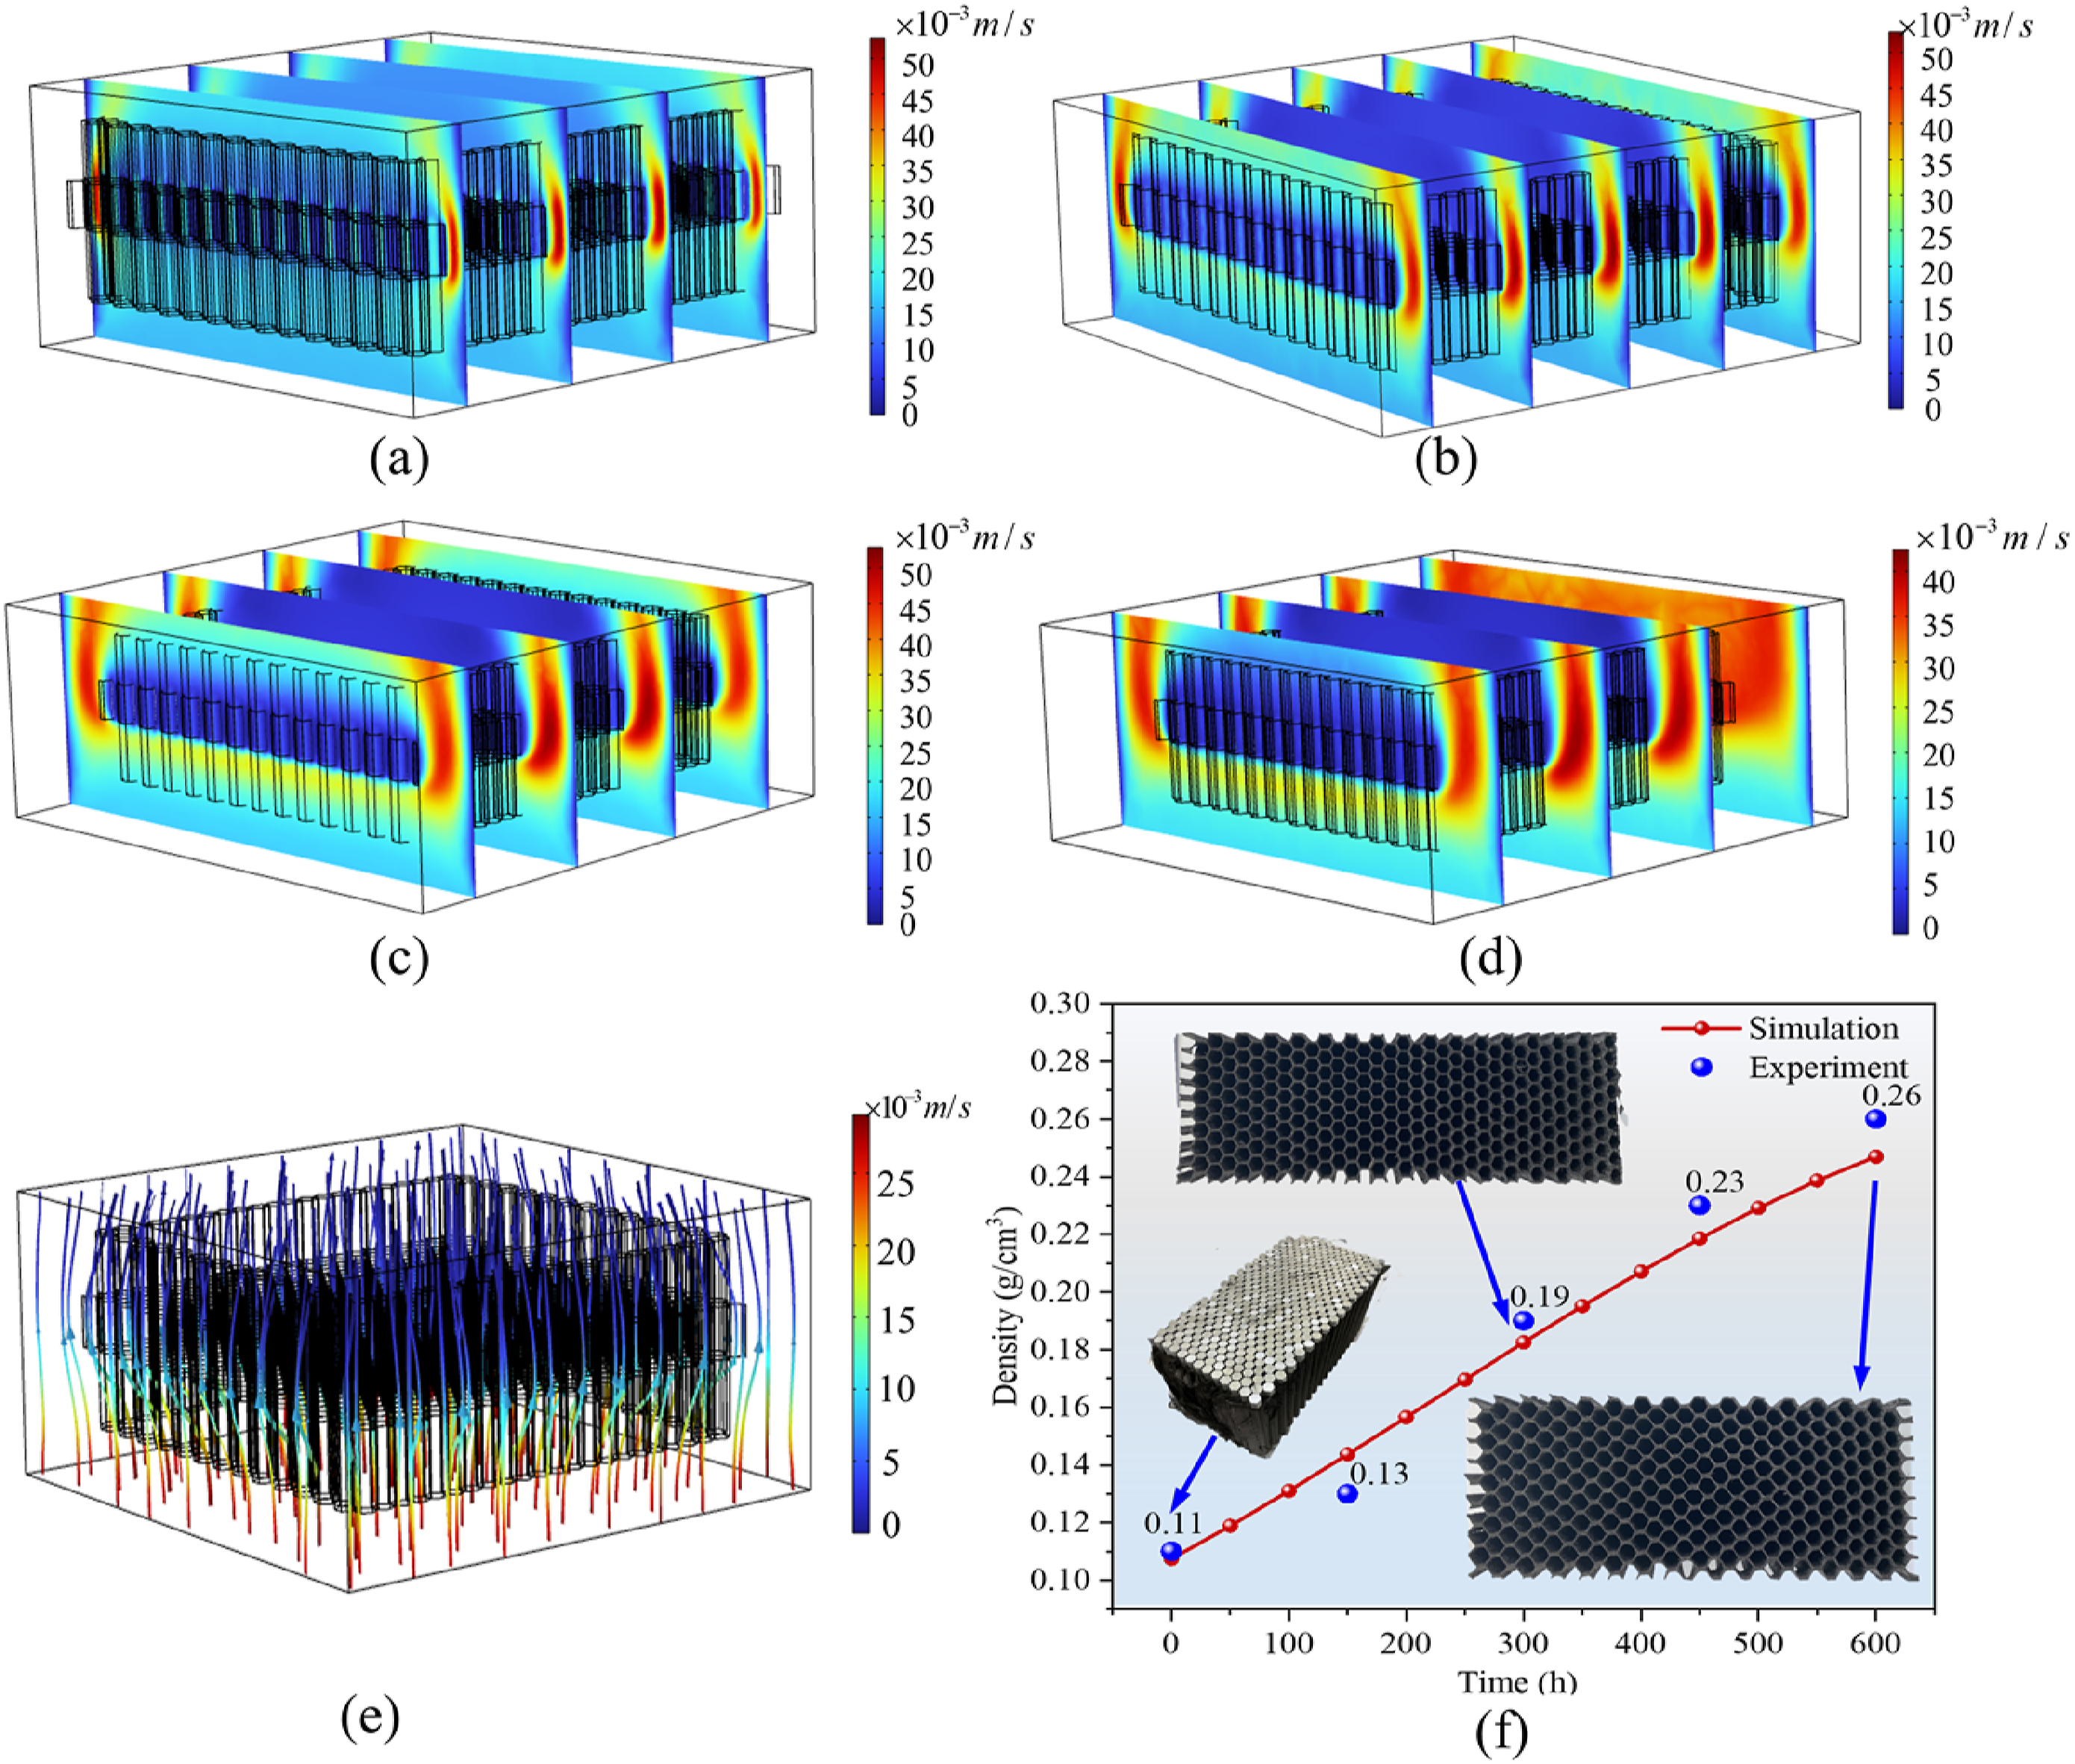
Discussion and results
The effect of three process parameters, namely, temperature, pressure and retention time, on honeycomb deposition is investigated by simulation.
The influence of residence time on honeycomb densification
Simulation parameter table for the effect of residence time on CVI process.
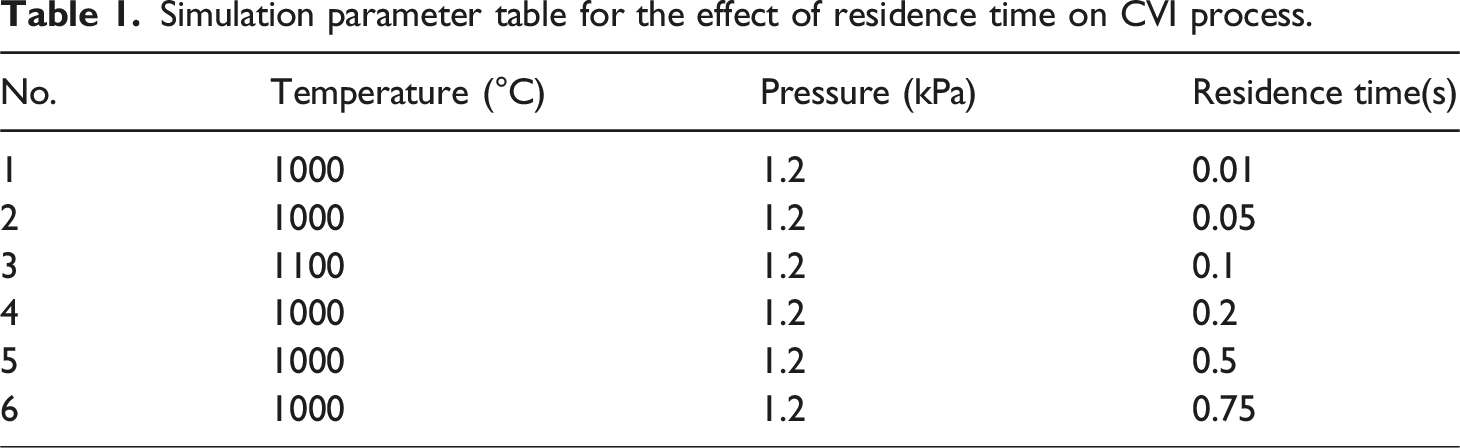
Figure 7 illustrates the specific values of equivalent density and standard deviation of density distribution for the honeycomb at various residence times. As the residence time extends, there is a notable increase in honeycomb density followed by a subsequent decrease. The peak density value, reaching 0.2310, is attained at a residence time of 0.5 s. Concurrently, the homogeneity factor of the honeycomb initially decreases, then increases, signifying an improvement and subsequent decline in honeycomb homogeneity with the prolongation of gas residence time. Optimal homogeneity is achieved at a residence time of 0.5 s, where the homogeneity factor reaches its minimum at 0.1057. C/C honeycomb density and uniformity at different residence times.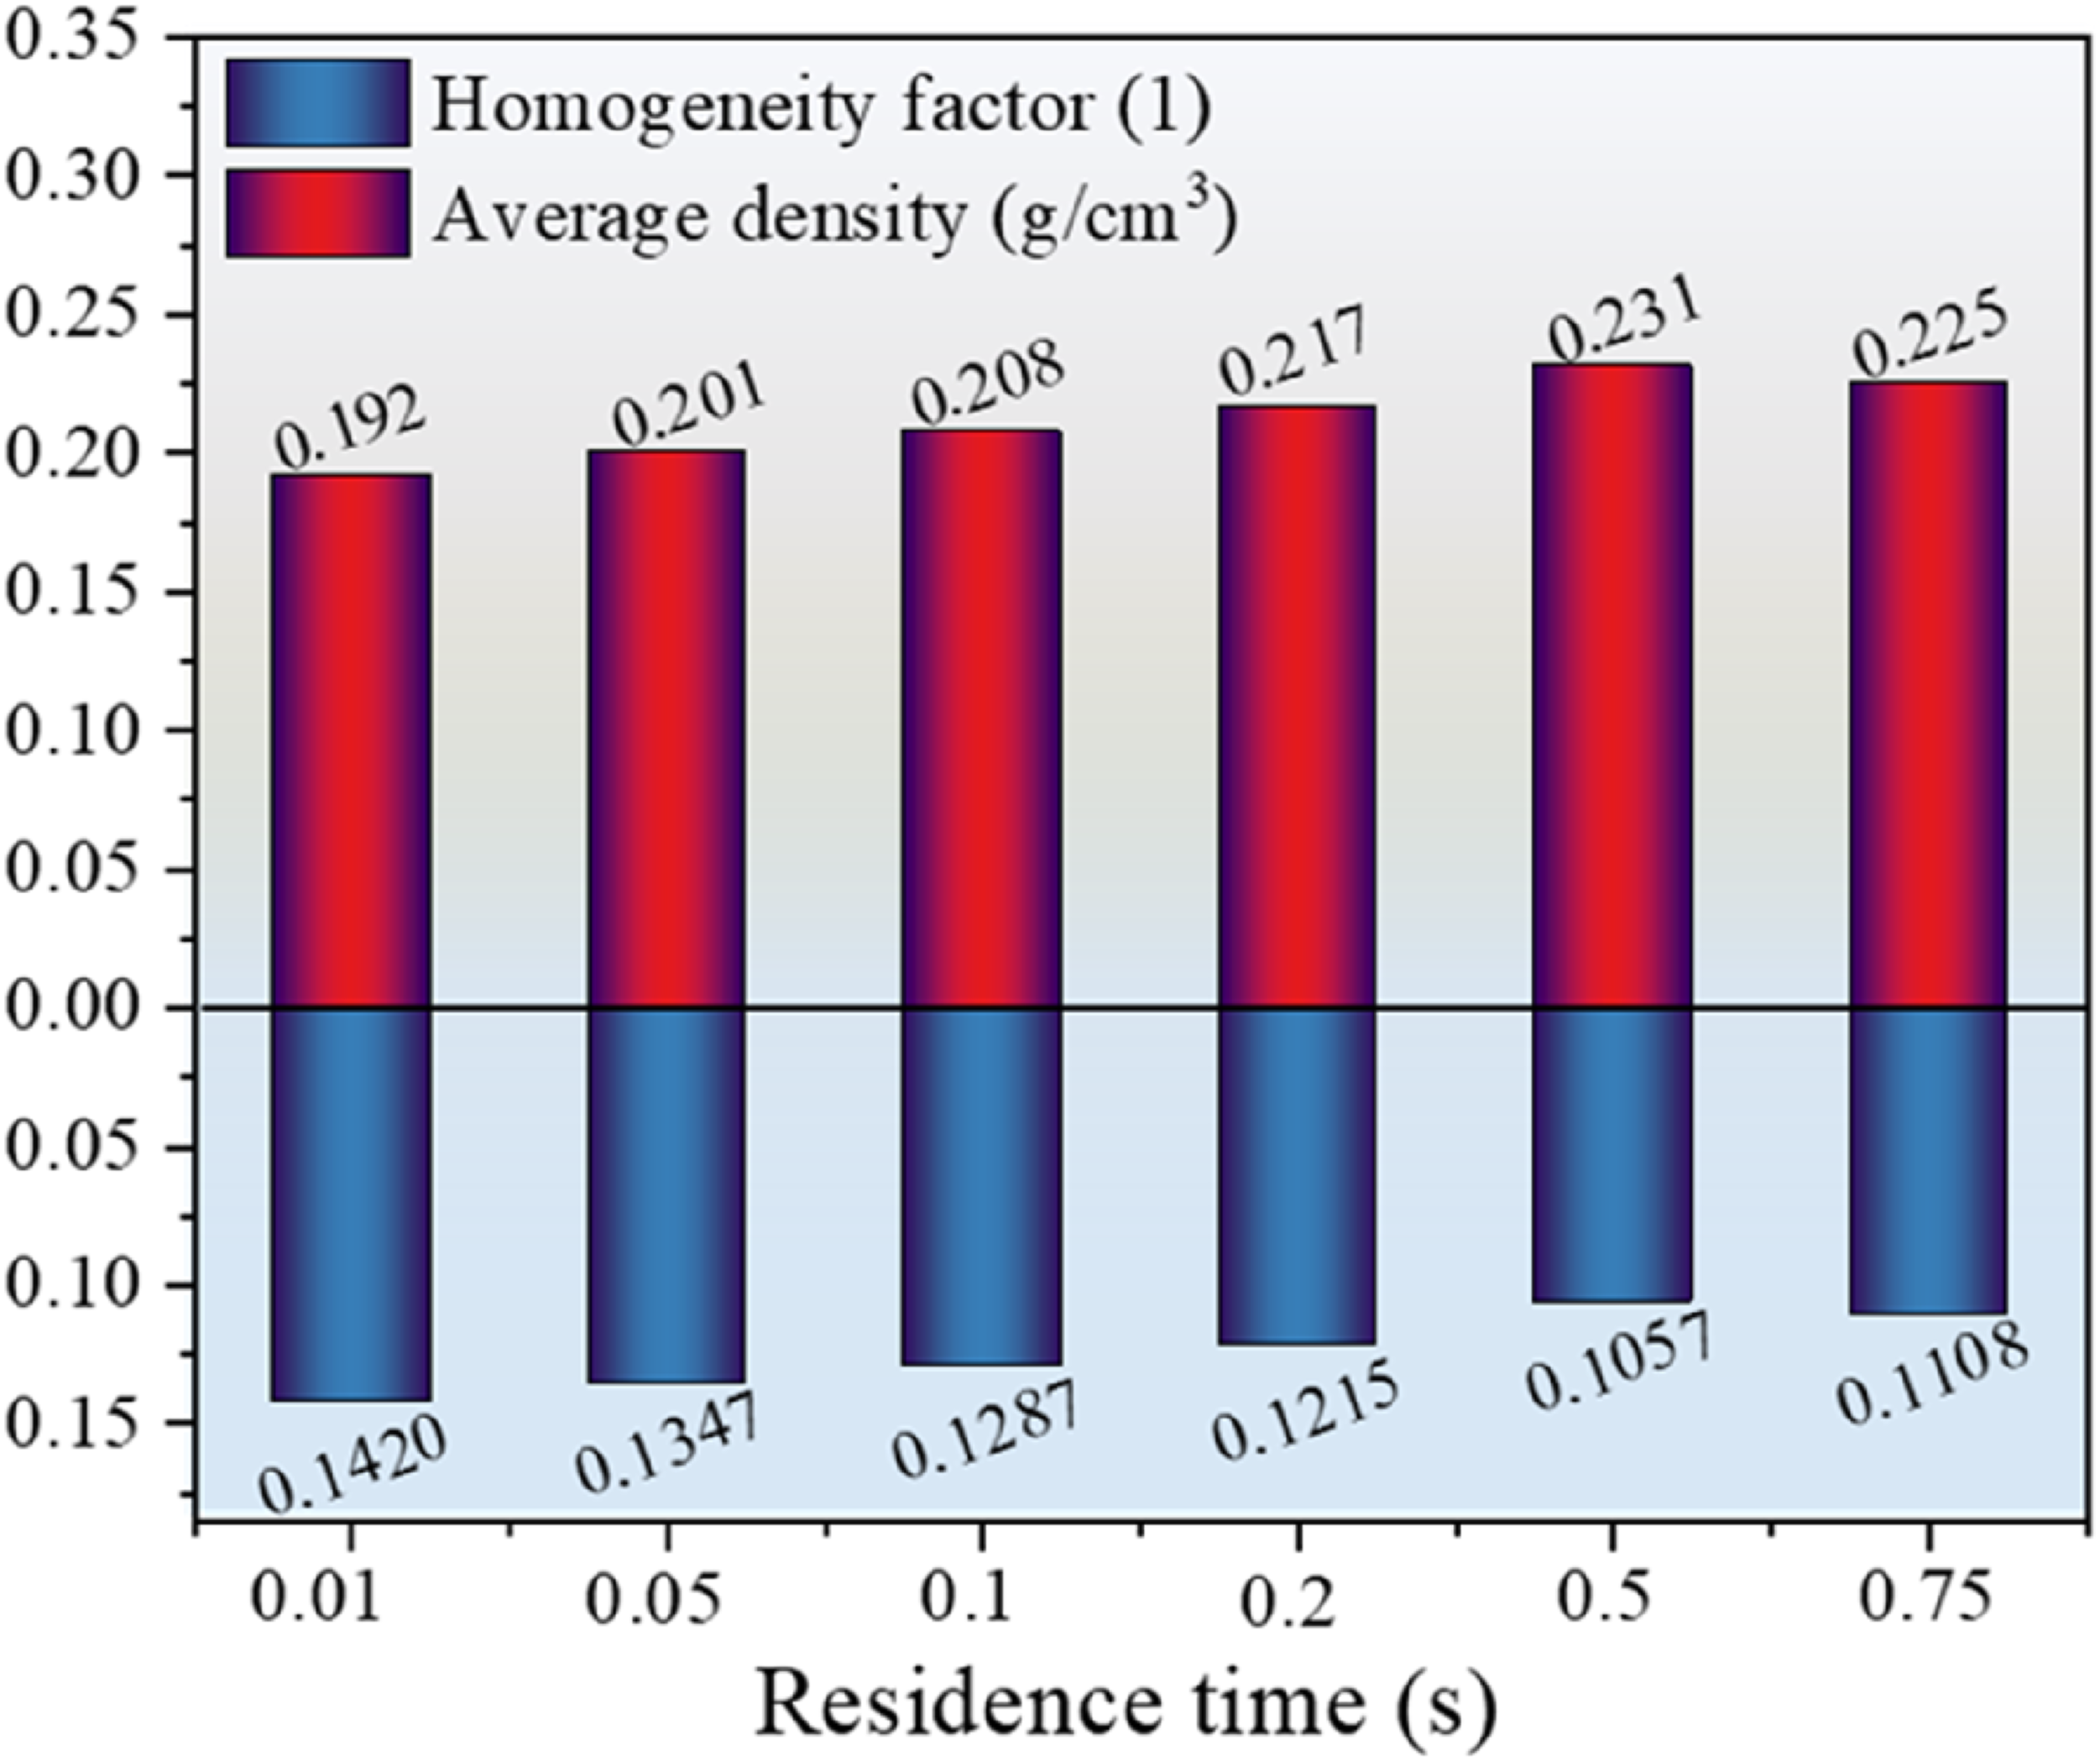
Figure 8 illustrates the density distribution over a 1000-h deposition period at various gas residence times. As the gas residence time increases from 0.01s to 0.75s, the density of the honeycomb wall also grows with the gas residence time. At a gas residence time of 0.5 s, the honeycomb wall achieves its peak density, ranging between 1.7 g/cm³ and 2.0 g/cm³, showcasing optimal densification. This interval exhibits minimal variance between the highest and lowest density values, signifying enhanced uniformity in density distribution. As the gas residence time surpasses 0.5 s and continues to rise, the maximum density of the honeycomb wall remains relatively stable. However, the minimum density decreases, indicating a deterioration in the uniformity of density distribution. These findings align seamlessly with the observations detailed in Figure 7. Honeycomb density distribution at different residence times; (a) 0.01s, 0.05s, 0.1s; (b) 0.2s, 0.5s, 0.75s.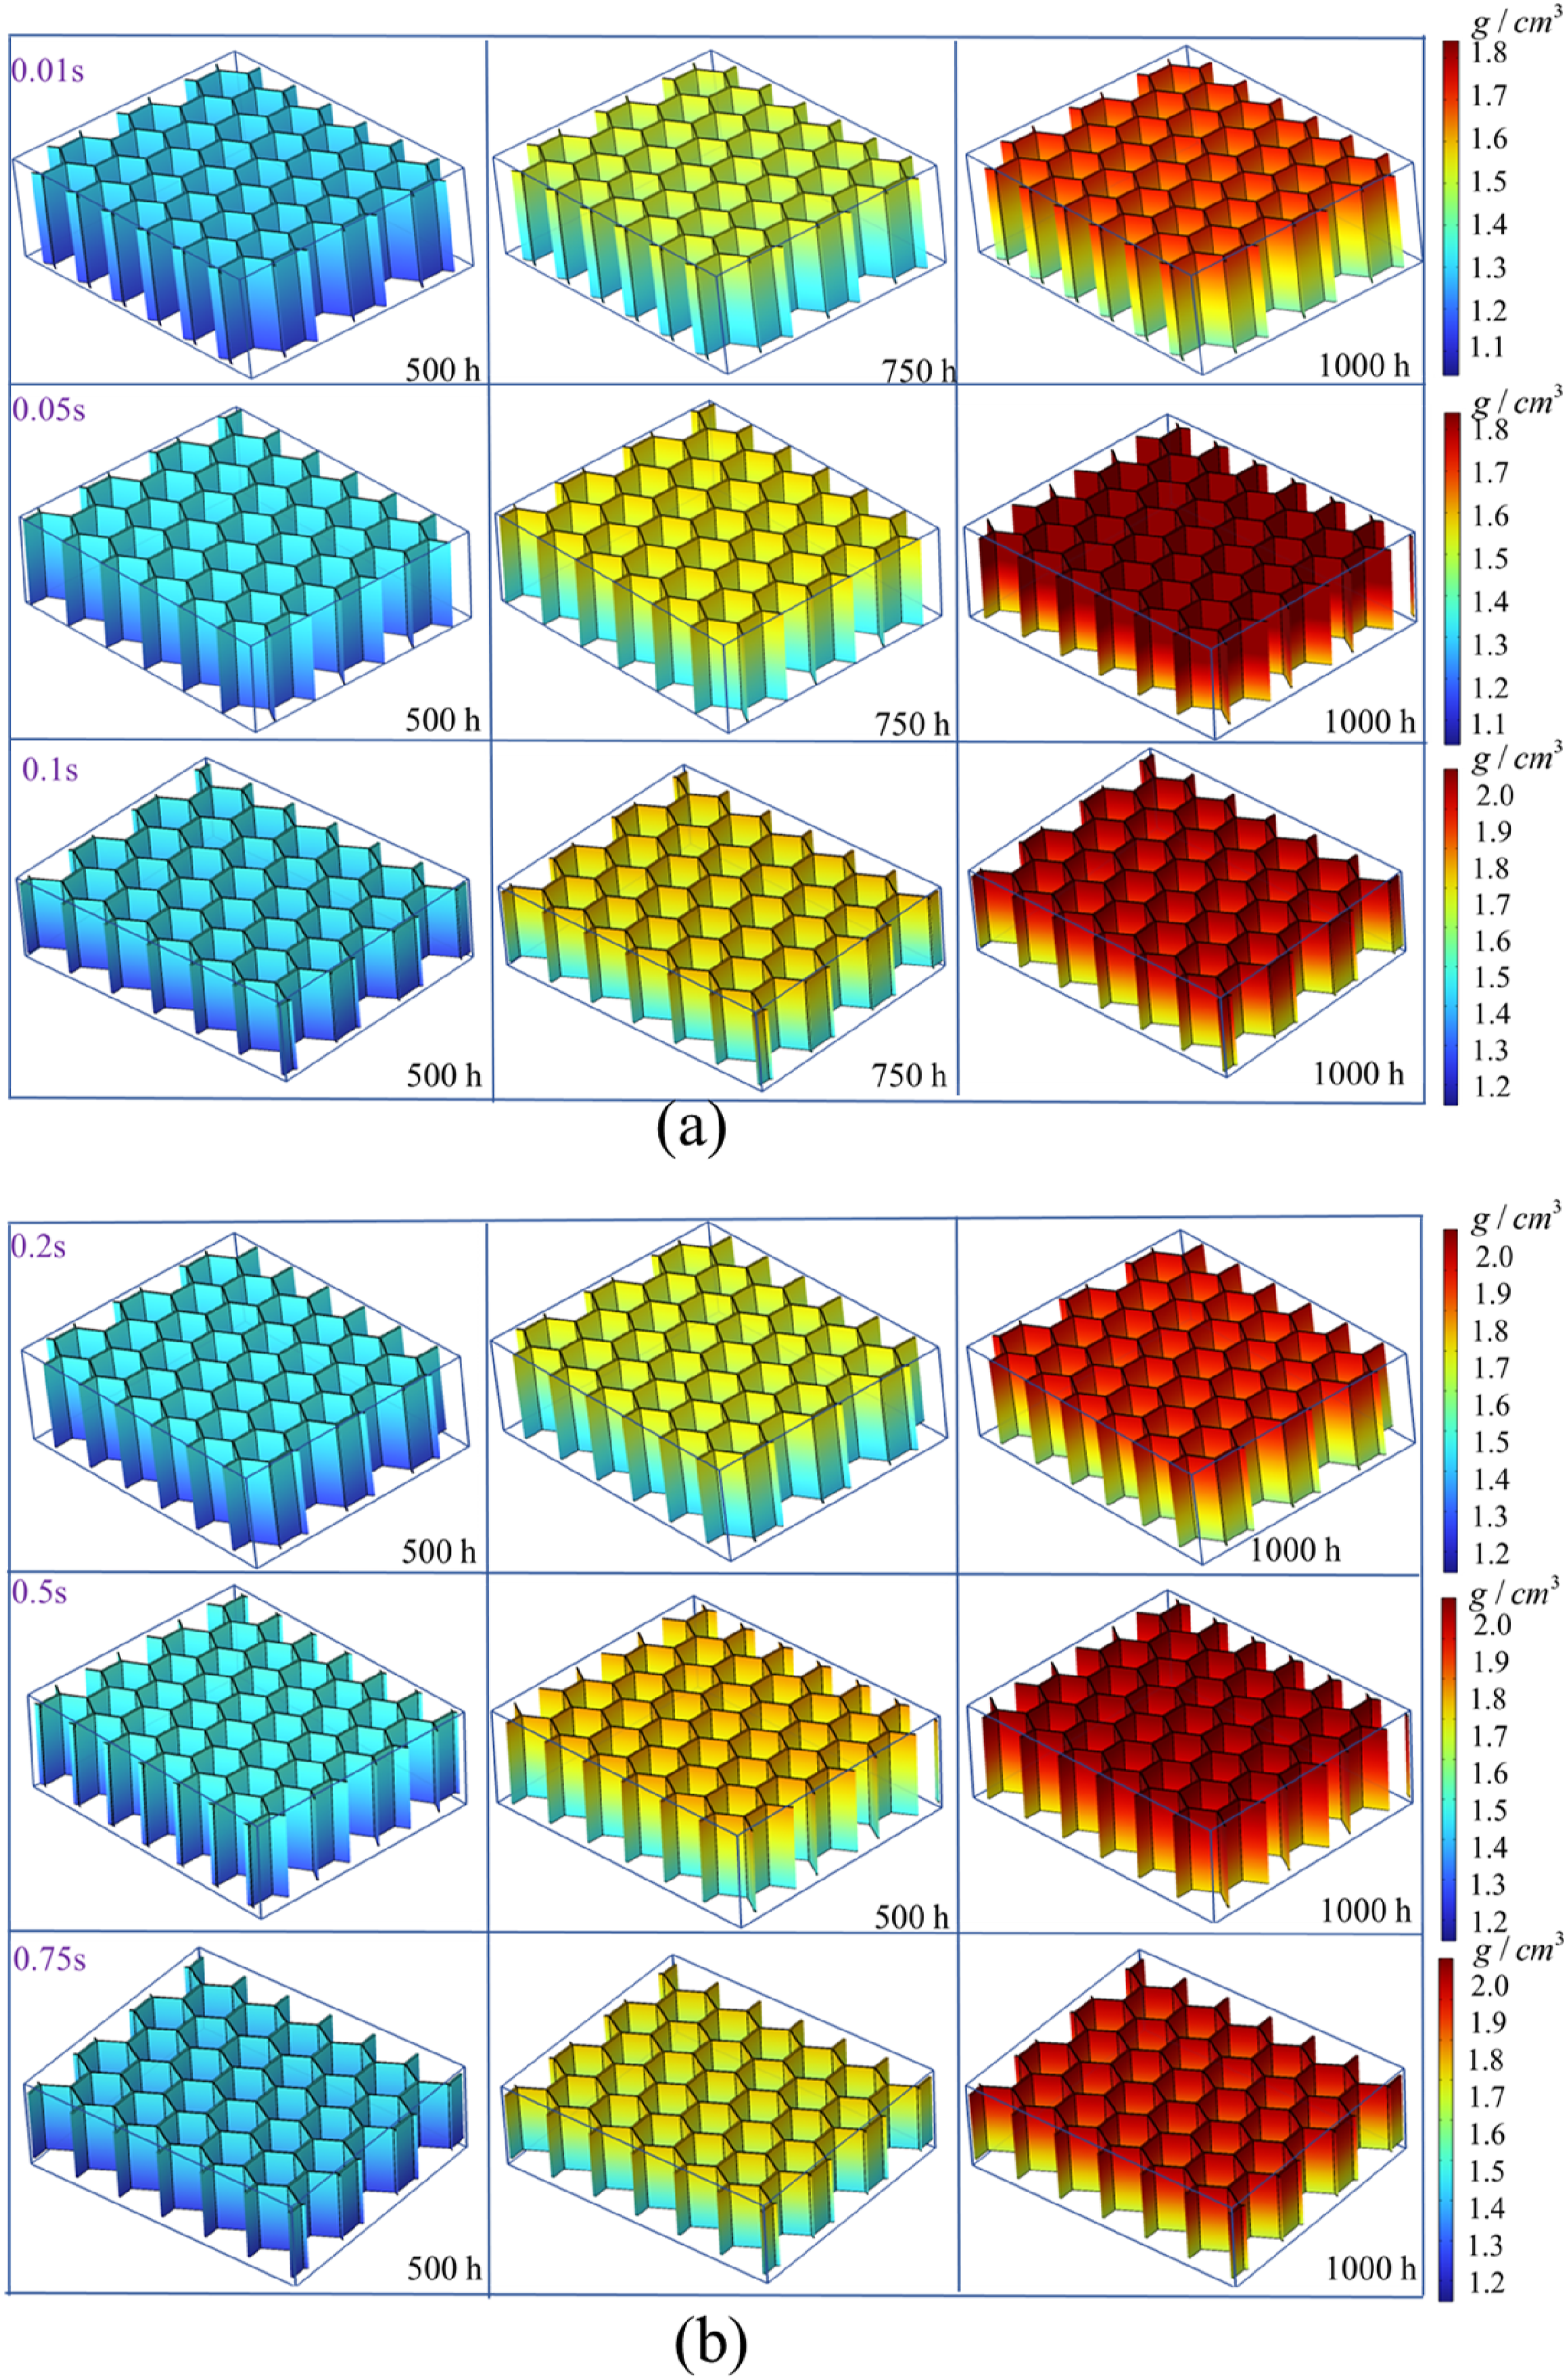
In summary, for the specific geometry of the C/C honeycomb outlined in this paper, it is recommended to utilize a gas residence time of 0.5 s during the CVI process for optimal densification.
The effect of reaction temperature on honeycomb densification
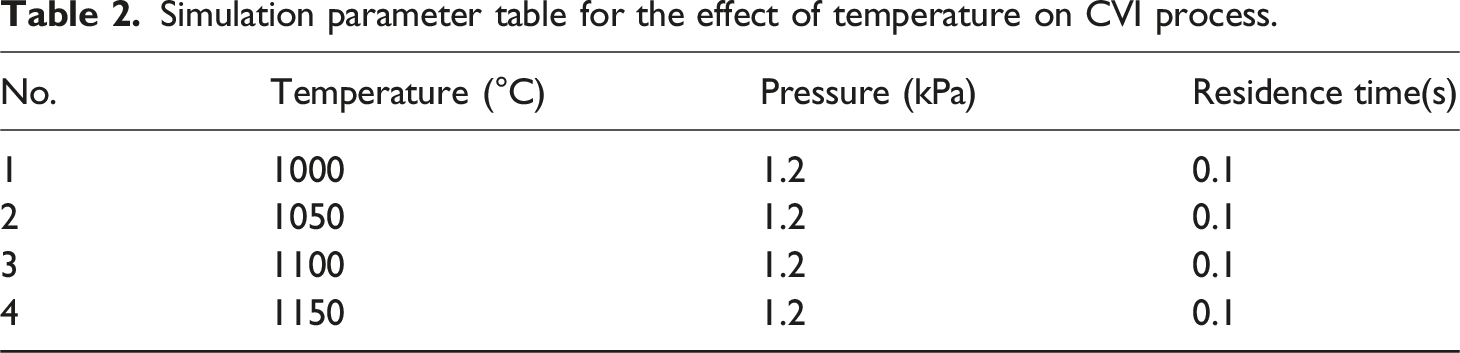
Simulation parameter table for the effect of temperature on CVI process.
Here the densification behavior of C/C honeycomb is studied at different reaction temperatures with an equivalent density of 0.23 as the target. Figure 9(a) depicts the deposition time and homogeneity factor when the equivalent density increases to 0.23 g/cm3 at different reaction temperatures. The time for the density of the C/C honeycomb to reach 0.23 g/cm3 decreases as the reaction temperature increases. When the temperature was increased from 1100°C to 1150°C the honeycomb densification time decreased significantly. This indicates that as the temperature increases, both the gas-phase reaction and the surficial reaction become more intense. The increase in the chemical reaction rate will definitely lead to a significant increase in the densification rate of the C/C honeycomb. Regarding the impact of reaction temperature on honeycomb homogeneity, an initial increase followed by a subsequent decrease in the homogeneity factor is noted with rising temperature. This implies that beyond a certain threshold, an elevation in temperature not only enhances densification efficiency but also improves the uniformity of density distribution in the honeycomb. Honeycomb densification at different reaction temperature and pressure. (a) Deposition time and homogeneity parameters of honeycomb at different reaction temperatures for honeycomb density of 0.23 g/cm3; (b) Honeycomb density distribution at different reaction temperatures; (c) Growth curves of honeycomb density and its standard deviation at different reaction pressures; (d) Honeycomb density distribution at different reaction pressures.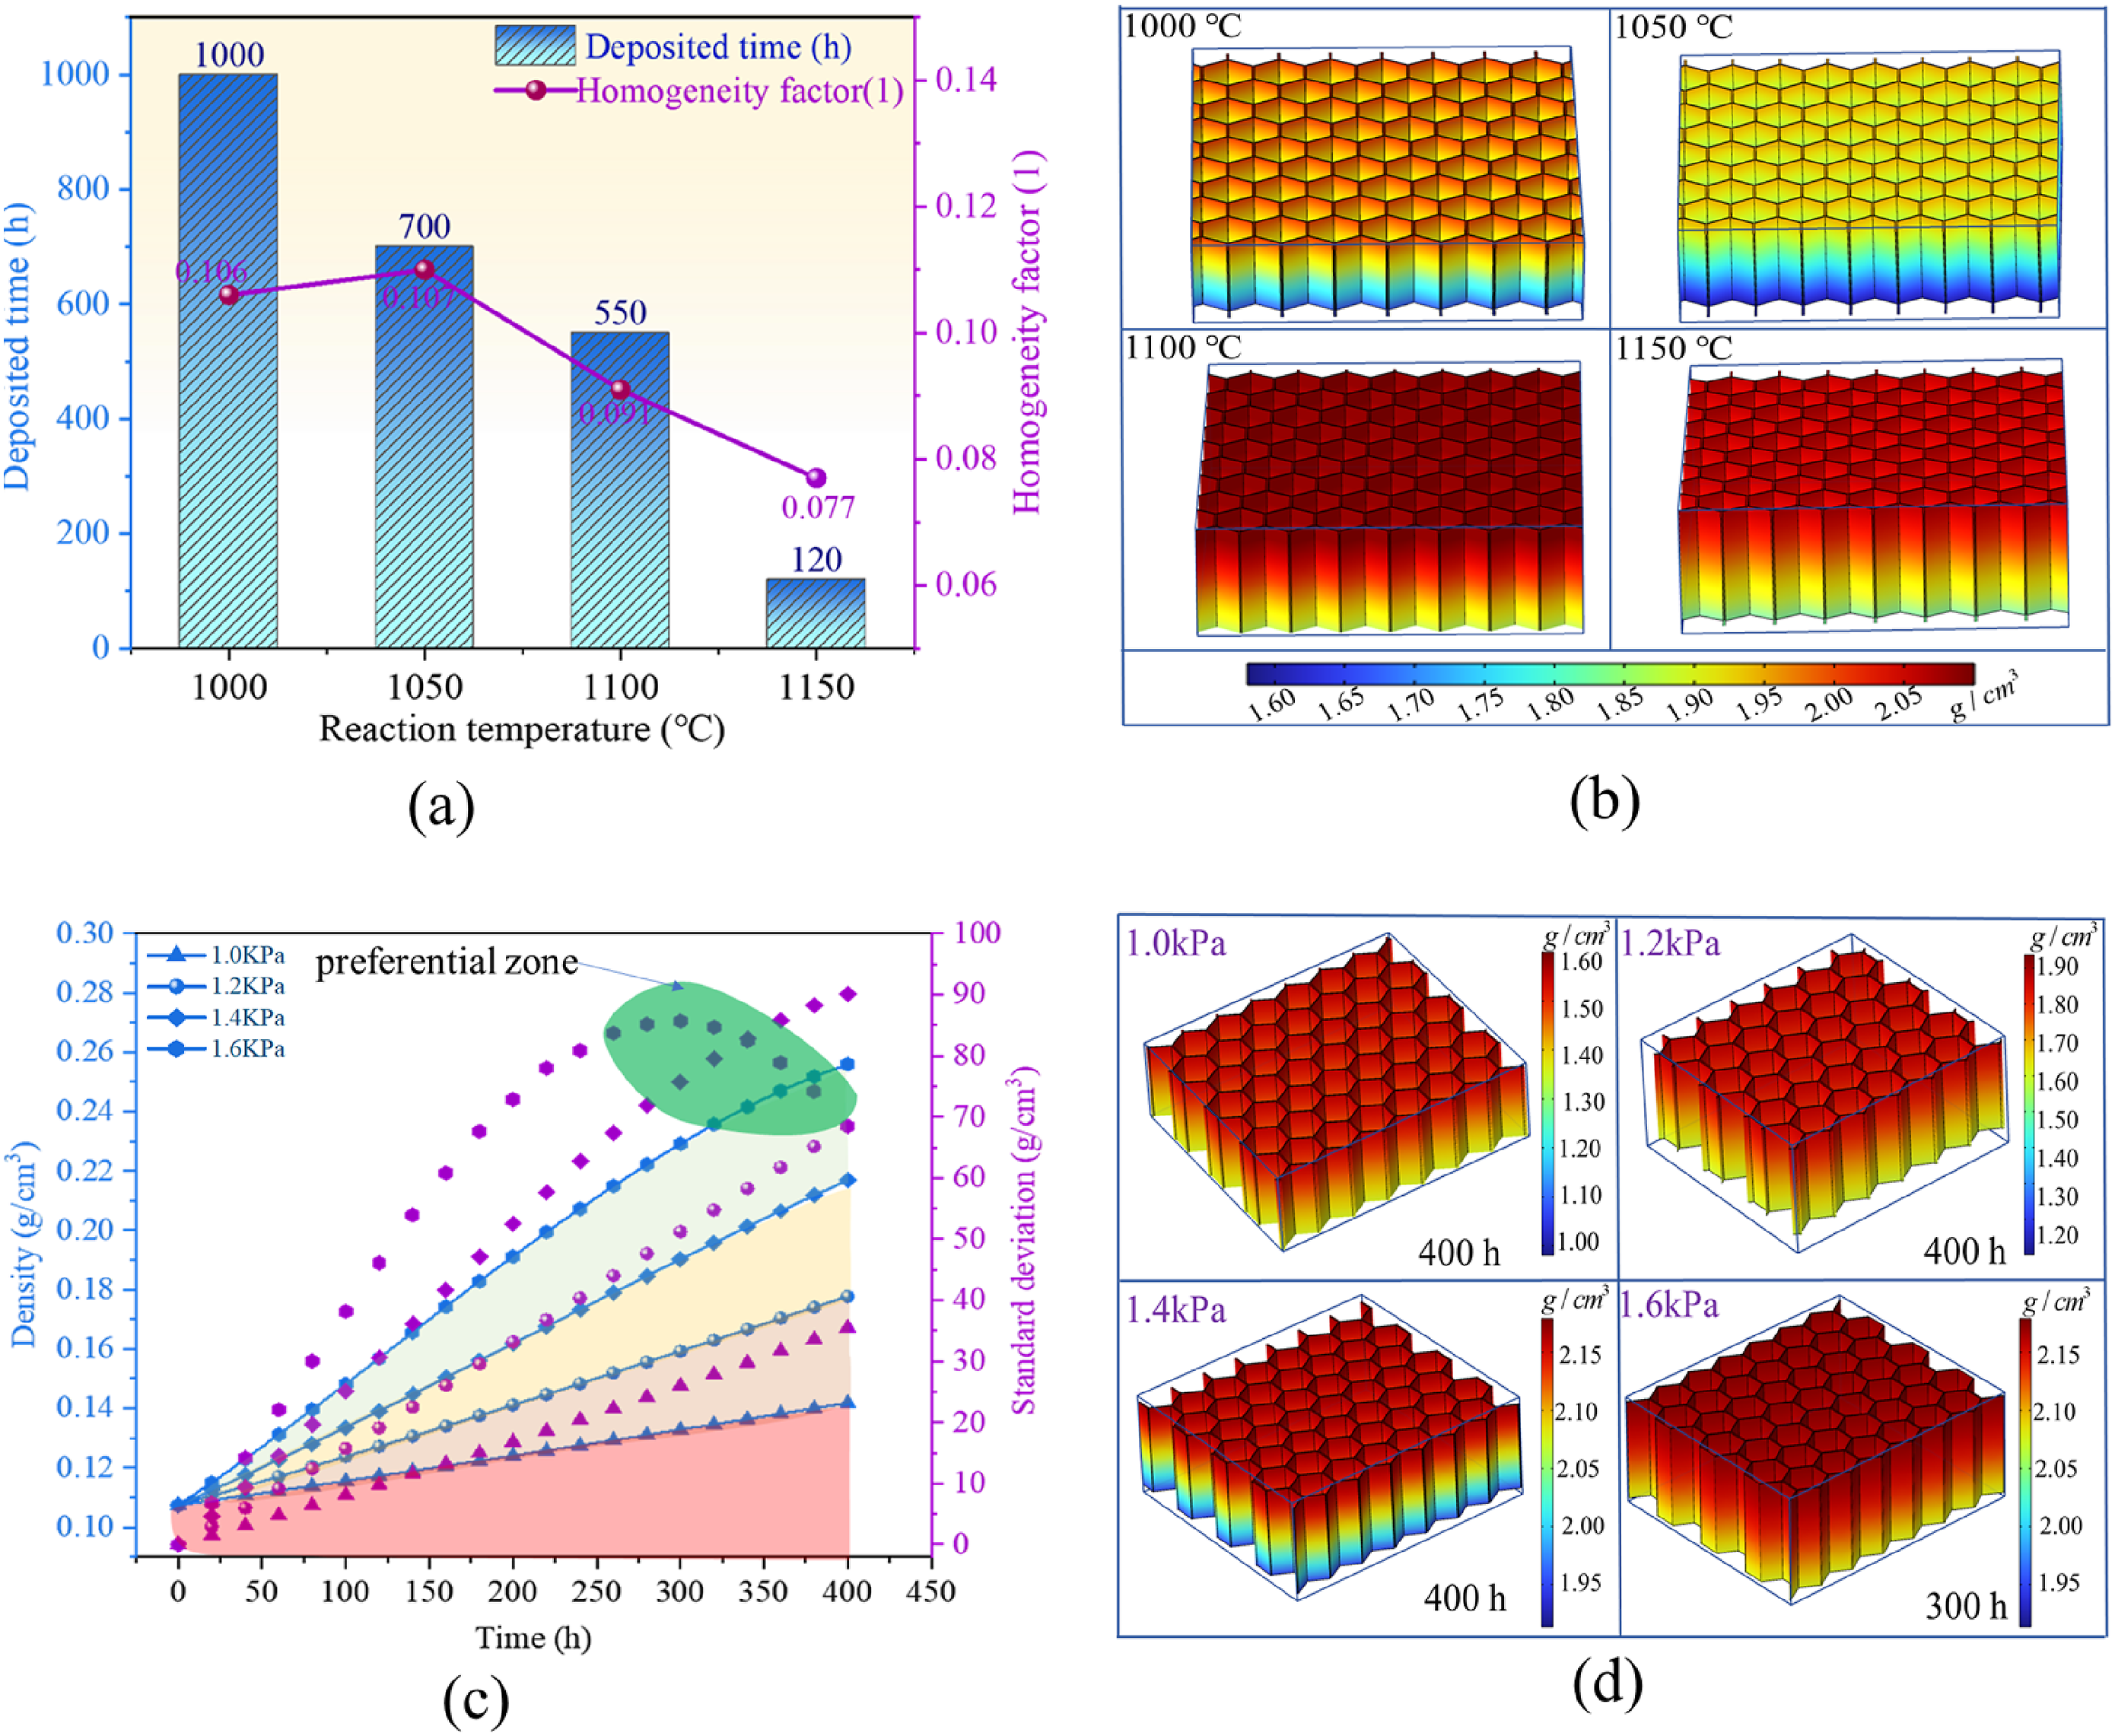
In Figure 9(b), the density distribution of honeycomb walls is illustrated at various reaction temperatures, maintaining a honeycomb equivalent density of 0.23 g/cm³. Notably, the density distribution on the honeycomb wall surface exhibits significant variations even with the same honeycomb equivalent density. For instance, as the reaction temperature rises from 1000°C to 1100°C, there is a noticeable enhancement in the homogeneity of the density distribution. This observation suggests that elevating the reaction temperature not only enhances the densification efficiency of the honeycomb but also contributes to improved homogeneity in density distribution during high-temperature molding at the same density.
In summary, opting for a higher reaction temperature in the CVI process for honeycomb densification not only enhances densification efficiency but also proves advantageous for improving homogeneity.
The effect of reaction pressure on honeycomb densification
Simulation parameter table for the effect of pressure on CVI process.
Figure 9(c) illustrates the density variation curves and standard deviation of C/C honeycomb throughout the CVI forming process under various pressures. For reaction pressures equal to or below 1.4 kPa, the density of the C/C honeycomb gradually rises with deposition time extending from 0 to 400 h. As the reaction pressure escalates, the honeycomb’s density attains its peak value. Specifically, at a reaction pressure of 1.4 kPa, the density of the C/C honeycomb reaches 0.25 g/cm³ after 400 h of deposition. At this juncture, the densification efficacy of the honeycomb is notably high. Upon elevating the pressure to 1.6 kPa, only 300 h are required to attain an equivalent densification level as observed at 1.4 kPa after 400 h. This underscores the pivotal role of heightened reaction pressure in accelerating the densification rate. Analyzing the standard deviation of C/C honeycomb density reveals that, with a reaction pressure exceeding 1.4 kPa, two noteworthy outcomes emerge. Firstly, the honeycomb density can be sustained at a heightened level. Secondly, during the latter phase of densification, the standard deviation of honeycomb density initiates a decline, signifying an enhancement in the homogeneity of the honeycomb density distribution.
When comparing the densification of C/C honeycomb under reaction pressures of 1.4 kPa and 1.6 kPa, a notable observation is that the densification rate is markedly higher at 1.6 kPa. This leads to a diminished final standard deviation and a more homogeneous structure in the C/C honeycomb.
Figure 9(d) illustrates the density distribution of the honeycomb at different reaction pressures. Specifically, the honeycomb deposition time is 400 h when the reaction pressures are 1.0 kPa, 1.2 kPa, and 1.4 kPa, and the honeycomb deposition time is only 300 h when the reaction pressure reaches 1.6 kPa. With the elevation of reaction pressure, a concurrent increase in honeycomb density is observed. The peak density of honeycomb walls escalates from 1.6 g/cm³ at 1.0 kPa reaction pressure to 2.1 g/cm³ at 1.6 kPa. Remarkably, at a reaction pressure of 1.6 kPa, substantial densification is achieved within a mere 300 h. Upon scrutinizing the density distribution of the honeycomb in its final state under varying reaction pressures, it becomes evident that the homogeneity of density distribution is significantly enhanced compared to lower reaction pressures.
In conclusion, the densification of the honeycomb is notably influenced by the reaction pressure. For the C/C honeycomb size considered in this study, the optimal reaction pressure is determined to be 1.6 kPa.
Variable stiffness honeycomb integrated forming simulation
Variable density C/C honeycomb process parameter.
The C/C honeycomb preform undergoes a deposition period of 400 h utilizing the CVI reactor depicted in Figure 2(b) and following the reaction parameters specified in Table 4. The resulting density distribution of the variable density C/C honeycomb after final forming is presented in Figure 10. This figure incorporates two legends: the left legend represents the density variations across a C/C honeycomb wall, while the right legend provides a realistic depiction of the equivalent density for the C/C honeycomb. The density distribution of the ultimately obtained variable stiffness C/C honeycomb is not completely cut in three parts, and there is a certain gradient in the density distribution at the junction of the high, medium and low regions. This is because the honeycomb structural preform is essentially a porous medium, and the specific mechanism of gas flow and diffusion as well as the chemical reaction occurring inside the porous medium is also given in the previous models. Although the temperature, pressure and gas residence time are different in the three regions of the reactor, it does not mean that the CVI processes in the three parts are completely independent. The three sections also interact with each other due to gas flow and diffusion, etc. resulting in the density distribution as shown in Figure 10. The density of the honeycomb exhibits a gradual decrease from the left end to the right end. Simultaneously, the proximity of the low-density region to the right side signifies a closer alignment with the structural design objective of achieving lightweighting. In comparison to a honeycomb with identical dimensions obtained through the conventional CVI process, the variable density honeycomb illustrated in Figure 10 showcases a remarkable 17.6% reduction in mass. Density distribution of variable stiffness honeycomb.
Conclusion
Variable stiffness C/C honeycomb structures find extensive applications in wing structures due to their remarkable lightweight characteristics and exceptional mechanical properties. Conventional methods for preparing variable stiffness honeycomb structures face challenges such as material mass redundancy and vulnerability to cracking. Addressing the urgent need for integrated forming of variable stiffness honeycomb, this study accomplished it through the design of a distinctive CVI domain-limited reactor. Firstly, the methodology for honeycomb CVI forming and the design of a domain-limited reactor for integrally molding variable stiffness honeycomb through CVI are described. Secondly, a coupled multi-physical field model for honeycomb CVI processing is established and its accuracy is validated through experimental verification. Subsequently, C/C honeycomb modeling is conducted with varying processing parameters to analyze the influence of these parameters on the forming process. Finally, leveraging the established influence laws, different process parameters are applied to specific domains of the variable stiffness honeycomb CVI domain-limited reactor to achieve the integrated forming of the variable stiffness honeycomb. The conclusions drawn from these analyses are outlined as follows:
The density of C/C honeycomb exhibits a pattern of initially increasing and then decreasing, while the density distribution undergoes a transition from homogeneous to less uniform with an extension of gas residence time. Specifically, at a gas residence time of 0.5s, the honeycomb density attains its maximum, accompanied by a relatively improved homogeneity in density distribution. Moreover, with an elevation in reaction temperature, there is an observed enhancement in densification efficiency and a more homogeneous distribution. Notably, the transition from 1100°C to 1150°C results in a substantial and rapid increase in densification efficiency.
The densification efficiency exhibits a notable rise with an increase in reaction pressure. At a reaction pressure of 1.6 kPa, the honeycomb density can be augmented to approximately 0.27 g/cm³ within a timeframe of about 300 h. In the later stages of honeycomb deposition, the homogeneity of the density distribution initially diminishes before subsequently improving with reaction time. Remarkably, the honeycomb structure investigated in this study achieves a 17.6% reduction in mass for the same volume compared to the conventional honeycomb structure through integrated forming.
This study proves valuable in enhancing both the quality and efficiency of C/C honeycomb formation. It introduces a novel approach to forming honeycomb structures with variable stiffness and contributes valuable insights into the formation processes of C/C honeycomb structures.
Footnotes
Declaration of conflicting interests
The author(s) declared no potential conflicts of interest with respect to the research, authorship, and/or publication of this article.
Funding
The author(s) disclosed receipt of the following financial support for the research, authorship, and/or publication of this article: This study was supported by the National Key R&D Program of China (No. 2022YFB3706100) and the Young Elite Scientists Sponsorship Program by CAST (2020QNRC001).
Data availability statement
Data will be made available on request.