
Abstract
Fused Deposition Modelling (FDM) additive manufacturing is being used more and more to create lightweight polymeric composites. However, because of the intricate dynamics of interfacial bonding, processing parameter optimization for multi-material sandwich structures continues to be a special challenge. This work systematically investigates the tensile and flexural behaviour of 3D-printed polylactic acid (PLA) and carbon fibre-reinforced PLA (PLA-CF) sandwich specimens using a Taguchi L27 orthogonal array design. Layer height (0.20, 0.25, 0.30 mm), infill pattern (Gyroid, Tri-Hexagon, Honeycomb), and printing speed (125, 175, 225 mm/s) are among the control elements assessed. Multiple linear regression, analysis of variance (ANOVA), and signal-to-noise ratio plots were used to analyse the generated dataset for Young’s modulus, ultimate tensile strength (UTS), elongation at failure, and flexural characteristics. The statistical findings show that the infill pattern, which accounts for 48–80% of the property variance, is the most important element influencing mechanical performance. Quantitatively, the Triply Periodic Minimal Surface (TPMS) Gyroid pattern optimized tensile stiffness and ductility, whereas the Honeycomb core architecture produced the highest flexural strength and maximum ultimate tensile strength (∼28.5 MPa) because of effective planar stress distribution. Maintaining an ideal intermediate printing pace revealed to be physically necessary to guarantee correct interlayer fusion and avoid heat degradation during extrusion, even though variations in printing speed showed a slight statistical impact on the total property variance. Moreover, the stiffness and pseudo-ductility of the components were mostly affected by layer height. The suggested combination of sandwich architecture and parameter optimization offers a very efficient way to modify the mechanical performance of PLA-based composites for lightweight structural applications, which is supported by fractographic observations demonstrating improved interlayer bonding and fiber-matrix interaction under ideal conditions.
Keywords
Introduction
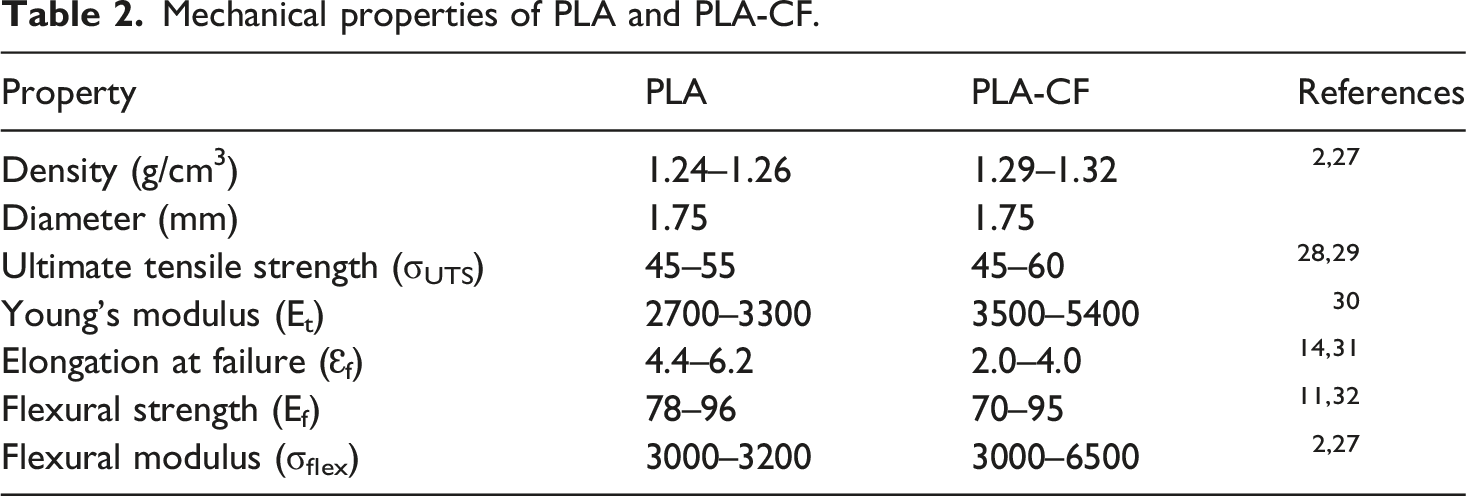
Additive manufacturing (AM), commonly referred to as 3D printing, has revolutionized contemporary production by making it possible to fabricate intricate, personalized geometries straight from digital computer-aided design (CAD) models without the use of conventional molds or subtractive tooling. 1 Fused deposition modelling (FDM), often referred to as fused filament fabrication (FFF), is the most widely utilized AM technology in both the industrial and academic sectors because of its affordability, ease of usage, and material variety. 2 A thermoplastic filament is melted and deposited layer by layer to create a three-dimensional item using this extrusion-based technology, which has several benefits for low-volume production and quick prototyping. 3 Polylactic acid (PLA) is a favoured thermoplastic in the field of FDM materials due to its biodegradability, low melting temperature, and simplicity of processing, which reduces problems like warping during printing. 4 However, although having sufficient tensile strength for general applications, plain PLA frequently has intrinsic constraints such limited heat stability and substantial brittleness that limit its use in high-load engineering scenarios. 5 Recent developments have concentrated on strengthening PLA matrices using high-strength additions, most notably carbon fibers (CF), in order to alleviate these mechanical deficiencies. 2 Comparing PLA-CF to unreinforced polymers, it has been demonstrated that the addition of short carbon fibers to the PLA matrix greatly improves the material’s stiffness and tensile modulus, providing a higher strength-to-weight ratio. 6 For example, the Young’s modulus of PLA can be increased from 1.04 GPa to 1.26 GPa by adding 15 weight percent short carbon fibre; however, this can occasionally result in decreased tensile strength because of inadequate fibre-matrix interfacial bonding. 7
Industrial utilization of PLA and PLA-CF in additive manufacturing.
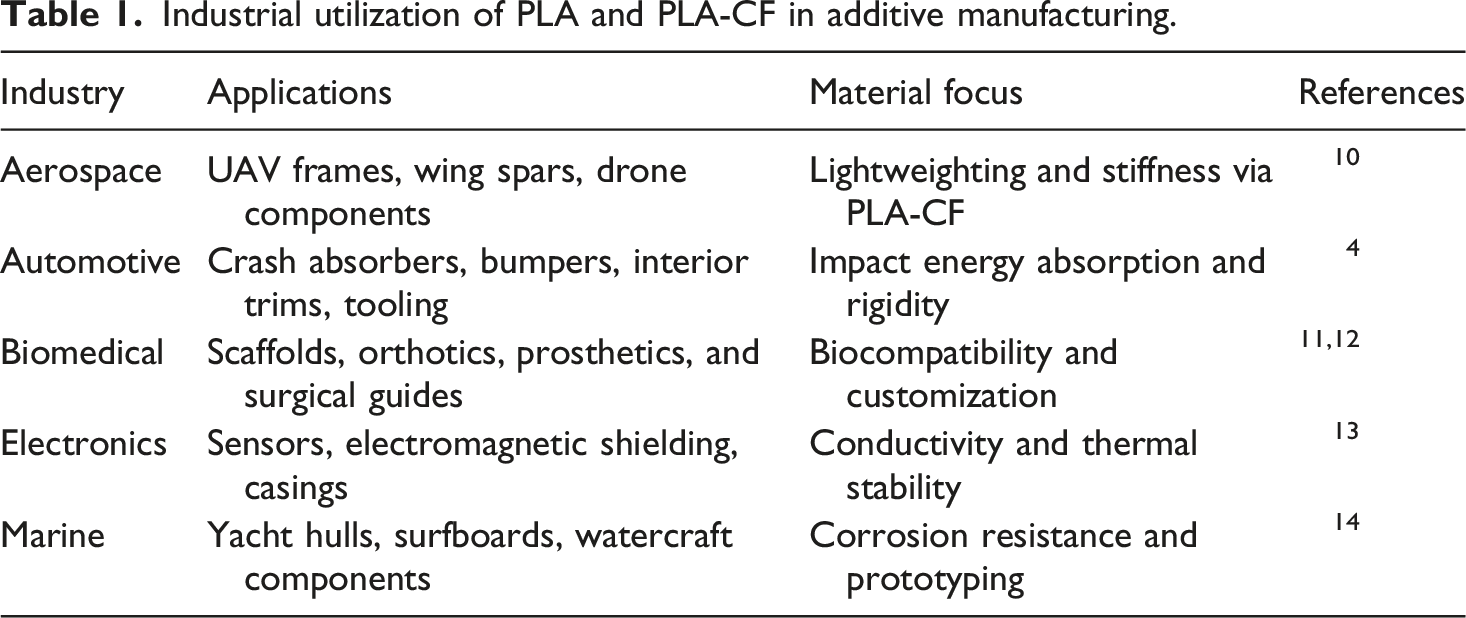
Researchers have started looking into sandwich architectures as a way to reduce the brittleness of fully reinforced composites while maintaining their high stiffness. 15 To maximize the mechanical response under load, these arrangements usually alternate layers of stiff PLA-CF (core) and ductile tidy PLA (skin), or vice versa. 16 Because the skin and core layers work in concert to improve flexural stiffness and energy absorption capacities, sandwich printing provides a strategic advantage by lowering the amount of costly reinforcing material needed. 2 For instance, compared to fully reinforced PLA-CF parts, a sandwich construction with alternating layers has been demonstrated to increase tensile strength by 17.06% and tensile modulus by 27.48%. 17 However, the quality of interfacial bonding between the various layers is crucial to the structural integrity of these multi-material laminates, and flaws like delamination can seriously impair performance. 18 The intrinsic properties of FDM require a reversed material arrangement when utilizing short-fibre thermoplastics, whereas conventional composite sandwich architectures use high-strength face sheets encasing a low-density core. Short carbon fibers increase the nominal stiffness of PLA, but they also cause localized stress concentrations and microstructural heterogeneities that weaken interfacial bonding and accelerate brittle failure. 3 According to recent research, using PLA-CF as the outer face sheets in 3D-printed sandwich constructions can lead to a general loss of toughness and strength because of poor damage tolerance at the surfaces where bending loads are highest. 3 In order to provide superior ductility, continuous interlayer adhesion, and resistance to surface crack initiation, pure PLA was deliberately chosen for the outer face sheets in this investigation. A synergistic structure that maximizes both load-carrying capacity and energy dissipation was produced by using PLA-CF just for the interior cellular core to provide high shear rigidity and stiffness.2,3
While the optimization of FDM parameters is well-documented for monolithic components, applying these principles to multi-material sandwich structures presents a scientifically unique challenge that remains a persistent gap in the current literature. 19 In monolithic printing, process parameters primarily dictate intra-material porosity. However, in sandwich composites combining neat polymers with short-fibre reinforced cores, the critical limiting factor is the interfacial adhesion quality and thermal mismatch between the dissimilar materials. 9 The incorporation of carbon fibers drastically alters the polymer’s rheological behaviour, cooling rate, and surface characteristics. 19 Consequently, printing parameters optimized for standard PLA are often unsuitable for fibre-filled filaments, leading to poor interdiffusion, interfacial voids, and premature delamination at the skin-core boundary. 3 Therefore, the precise optimization of parameters such as layer height, print speed, and cellular infill architecture is uniquely critical for sandwich structures. It is required to establish the exact thermodynamic and geometric conditions necessary to maximize interfacial polymer chain entanglement, ensure uniform stress transfer across the multi-material boundary, and fully exploit the synergistic stiffness-to-weight benefits of the sandwich composite design.4,9
The exact control of processing parameters that determine the interior mesostructured of the component is just as important as the material composition in determining the mechanical dependability of FDM-printed composites. 20 The void content, surface resolution, and fibre alignment inside the polymer matrix are all determined by critical factors such layer height, printing speed, and infill pattern. 1 According to research, the bonding area and heat dissipation between deposited beads are strongly impacted by layer height, with lower layer heights typically increasing tensile strength.1,21 The degree of molecule diffusion at the interface and the pace of cooling are influenced by printing speed; excessively high speeds might result in weak interlayer bonding and diminished mechanical characteristics. 22 Additionally, the internal stress distribution and load-bearing capacity are determined by the infill pattern selection; honeycomb designs, as opposed to rectilinear or triangular patterns, give clear advantages in compressive and flexural performance. 23 Consequently, maximizing component strength requires determining the optimal mix of these factors.11,21 To reduce the cost and duration of experiments, a strong statistical technique is needed to navigate the intricate, non-linear relationships between various process parameters. 1 The Taguchi experimental design approach is well known for its effectiveness in using orthogonal arrays to optimize several parameters at once. 6 The Taguchi approach enables the identification of ideal processing settings that lower variability and improves performance by methodically altering parameters and analysing signal-to-noise ratios. 24 There is still a significant knowledge gap concerning the simultaneous optimization of infill pattern, layer height, and printing speed, especially for PLA/PLA-CF/PLA sandwich laminates, despite the substantial literature on monolithic PLA and PLA-CF parts. 9
This study’s main goal is to use an L27 experimental design to optimize and characterize 3D printed PLA/PLA-CF sandwich composites. The objective of this research is to methodically assess how important process variables affect the tensile, flexural, and morphological characteristics of these sophisticated composites. In order to determine the ideal manufacturing conditions that optimize mechanical dependability and structural integrity for high-performance engineering applications, this work correlates processing conditions with morphology features and mechanical performance. 25
Materials and methods
Material and printing parameters
The primary materials used in this study were PLA and PLA-CF filaments. Shaptech Solutions Pvt. Ltd. was the commercial supplier of the PLA-CF filament utilized to fabricate the specimens. The technical specifications of the manufacturer state that the filament has a short carbon fibre mass fraction of about ∼15 weight (wt.) percent. This particular fibre loading was chosen because it offers the best possible balance between processability and mechanical improvement. Young’s modulus and rigidity are greatly increased by adding about ∼15 wt.% short carbon fibers, which also keeps the melt flow index appropriate for conventional FDM printing without clogging the nozzle. 6 Because of their random orientation, short-fibre composites require careful control over their fibre content from a morphology standpoint. 3 According to published research, a threshold of about ∼15 wt.% is ideal for FDM applications since higher fibre loading frequently results in weak interfacial bonding, poor matrix infiltration, and fibre aggregation. 14 Stress concentrations brought forth by these flaws may eventually lower tensile and flexural strength. By employing this optimized fibre fraction, the composite attains a more uniform dispersion of fibers, allowing for effective stress transfer between the carbon fibers and the PLA matrix while guaranteeing stable and defect-free extrusion during the FDM process. 6
Mechanical properties of PLA and PLA-CF.
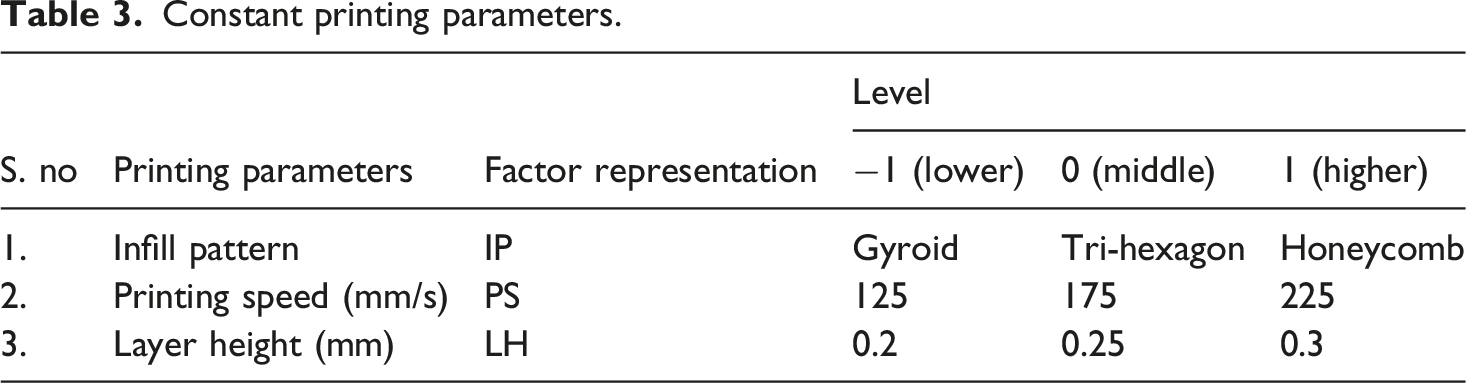
Constant printing parameters.
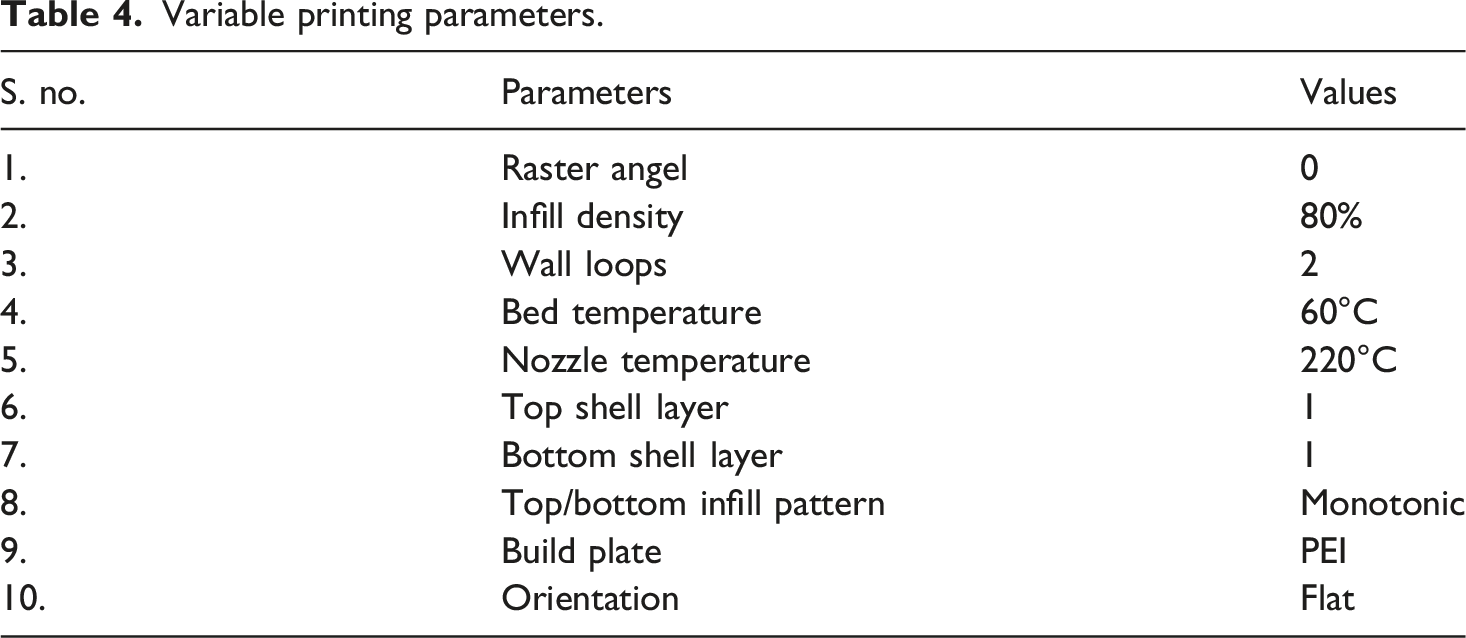
Variable printing parameters.
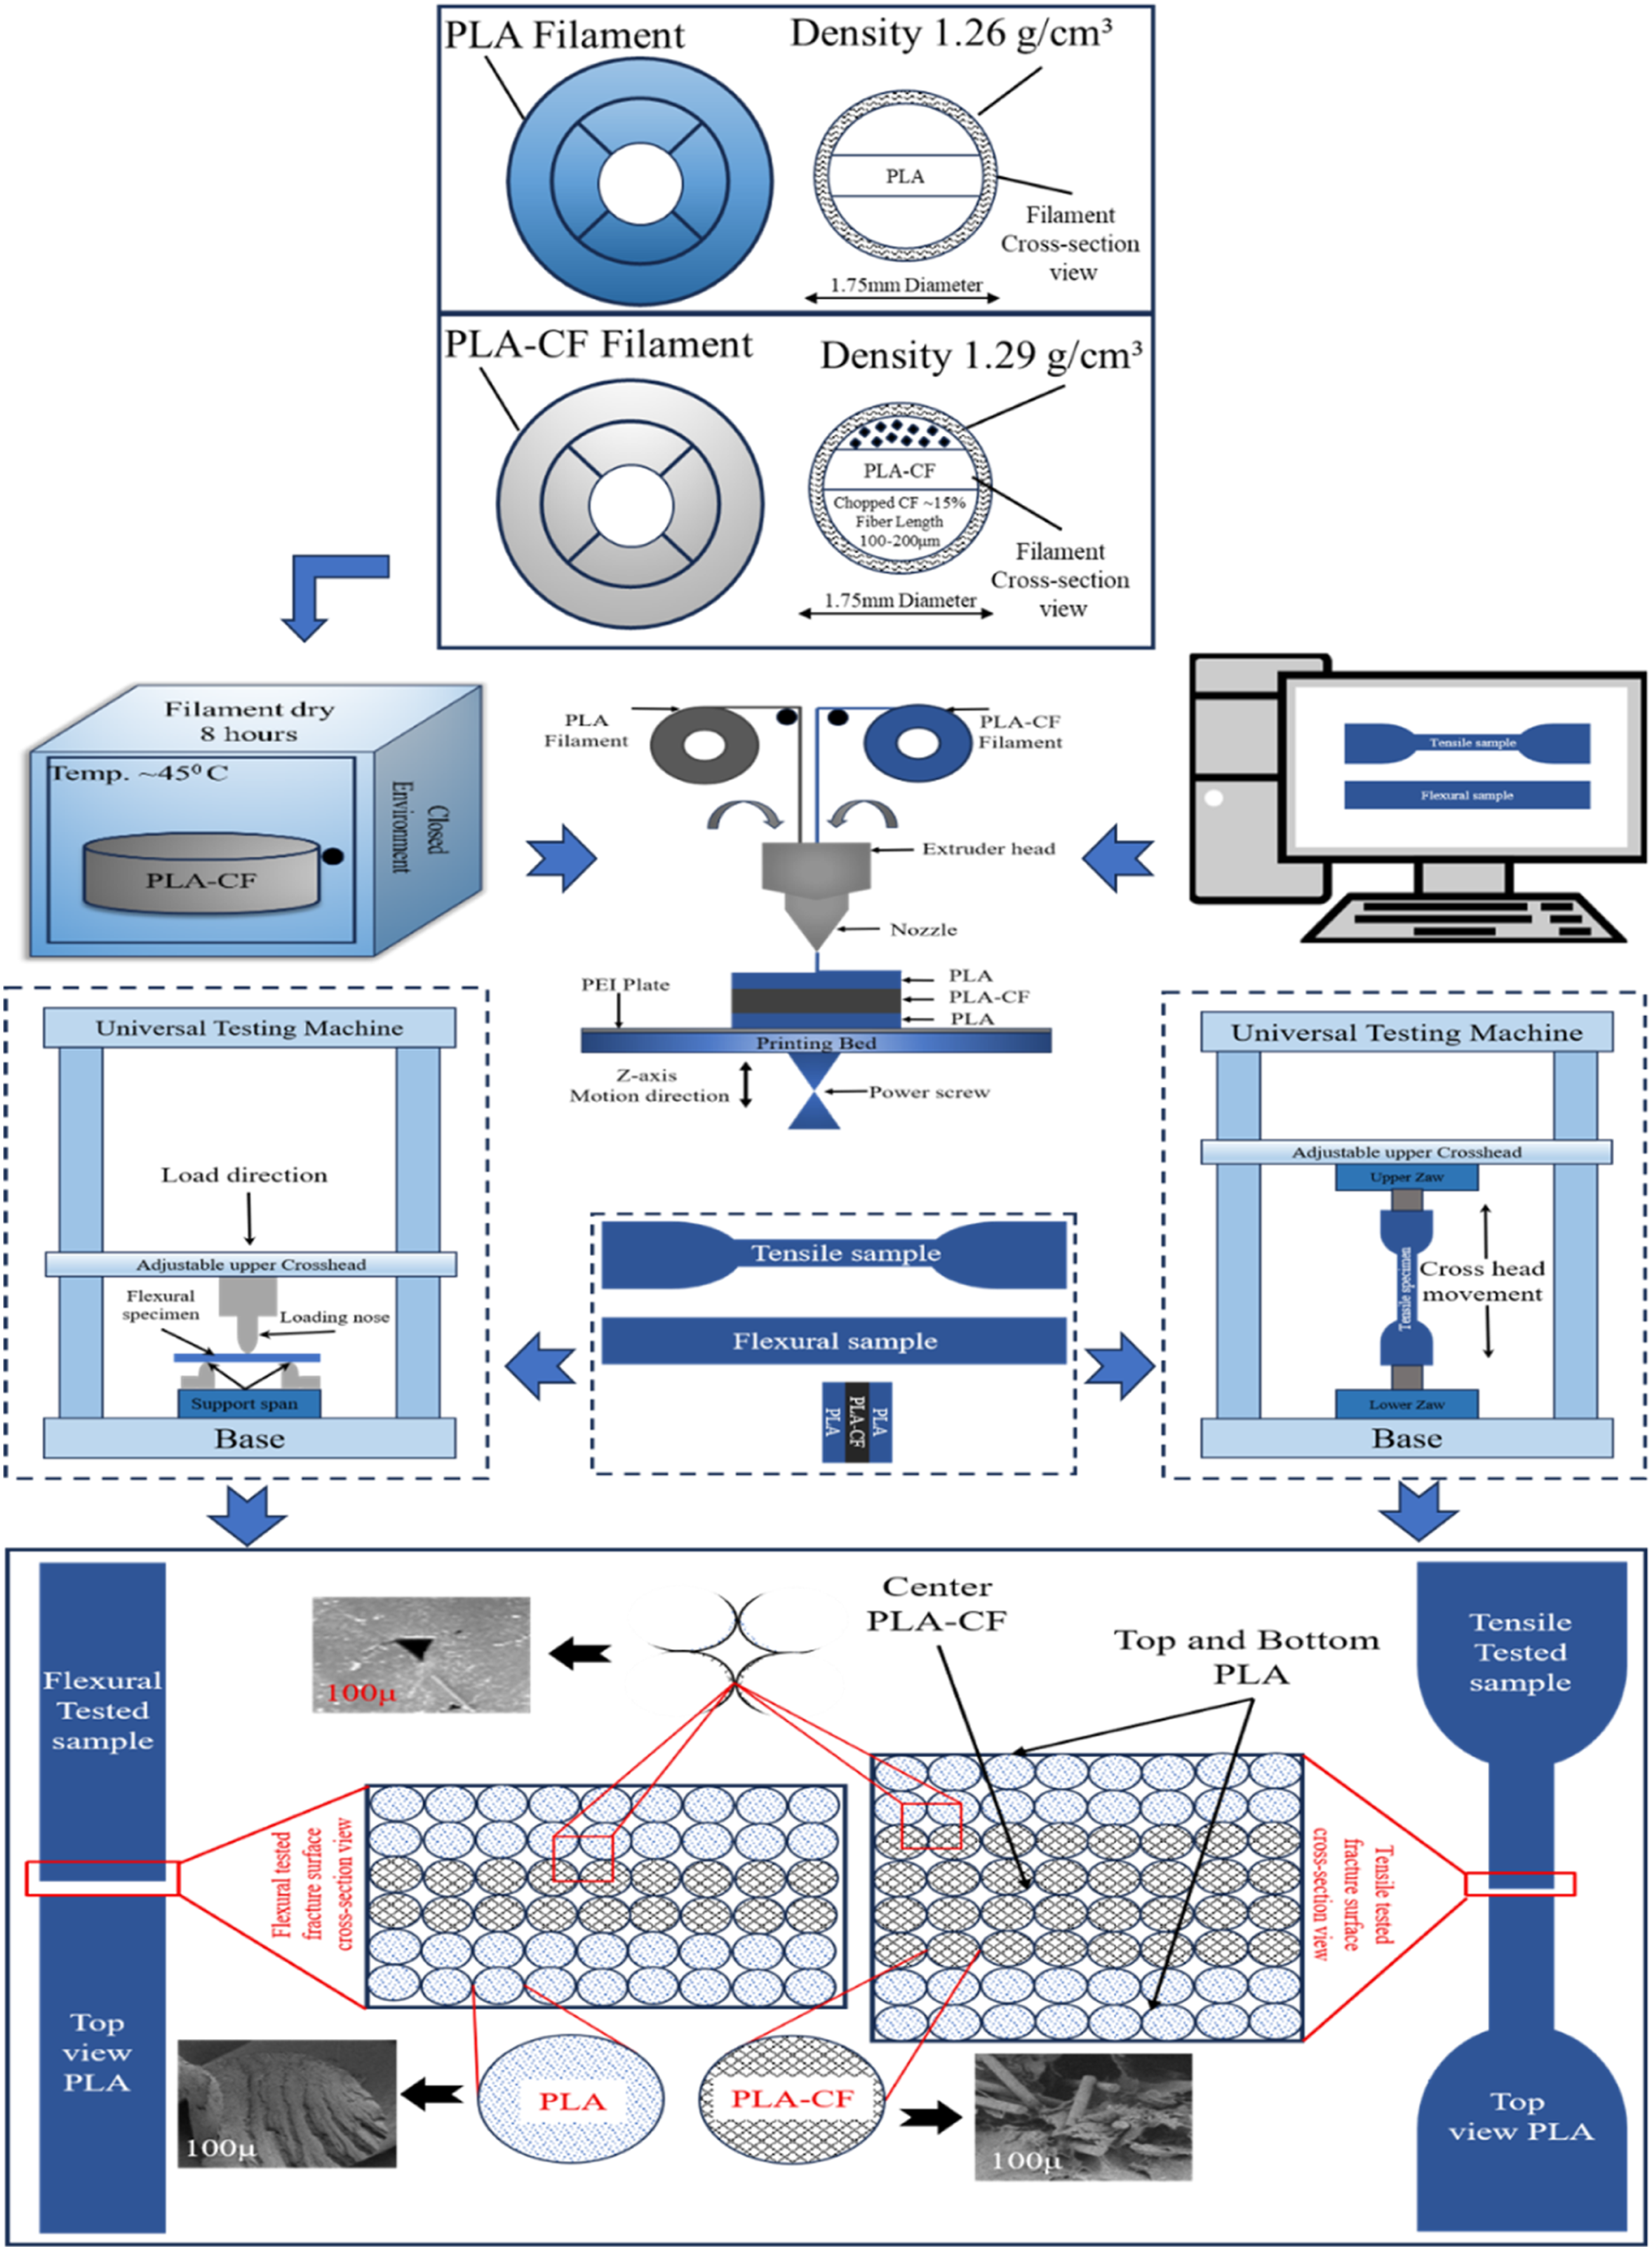
Workflow diagram showing PLA/PLA-CF sandwich composite manufacturing and mechanical testing.
Since the load is carried axially by the fibers rather than by the weaker interlayer bonds, a raster angle of 0° (aligned with the loading direction) was fixed for the constant parameters since it consistently produces the maximum tensile strength and modulus when compared to 45° or 90° orientations. For the cellular core in every specimen, an infill density of 80% was employed. FDM-printed PLA-CF needs a denser structure to preserve shear rigidity and avoid premature failure because of intrinsic voids and weak interlayer bonding, even though sandwich systems usually use extremely porous cores.
33
While 80% infill offers almost solid support, reduces stress concentrations, and still permits weight reduction, lower infill decreases load-bearing capability and encourages buckling. Literature that reports excellent strength, toughness, and energy absorption at high infill densities supports this decision.
27
The ultimate tensile strength and flexural characteristics of printed components are greatly improved by increasing infill density, according to published research.
35
Temperatures (Bed 90°C, Nozzle 220°C): Since fibre-reinforced filaments usually require higher temperatures than pure PLA to reduce viscosity and prevent clogging, the nozzle temperature of 220°C was used to enable proper melting of the PLA-CF composite. For the first layer in particular, a bed temperature of 60°C is used to encourage adhesion and avoid warping, which is essential for preserving dimensional precision.
36
The flat construction orientation (XY plane) was chosen because, as a result of the anisotropy present in the FDM process, specimens printed in this orientation had higher mechanical strength than those printed in the upright (Z-axis) direction. Figure 2 shows the geometric arrangements of the three chosen infill patterns Gyroid, Tri-Hexagon, and Honeycomb to give a thorough grasp of the internal meso-structure. Every pattern was created using two wall loops and a consistent infill density. Top-section views of infill patterns generated by slicing software: (a) Gyroid, (b) Tri-hexagon, and (c) Honeycomb.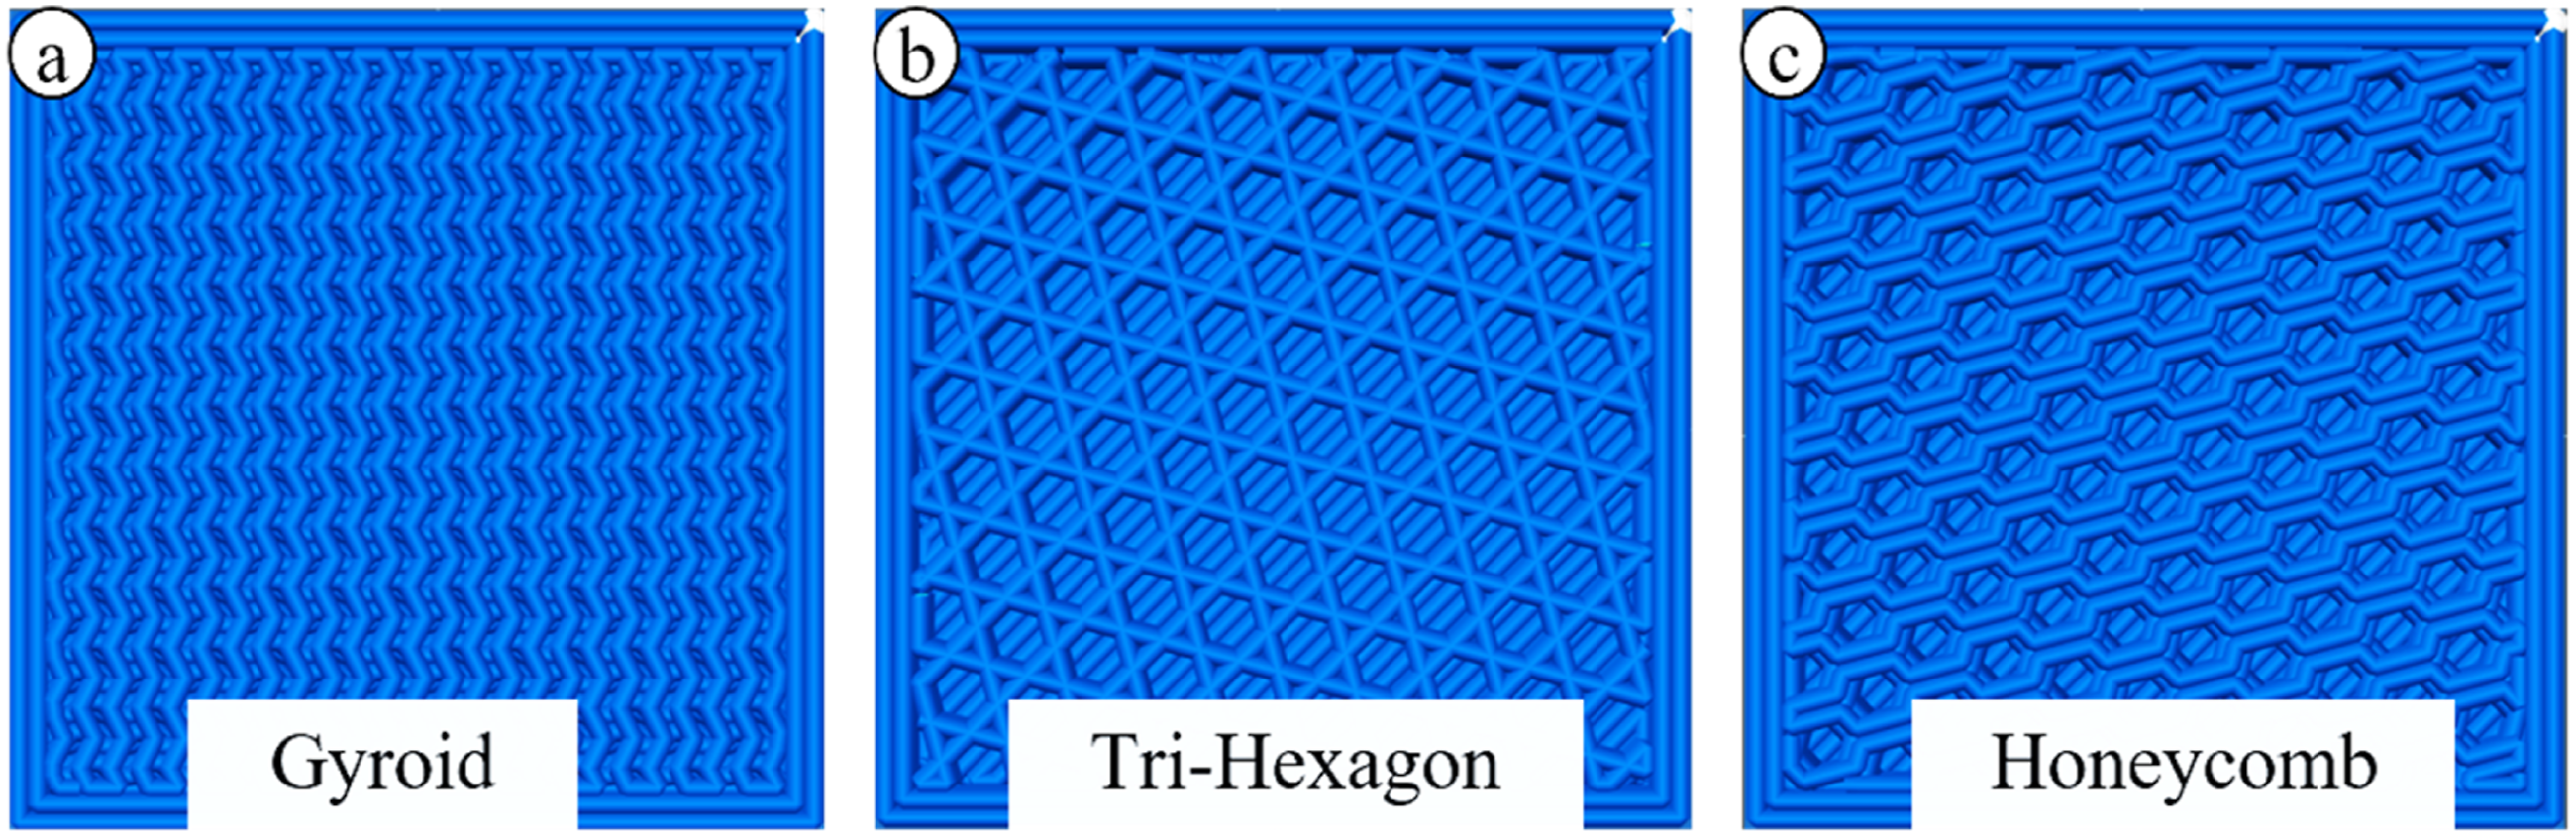
Method and sample preparation
Taguchi L27 orthogonal array design matrix.
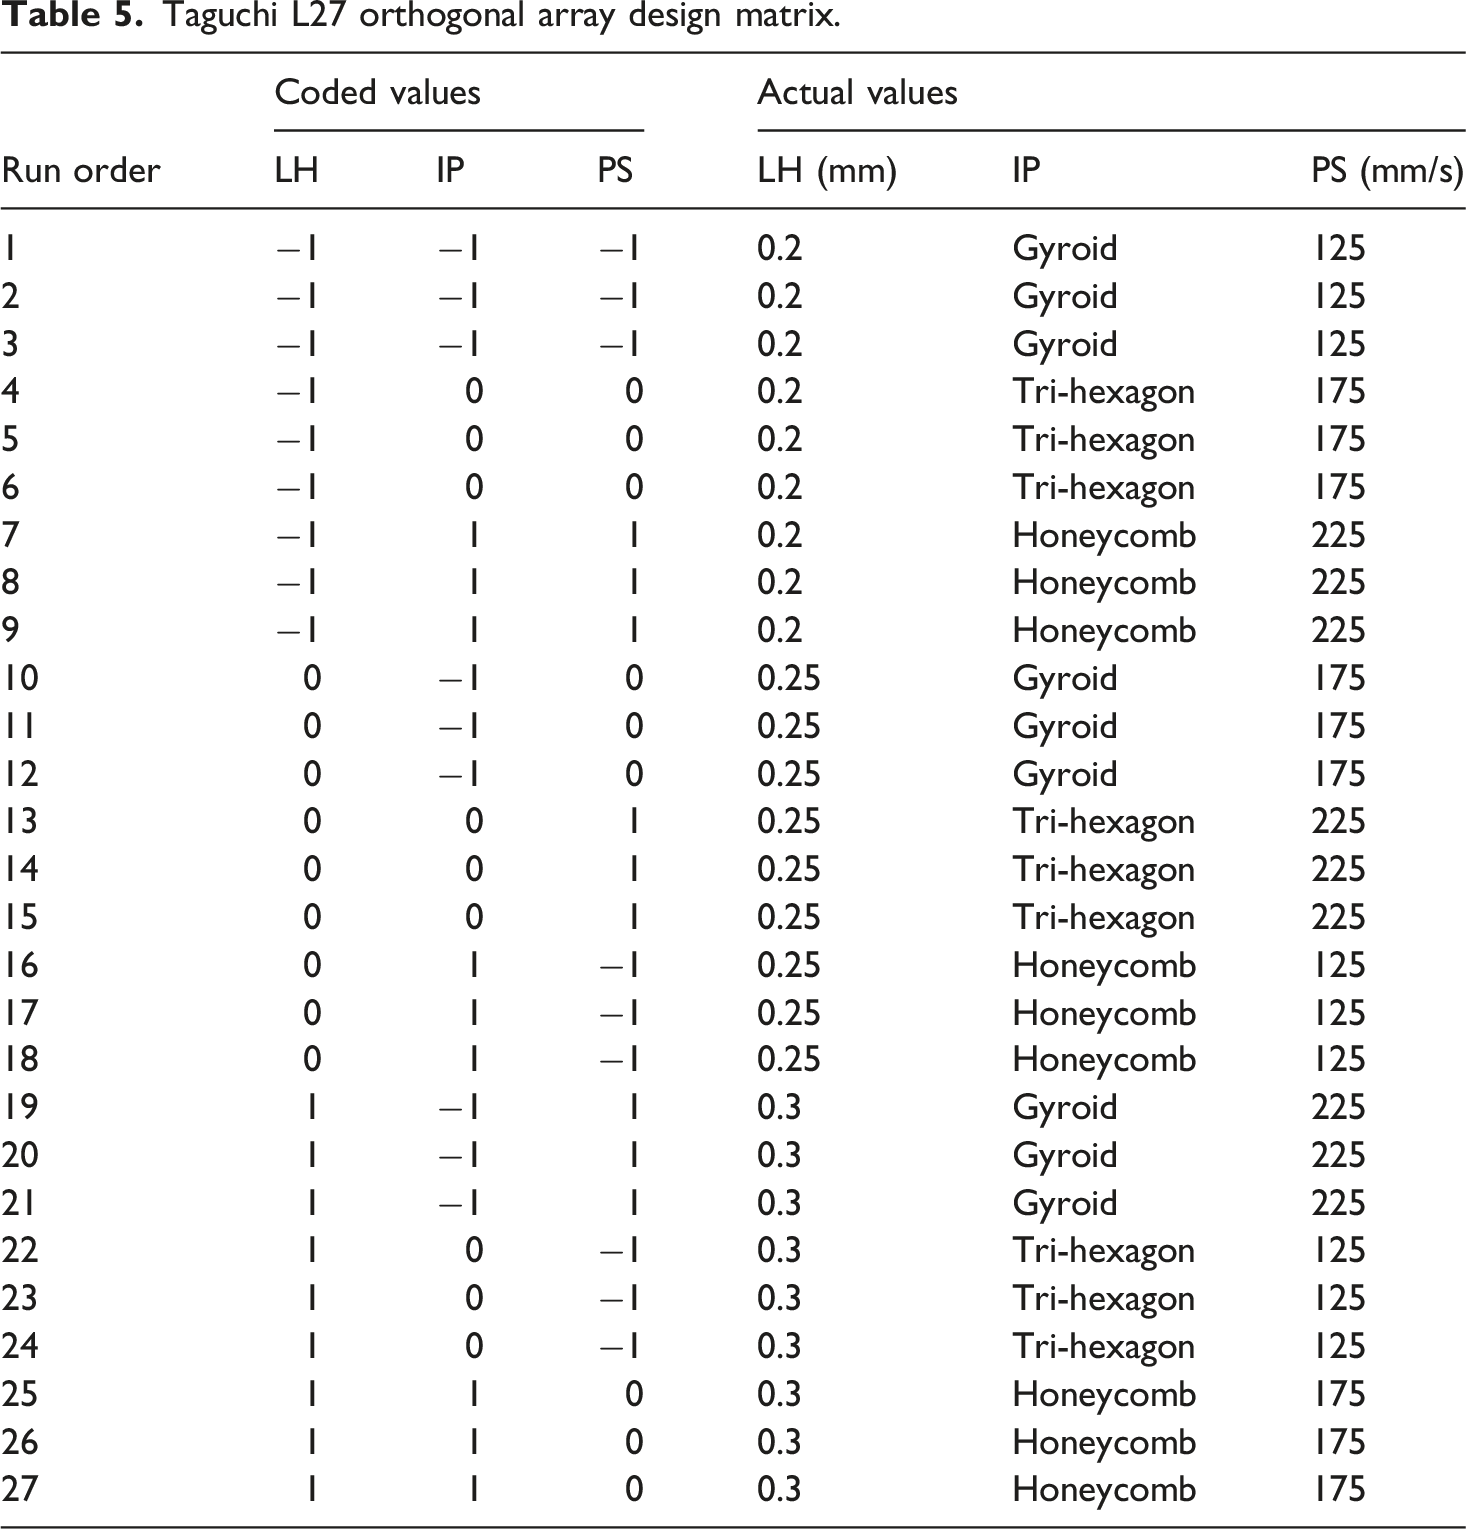
The entire process for creating tensile and flexural sandwich specimens in compliance with ASTM guidelines and the Taguchi L27 design matrix (Table 5) is depicted in Figure 3. Where a Bambu Lab X1 Carbon 3D printer was used to create each of the 27 experimental combinations of layer height, infill pattern, and printing speed on both specimen types.
8
The flexural specimen geometry in Figure 3(a) is in accordance with ASTM D790 and consists of a rectangular bar measuring 127 mm in length, 12.7 mm in width, and 3.2 mm in thickness.8,37 While the tensile specimen in Figure 3(b) is equivalent to an ASTM D638 Type IV dog-bone sample with a total length of 115 mm, 6 mm gauge width, and 4 mm thickness. In order to assign the process parameters from the L27 array and generate the G-code for printing on the X1 Carbon printer, which has a 0.4 mm hardened steel nozzle. A 1.75 mm filament system, and a 256 × 256 × 256 mm3 build volume, the CAD models for both geometries were first created in AutoCAD and exported as STL files. These files were then imported into Bambu Studio (Bambu Slicer). The actual fabrication of the flexural and tensile specimens, respectively, on the textured PEI build plate of the Bambu X1 Carbon is depicted in Figure 3(c) and (d). The enclosed-chamber and automatically levelled bed conditions guarantee dimensional accuracy and stable thermal behaviour. Sample preparation: (a) flexural sample ASTM D790, (b) tensile sample ASTM D638 type IV, (c) printing flexural sample with Bambu X1 carbon printer, (d) printing tensile sample with Bambu X1 carbon printer, (e) printed flexural sample with top and bottom PLA and center with PLA-CF, (f) printed tensile sample with top and bottom PLA and center with PLA-CF.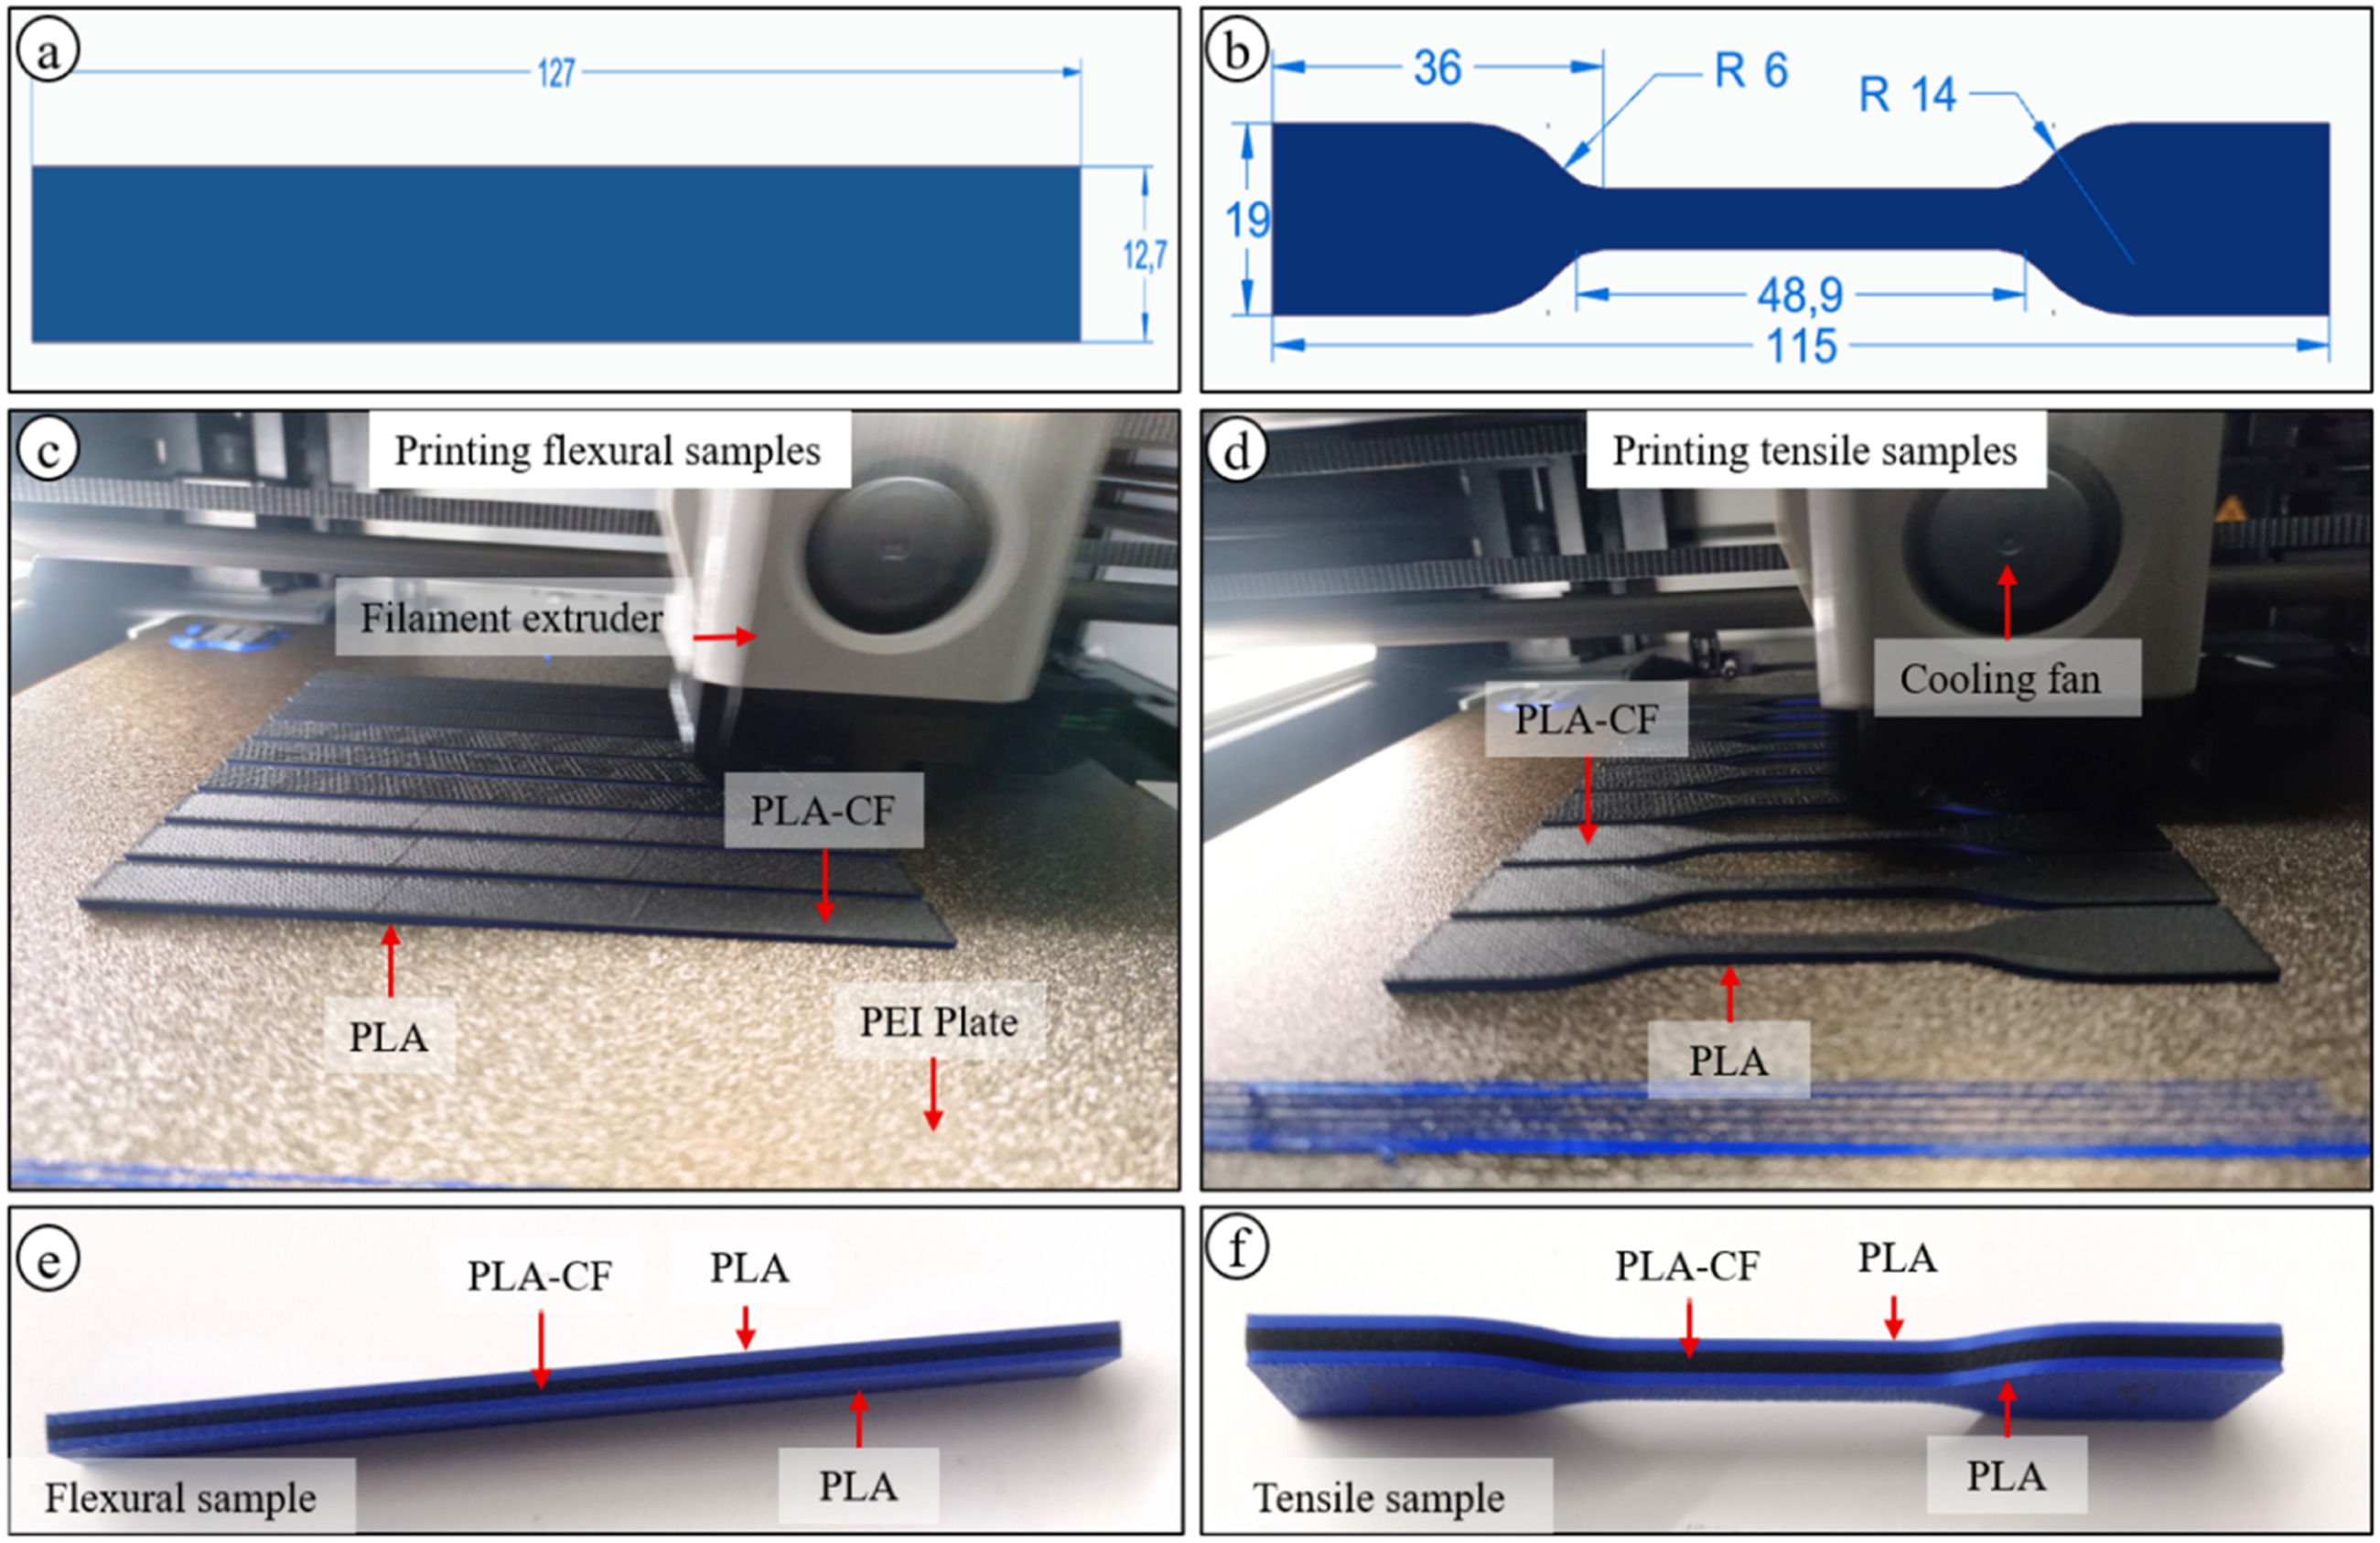
The flexural sandwich specimen in Figure 3(e) has a total thickness of 3.2 mm after printing, divided into three equal layers with roughly 1.07 mm PLA at the top, 1.07 mm PLA-CF in the middle, and 1.07 mm PLA at the bottom. PLA is deposited as the outer skin and PLA-CF in the core region. In contrast to the tensile sandwich specimen in Figure 3(f), which has a 4 mm thickness divided into 1 mm PLA on the top surface, 2 mm PLA-CF in the core, and 1 mm PLA at the bottom. It is important to note that the macroscopic layer distribution differs slightly between the tensile and flexural specimens. This variation is strictly dictated by the geometric constraints of the testing standards utilized. The ASTM D638 Type IV tensile specimens require a total thickness of 4.0 mm, which was achieved using a symmetric arrangement of 1 mm PLA skins enclosing a 2 mm PLA-CF core. Conversely, the ASTM D790 flexural specimens necessitate a total thickness of 3.2 mm to ensure a valid span-to-depth testing ratio. Consequently, the flexural structures were fabricated with three equal structural layers of approximately 1.07 mm for the top skin, core, and bottom skin. Because FDM relies on discrete layer heights, adjusting the layer count was necessary to adhere to these standardized overall thicknesses. Despite these variations in absolute layer counts, a macroscopically symmetric sandwich configuration was maintained in all specimens to prevent undesirable bending-extension coupling during mechanical loading.
The produced specimens are mechanically categorized as sandwich constructions rather than conventional solid laminates, although having three macroscopic layers. This difference results from the interior meso-structure: the outside PLA skins function as denser face sheets, while the central PLA-CF core is printed with lightweight, porous cellular structures (Gyroid, Tri-Hexagon, and Honeycomb infill patterns). This arrangement enables the structure to function under traditional sandwich panel mechanics, in which the cellular core effectively resists shear pressures while reducing the component’s overall weight, and the dense outer skins bear the majority of the bending stresses. This ensures uniform material distribution for all L27 parameter combinations before mechanical testing. Figure 4 depicts the whole tensile and flexural prepared specimen, with Figure 4(a) displaying all 27 tensile samples and Figure 4(b) displaying the flexural sample.
38
Complete prepared sample follows L27 Metrix (a) tensile samples (b) flexural samples.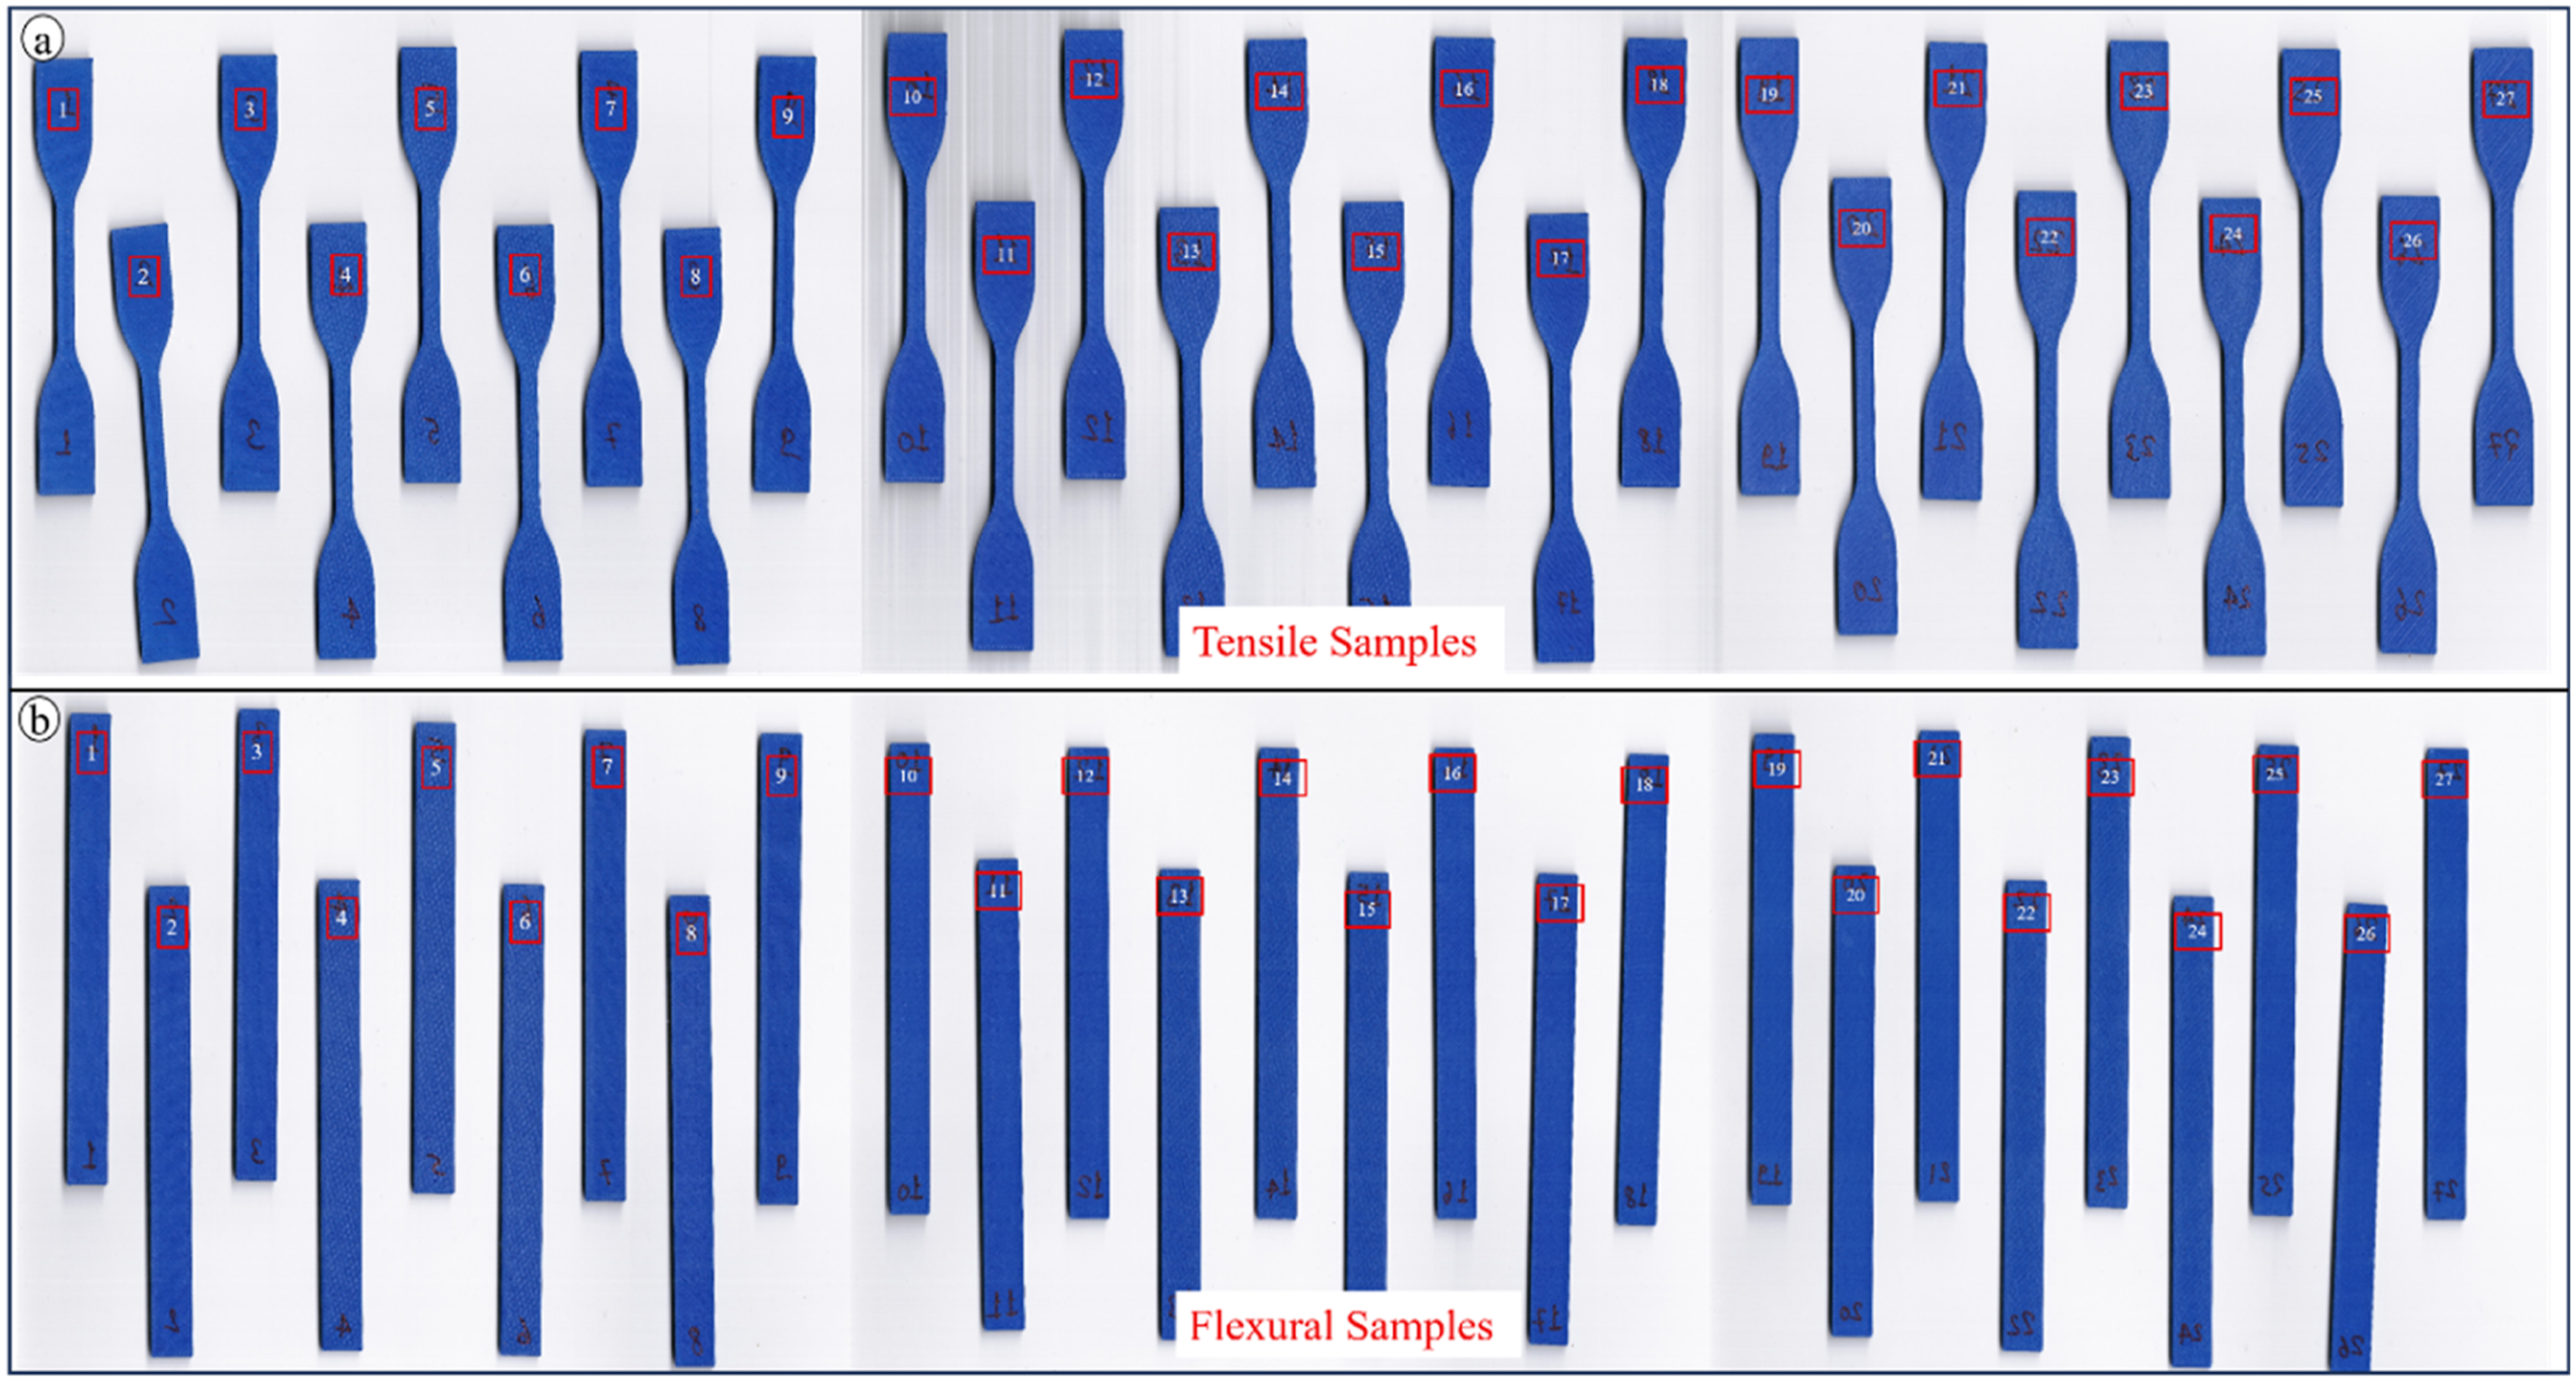
Mechanical characterization
As shown in Figure 5, the PLA/PLA-CF sandwich structures’ mechanical performance was assessed using a Zwick Roell Z010 universal testing machine (UTM) for tensile and flexural testing shown in Figure 5(a) at room temperature (23°C –25°C). Three-point bending tests were used to evaluate flexural qualities in compliance with ASTM D790 guidelines.38,39 To achieve quasi-static loading conditions, the specimens were placed on a certain support span and subjected to a constant crosshead speed of 1 mm/min. This allowed for the precise estimation of σflex and Ef from the load-deflection data.
33
The experimental setup before and after loading is shown in Figure 5(b) and (c), respectively. These figures show the application of a mid-span load and the typical bending failure mode of the sandwich construction. Using the same Z010 UTM, ASTM D638 Type IV dog-bone specimens were subjected to tensile characterisation.
2
The specimens were clamped and axially oriented as indicated in Figure 5(d) and (e) to guarantee accurate stress-strain data free of dynamic effects. They were then exposed to a continuous strain rate of 1 mm/min till fracture. The σUTS, Et, and Ɛf for the composite laminates were then calculated by analysing the recorded force-extension data.
40
Tensile and flexural testing: (a) Zwick/Roell Z010 universal testing machine setup, (b) flexural testing with specimen before loading, (c) close-up after downward loading deformed flexural specimen, (d) tensile testing with specimen before loading, and (e) fractured tensile sample after cross-head loading with close-up view.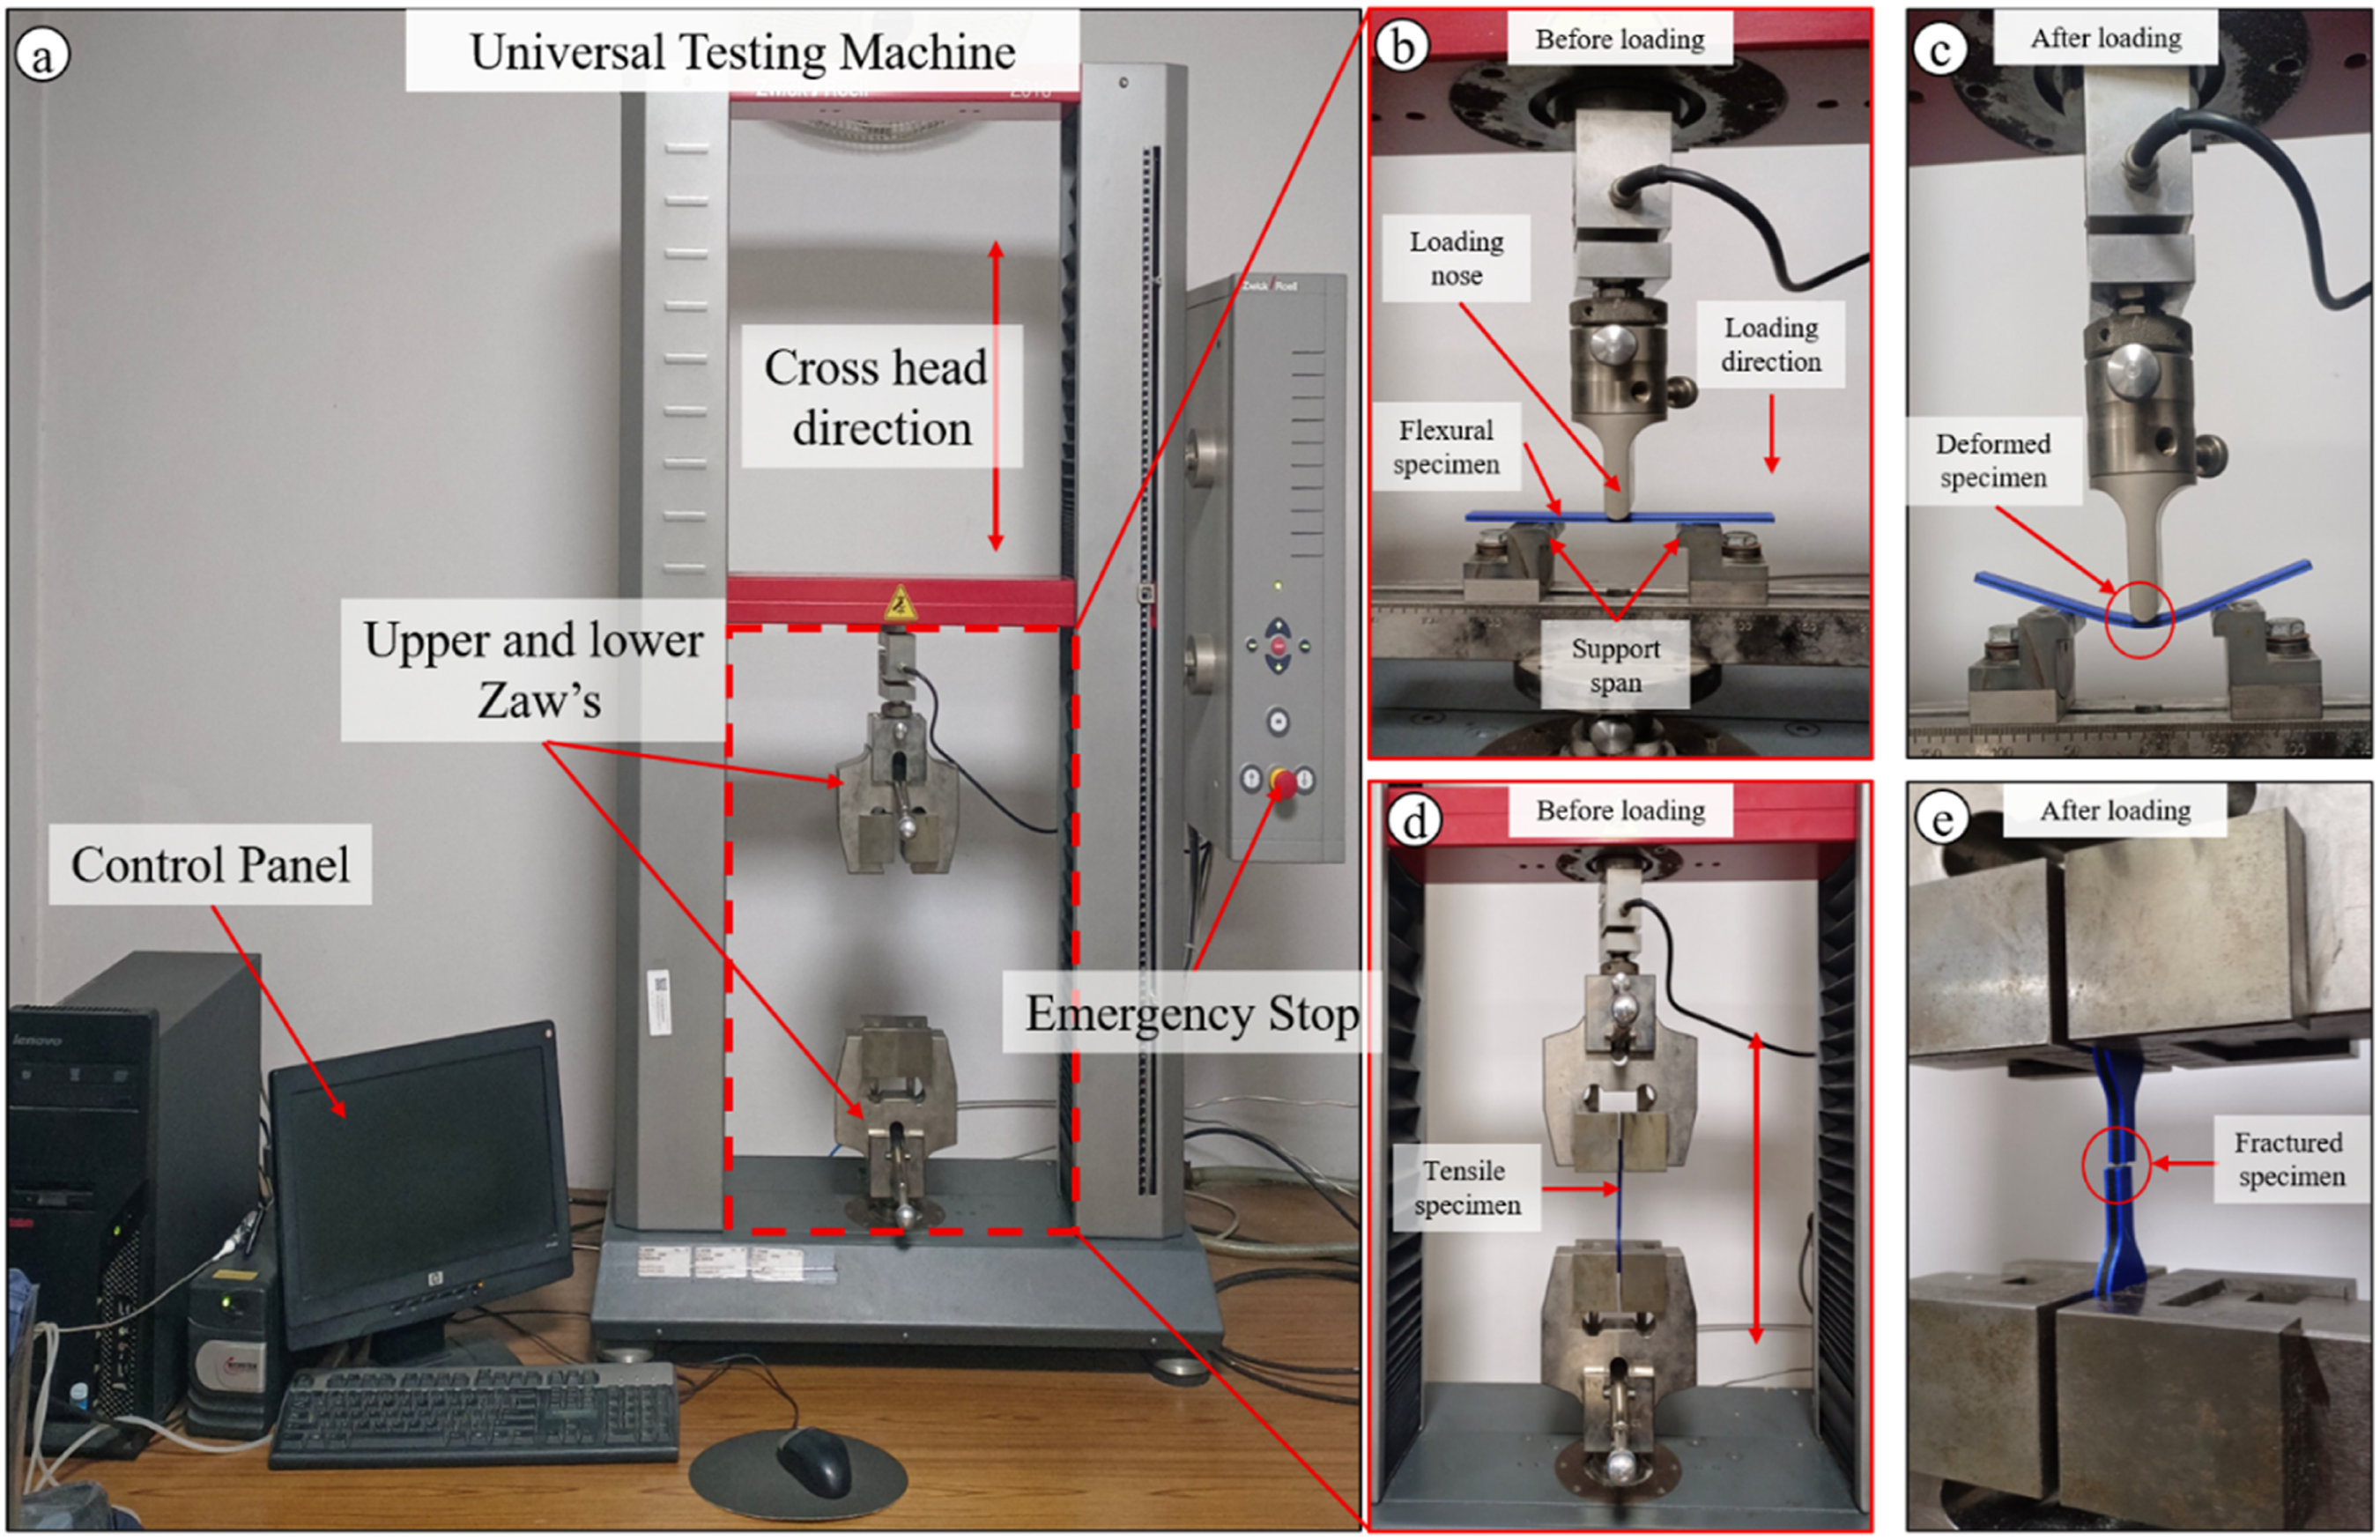
Results and discussion
Stress-strain behavior
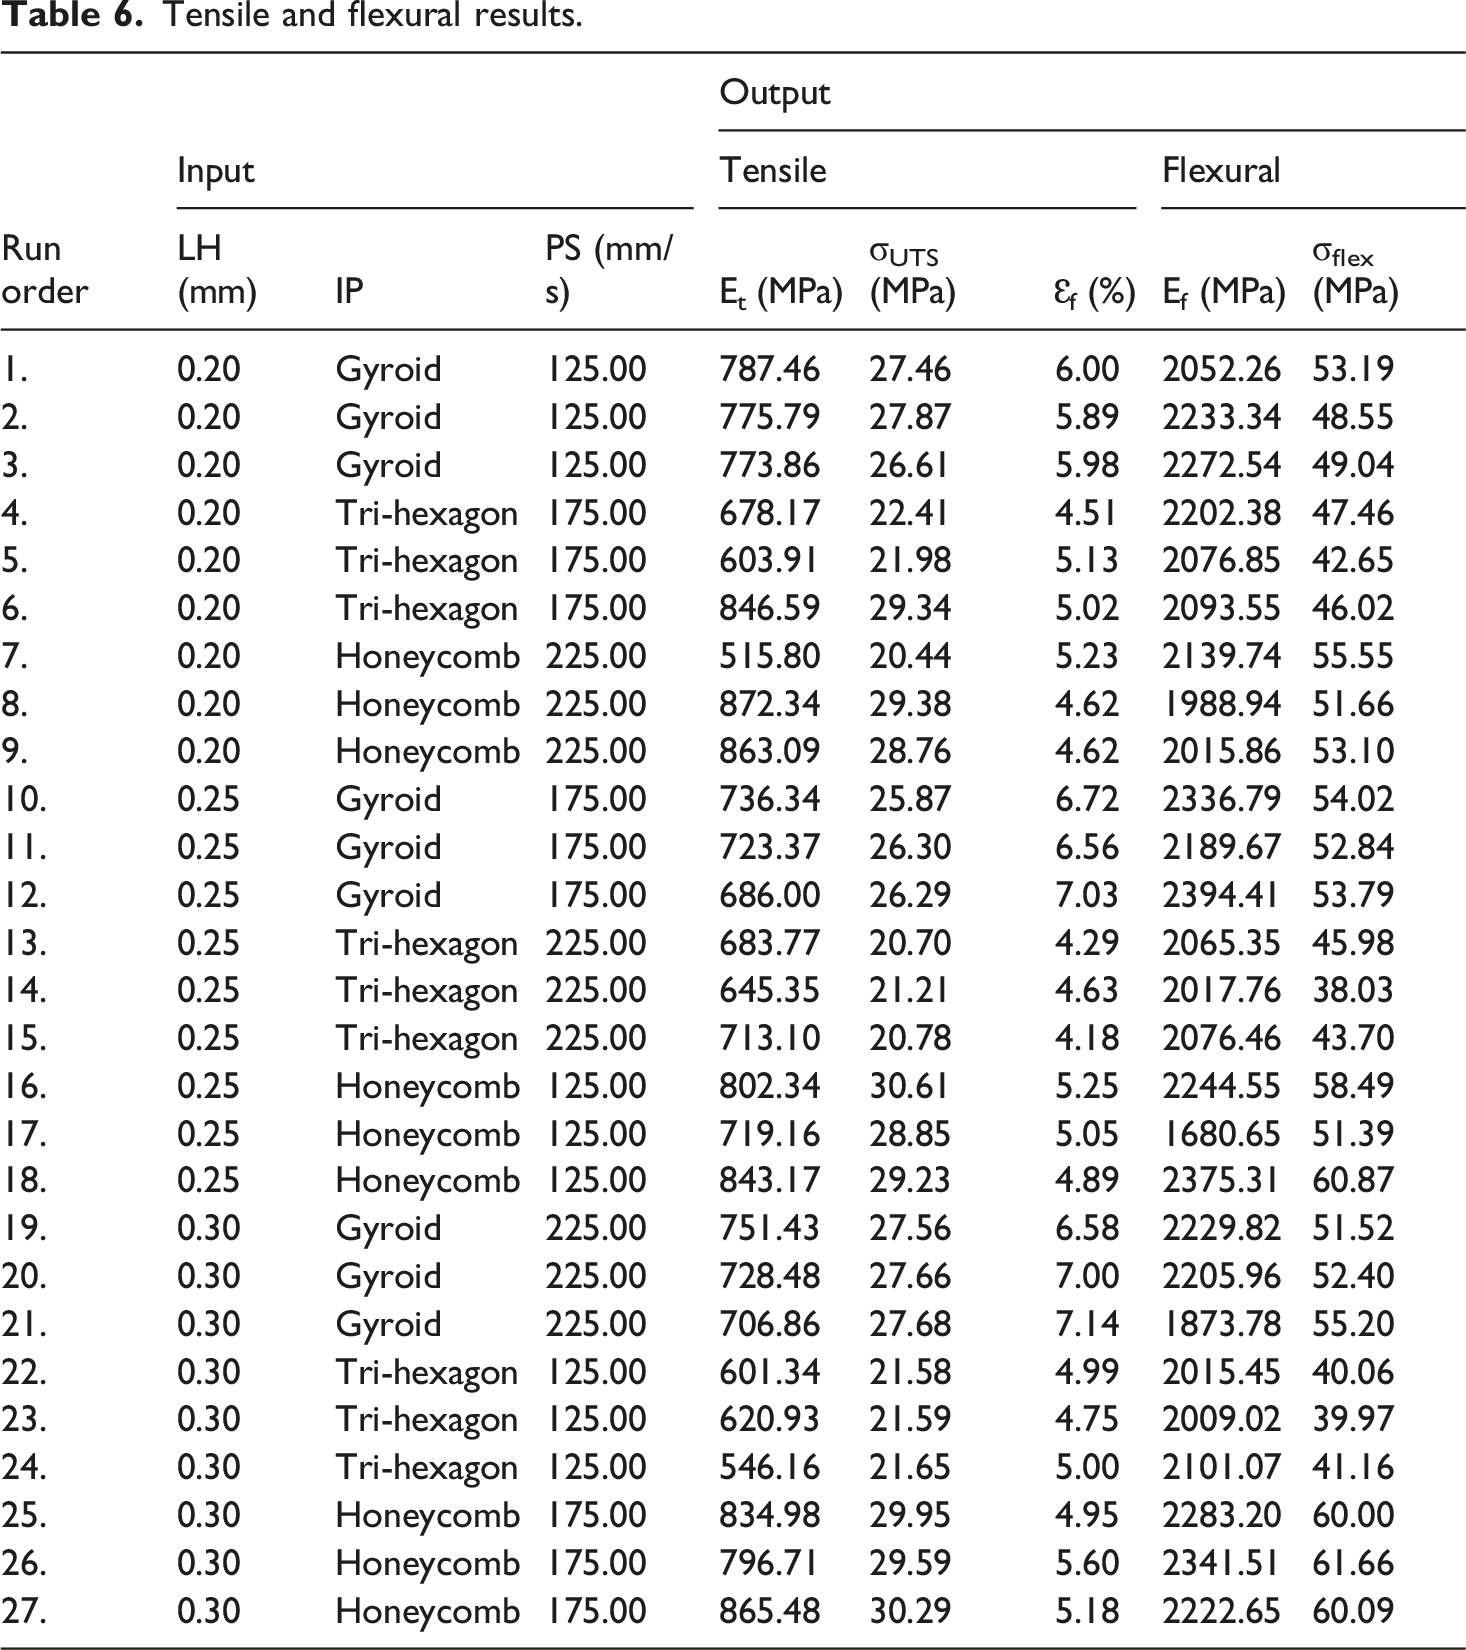
Tensile and flexural results.
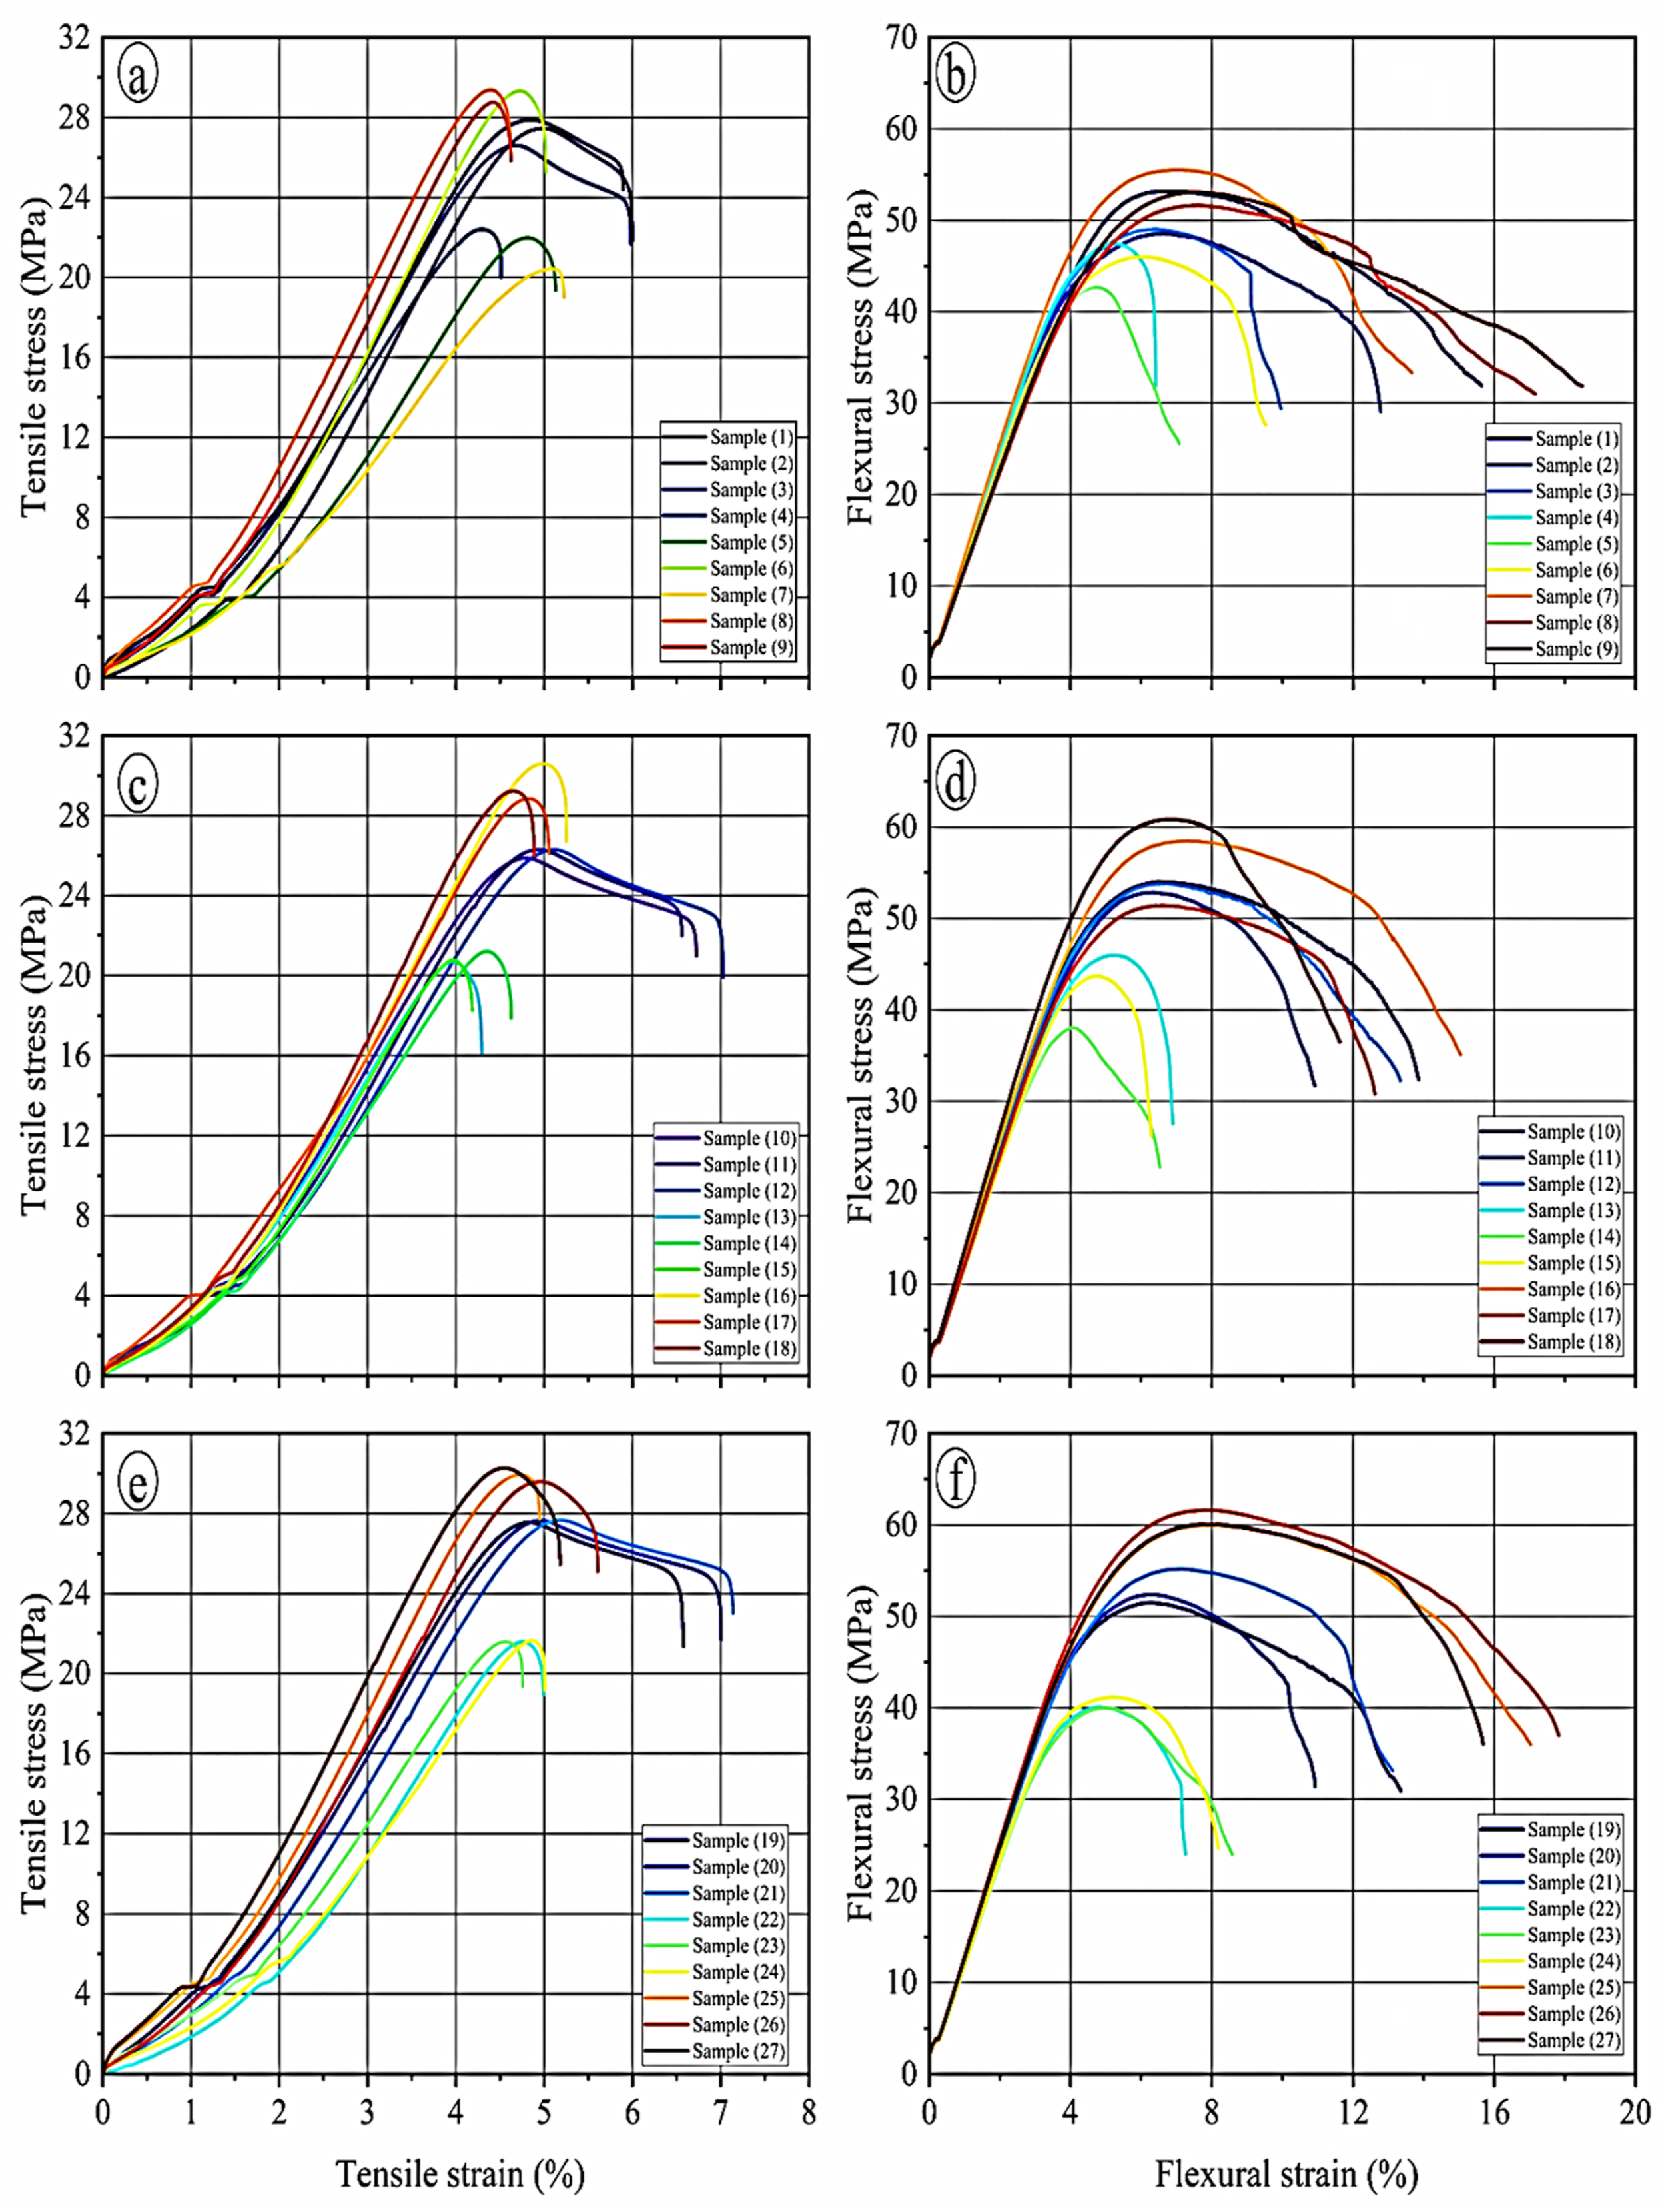
Tensile and flexural stress-strain curve: (a) layer height 0.2 mm, tensile sample no. (1−9), (b) layer height 0.2 mm, flexural sample no. (1−9), (c) layer height 0.25 mm, tensile sample no. (10−18), layer height 0.25 mm, tensile sample no. (10−18), (d) layer height 0.3 mm, tensile sample no. (19−27), (e) layer height 0.3 mm, flexural sample no. (19−27).
Tensile stress-strain response
The tensile stress-strain behaviour of the specimens made at layer heights of 0.20, 0.25, and 0.30 mm, respectively, is shown in Figure 6(a), (c), and (e). A primarily brittle to semi brittle failure in PLA/PLA-CF sandwich structure is characterized by curves that show an initial linear elastic region followed by a nonlinear hardening stage that ends in a clear peak stress and a relatively abrupt drop in all three subfigures. With peak values grouped in a narrow band and little scatter in the elastic slope, the specimens achieve the highest and most consistent ultimate tensile stresses at 0.20 mm layer height Figure 6(a). Figure 6(c) show uniform stiffness and good interlayer consolidation for the various infill patterns and printing speeds. The curves for several samples show slightly lower peak stresses and a slight increase in tensile strain at failure as the layer height increases to 0.25 mm. Also Figure 6(e) suggests that thicker deposited filaments introduce a slightly more compliant microstructure with improved deformability but slightly lower strength. A clear trade-off between strength and ductility is evident at 0.30, where several curves extend to even higher tensile strains before fracture while maintaining comparable or slightly reduced peak stresses. Although there is a minor increase in macroscopic strain-at-break in specimens printed at thicker layers (0.30 mm), this should not be confused with actual plastic deformation. Instead, the geometric limitation and thermal fusion between neighbouring deposited filaments are lessened by raising the layer height. According to recent research on FDM-printed composites, the failure mechanism is changed by this decreased constraint and the ensuing inter-bead gaps. The structure experiences progressive failure characterized by void-induced crack deflection, localized layer slippage, and significant fibre pull-out rather than catastrophic brittle fracture. Because of the stress-concentrating effects of the inter-layer gaps, these progressive damage mechanisms dissipate energy and appear macroscopically as a protracted strain-to-failure (pseudo-ductility), which naturally comes at the direct expense of ultimate tensile strength. 20
Flexural stress-strain response
The resulting flexural stress–strain curves for layer heights of 0.20, 0.25, and 0.30 mm are shown in Figure 6(b), (d), and (f), which also illustrates the bending response of the same parameter combinations. The curves in all three subfigures climb almost linearly at first, indicating elastic bending, until reaching a maximum flexural stress that is significantly larger than the tensile peak stress. In Figure 6(b) this is followed by a more gradual post-peak softening as opposed to the sudden decrease shown in tension. With a rather close grouping of the curves and peak flexural stresses in the range of approximately 48–56 MPa at 0.20 mm. The specimens demonstrate that fine layering in conjunction with the selected infill designs produces stiff, robust, and generally stable bending behaviour. While maintaining comparable levels of maximum flexural stress, increasing the layer height to 0.25 mm Figure 6(d) results in more variation in the softening region’s onset and slope. 42 This suggests that as road thickness increases, the flexural response becomes more sensitive to local defects and interlayer adhesion. Figure 6(f) show thicker layers increase the specimens’ ability to withstand large bending deformations with progressive damage rather than catastrophic fracture. This is demonstrated by the numerous curves that extend to the largest flexural strains in the dataset at 0.30 mm, sometimes surpassing 15%–18%, while still achieving high peak stresses. In line with the general behaviour of additively manufactured polymer composites under flexural loading, the overall evolution of the flexural curves shows that, while flexural stiffness and strength remain relatively robust against moderate changes in layer height, the ductility and post peak energy dissipation in bending improve noticeably at higher layer heights. 6
Main effect plots for mechanical responses
The main effect plots from the Taguchi L27 design for (a) Et (MPa), (b) σUTS (MPa), (c) Ɛf (%), (d) Ef (MPa), and (e) σflex (MPa) as a function of layer height, infill pattern, and printing speed are shown in Figure 7. Each plot’s horizontal red line shows the overall mean of the corresponding response; variations from this line show how each factor level affects the printed specimen’s mechanical behaviour. Figure 7(a) The infill pattern is unquestionably the most important element for Et. In comparison to Honeycomb and Tri-Hexagon patterns (≈660–663 MPa), specimens printed with a Gyroid infill exhibit the highest rigidity (≈748 MPa), representing an improvement of roughly 12%–13%. The Gyroid architecture’s continuous, three-dimensional load routes, which lessen stress concentrations and enhance load transfer throughout the structure, are responsible for this behaviour. Layer height and modulus show an inverse relationship: greater inter-layer bonding and lower void content at thinner layers result in an increase in Et from ≈712 MPa to ≈750 MPa when layer height is decreased from 0.30 mm to 0.20 mm. Both lower and higher printing rates result in a minor decrease in stiffness, indicating that an intermediate speed offers the optimal balance between filament fusion and heat degradation. Printing speed exhibits an optimum at 175 mm/s, when Et is maximized.
27
The hierarchy for σUTS in Figure 7(b) shows that the Honeycomb design produces the highest ultimate tensile strength (∼28.5 MPa), while the Tri-Hexagon pattern shows the lowest (∼22.5 MPa), a difference of around 27%. An intermediate strength (∼27.0 MPa) is provided by the Gyroid network’s continuous aspect. Hexagonal tiling, which effectively distributes planar stresses, provides strong bonding between neighbouring raster, and reduces localized stress concentrations within the core linkage chain before to failure, is responsible for the Honeycomb pattern’s improved ultimate tensile strength. With a distinct maximum at 125 mm/s, printing speed has a significant impact; at this speed, adequate heat and dwell duration guarantee strong interfacial bonding without undue thermal damage. Within the examined range, strength is nearly unaffected by changes in layer height and declines at higher speeds, most likely as a result of incomplete fusion. This suggests that internal architecture and bonding quality are more important in determining σUTS than layer thickness.
43
Main effect plots of Taguchi L27 responses showing the influence of layer height, infill pattern, and printing speed on (a) Et (MPa), (b) σUTS (MPa), (c) Ɛf (%), (d) Ef (MPa), (e) σflex (MPa), (Red horizontal line in each plot represents the overall mean).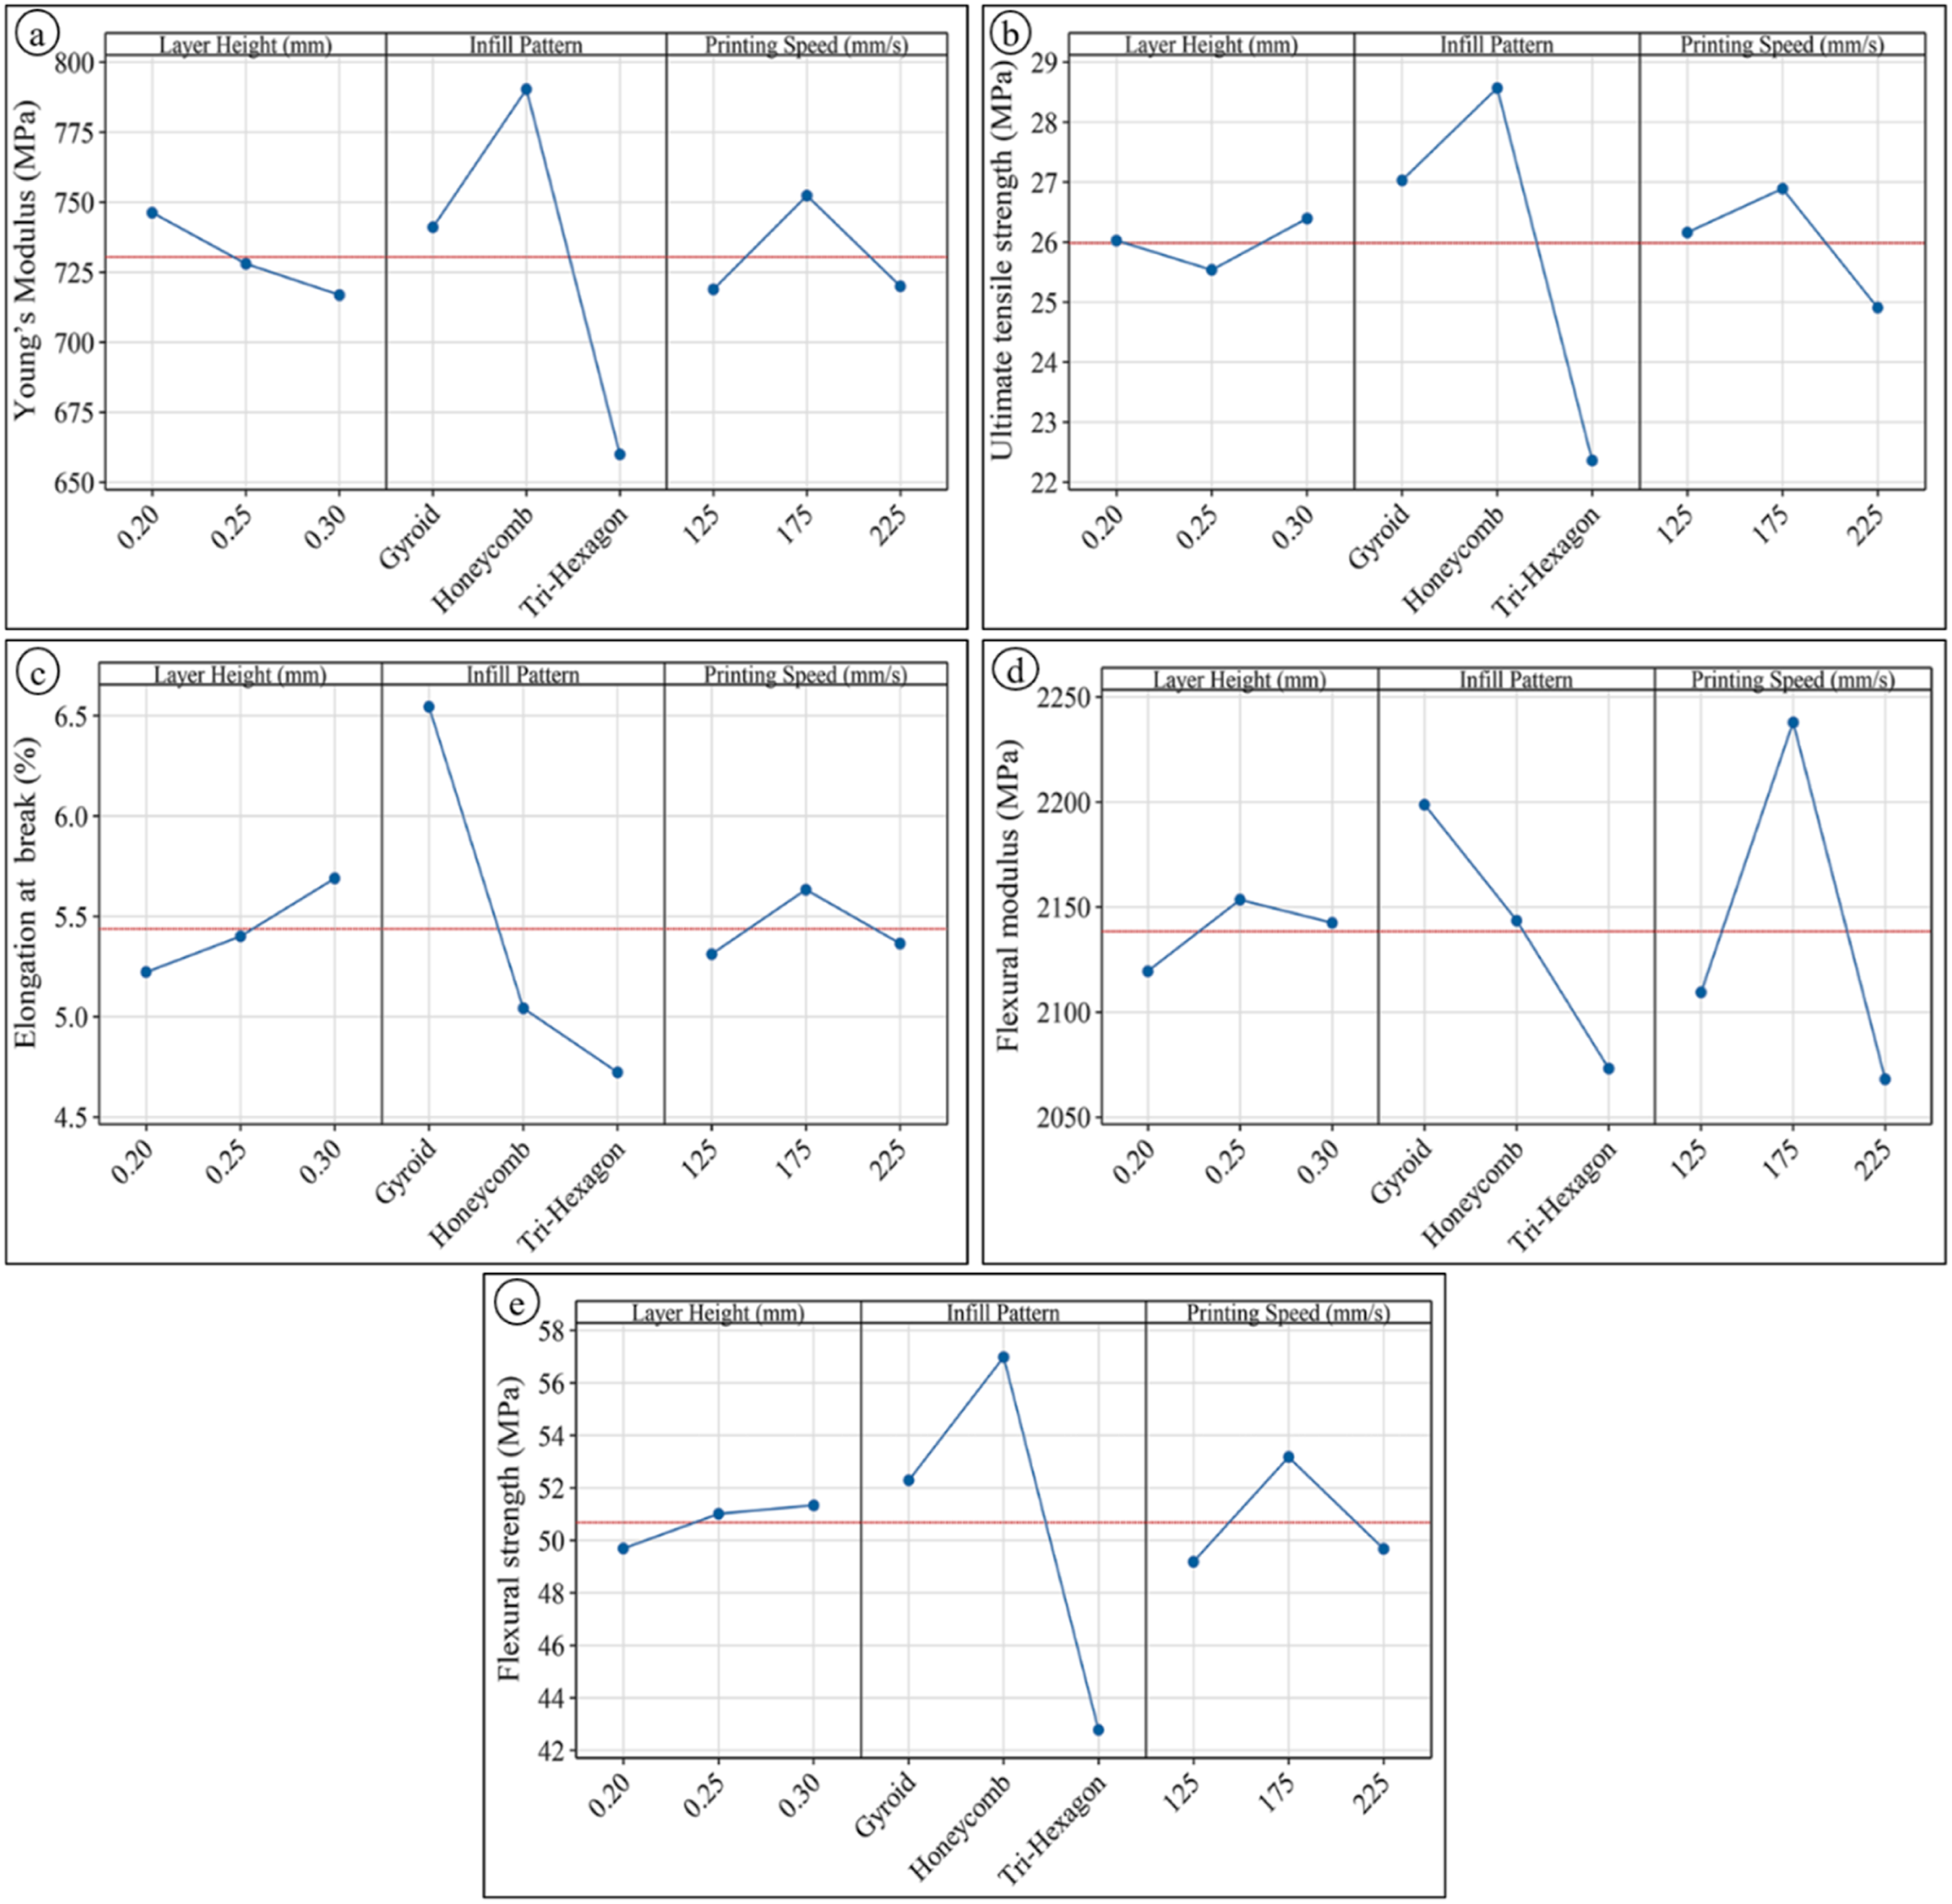
Both layer height and infill pattern are significant factors for Ɛf Figure 7(c). Moreover, raising the layer height to 0.30 mm dramatically changes the thermal history of the deposited bead from a macromolecular and thermodynamic standpoint. Because thicker layers have a lower surface-area-to-volume ratio, they cool more slowly. More macromolecular relaxation and longer fibre pull-out under stress are made possible by this extended retention of thermal energy, which also increases polymer chain mobility and encourages localized crystallization inside the PLA matrix. Furthermore, building the core with thicker layers naturally reduces the overall number of stacked layers needed. Defects at the interfaces are less likely to occur when there are fewer layers, which lowers the overall density of weak boundary points where premature interfacial cracking usually starts. Honeycomb exhibits the lowest ductility values (∼5.0%), while Gyroid infill produces the highest values (≈6.5%), suggesting that a continuous architecture not only fortifies the material but also permits more deformation prior to fracture. Ɛf rises with layer height, in contrast to Et and σUTS; samples printed at 0.30 mm had a greater Ɛf (≈5.7%) than those printed at 0.20 mm (∼5.2%). This pattern indicates that higher apparent elongation is produced by thicker layers at the direct expense of structural rigidity. This happens as a result of the physical constraint and fusion between neighbouring raster lines being lessened by the higher layer height. Before final collapse, the resulting weakly linked architecture allows for incremental inter-layer sliding and crack deflection, which manifests macroscopically as increased strain without revealing genuine material elasticity. 43
Compared to Et, the Ef in Figure 7(d) is relatively less susceptible to processing circumstances. The low effect of layer height (≈2100–2150 MPa across all levels) suggests that bulk cross-section and material characteristics, rather than slight differences in inter-layer bonding, dictate bending stiffness. Although it is less pronounced, the infill pattern still has a discernible impact: Gyroid achieves the highest Ef (∼2200 MPa), while Honeycomb provides the lowest (∼2080 MPa). Similar to the Et trend, the printing speed response peaks at 175 mm/s, suggesting that moderate rates promote a stronger microstructure under bending by attaining sufficient consolidation without overheating. A clear hierarchy appears when the flexural features in Figure 7(e) are assessed. The Honeycomb design offers the highest σflex (∼51–61 MPa), the Gyroid pattern shows intermediate values (∼48–54 MPa), and the Tri-Hexagon pattern has the lowest strength (∼38–47 MPa). This suggests that the Honeycomb pattern’s unique hexagonal tiling successfully resists bending moments by positioning additional material along the axis of maximal bending stress. In contrast, the discrete cell walls of the Tri-Hexagon pattern lack the continuous stress-transfer capability necessary to withstand flexural pressures, and the isotropic Gyroid network distributes material uniformly, making it less suitable for strictly unidirectional bending. Once more, layer height has little bearing, indicating that infill topology is the primary factor influencing bending failure. With better σflex at 125 and 225 mm/s, printing speed shows nonmonotonic, somewhat bimodal behaviour, suggesting that bending performance can be enhanced by varying cooling rate and filament alignment combinations. Figure 6 main effect plots show that layer height plays a secondary function, primarily influencing ductility and stiffness, whereas infill pattern is the primary design variable for all mechanical responses, followed by printing speed. While honeycomb or triangular patterns are better suited for components that are predominantly subjected to bending loads, gyroid infill is preferred when strong tensile stiffness and strength together with good elongation are required. 44
Signal-to-noise ratio analysis
The signal-to-noise (S/N) ratio graphs for (a) Et (MPa), (b) σUTS (MPa), (c) Ɛf (%), (d) Ef (MPa), and (e) σflex (MPa) as a function of layer height, infill pattern, and printing speed are shown in Figure 8. The vertical deviation of each point from the horizontal red line in each plot indicates the relative contribution of the factor level to the robustness of the mechanical behaviour of the printed specimens. The horizontal red line represents the overall mean S/N ratio of the corresponding response. The infill pattern shows the most variation in S/N ratio for Et in Figure 8(a), suggesting that it is the most important factor controlling tensile stiffness.
45
The highest S/N ratio is obtained by the Gyroid infill, followed by Tri-Hexagon and Honeycomb. This suggests that the continuous three-dimensional architecture of the Gyroid pattern reduces stiffness variability and promotes more efficient load transfer when compared to the more discrete cell-type structures. While the effect of printing speed is non-linear, with an intermediate speed providing the maximum S/N ratio and thus the most stable modulus, layer height exhibits a decreasing trend in S/N ratio with increasing level, suggesting that thinner layers enhance interlayer bonding and result in a stiffer and more consistent material.
46
Figure 8(b) shows the hierarchy for, where the Honeycomb pattern yields the highest S/N ratio, demonstrating its superiority and reliability in creating high ultimate tensile strength. Printing speed exhibits a clear optimum: the peak in S/N ratio at the intermediate speed level suggests that adequate fusion and cooling at this condition minimize strength scatter, while too low or too high speeds increase variability due to poor bonding or thermal degradation. The comparatively smaller changes in S/N ratio across layer-height levels indicate that σUTS is less sensitive to layer thickness within the investigated range.
47
Both layer height and infill pattern significantly influence the fluctuation in S/N ratio for Ɛf in Figure 8(c), demonstrating their significance in ductility control. Honeycomb and Tri-Hexagon, which show lower and less stable elongation, the Gyroid infill once again offers the highest S/N ratio, suggesting that its continuous channels not only transmit load effectively but also accept larger deformation before fracture with less scatter. Unlike Et and σUTS, printing speed exhibits an intermediate optimum where interlayer diffusion and cooling conditions yield the most reliable Ɛf, while the S/N ratio for Ɛf increases with layer height, suggesting that thicker layers Favor a more ductile, albeit less stiff, response.
48
Single to noise ratio plots represent the Taguchi L27 responses of: (a) Et (MPa), (b) σUTS (MPa), (c) Ɛf (%), (d) Ef (MPa), (e) σflex (MPa), along with factors layer height, infill pattern, and printing speed.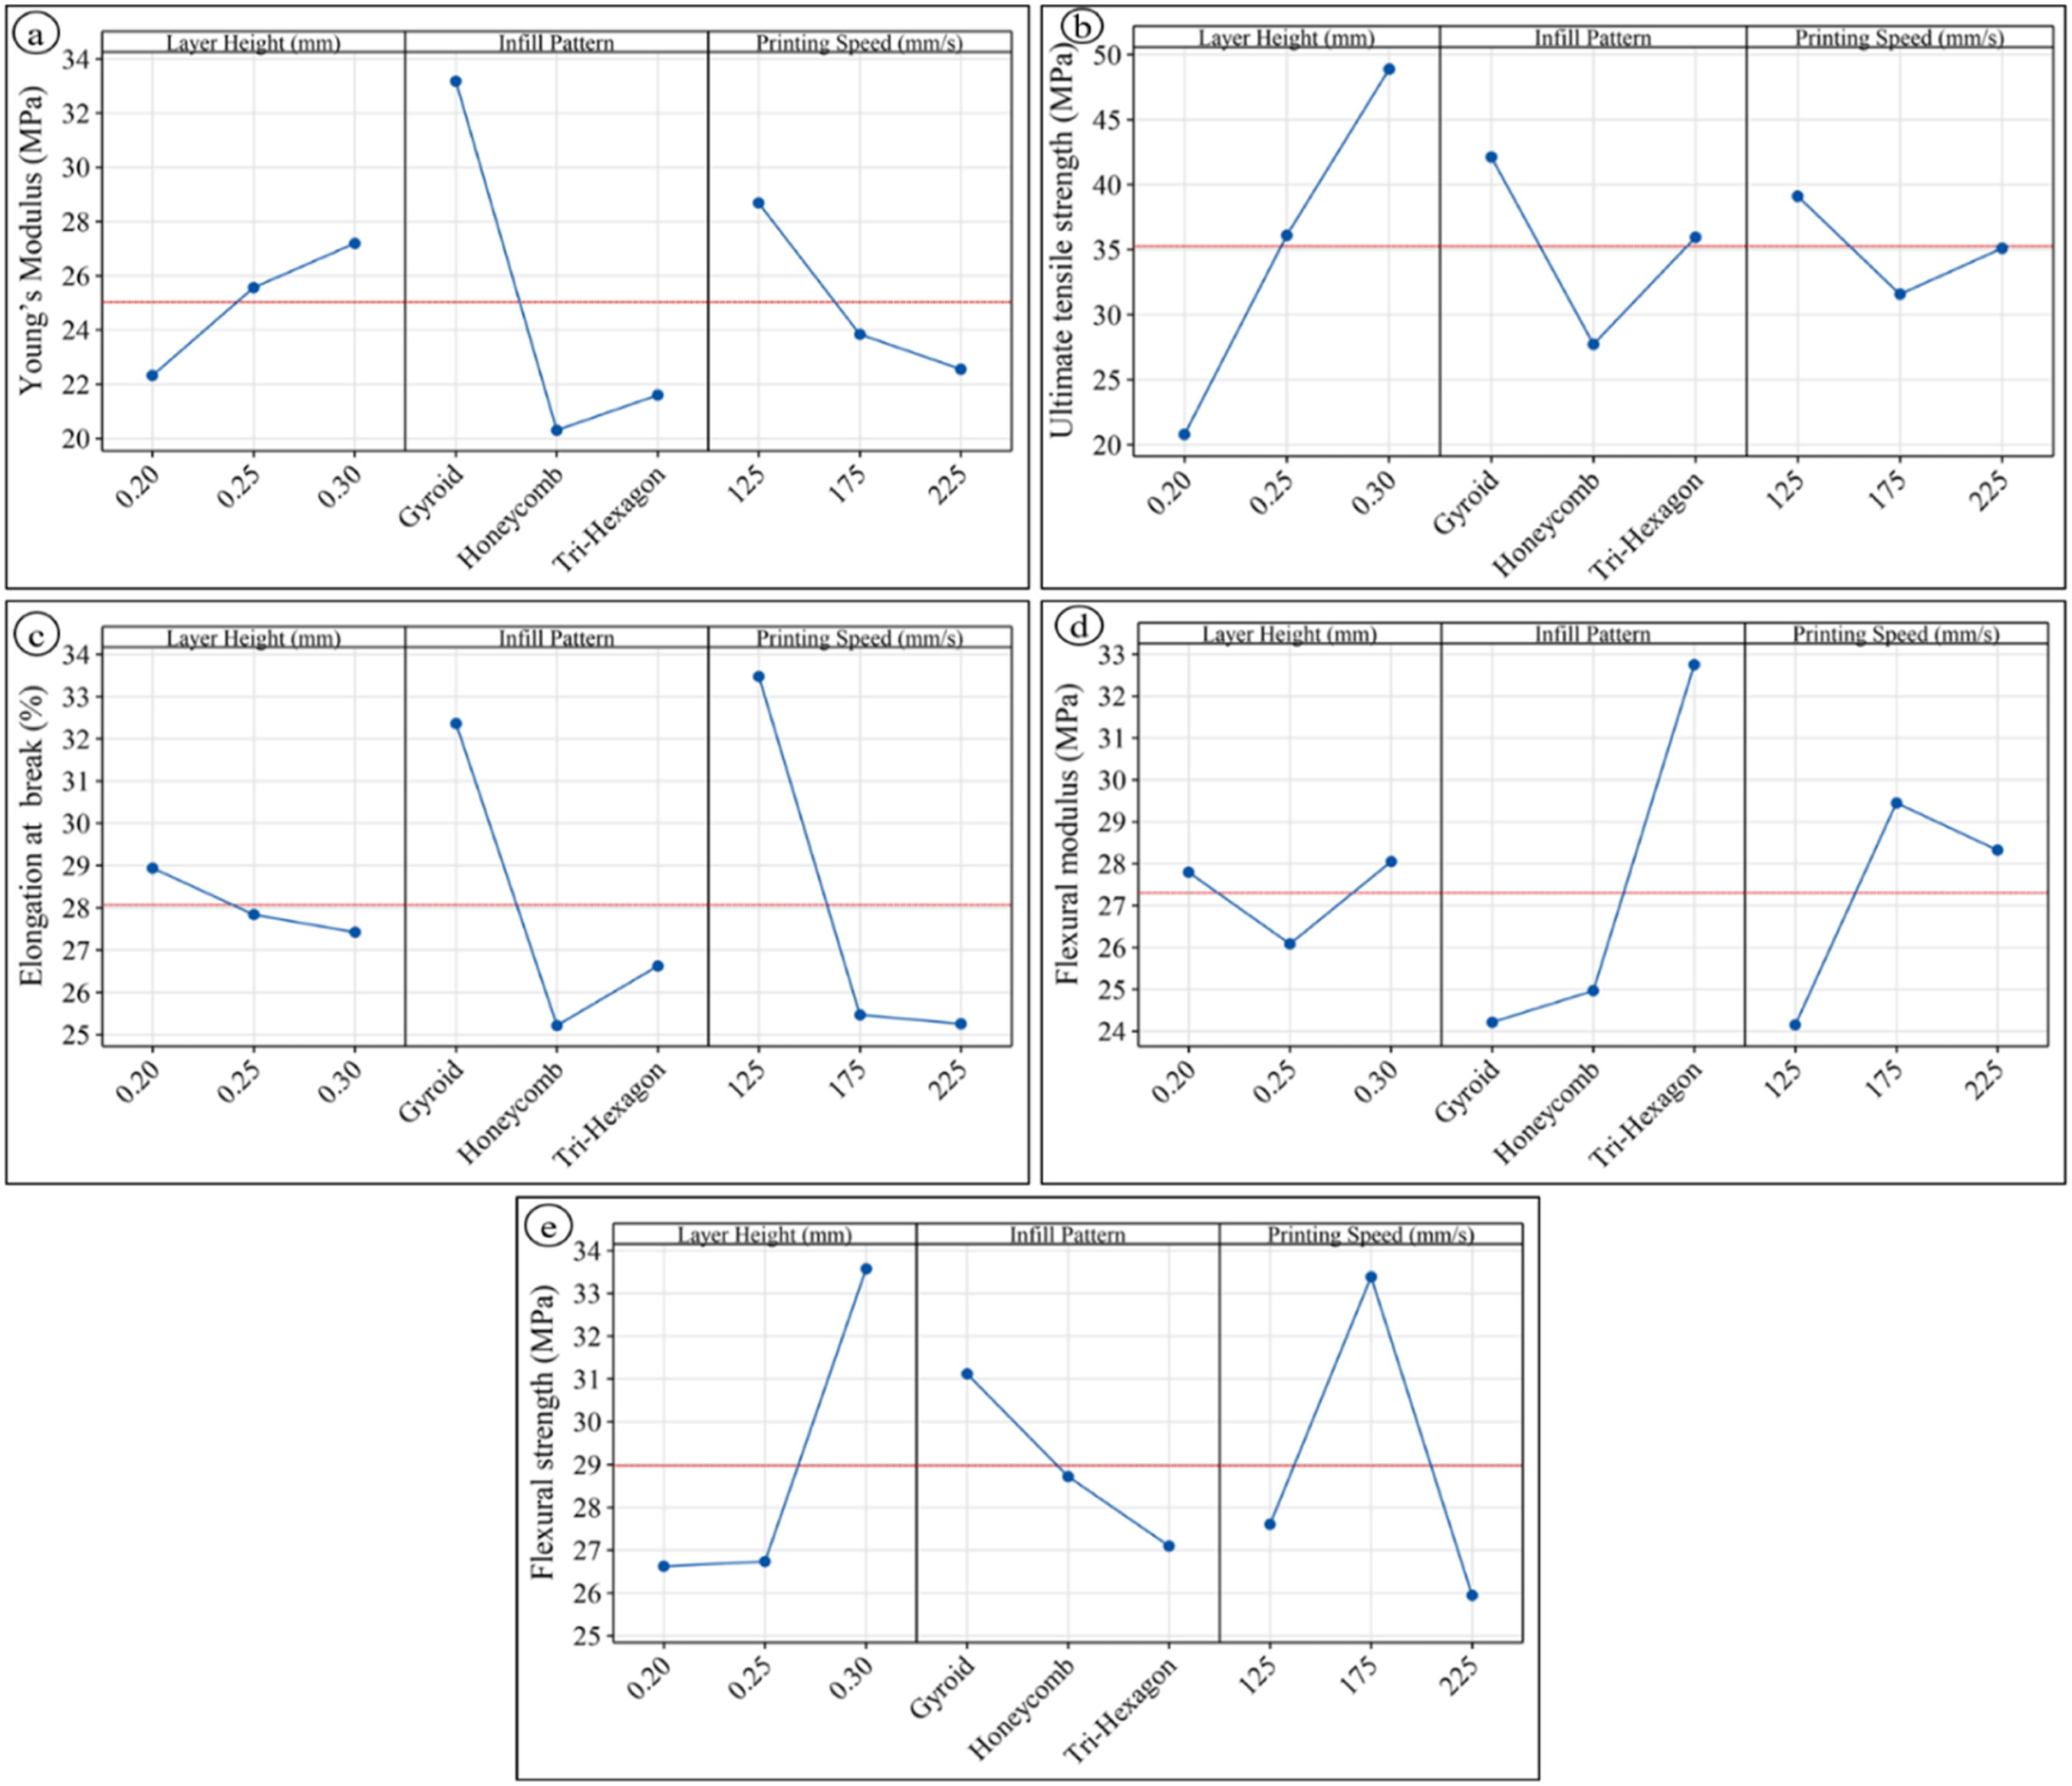
Ef is less sensitive to the chosen processing parameters, as seen by the S/N plot for Ef in Figure 8(d), which displays relatively small fluctuations across all factors. The virtually horizontal trend for layer height indicates that slight variations in layer thickness do not substantially influence the bending stiffness or its variability, however the infill pattern still has a discernible impact, with Gyroid showing the highest S/N ratio. The intermediate level is where printing speed peaks once more, suggesting that moderate speeds offer a somewhat stiffer and more consistent flexural response than extreme speeds. 49 The S/N ratio pattern for σflex is shown in Figure 8(e), where the Tri-Hexagon pattern has the lowest S/N ratio and the Honeycomb infill yields the greatest, followed by the Gyroid arrangement. This data demonstrates that, when compared to the discrete Tri-Hexagon cells and the isotropic Gyroid network, the Honeycomb design is the most dependable and effective architecture for withstanding bending loads. While printing speed exhibits a non-monotonic trend in S/N ratio, indicating that multiple speed levels can produce robust bending strength depending on the interaction between cooling rate and filament consolidation, the layer-height effect stays small, confirming that σflex is primarily governed by internal architecture rather than layer thickness. All things considered, the S/N plots in Figure 6 show that infill pattern dominates all mechanical responses, printed speed comes in second, and layer height largely affects stiffness and ductility. This data offers a quantitative foundation for choosing parameter combinations that maximize the magnitude and robustness of the desired mechanical properties.
Regression modelling and ANOVA of tensile and flexural responses
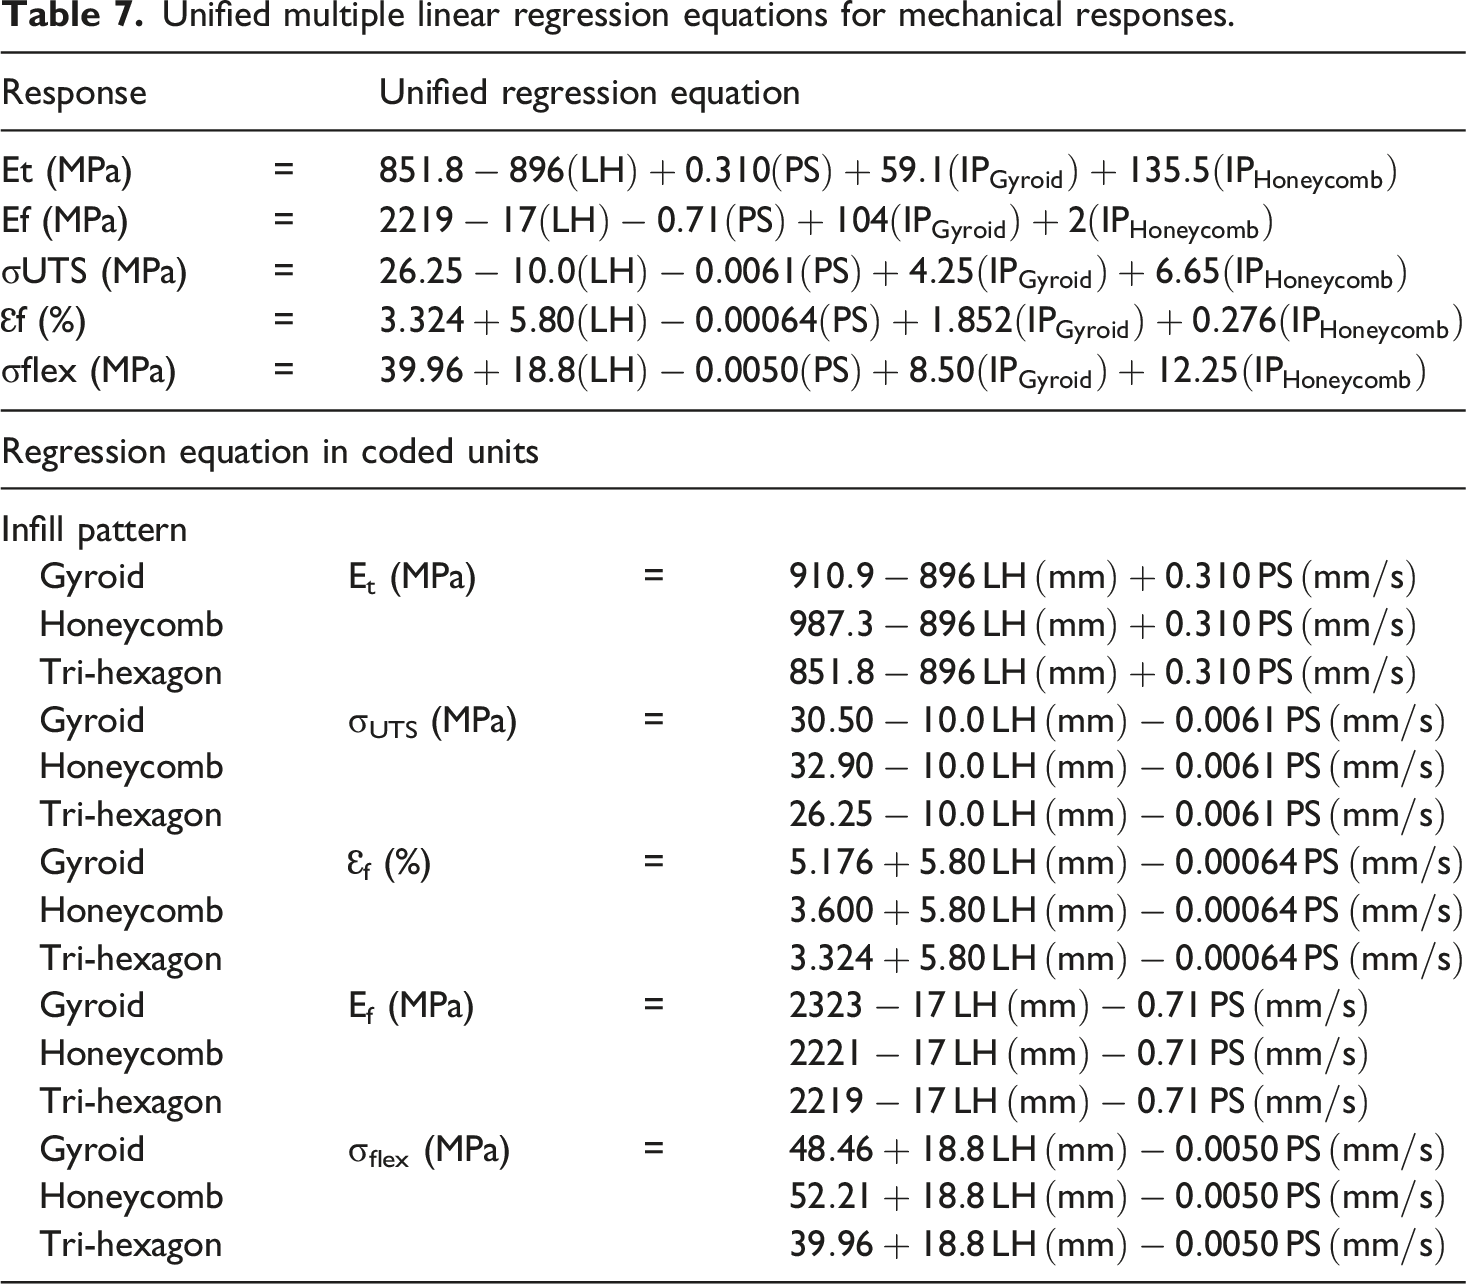
Unified multiple linear regression equations for mechanical responses.
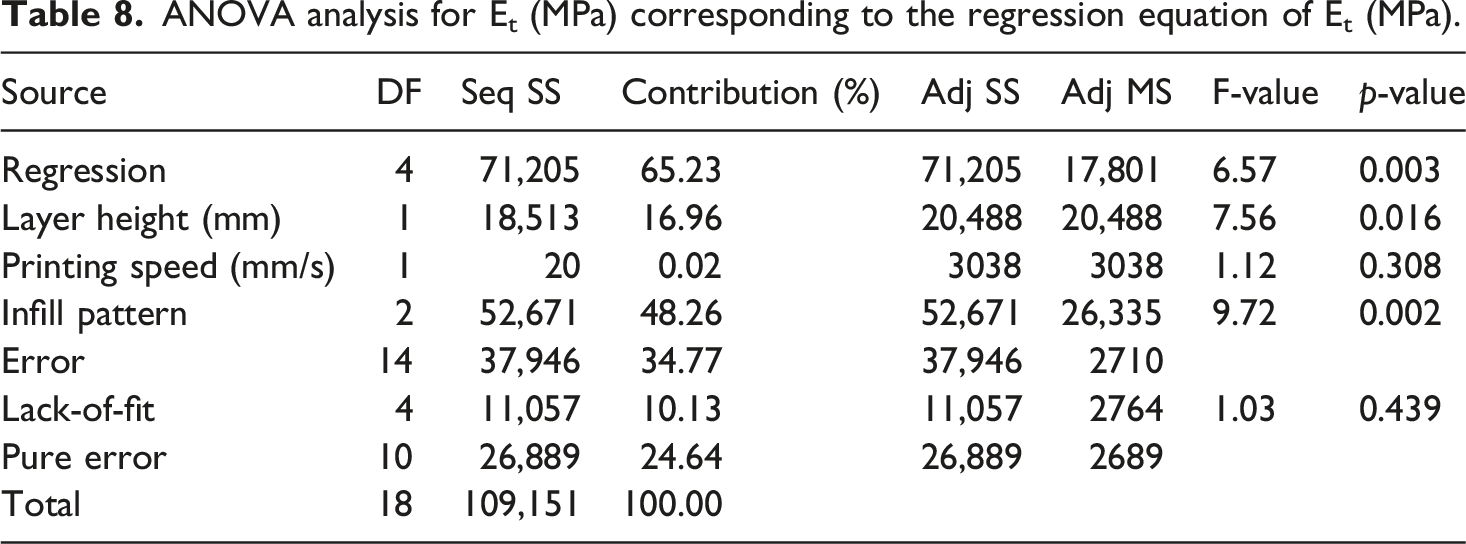
ANOVA analysis for Et (MPa) corresponding to the regression equation of Et (MPa).
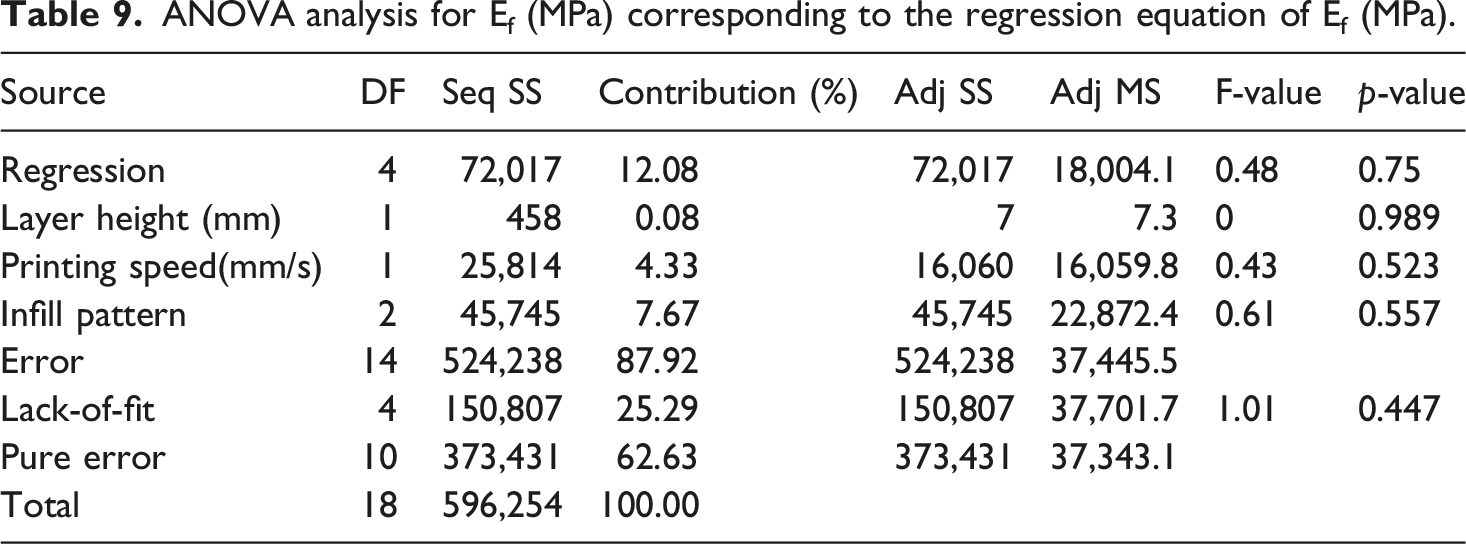
ANOVA analysis for Ef (MPa) corresponding to the regression equation of Ef (MPa).
ANOVA analysis for σUTS (MPa) corresponding to the regression equation of σUTS (MPa).
ANOVA analysis for Ɛf (%) corresponding to the regression equation of Ɛf (%).
ANOVA analysis for σflex (MPa) corresponding to the regression equation of σflex (MPa).
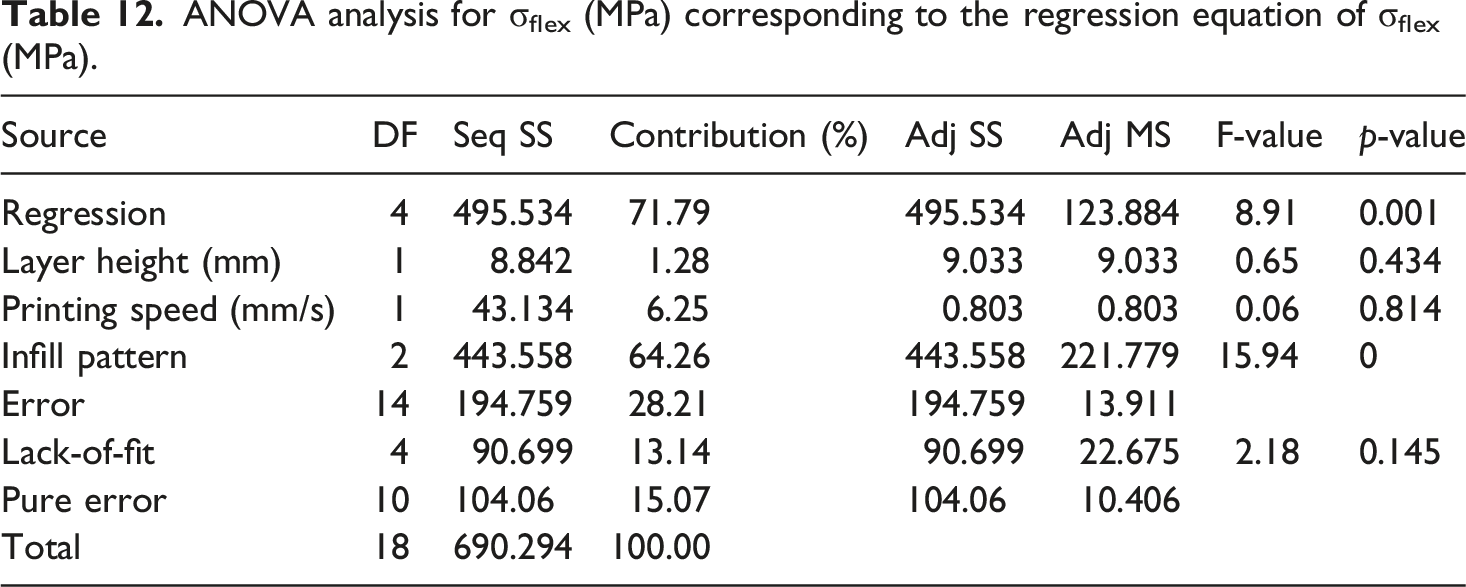
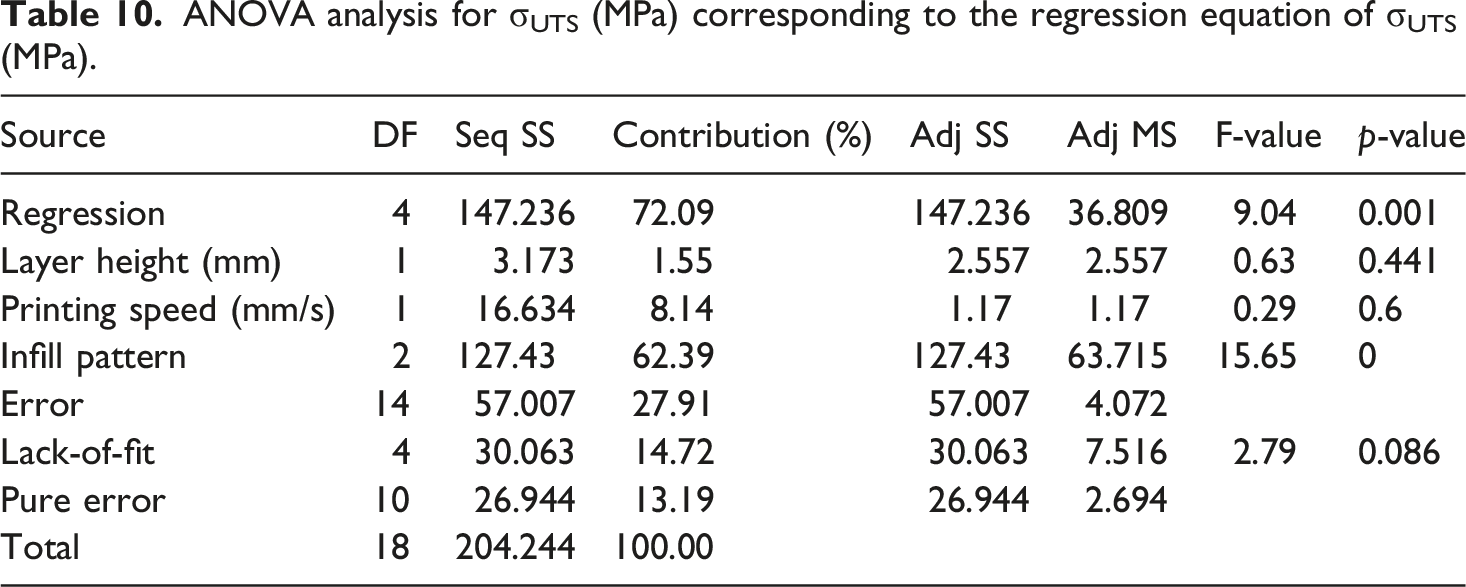
Table 10 shows a good regression model (R2 = 72.09%) for σUTS, with infill pattern being the most important feature, explaining 62.39% of the variation (F = 15.65, p < 0.001). Layer height and printing speed are not statistically significant (p = 0.441 and p = 0.60), contributing just 1.55% and 8.14%, respectively. Honeycomb has the highest baseline strength (32.90 MPa), followed by Gyroid (30.50 MPa) and Tri Hexagon (26.25 MPa), according to the regression equation. Layer height and printing speed have minor negative effects. The high F-value (9.04) and low p -value (0.001) demonstrate the infill pattern’s statistical dominance, which demonstrates that the continuous load paths in some topologies and the discrete cell walls in others are the main factors influencing tensile failure strength, superseding the secondary effects of deposition and thermal history. 50 It is essential to acknowledge that although the ANOVA model demonstrates that printing speed is statistically non-significant (p > 0.05) for σUTS, its 8.14% contribution to the overall variance is nonetheless physically relevant from an engineering standpoint. The absence of statistical significance is chiefly attributable to the preeminent macro-structural impacts of the infill pattern, which contribute over 60% and statistically obscure the thermal changes. Moreover, the chosen speed range (125–225 mm/s) signifies a significantly faster, restricted processing interval. In this high-velocity regime, the residence period of the molten polymer is continuously short, resulting in little polymer chain interdiffusion and the active creation of inter-bead voids at all investigated speeds. Consequently, although the mechanical variance within this particular high-speed window seems statistically eclipsed by the fundamental geometry, regulating the print speed is essential for controlling cooling rates and providing sufficient interlayer adhesion in FDM composites.
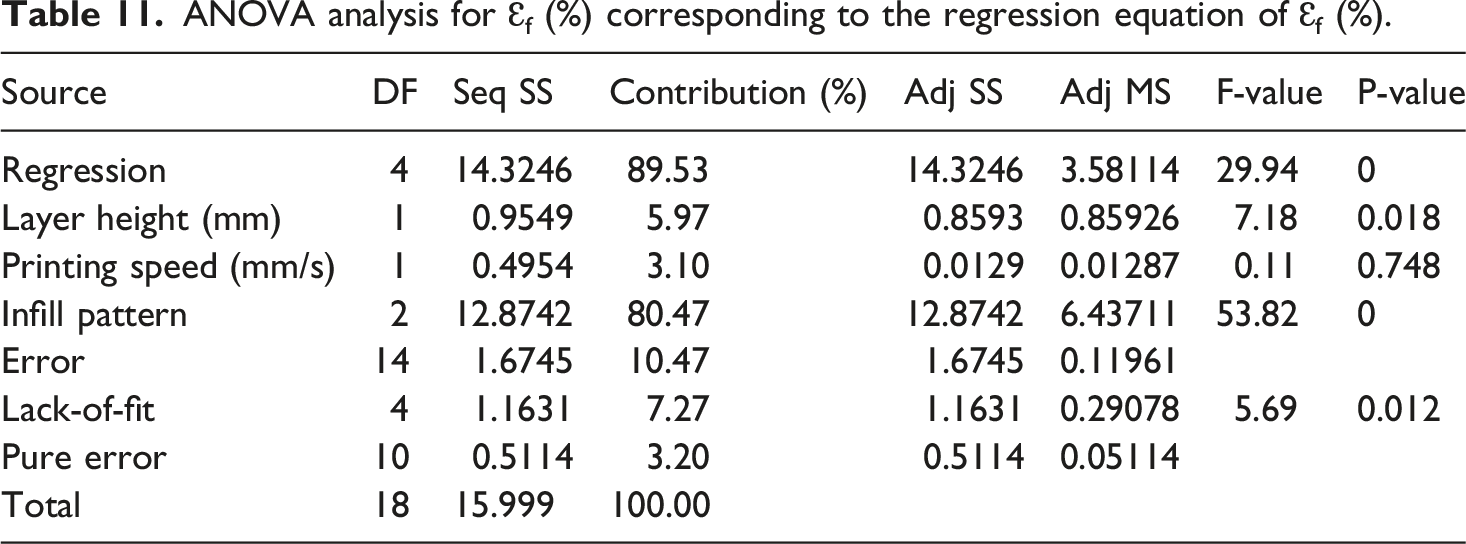
With R2 = 89.53% in Table 11, Ɛf exhibits the best overall model performance, suggesting that the process parameters may predict ductility with high accuracy. Printing speed contributes 3.10% but is not significant (F = 0.11, p = 0.748), layer height contributes 5.97% (F = 7.18, p = 0.018), and infill pattern dominates with 80.47% contribution (F = 53.82, p < 0.001). According to the regression equation, layer height and printing speed have positive and negative linear effects, respectively, and Gyroid has the highest positive intercept (5.176%) compared to Honeycomb and Tri hexagon, which have lower intercepts (3.600% and 3.324%). The exceptional F-value (29.94) and high statistical significance highlight how infill architecture significantly affects ductile behaviour. While thicker layers marginally increase elongation, probably by lowering constraint and encouraging interlayer motion, the continuous Gyroid network permits greater plastic deformation than the discrete cell patterns. 43
Similarly, σflex shows a robust regression model (R2 = 71.79% in Table 12), with infill pattern explaining 64.26% of the variation (F = 15.94, p < 0.001), layer height explaining 1.28% (F = 0.65, p = 0.434), and printing speed explaining 6.25% (F = 0.06, p = 0.814). The ranking for tensile strength is reversed in the regression equation, with Honeycomb providing the highest baseline (52.21 MPa), Gyroid being middle (48.46 MPa), and Tri Hexagon being lowest (39.96 MPa). This reversal, along with the equation’s positive layer height coefficient (+18.8), suggests that thicker layers slightly boost bending strength, perhaps as a result of better interlayer fusion, and that grid-like patterns more effectively place material in areas of maximum bending stress. Infill pattern is the key design variable for flexural performance, whereas layer height and printing speed are still secondary, according to the overall model significance (F = 8.91, p = 0.001). The ANOVA and regression results for each of the five responses agree on three important points: first With the exception of Ef, infill pattern is the dominant factor, controlling 48%–80% of response variance and reaching statistical significance at p < 0.01 in all cases, second is layer height is a secondary factor, significant only for Et and Ɛf and insignificant for Ef and σflex; and third is printing speed has little effect, contributing less than 10% of variance and never reaching statistical significance. The design space can be predicted thanks to the regression equations, which also show that Honeycomb is better for flexural applications while Gyroid is best for tensile σUTS, Ɛf, Et. In Also the processes parameter selection should prioritize infill topology in accordance with the target mechanical requirements of the application is validated by these findings, which offer a robust statistical foundation for the factor rankings seen in the main effect plots and S/N ratio analysis. 52
Although using a 100% PLA-CF (fully reinforced) configuration might seem obvious, FDM literature shows that printing structures made entirely of short carbon fibre-reinforced PLA frequently worsens internal void formation and leads to poor interlayer fusion. 46 The new study reduces these flaws by using a sandwich architecture with clean PLA facing sheets. The premature brittle surface cracking that usually afflicts 100% PLA-CF prints is successfully avoided by the improved continuous interlayer bonding provided by the pure PLA outer layers. 46 Printing speed is still a crucial physical factor even though ANOVA reveals that it has a negligible impact on overall statistical variance when compared to infill pattern. Cooling rate and polymer interdiffusion are regulated by print speed; extremely high speeds result in poor bonding and under-fusion, while ideal moderate speeds improve mechanical strength and interlayer adhesion. Therefore, maintaining an optimum print speed is crucial for guaranteeing structural integrity in FDM composites, even though its statistical influence is small. All mechanical responses underwent a thorough Analysis of Variance (ANOVA) in order to statistically validate the impact of each process parameter. Tables 8 through 12 provide particular p-values and Percentage Contributions for each factor. The statistical evidence supports the infill pattern’s overwhelming dominance, as shown in these tables. It shows the largest percentage contributions for ultimate tensile strength (62.39%), elongation at break (80.47%), and flexural strength (64.26%) and routinely produces p-values far below the 0.05 significance threshold. On the other hand, printing speed never attained statistical significance and accounted for less than 10% of the variance in all responses.
Experiment validation
The predictive capability of the Taguchi regression analysis was assessed through a confirmation experiment performed at the parameter combination identified as optimum: layer height L = 0.2 mm, Gyroid infill pattern, and printing speed S = 125 mm/s. Trial 1 of the L27 orthogonal array corresponds to the same setting and was therefore selected as the baseline FDM condition. The response of this baseline condition is denoted by Ybaseline. While the response predicted at the same setting by the Taguchi model is
For each mechanical response Y (Et (MPa), Ef (MPa), σUTS (MPa), σflex (MPa), Ɛf (%)). The prediction error and improvement relative to the baseline were evaluated as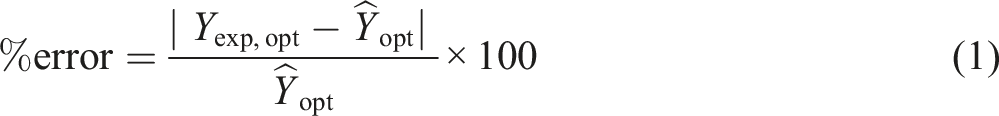

Because the optimum setting coincides with the baseline trial, the Taguchi prediction at this point is identical to the original baseline response and thus 

At the same parameter combination, the confirmation experiment yielded mean values
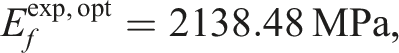
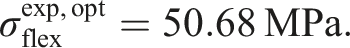
Confirmation experiments for with predicted and experimentally data.
The prediction errors obtained from equation (1) are between approximately 4% and 9%, which reflects the experimental scatter between the initial Taguchi trial and the independent confirmation test at the same processing condition. According to equation (2), the optimized setting leads to an increase of about 4.2% in flexural modulus relative to the baseline, whereas Young’s modulus, tensile strength, elongation at break and flexural strength decrease by 5%–9%, indicating a stiffness, ductility and strength trade-off at this parameter combinate.
Fracture surface morphology
Tensile specimen Sample no. 16, which had the maximum tensile strength in the L27 matrix, has the fracture morphology shown in Figure 9. These findings are directly related to the statistical analysis of the process parameters. The high σUTS of 30.61 MPa and Et of 802.34 MPa measured for this Honeycomb infill specimen at layer height 0.25 mm and printing speed 125 mm/s, which place it at the upper end of the tensile performance envelope for the investigated conditions, are consistent with the macroscopic view in Figure 9(b), which confirms failure in the gauge section. The ANOVA results show that, for σUTS, infill pattern contributes over 60% of the variance, while layer height and printing speed have much smaller and statistically non-significant effects. In this case, the Honeycomb architecture and the selected deposition conditions produce a dense, well-consolidated structure that effectively transmits load.
53
The bottom and top surface micrographs in Figure 9(a) and (e) show a regular filament trace pattern with limited visible porosity. According to the regression model, where the intercept for Honeycomb infill is marginally higher than that for Gyroid, indicating a favourable baseline strength for this pattern at the tested density, the cross-section in Figure 9(c) and the SEM (Scanning Electron Microscope) image in Figure 9(d) demonstrate strong interlayer adhesion in the PLA skins and continuous bonding across the interface between the PLA face sheets and the PLA-CF core.
40
The moderate Ɛf of 5.25% observed for sample no. 16 and the literature reports that well-bonded PLA-CF specimens can achieve higher tensile strength with only a limited penalty in ductility are consistent with the rough, fibrous fracture surface with multiple tearing ligaments, which suggests that failure involves a combination of matrix yielding and cohesive layer separation rather than purely brittle crack growth. Effective stress transfer from the polymer to the reinforcement is confirmed by the SEM close-up of the PLA-CF region in Figure 9(f), which displays carbon fibers securely entrenched in the PLA matrix with little pull-out and obvious inter-filament layer adhesion. This microstructural integrity supports the statistical finding that the regression model for σUTS explains more than 70% of the variance and that infill pattern is the only strongly significant factor. In other words, the detailed infill architecture and the quality of fibre–matrix and filament, filament interfaces, as observed here, become the primary determinants of tensile performance once an appropriate combination of layer height and speed provides adequate bonding. Therefore, the fractographic characteristics of sample no. 16 support the ANOVA and regression analyses that pinpoint infill-driven microstructural continuity as the primary pathway to optimizing σUTS in PLA-CF sandwich structures and offer a physical explanation for its location at the top of the strength distribution. Fracture surfaces were examined by scanning electron microscopy (SEM, ZEISS EVO MA10, Carl Zeiss, Germany) using secondary electrons at 5 kV accelerating voltage and 6–8 mm working distance. Magnifications from 100× to 5000× were employed to observe interlayer fusion, filament morphology and fibre–matrix interactions, after sputter coating the specimens with a ∼5–10 nm Au–Pd layer to minimise charging on the polymer surfaces.
22
Tensile sample no. 16 fracture morphology: (a) bottom surface of tensile sample with textured PEI finish, (b) fracture sample no. 16 after tensile loading, (c) fractured tensile specimen cross-section view, (d) SEM image of fracture sample with PLA and PLA-CF layers, (e) top surface visualization of fractured layers with monotonic surface pattern, (f) SEM image with close up view of CF and inter filament layer adhesion.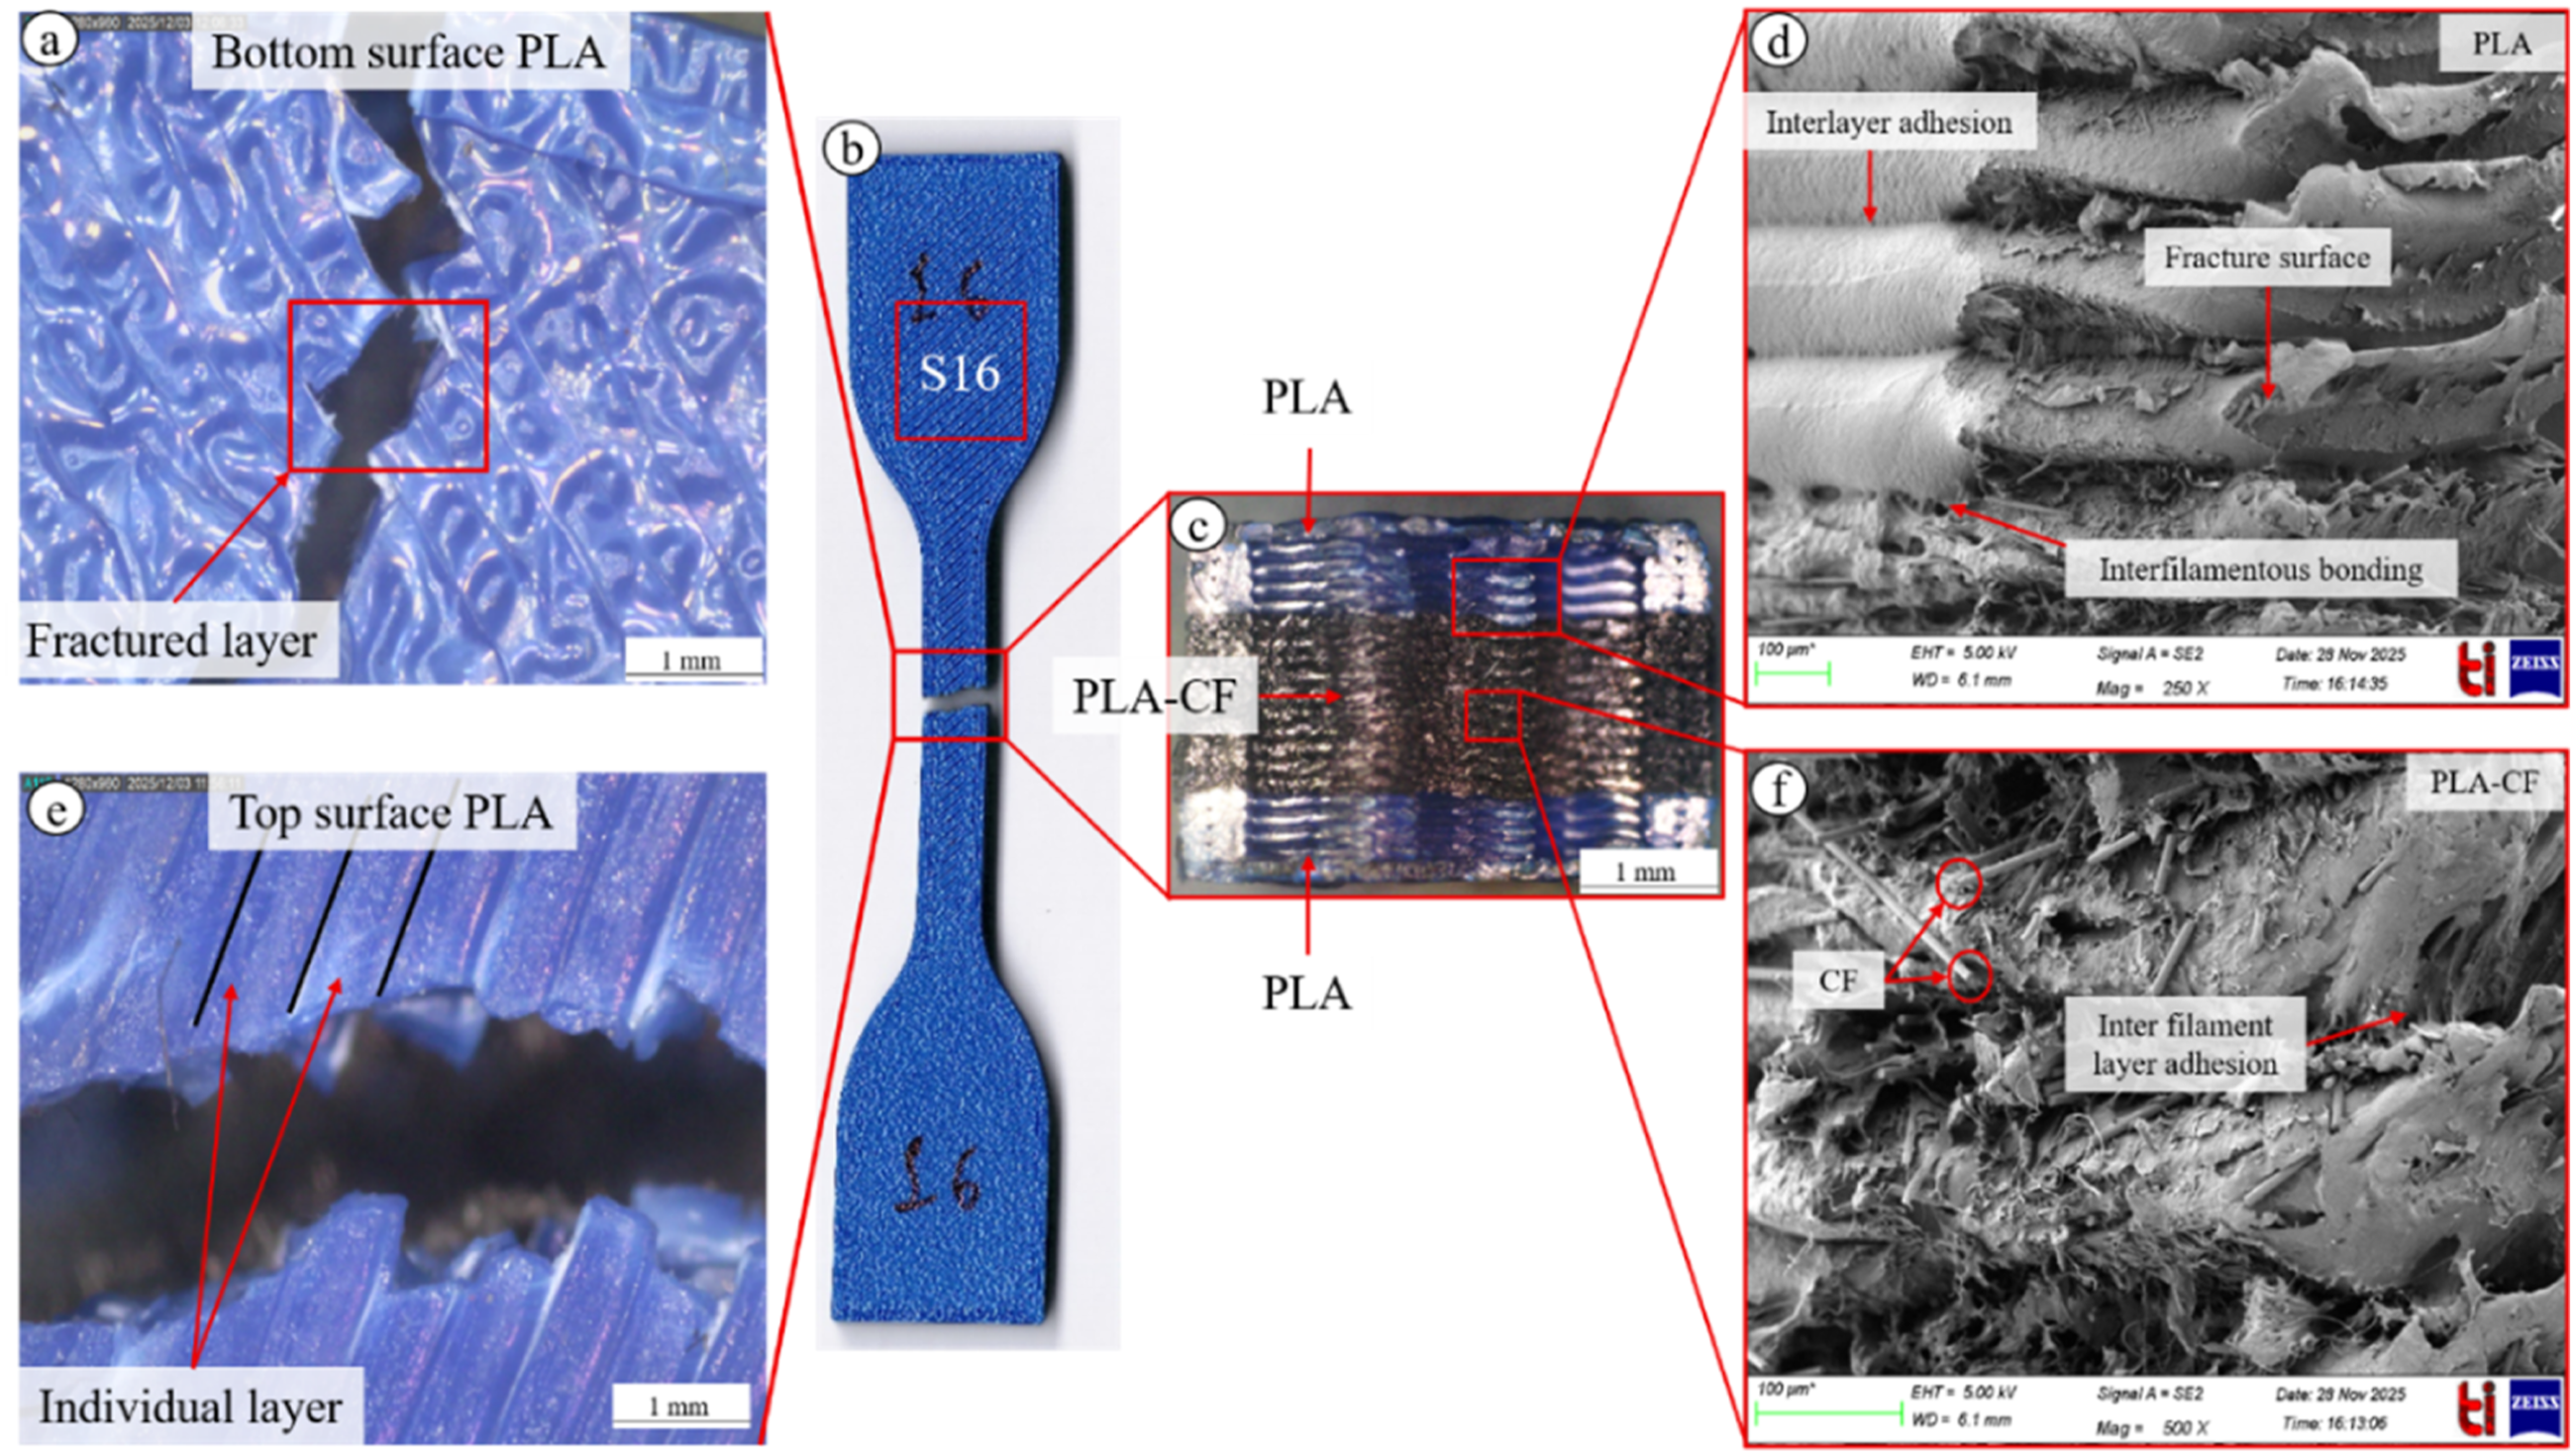
Flexural specimen sample no. 26, which is in the high-performance group in bending and was made with a honeycomb core at layer height 0.30 mm and printing speed 175 mm/s, has a σflex of ∼61.66 MPa and a Ef above 2200 MPa. Figure 10 shows the fracture morphology of this specimen. As predicted by classical flexure theory, failure was dominated by tension on the underside of the beam. This is confirmed by the side view in Figure 10(b), which displays the global deformation mode following three-point bending. A noticeable tensile crack starts at the lower PLA surface and spreads through the PLACF core towards the upper skin. While Figure 10(c) shows the cross-section of the fractured region with distinct PLA face sheets and a central PLA-CF core, Figure 10(a) shows the beginning of cracking at the PLA/PLA-CF interface and the crack’s gradual opening. The high σflex recorded for this sample can be explained by the fact that the crack path in the cross-section kinks and branches as it moves from the tensile PLA skin into the reinforced core, suggesting that the PLA-CF layer provides greater resistance to crack propagation than the pure PLA. The extended post-peak load carrying capacity seen in the flexural stress-strain curves is largely due to a bridging mechanism where intact or partially deboned fibers span the crack faces and carry load even after matrix cracking. This bridging zone is more identified in the detailed side view in Figure 10(e).
22
Flexural sample no. 26 fracture morphology: (a) side view of the flexural sample showing cracking, (b) flexural sample no. 26 after loading, (c) cross-sectional view of the fracture sample, (d) SEM image of the PLA section of the fractured sample, (e) close-up view of the cracked section of the side view with bridging zone, (f) SEM of PLA-CF section of fractured section with CF pullout.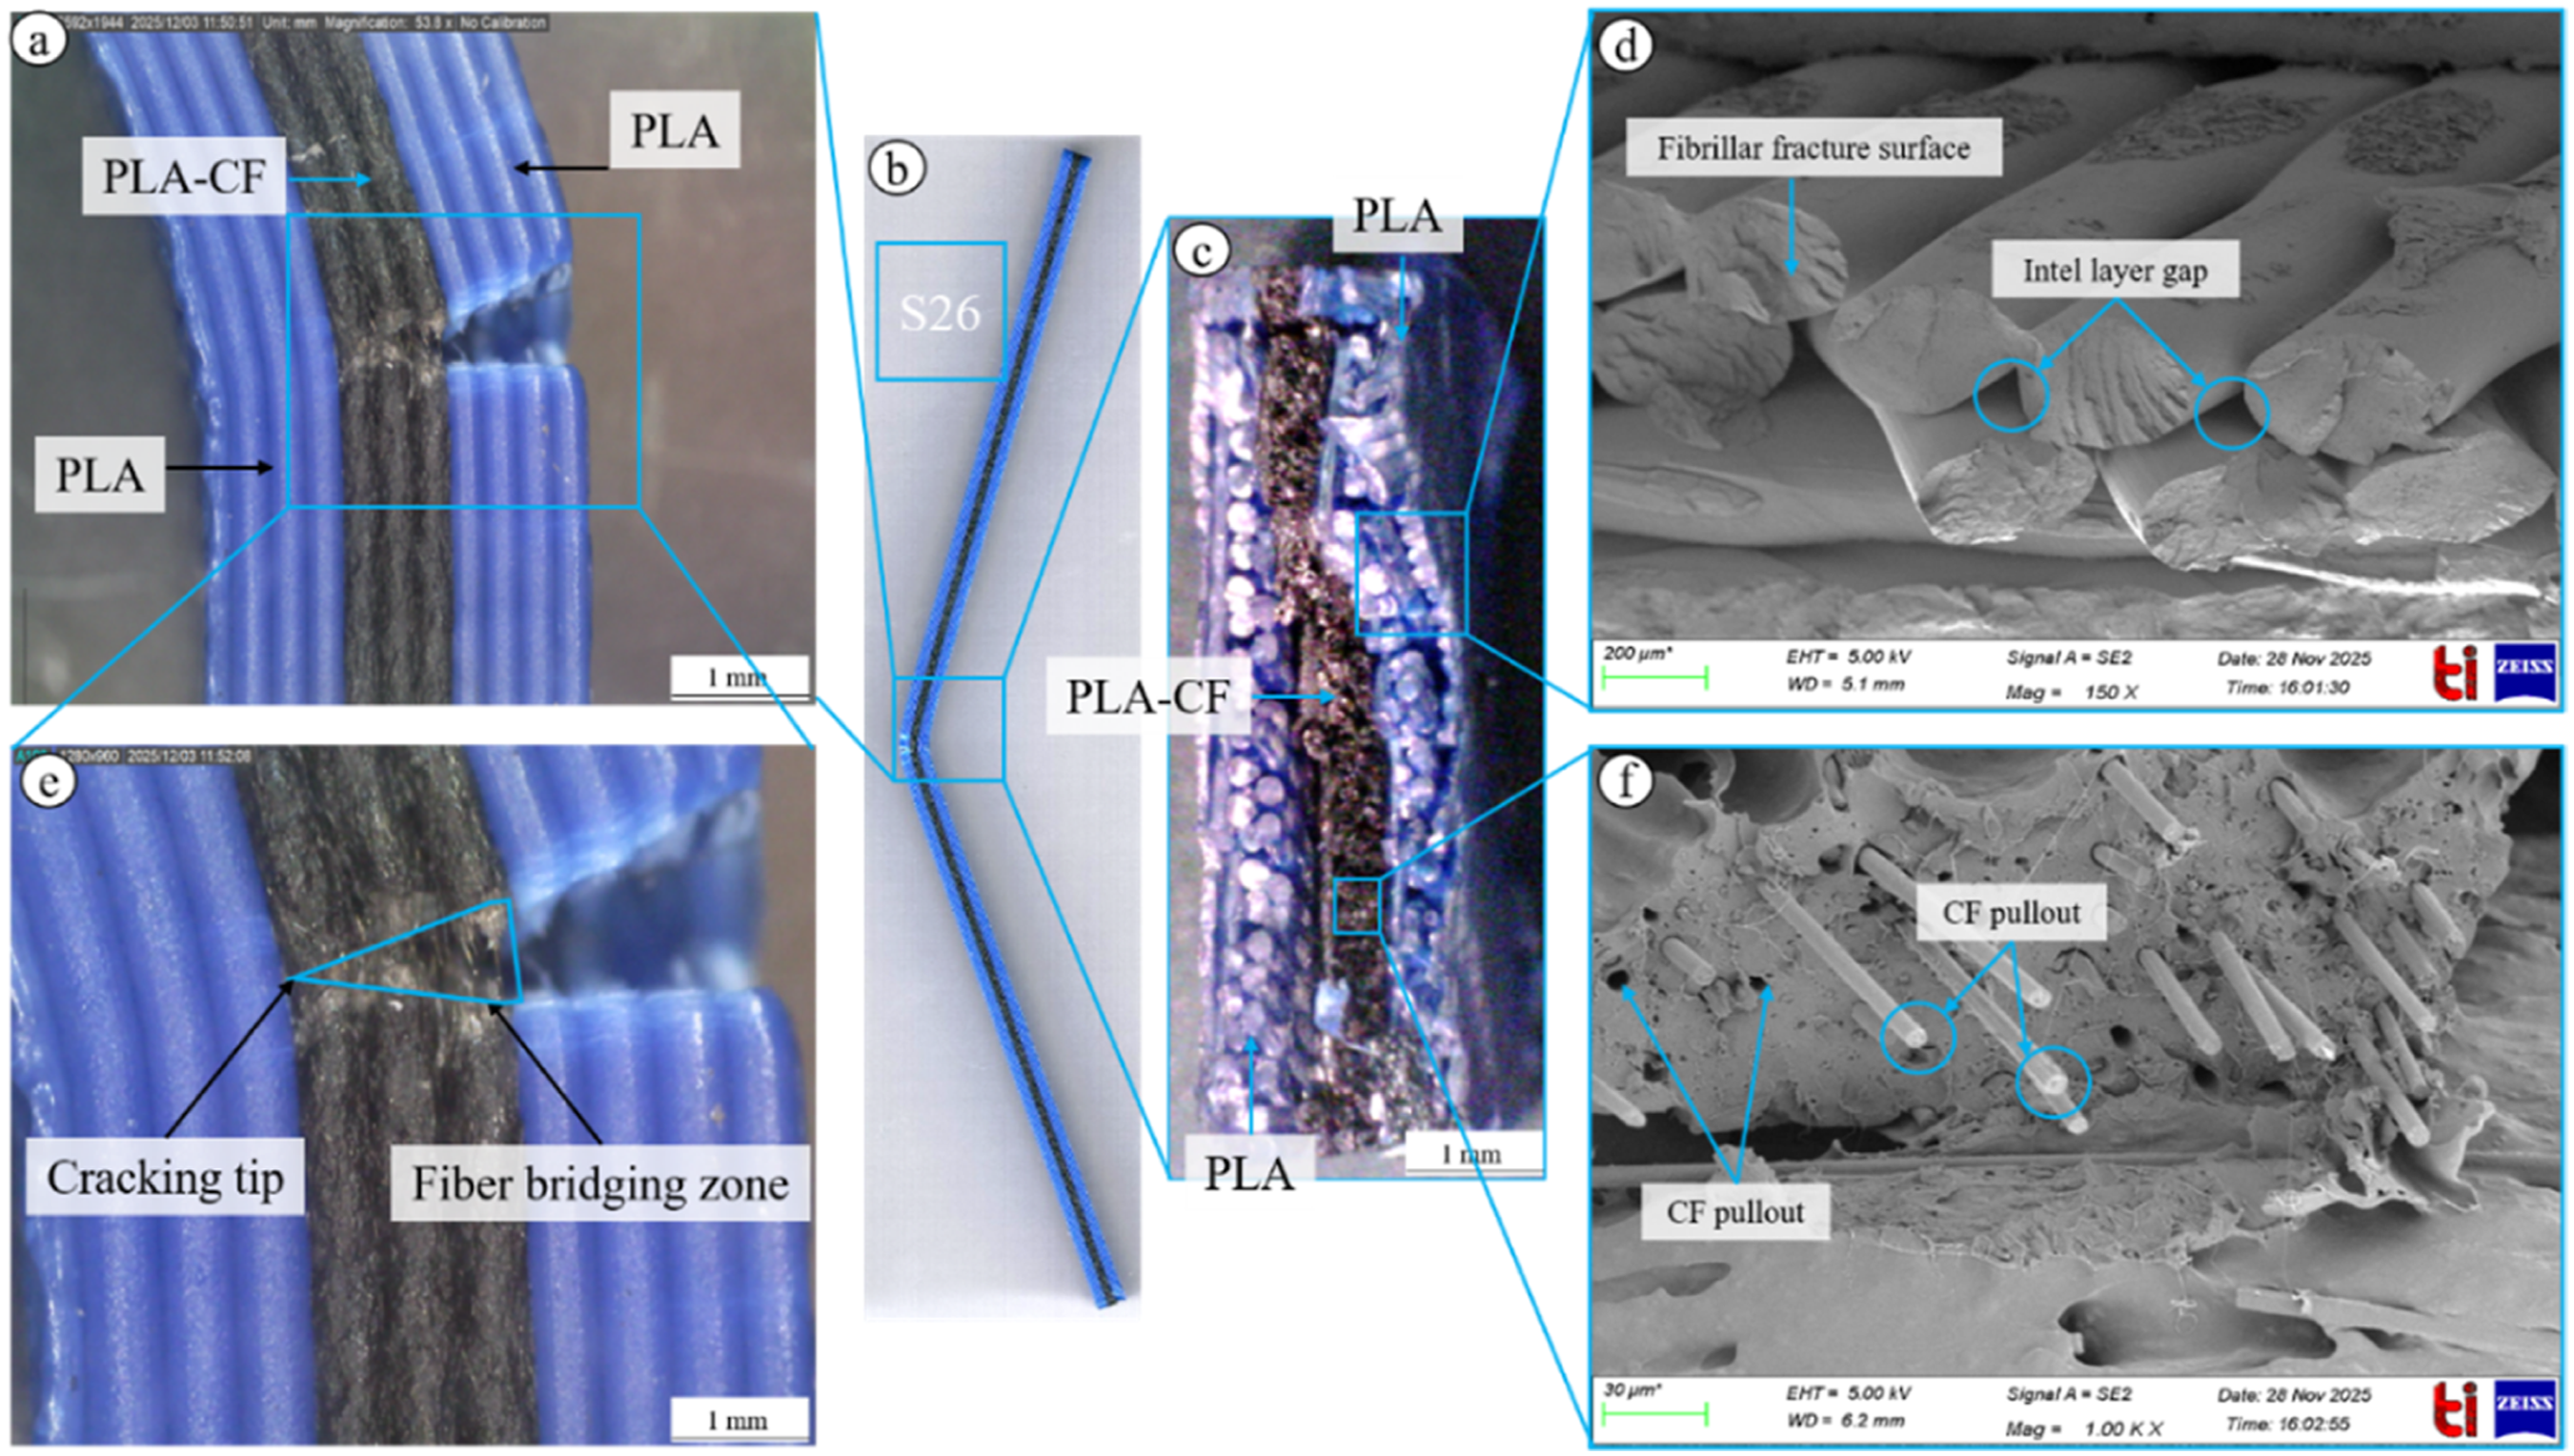
SEM analysis sheds more light on these processes. Local interfacial decohesion under tensile bending stress is indicated by the fibrillar fracture surface with distinct interlayer gaps between neighbouring filaments in Figure 10(d), which is taken from the PLA region. The existence of these gaps indicates that interlayer adhesion is robust enough to sustain heavy loads but continues to be the preferred route for crack propagation once the local stress surpasses the weld strength. This is in line with the ANOVA’s stronger dependence of σflex on infill pattern and layer height and Ef moderate sensitivity to process parameters. The SEM micrograph of the PLA-CF core in Figure 10(f), on the other hand, shows many carbon-fibre pull-out features, with fibers protruding from the matrix and leaving elongated voids behind. This morphology suggests that, at peak load, frictional pull-out and fibre-matrix debonding become the dominant energy-dissipation mechanisms, which is typical of fibre-reinforced composites with relatively tough matrices. In line with the regression model that attributes the highest baseline σflex to Honeycomb-based sandwich configurations at higher layer heights, specimen no. 26 achieves σflex close to 60 MPa while still exhibiting significant flexural strain prior to final separation. This is explained by the combination of fibre bridging at the crack front and controlled CF pullout in the core. 13
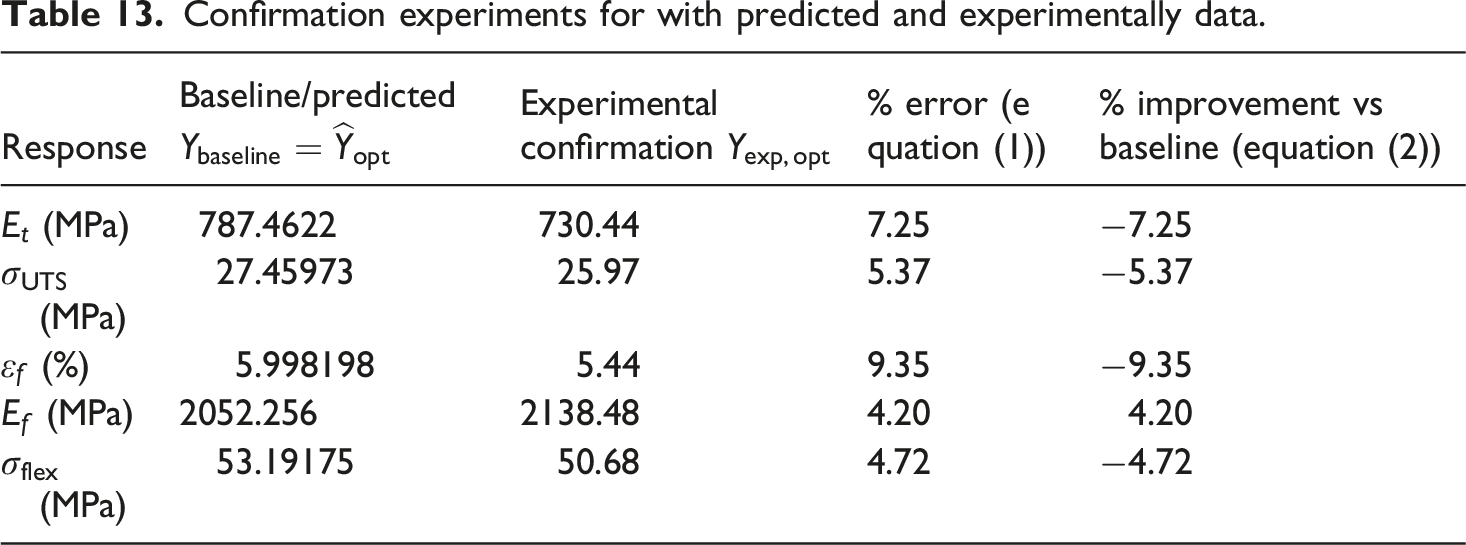
The fracture morphology of tensile sample no. 6, which is from the low-strength group in the L27 matrix, is shown in Figure 11. The lower σUTS and Et observed for this condition compared with the optimized samples are consistent with the macroscopic image in Figure 11(a), which reveals premature failure in the gauge region with a relatively little loss in cross-section and limited necking. The PLA face sheets and PLACF core are cut through by a rough and highly irregular fracture plane, as seen in the cross-section in Figure 11(b). However, there is evidence of incomplete fusion between adjacent filaments and layers, indicating that local defects and weak interfaces severely influenced the initiation and growth of cracks. The PLA–CF area has poor consolidation, as evidenced by the SEM picture in Figure 11(c), which shows a porous, uneven fracture surface with many voids dispersed throughout the inter filament boundaries. The reduced tensile strength in comparison to sample no. 16 despite nominally equal material composition can be explained by these voids and the extremely convoluted fracture path, which also function as stress concentrators and diminish the effective load-bearing area. Interlayer adhesion alone is not enough to drive bulk cohesive failure, as the top view micrograph in Figure 11(d) clearly shows a delamination-type failure of the PLA skin, where the crack preferentially spreads along the layer interfaces rather than cutting across them. The high-magnification SEM in Figure 11(e) reveals significant fibre pull-out and large cavities surrounding the carbon fibres. This indicates that the fibre–matrix bonding is weaker than in the high-strength sample, causing the fibres to deboned and slide instead of fracture, dissipating energy and lowering the maximum stress that the composite can withstand in tension.
32
Tensile sample no. 7 fracture morphology: (a) tensile fractured sample after loading, (b) cross-section view of fractured sample, (c) SEM image of fractured surface, (d) tensile sample top view with delamination failure pattern, (e) close-up view of (c) fracture sample fiber pull out.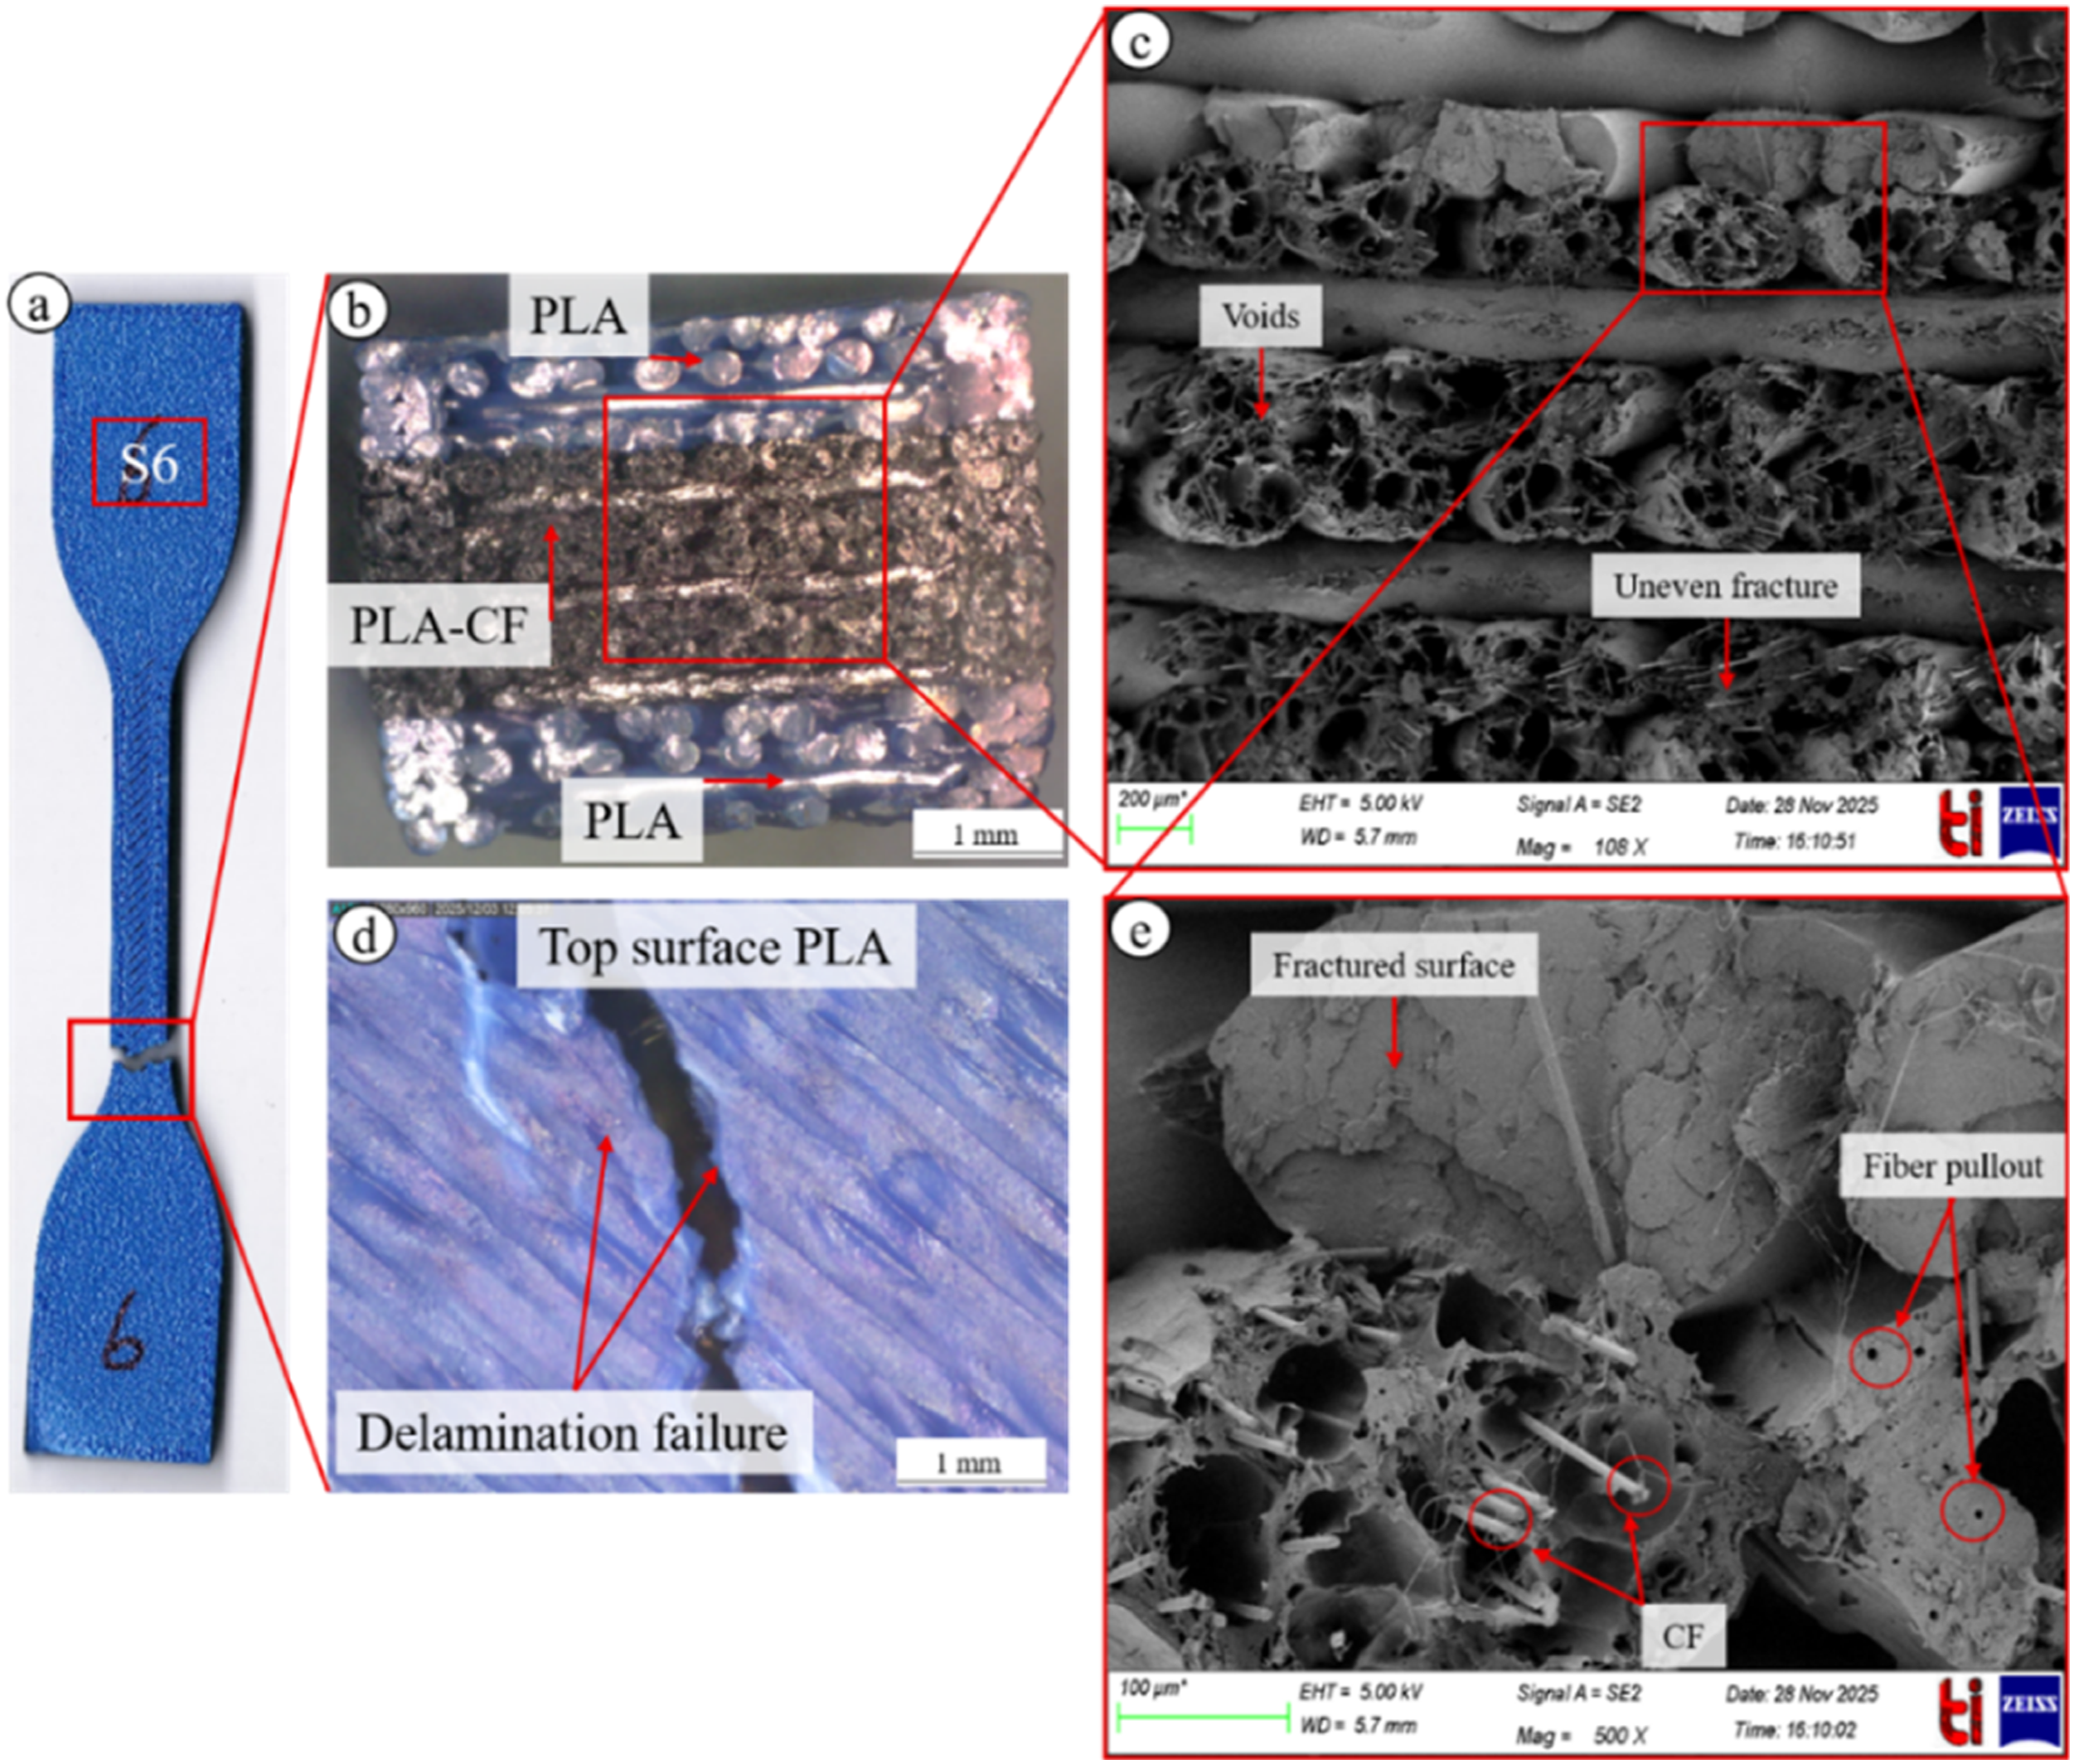
The flexural sample no. 14 fracture morphology is shown in Figure 12. This specimen has very low flexural strength and stiffness. The overall deformation depicted in Figure 12(a) shows that the specimen deflected less than its high-strength counterpart prior to failure, indicating early crack start under bending. The PLA skins and PLA-CF core are visible in the cross-section in Figure 12(b), but the core (Figure 12(c)) has an uneven and porous fracture surface with large interconnected voids and irregular filament contours; this microstructure is typical of under-consolidated FDM parts and is consistent with the reduced σflex measured for this run. In contrast to the smooth, single fracture plane shown in Figure 12(d), the sideview optical picture shows an uneven, stepped crack along the specimen’s tensile side that follows filament boundaries and infill cell walls. According to this behaviour, weak interlayer and inter filament contacts greatly affect the crack path. With distinct filament separations and little indication of plastic bridging, the SEM close-up in Figure 12(e) reveals interlayer gaps and areas of weak interlayer adhesion in the PLA-CF zone, demonstrating that the weld strength between layers is insufficient to transfer stresses uniformly. This lack of interfacial integrity explains flexural sample no. 14 lower σflex and is consistent with statistical analysis that σflex is highly sensitive to infill pattern and layer quality; even though the sandwich structure has the same nominal geometry and material system as the higher-performing samples, it fails at lower bending loads when interlayer bonding is poor and void content is high.
54
The geometric stress distribution of the infill patterns must be directly associated with the fractography failure mechanisms in order to quantitatively link these fractographic data to the statistical results. The σUTS (62.39%), σflex (64.26%), and Ɛf (80.47%) are all significantly influenced by the infill pattern, according to the ANOVA. These statistical rankings are physically validated by the SEM fractography. With few spaces between beads, the Honeycomb design creates extremely dense raster-to-raster bonding. Its stiff resistance to fracture propagation and statistical superiority in reaching maximum σUTS and σflex can be explained by its vertical hexagonal walls, which place more material immediately parallel to the applied planar and bending loads. In contrast, the continuous, curvature-driven TPMS design of the Gyroid pattern lacks the abrupt internal vertices found in grid-like patterns, despite its slightly lower peak strength. This continuous shape promotes controlled, gradual energy dissipation by substantial fibre pull-out and targeted matrix yielding under loading, preventing abrupt catastrophic delamination. The physical mechanism underlying the ANOVA results is readily explained by this microstructural compliance, which shows that the Gyroid pattern is the statistically best geometry for maximum Et and Ɛf. Flexural sample no. 14 fracture morphology: (a) sample no. 14 after loading, (b) cross-section view of fracture surface, (c) SEM image of fracture surface with uneven fracture layer, (d) side view with irregular crack, (e) close-up view of (c) with poor interlayer bonding.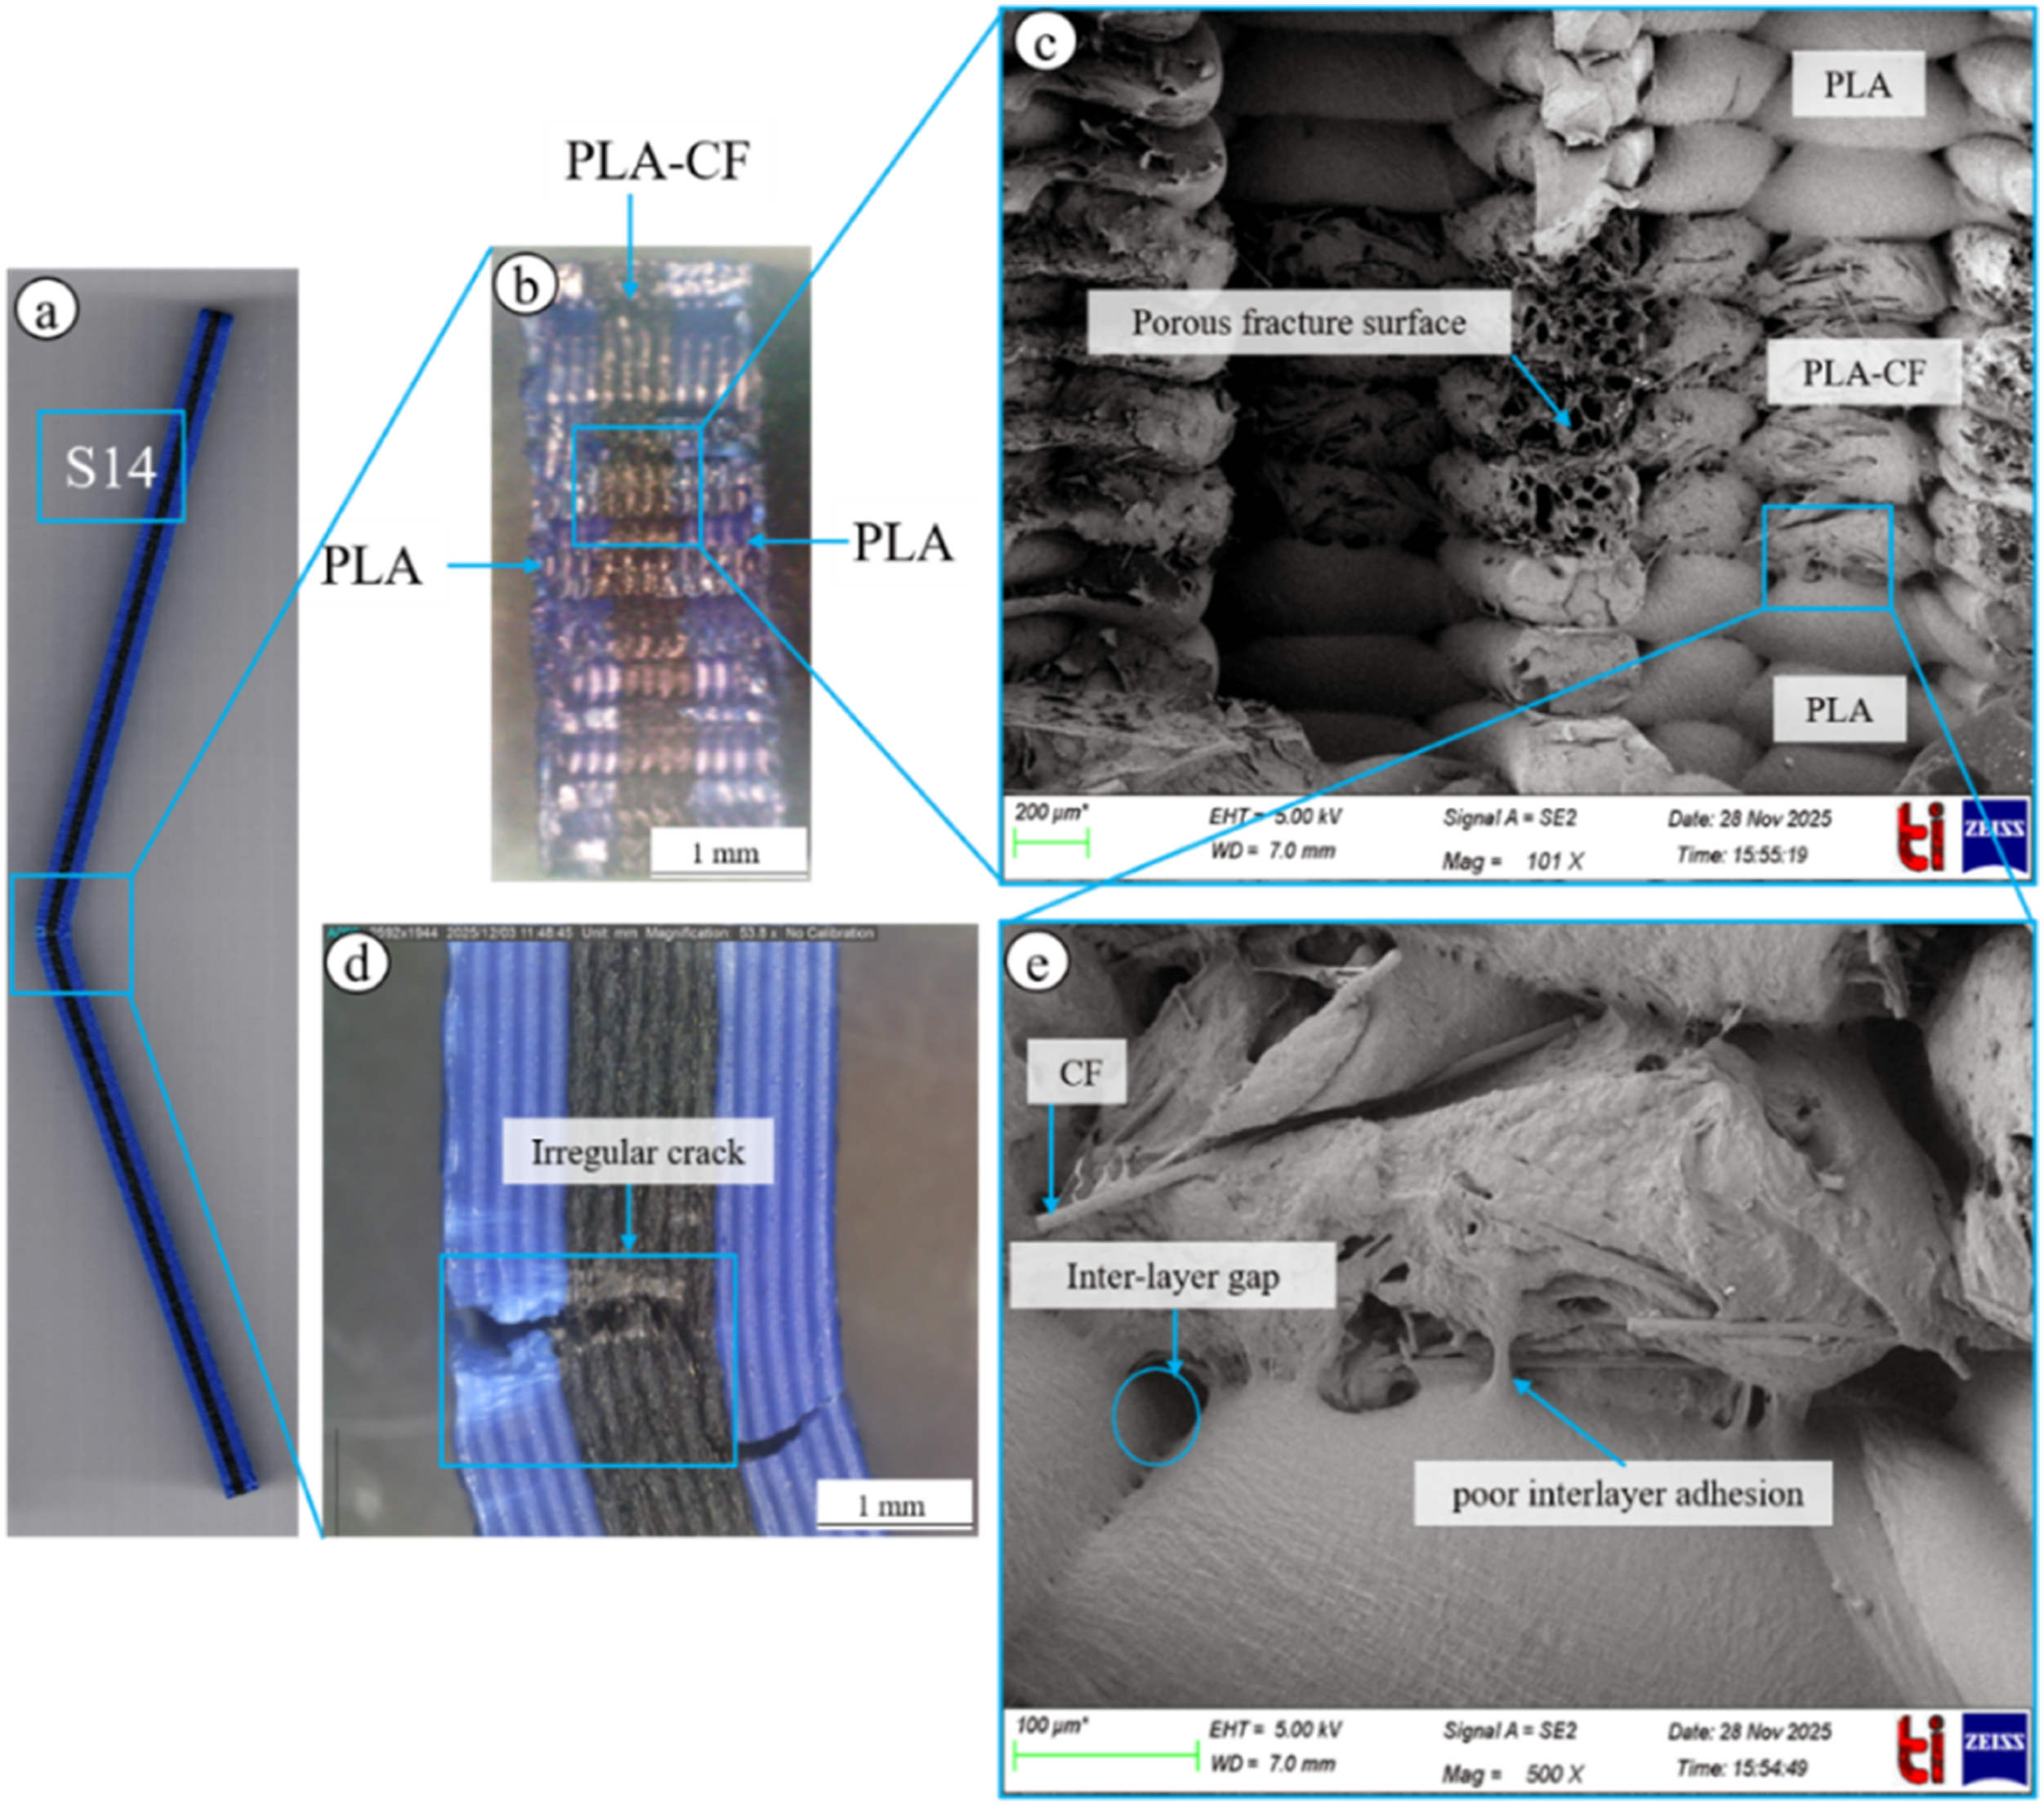
Conclusion
In light of the experimental observations, statistical analysis and fractographic evidence discussed above, the following key conclusions can be drawn regarding the mechanical behaviour and parametric optimisation of the 3D-printed PLA–CF/PLA sandwich structures: • Infill pattern is the primary design variable for PLA/PLA-CF sandwich specimens, governing 48%–80% of the variance in tensile and flexural responses; Gyroid maximizes Et and Ɛf, whereas Honeycomb yields the highest σUTS and σflex, confirming that internal architecture must be selected according to the dominant loading mode. • Layer height significantly affects tensile stiffness and ductility but has negligible influence on flexural modulus: reducing layer height from 0.30 to 0.20 mm increases Et and σUTS due to improved interlayer bonding, while increasing layer height enhances Ɛf and flexural strain capacity by enabling greater interlayer deformation. • Printing speed shows only a minor, statistically non-significant effect on all five responses within the tested range, indicating that once a stable extrusion regime is maintained, mechanical performance is controlled mainly by geometry rather than deposition rate; intermediate speeds are nevertheless preferable to avoid under-fusion or thermal degradation. • Regression models for σUTS, Ɛf, Et and σflex exhibit good predictive capability (R2 ≈ 0.65–0.90), allowing reliable estimation of mechanical properties for any factor combination inside the L27 design space and supporting the selection of process windows for design. • Fractography of high and low performance specimens confirms the statistical trends: high-strength samples show well-fused layers, strong fibre–matrix bonding and fibre bridging, whereas low-strength specimens exhibit voids, interlayer gaps and extensive fibre pull-out or delamination, highlighting the crucial role of interfacial quality in optimised FDM sandwich structures. • The suggested sandwich specimen offers a distinct value advantage over PLA-CF components by effectively addressing inherent FDM porosity and brittleness, leveraging the exceptional specific damping properties of TPMS cores to achieve enhanced strength-to-weight ratios for advanced industrial applications.
Footnotes
Funding
The authors received no financial support for the research, authorship, and/or publication of this article.
Declaration of conflicting interests
The authors declared no potential conflicts of interest with respect to the research, authorship, and/or publication of this article.