
Abstract
Background:
Actigraphy plus single-channel electroencephalography (EEG) has a high agreement with polysomnography and is considered a simple method for monitoring sleep at home. No studies, however, have evaluated its agreement with sleep logs.
Purpose:
A sleep log was compared to a single-channel EEG in adults with sleep disturbances. The determinants of the agreement between the two recording methods were explored.
Method:
This prospective comparison substudy included 71 participants aged 22–67 years sampled from a previous study of nonpharmacological therapy for sleep disturbances. The participants concurrently used a sleep log and a single-channel EEG machine for 6 days to measure their sleep at home. Total sleep time (TST) and sleep onset latency (SOL) were compared.
Results:
Correlations between measurements were .43 for TST (p < .001) and .30 (p < .01) for SOL. Bland–Altman analysis revealed that the mean bias between methods was 81.54 min (standard deviation [SD] = 66.72 min) for TST and 5.58 min (SD = 25.38 min) for SOL. SDs for both TST and SOL were higher for the sleep log than for EEG. A multivariate linear regression model demonstrated that age (standardized coefficient β = .42, p = .001) was a significant predictor of the mean difference in SOL measurements, accounting for 13.7% of the total variance in the mean difference.
Conclusion:
Sleep log and single-channel EEG sleep measures are distinct from one another, and age predicts the mean level of disagreement between the two measures in adults with sleep disturbances.
Sleep disturbances are highly prevalent in various populations and patient groups. The agreement of subjective and objective instruments for measuring sleep has long been a concern in the field of sleep study. Recently, an increasing number of studies have examined the agreement between these two types of measures in diverse populations (Dick et al., 2010; O’Brien, Hart, & Wing, 2016; Segura-Jimenez et al., 2015). Such studies have reported different levels of agreement between self-reported sleep and the data obtained using actigraphs or polysomnography (PSG) in individuals with diverse diagnoses.
Biopsychosocial factors such as age, gender, race, ethnicity, depression, and anxiety can influence sleep quality (Knutson, 2013). Sleep quality (O’Brien et al., 2016; Taibi et al., 2009), age (Segura-Jimenez et al., 2015; Taibi et al., 2009), gender (Taibi et al., 2009), and educational level (Segura-Jimenez et al., 2015) are associated with the agreement between subjective and objective sleep measurements. However, which biopsychosocial determinants of sleep predict agreement between subjective and objective measurements of sleep remains unclear and, therefore, warrants further study (Segura-Jimenez et al., 2015).
Since at least 1978, researchers and providers have used actigraphic methods to objectively record motor activity (Kripke, Mullaney, Messin, & Wyborney, 1978). Actigraphs can automatically analyze sleep–wake patterns by detecting movement: Less movement indicates a sleeping state and more movement is associated with the awake state. Because actigraphs are effective and convenient for detecting sleep–wake patterns, researchers have adopted them for use in sleep studies in healthy populations with no reported sleep disturbances (Fietze et al., 2009) and are increasingly using them in sleep studies of more diverse patient populations (O’Brien et al., 2016; Taibi, Landis, & Vitiello, 2013; Werner, Griffin, & Galovski, 2016). Taibi, Landis, and Vitiello (2013), however, reported that actigraphy appeared to underestimate sleep disturbance, particularly for older women with insomnia. Other researchers have reported observing systematic measurement error of actigraphy data in patients with different sleep characteristics (Blackwell, Ancoli-Israel, Redline, & Stone, 2011). As compared with polysomnography (PSG), the reliability of the measurement of sleep onset latency (SOL) by actigraphy is controversial (Martin & Hakim, 2011), with studies showing that actigraphy underestimates SOL (Taibi et al., 2013) or provides inconsistent reports (Lichstein et al., 2006). Recent studies revealed that wrist actigraphy data had poor (Taibi et al., 2013) or only modest correlation with PSG (Ray et al., 2014).
When actigraphy is combined with single-channel electroencephalography (EEG), however, it produces results highly consistent with PSG, the benchmark of sleep measurement. Single-channel EEG and PSG are equally effective in determining total sleep time (TST) and SOL (Fietze et al., 2015). A simple method for sleep monitoring, single-channel EEG can determine not only the parameters of sleep macrostructure (e.g., TST and SOL) but also the distribution of the light-sleep stages (1 and 2), slow-wave sleep, and REM sleep (Fietze et al., 2015). Accordingly, researchers consider single-channel EEG to be a useful research tool (Kayikcioglu, Maleki, & Eroglu, 2015; Lucey et al., 2016), and it is a reliable method for comfortable outpatient sleep recording (Fietze et al., 2015). Researchers have employed single-channel EEG to collect objective sleep data for highly comprehensive evaluations of the effectiveness of interventions for sleep quality in the home environment (Huang, Chang, & Lai, 2016).
To assess the subjective measures of sleep quality that cannot be derived from objective sleep measures, such as the daytime consequences of sleep, researchers frequently use sleep logs. Rogers, Caruso, and Aldrich (1993) verified that the sleep log is a reliable instrument for investigating nocturnal sleep–wake patterns in normal and narcoleptic patients. Sleep logs have also been used in conjunction with actigraphy to assess sleep quality in individuals with posttraumatic stress disorder (Werner et al., 2016) and cancer survivors (Moore, Schmiege, & Matthews, 2015).
Research has not yet clarified the congruence between sleep-quality parameters derived from sleep logs and those derived from single-channel EEG in adults with sleep disturbances. Therefore, in the present study, we evaluated the agreement between sleep logs and single-channel EEG combined with actigraphy in the measurement of indicators of sleep quality. In addition, we explored the predictors of the agreement between the two techniques.
Method
Study Design and Participants
We adopted a prospective comparison design for this substudy, which we conducted in 2016. Participants, whom we recruited from a hospital in Taiwan, comprised all 71 outpatients, aged 22–67 years, who completed six nights of single-channel EEG and sleep-log records in their homes as part the parent study on nonpharmacological therapy for sleep disturbances. Included participants met the following criteria: aged 20 years or older, had poor sleep quality (Buysse, Ancoli-Israel, Edinger, Lichstein, & Morin, 2006), TST ≤ 6.5 hr, SOL > 30 min, or Pittsburgh Sleep Quality Index (PSQI) score > 5 (Buysse, Reynolds, Monk, Berman, & Kupfer, 1989). We excluded prospective participants if they were pregnant or had a history of alcohol or drug abuse or psychiatric or neurological problems. At the time of recruitment for the present study, 24 of the participants were not receiving any sleep-related treatment, whereas the other participants were receiving nonpharmacological therapy for their sleep disturbances.
Measures
Participant characteristics
We recorded the age, education, and marital status of the participants in addition to whether they consumed hypnotics or napped in the daytime.
Objective sleep quality
To measure objective sleep quality, we used a portable single-channel EEG machine connected to an actigraph (SOMNOmedics GmbH, Germany). The range of the magnitude signal of the actigraph is within ±8.7 G at a sensitivity of 0.004 G. The EEG machine featured a single-channel montage (F4-M1) for scoring sleep parameters. We applied the standard sleep criteria to mark the electrode sites (Iber, 2007). We detected the brain-wave patterns using the single-channel EEG and stored them in the connected actigraph recorder, which we applied to the participants’ chests.
The single-channel EEG sampling rate was 256 Hz. A qualified senior sleep technician visually scored the sleep recordings in 30-s intervals (Rechtschaffen & Kales, 1968). To analyze the EEG data, we used DOMINO Version 2.2.0 software (SOMNOmedics, Germany). Researchers have previously employed single-channel EEG to collect data in nonpharmacological interventions on sleep in adults with insomnia (Huang et al., 2016). Participants recorded the EEG sleep data each night over the study period of 6 nights.
Subjective sleep quality
We used the PSQI (Buysse et al., 1989) and sleep logs to measure subjective sleep parameters. The PSQI is a self-report questionnaire consisting of 19 questions that measures sleep habits during the previous month. The questions are scored and summed to produce a global sleep quality score ranging from 0 to 21. A global score >5 signifies poor sleep quality (Buysse et al., 1989). Cronbach’s α for this instrument is .83, indicating a high degree of internal consistency. The Chinese version of the PSQI that we used for this study has a sensitivity of 0.98 and a specificity of 0.55 for individuals with insomnia (Tsai et al., 2005). We administered this questionnaire during in-person screening for study eligibility.
We used sleep logs to assess the total hours of sleep (TSTlog) and the number of minutes required to fall asleep (SOLlog). Participants completed a sleep log at home in the morning when they woke up for each of the six nights in the study period.
Trait anxiety
We measured trait anxiety, a measure of a respondent’s general disposition as it relates to anxiety, using Spielberger’s State-Trait Anxiety Inventory (STAI; Spielberger, Gorsuch, Lushene, Vagg, & Jacobs, 1983). This Anxiety Scale consists of 20 self-reported items. Each item has a Likert-type scale ranging from 1 to 4. A total score of 20 indicates the absence of anxiety, and a score of 80 indicates high anxiety. STAI exhibits adequate validity and reliability.
Depression
We used the Taiwanese Depression Scale to measure depression (Yu, Liu, & Li, 2008). This inventory uses a 4-point Likert-type scale response format. A total score of 0 indicates the absence of depression, while a score of 66 indicates severe depression. Respondents whose score is >37 are considered to have clinical depression. Prior research has established the validity and reliability of this instrument (Yu et al., 2008). Cronbach’s α for the Depression Scale was .95 in the present study.
Data Collection
The Research Ethics Committee of Tzu Chi Hospital approved this study. We assured participants of confidentiality, and participation was voluntary. Participants provided informed consent. After we collected the sociodemographic data, we informed participants about sleep measurement protocols, and they observed demonstrations on using the portable single-channel EEG machine in their homes. We fitted participants with the actigraphy equipment on their chest and instructed them to wear the single-channel EEG lead when going to sleep. We further instructed them to press a marker button when getting into bed at night and again when getting out of bed in the morning to indicate time to bed and wake-up time and to record their TST and SOL in their sleep log upon awaking each morning. The sleep studies were conducted in the participants’ homes. After 6 days, a research assistant collected the single-channel EEG machine and sleep log from each participant’s home.
Data Analysis
We performed statistical analyses using PASW Version 18.0 for Windows (SPSS Inc., Chicago, IL). We averaged the single-channel EEG sleep data and sleep-log data for each participant across the six assessment nights and analyzed the mean TST and SOL scores. To determine the normality of the distribution of paired data, we applied the Kolmogorov–Smirnov test. We conducted a one-sample t test to examine the differences between the EEG and sleep-log measurements. We compared the test variable of the one-sample t test with a “test value” of 0, which represented the mean in the population. To examine the association between the sleep parameters measured by the sleep log and those measured by EEG, we used Pearson’s r correlation. To evaluate the between-method agreement by comparing the TST and SOL values obtained through the two different sleep-recording methods, we used Bland−Altman plots (Bland & Altman, 1986). For each pair of measurements, we calculated the difference between them for the same participant and then computed the mean difference. We estimated mean differences between the single-channel EEG data and the sleep-log data as a measure of bias and the upper and lower limits of agreement defined as mean difference ± 1.96 × standard deviation. We displayed the mean difference (bias) and the 95% confidence interval (CI) of the mean on a Bland–Altman plot. We considered the 95% CIs to be a measure of precision, and they included the agreement between single-channel EEG data and sleep-log data. We expressed the CIs as the difference between the limits of agreement to facilitate the comparison of the width of the intervals between the upper limit of agreement and the lower limit of agreement of the corresponding methods. In addition, we used independent sample t tests and correlations to detect any association among the mean difference of the sleep parameters measured through the sleep log, those measured through single-channel EEG, and the participants’ characteristics (including depression, anxiety, and use of sleep aids). To detect any association between educational levels and mean differences of TST and SOL, we used Spearman rank-order correlations. We considered p values less than α = .05 to be statistically significant.
Results
Participant Characteristics
The mean age of the participants was 41.06 years (standard deviation [SD] = 16.66, range 22–67). Of the 71 participants, only 20.1% were males, and approximately half (35, 49.3%) had received postsecondary education. In addition, more than one third (n = 25) of the participants regularly napped in the daytime, whereas 16.9% occasionally consumed hypnotics to induce sleep. The participants’ average trait anxiety score was above 40 points (44.03, SD = 8.61), and their average depression score was 20.76 (SD = 12.93). Few participants (n = 9, 12.7%) had depression scores >37, indicating that they were clinically depressed.
Comparison of Sleep Log and Single-Channel EEG Sleep Parameters
The mean differences between the sleep log and single-channel EEG measurements were 81.54 min for TST and 5.58 min for SOL, indicating that the participants overestimated TST and SOL. Both TST and SOL standard deviations were higher for the sleep log than for the single-channel EEG (Table 1). We used one-sample t tests to examine whether the mean differences between the two measures for TST and SOL were equal to 0. The results revealed a statistically significant difference for TST (t = 10.29, p < .001) but not for SOL (t = 1.85, p = .07). We have presented the Pearson correlation coefficients between the sleep measures in Table 1. There was a significant correlation between the sleep log and the single-channel EEG measures of TST (r = .43, p < .001). Single-channel EEG SOL also correlated significantly with sleep-log SOL (r = .30, p < .01). However, the correlations between the methods were moderate for both TST and SOL.
Comparison of Sleep Parameters Derived From Single-Channel Electroencephalography (EEG) and Sleep Log.
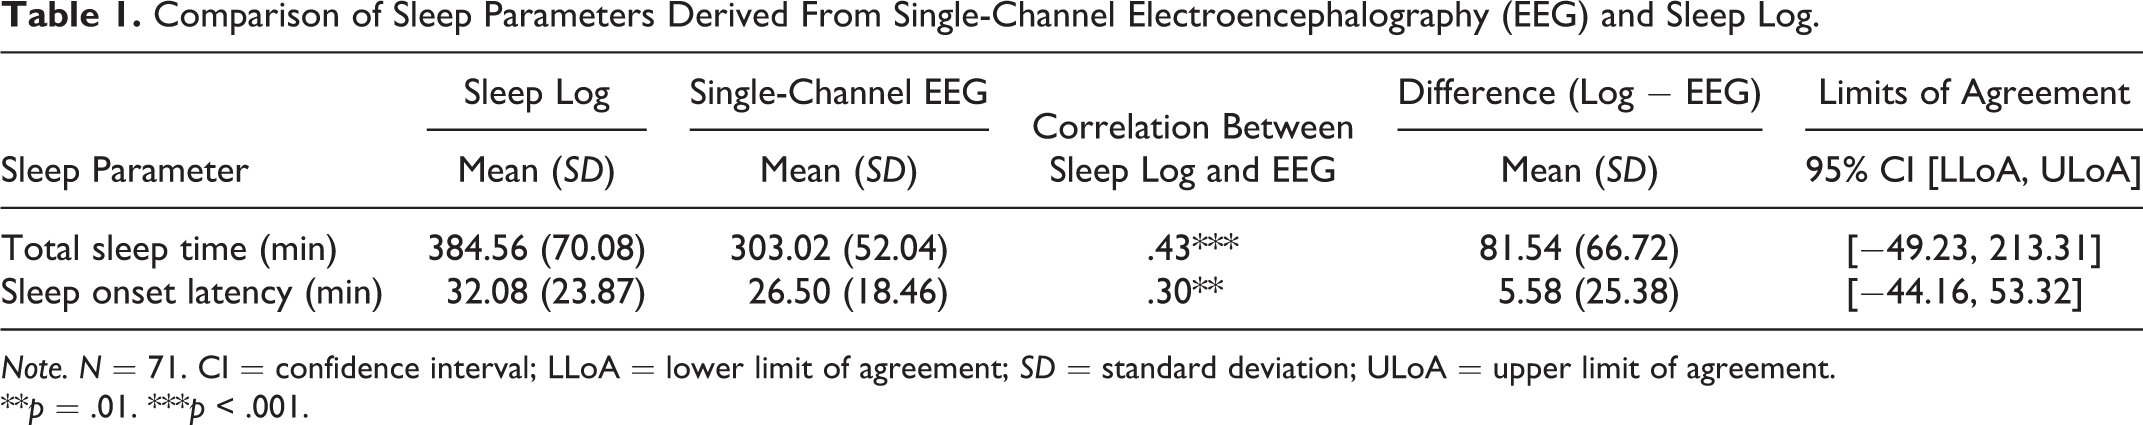
Note. N = 71. CI = confidence interval; LLoA = lower limit of agreement; SD = standard deviation; ULoA = upper limit of agreement.
**p = .01. ***p < .001.
Agreement Between Sleep-Log and Single-Channel EEG Measurements
We assessed intermethod agreement between the sleep log and single-channel EEG using Bland–Altman plots (Figures 1 and 2). The difference between sleep log and single-channel EEG measures (bias) is plotted on the y-axis, whereas the mean of the two measures is plotted on the x-axis. The mean biases (±SD) of the TST (Figure 1) and the SOL (Figure 2) between the methods were 81.54 (±66.72) and 5.58 (±25.38) min, respectively. The plots show disagreements between methods for TST and SOL across the range of the measures. A clear trend in the difference between methods was that most participants recorded longer TST in their sleep logs than the single-channel EEG recorded, indicating that the sleep log tended to overestimate the TST compared to EEG. In addition, the differences between methods for SOL were greater for the participants who had longer SOL (Figure 2).
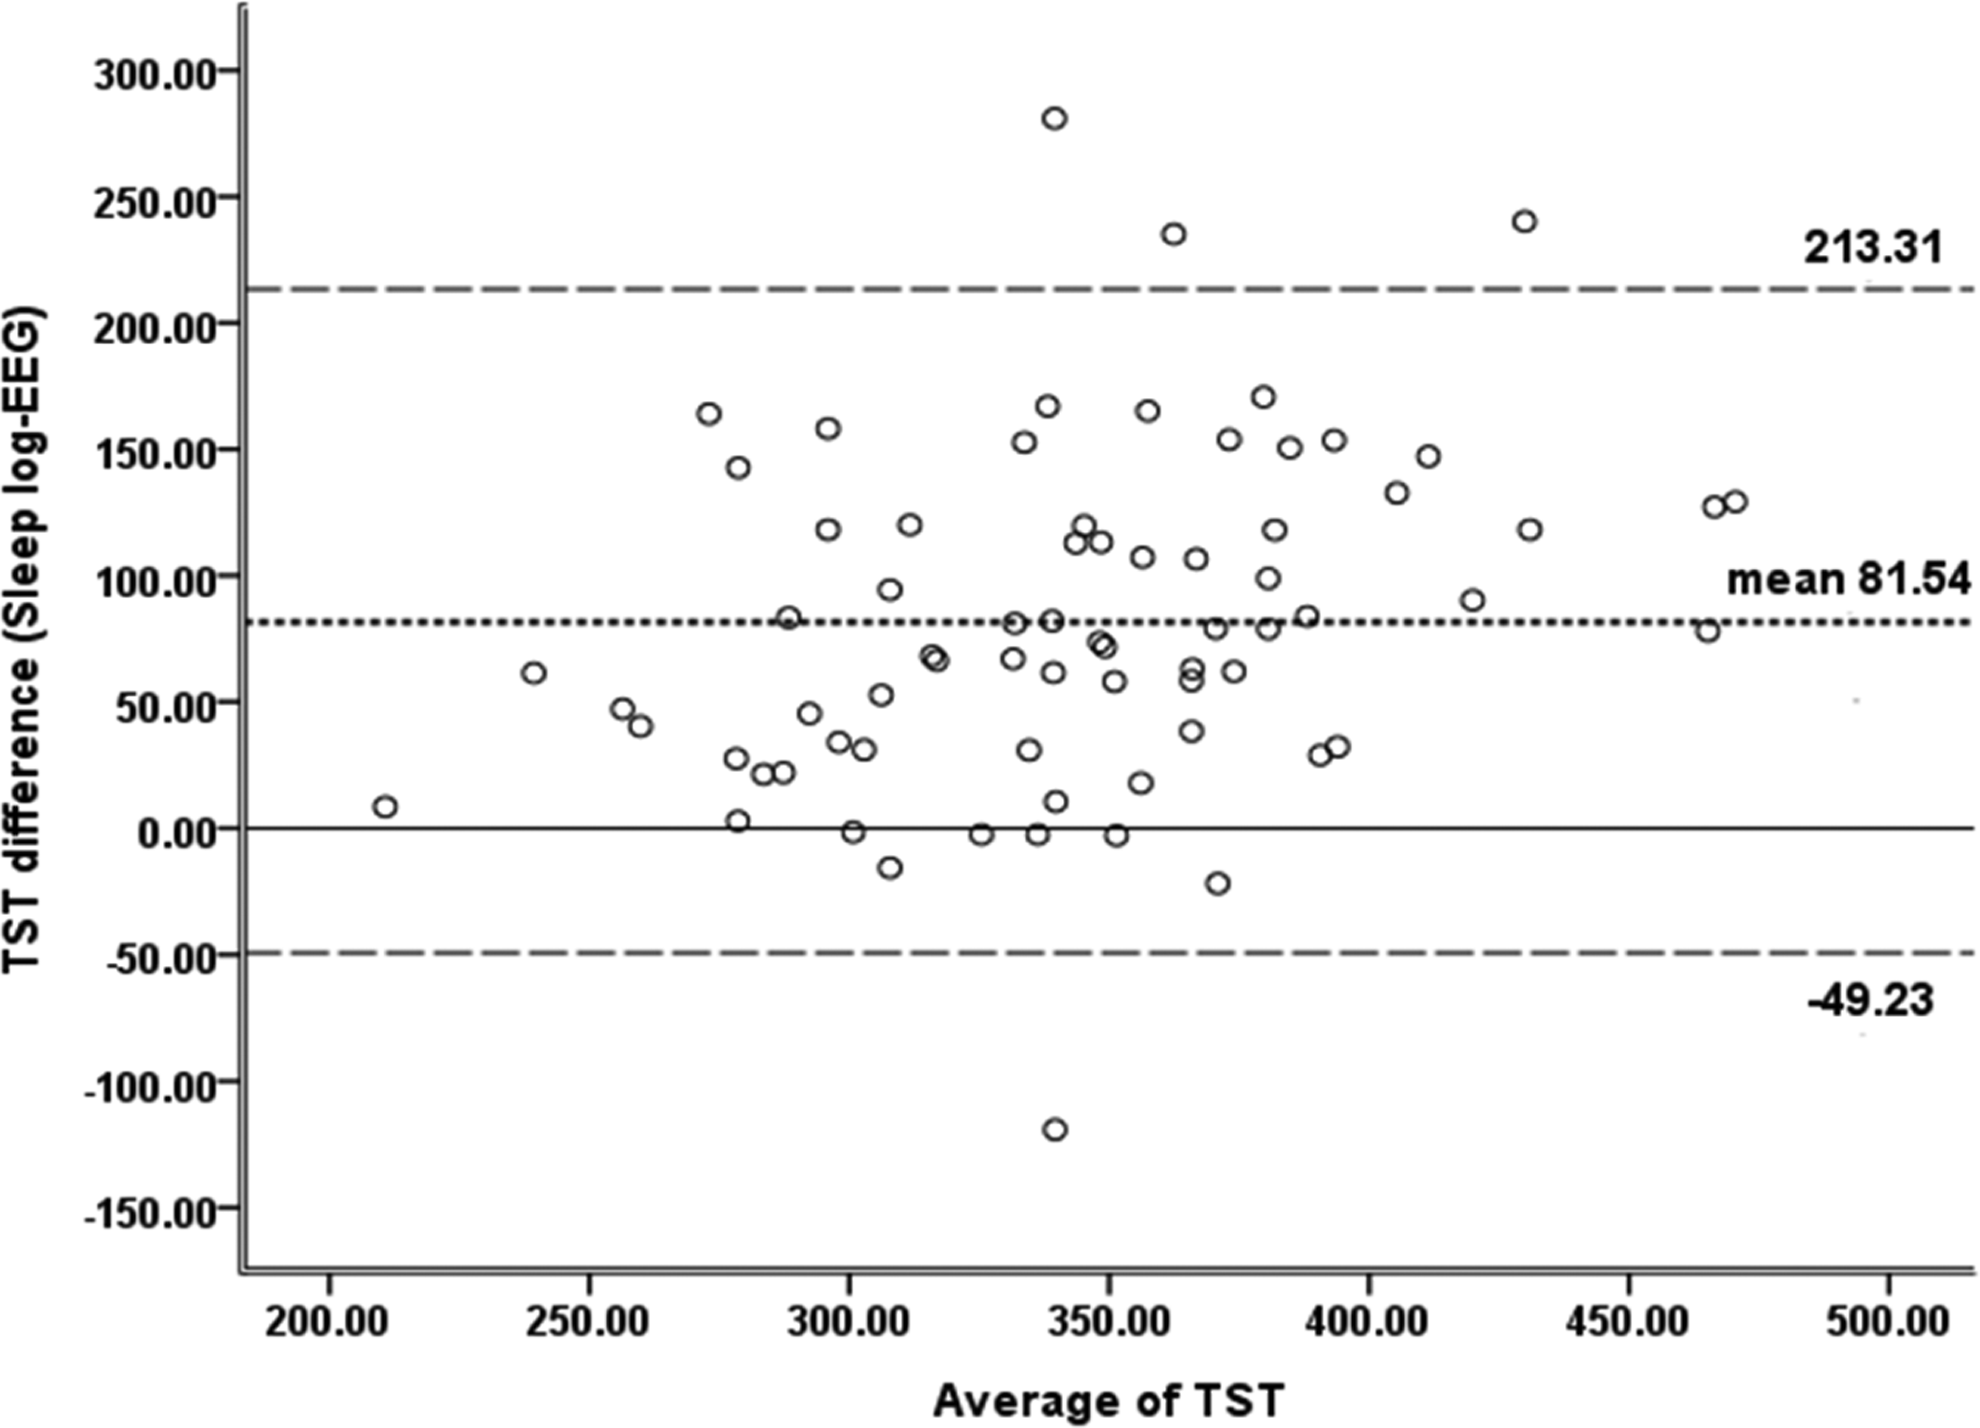
Bland–Altman plots of total sleep time (TST). The graphs show the difference (y-axis) between the sleep log and single-channel electroencephalography (EEG; sleep-log value − EEG value) measures plotted against the average value (x-axis) of the two measures. The horizontal reference line represents zero difference between the two methods for measuring TST outcome (solid line). Values above the zero-difference line indicate higher sleep-log than single-channel EEG values. The dotted line represents the difference between the mean values of the two measures, whereas the dashed lines represent the limits of agreement (mean ± 1.96 × SD). The bias of 81.54 min indicates that the sleep log overestimated TST by approximately 81.54 min on average.
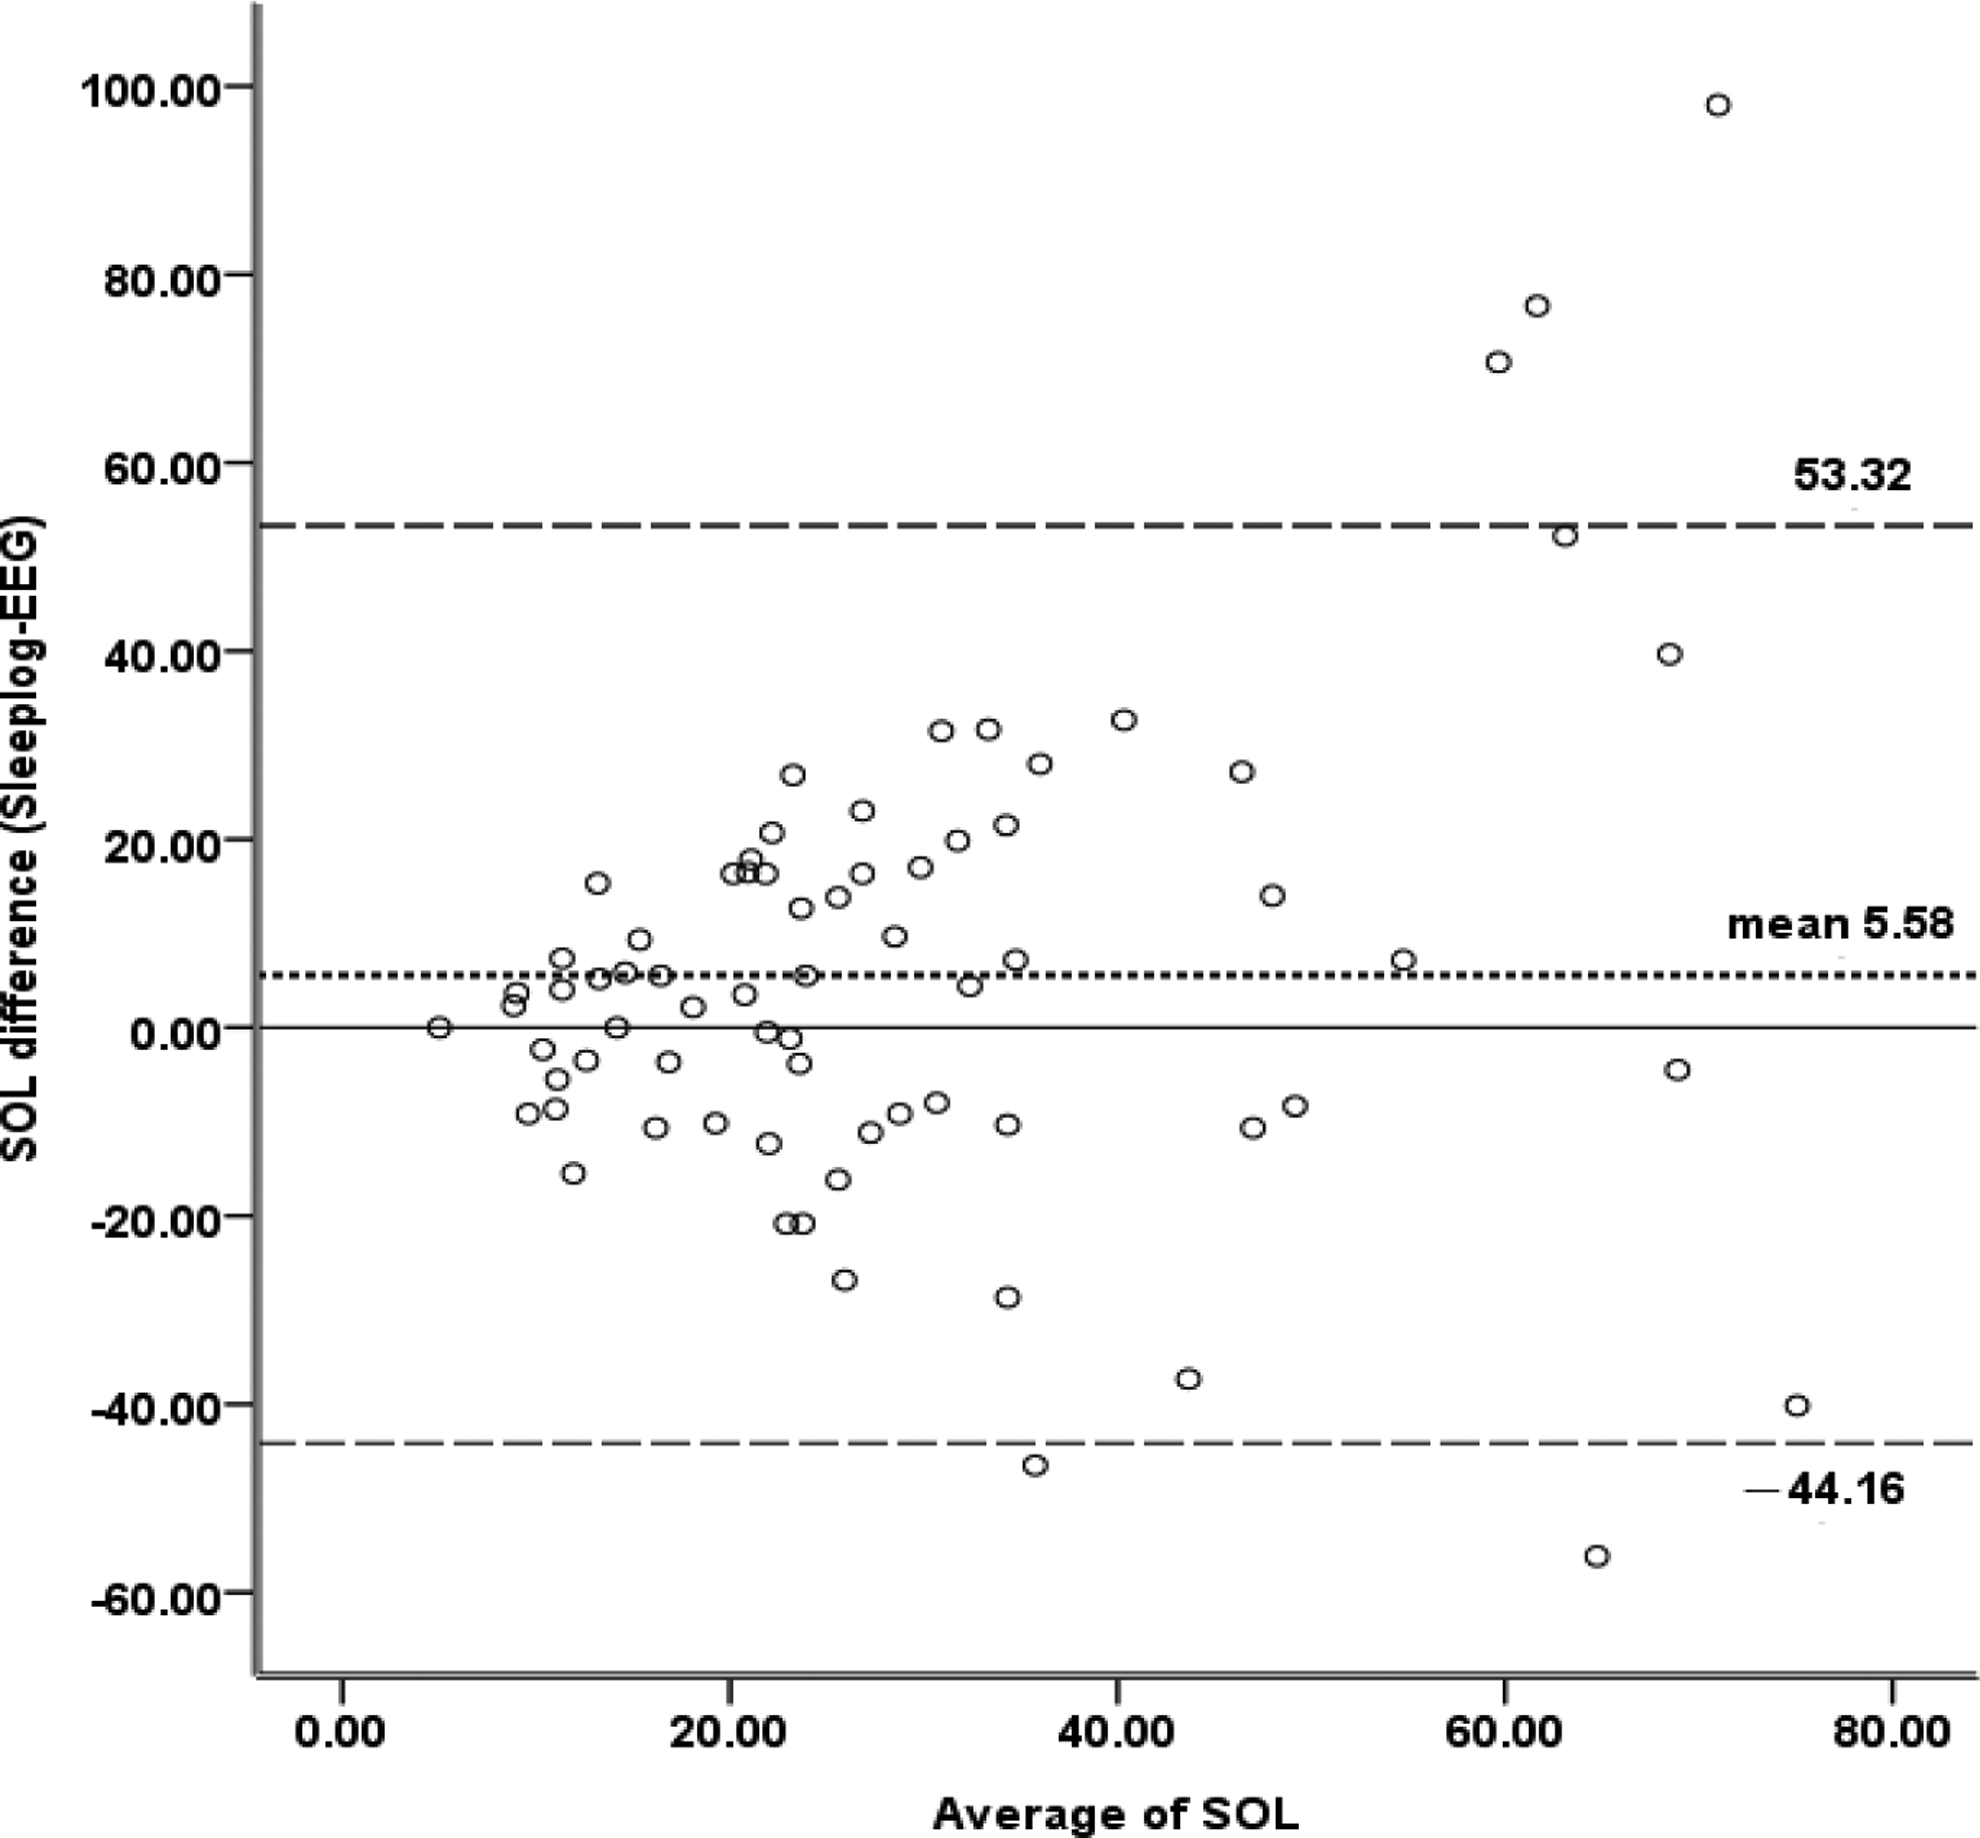
Bland–Altman plots of sleep onset latency (SOL). The graphs show the difference (y-axis) between the sleep log and single-channel electroencephalography (EEG) measurements (sleep-log value − EEG value) plotted against the average value (x-axis) of the two measures. The horizontal reference line represents zero difference between the two methods for measuring SOL outcomes (solid line). Values above the zero-difference line indicate higher values for the sleep log than for the single-channel EEG values. The dotted line represents the difference between the mean values of the two measures, whereas the dashed lines represent the limits of agreement (mean ± 1.96 × SD). The bias of 5.58 min demonstrates that the sleep log overestimated SOL by approximately 5.58 min on average.
Associations Between Participant Characteristics and Mean Differences Between Measurements
We used independent sample t tests and Pearson correlations to examine the associations between the mean differences between the measurements and participants’ characteristics (including depression, anxiety, and use of sleep aids). To corroborate whether any variable explained the agreement between methods, we divided participants into two categories based on age for further analysis: age <60 years and age ≥60 years. The findings revealed no significant associations between the mean differences between the two measures of TST and any of the participant characteristics. However, age was significantly associated with the mean difference between the measures of SOL (t = −3.56, p = .002), indicating that older adults tended to have a greater difference between the two measures of SOL than younger adults. Moreover, the mean difference between the measures of SOL was significantly greater in participants with lower versus higher educational level (t = 2.32, p = .02). Finally, the PSQI global sleep quality score was correlated with the mean difference between the measures of SOL (r = .27, p = .03) such that poorer global sleep quality was associated with larger mean differences.
Predictors of Mean Difference Between Sleep Log and Single-Channel EEG Measurements
We used multivariate linear regression to determine which of the significant factors identified in the bivariate analysis were independently associated with the mean difference between measures of SOL. We entered three such variables simultaneously in the regression analysis (Table 2). The regression model indicated that age (standardized coefficient β = .42, p = .001) was a significant predictor of the mean difference between measures of SOL, accounting for 13.7% of the total variance, after controlling for education and global sleep quality. The multiple regression model explained 25.8% (adjusted R 2 scores: 22.5%) of the mean difference between the measures of SOL.
Multiple Linear Regression Model for the Prediction of the Mean Difference Between Measures of Sleep Onset Latency.
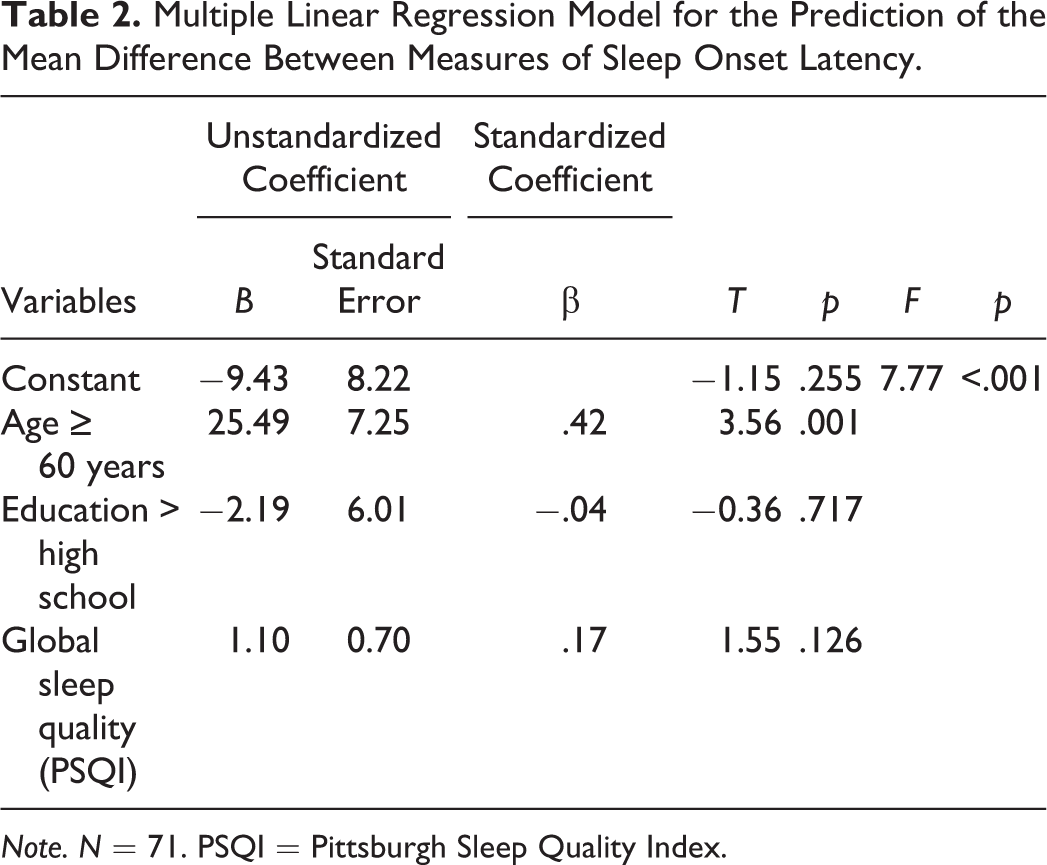
Note. N = 71. PSQI = Pittsburgh Sleep Quality Index.
Discussion
This is the first study to assess agreement between the subjective sleep measure of sleep logs and the objective measure of single-channel EEG combined with actigraphy. We chose to use single-channel EEG in order to diminish the limitations of actigraphy, such as underestimated sleep disturbance in adults with insomnia (Taibi et al., 2013). In our sample of adults with sleep disturbances, the Bland−Altman plots demonstrated a lack of agreement between methods for both TST and SOL. Our analyses also indicated that age was the only independent predictor among participant characteristics, after controlling for education and global sleep quality score, of the mean difference between the measures of SOL. The present study was a substudy, whose sample was derived from a concurrent interventional study. The mean differences between measures of TST and SOL did not differ significantly between participants who were receiving interventions and those who were not.
Compared to single-channel EEG, participants overestimated TST by a mean of approximately 81.54 min in their sleep logs, and the correlation between methods for measuring TST was moderate. Additionally, participants slightly overestimated SOL in their sleep logs compared to single-channel EEG, and there was a moderately significant correlation between SOL measurements. The standard deviation of the mean sleep-log SOL was 4.5 times larger than the mean difference between measures of SOL, as shown in Table 1. Although the sleep log has proven to be a reliable instrument for collecting nocturnal sleep–wake data, researchers have reported that its reliability becomes more questionable for individuals who are likely to nap frequently during the daytime (Rogers, Caruso, & Aldrich, 1993). More than one third of the participants in the present study regularly napped during the day, which may partly explain our results.
The novelty of the present study inhibits our ability to compare our findings with those of previous studies. However, recent similar studies analyzing the mean differences between questionnaire and actigraphy measures of sleep parameters in other populations have demonstrated both similar and conflicting results. For example, the results of Moore, Schmiege, and Matthews (2015) are comparable to our findings concerning the difference between the two measures of TST. However, our results conflict with those of other studies, in which subjective measurement of sleep underestimated TST in women with fibromyalgia (Segura-Jimenez et al., 2015) and in patients with posttraumatic stress disorder (Werner et al., 2016). These conflicting results may be due to differences between studies in participant age or other participant characteristics, study setting, or sample size.
No participant characteristics were associated with the mean difference between measures of TST in the present study. By contrast, we detected that age ≥60 years old, less than a secondary educational level, and poorer global sleep quality score were significantly associated with a higher mean difference between measures of SOL. These results are similar to those of O’Brien, Hart, and Wing (2016), who observed that poor sleep quality was associated with a greater discrepancy between actigraphy and self-reporting among 63 overweight to obese participants seeking treatment for overweight. Additionally, Segura-Jimenez et al. (2015) analyzed agreement between self-reported sleep patterns and those measured through actigraphy in 127 women with fibromyalgia and 53 healthy women and determined that age and educational status accounted for the intermethod mean difference in TST in the women with fibromyalgia.
Limitations and Implications
In the present study, we assessed the agreement between subjective and objective methods of measuring only TST and SOL in adults with sleep disturbances. Consequently, we cannot draw any conclusions about agreement between measurements for other sleep parameters. Future studies should evaluate additional sleep parameters to further knowledge of the agreement between sleep log and single-channel EEG measurements. Further, although an actigraph connected to a single-channel EEG machine is a simple tool for measuring sleep in the home environment, we do not know whether an extended single-channel EEG cable is more uncomfortable to wear than an actigraph alone. The congruency of measurements between an actigraph and an actigraph connected to a single-channel EEG needs further study. Because we performed the sleep measurements in participants’ homes, the normal sleep environment for individuals with sleep disturbances, the results can be generalized to normal daily life. However, generalization of our findings is limited to adults with sleep disturbances. Finally, our results showing that age was associated with the difference between measures of SOL suggest that further research is required for assessing the effects of age on the agreement between objective and subjective sleep measurements.
Conclusion
The findings of the present study demonstrate incongruence between subjective sleep measures of TST and SOL derived from a sleep log and objective measures derived from single-channel EEG among adults with sleep disturbances. Age predicted the disagreement between the subjective and objective measures of SOL.
Subjective and objective sleep measures are both clinically relevant. A diagnosis of impaired sleep, for example, is based on self-reported sleep quality rather than objective measures of sleep. Therefore, clinicians and researchers should consider using both types of measures and assess them as unique parameters. However, our results suggest that subjective ratings to evaluate sleep in adults with insomnia, particularly in older adults, should be used carefully in both research and clinical settings.
Footnotes
Acknowledgment
The authors thank Hsiu-Mei Wang for technical support.
Author Contribution
En-Ting Chang contributed to conception, analysis, and interpretation; critically revised the manuscript; gave final approval; and agrees to be accountable for all aspects of work ensuring integrity and accuracy. Chiung-Yu Huang contributed to conception, analysis, and interpretation; drafted the manuscript; critically revised the manuscript; gave final approval; and agrees to be accountable for all aspects of work ensuring integrity and accuracy. Hui-Ling Lai contributed to conception, design, analysis, and interpretation; drafted the manuscript; critically revised the manuscript; gave final approval; and agrees to be accountable for all aspects of work ensuring integrity and accuracy.
Declaration of Conflicting Interests
The author(s) declared no potential conflicts of interest with respect to the research, authorship, and/or publication of this article.
Funding
The author(s) disclosed receipt of the following financial support for the research, authorship, and/or publication of this article: This study was supported by the National Science Council, Taiwan, grant no. NSC102-2628-B-320-001-MY3.