
Abstract
Purpose:
The aim of this study was to evaluate the relationship between serum adiponectin levels and carotid–femoral pulse wave velocity (cfPWV) in hemodialysis (HD) patients.
Method:
Blood samples were obtained from 120 HD patients. cfPWV was measured with a validated tonometry system (SphygmoCor; AtCor Medical, West Ryde, Australia). Serum adiponectin levels were measured using a commercially available enzyme-linked immunosorbent assay kit.
Results:
By univariate linear analysis of cfPWV in HD patients, we found that diabetes (r = .281, p = .002), pre-HD body weight (r = .194, p = .033), post-HD body weight (r = .192, p = .036), waist circumference (r =.210, p = .022), and body fat mass (r = .194, p = .034) were positively correlated, whereas adiponectin level (r = −.254, p = .005) was negatively correlated with cfPWV in HD patients. Multivariate forward stepwise linear regression analysis showed that diabetes (β = .274, p = .006) and adiponectin level (β = −.215, p = .016) were independent predictors of cfPWV in HD patients. Moreover, post-HD body weight (β = −.274, p = .041), waist circumference (β = −.311, p < .001), logarithmically transformed triglyceride level (log-TG; β = −.186, p = .031), and log-glucose (β = −.225, p = .008) were negatively associated with adiponectin levels in HD patients after multivariable forward stepwise linear regression analysis.
Conclusions:
Among HD patients, serum adiponectin level was inversely associated with cfPWV level, and post-HD body weight, waist circumference, log-TG, and log-glucose were negatively associated with adiponectin level.
End-stage renal disease (ESRD) is a public health problem worldwide (Robinson et al., 2016). The major complication of ESRD is cardiovascular (CV) disease, which is also the leading cause of death among patients with ESRD (Blacher et al., 1999; Kahn, Robbins, Kim, & Fuster, 2013, Tonelli, Karumanchi, & Thadhani, 2016). Arterial stiffness is not only a characteristic of CV disease but also a traditional risk factor for CV events (Korjian et al., 2016; Prskalo et al., 2016). The carotid–femoral pulse wave velocity (cfPWV) is a simple, convenient, widely used, and noninvasive measurement to assess arterial stiffness (Mancia et al., 2013). Arterial stiffness is associated with many diseases such as hypertension, atherosclerosis, dyslipidemia, diabetes mellitus (DM), and chronic kidney disease, and cfPWV worsens when these comorbidities are present (Korjian et al., 2016; Palombo & Kozakova, 2016; Prenner & Chirinos, 2015; Sedaghat et al., 2015). Authors of a systematic review and meta-analysis reported that cfPWV is a strong predictor of future CV events and evaluated it in association with CV risk factors (Vlachopoulos, Aznaouridis, & Stefanadis, 2010).
Adiponectin, a 30-kDa peptide hormone secreted by white adipose tissue that is the most abundant of the adipocytes, offers protective effects against atherosclerosis and has anti-inflammatory and insulin-sensitizing characteristics (Freitas Lima et al., 2015; Galic, Oakhill, & Steinberg, 2010). Adiponectin plays a protective role in many diseases such as hypertension, DM, coronary artery disease, obesity, and vascular diseases (Freitas Lima et al., 2015; Ghantous, Azrak, Hanache, Abou-Kheir, & Zeidan, 2015; Shibata, Ouchi, Ohashi, & Murohara, 2017). Lower adiponectin levels are a novel marker for greater risk of cfPWV progression among apparently healthy men and are associated with arterial stiffness in young normotensive patients with type 1 DM (El Khoudary et al., 2012; Tsiakou et al., 2013). In a previous study, we noted that serum adiponectin concentration is negatively associated with cfPWV values in kidney transplant patients (Ho et al., 2016).
In the most dialysis clinics and hospitals, hemodialysis (HD) patients have good relationships with their dialysis nurses whose role is to encourage these patients and educate them regarding the risks and benefits of HD. The purpose of the present study was to examine the clinical variables such as the anthropometric and biochemical variables and the relationship between serum adiponectin levels and cfPWV values in HD patients. Since cfPWV value is a significant factor associated with future CV outcome, dialysis nurses can educate HD patients on the importance of increasing serum adiponectin levels and decreasing cfPWV values to decrease the risk of arterial stiffness.
Method
Research Design and Sample
The Tzu Chi University and Hospital Protection of Human Subjects Institutional Review Board approved the study. We used purposive sampling to enroll patients from our HD program between March and July 2015 at a medical center in Hualien, Taiwan (N = 120). Inclusion criteria were age older than 20 years, having received standard 4-hr dialysis 3 times per week using standard bicarbonate dialysate and having been on dialysis for at least 3 months. All patients were treated with the same high-flux polysulfone disposable artificial kidney (FX class dialyzer; Fresenius Medical Care, Bad Homburg, Germany). Exclusion criteria were severe infection, acute myocardial infarction, stroke, peripheral arterial occlusive disease, pulmonary edema at the time of blood sampling, or refusal to provide informed consent to participate in the study.
Anthropometric Analysis
Body weight was measured with the participants wearing light clothing and without shoes to the nearest half kilogram before and after HD. Height was measured to the nearest half centimeter. Waist circumference was measured to the nearest half centimeter at the shortest point below the lower rib margin and the iliac crest. Body mass index (BMI) was calculated as weight (kilograms) divided by height squared (meters). Body fat mass was measured by bioelectrical impedance analysis at the bedside according to the standard tetrapolar whole-body (hand–foot) technique using a single-frequency (50 kHz) analyzer (Biodynamic 450; Biodynamics Corporation, Seattle, WA) and analyzed using specific formulas supplied by the manufacturer (Ho et al., 2016; Hsu et al., 2015; Lee et al., 2014; J. H. Wang et al., 2014). Bioelectrical impedance analysis is highly correlated with magnetic resonance imaging for predicting muscle, fat, and whole-body volume (Miyatani, Kanehisa, Masuo, Ito, & Fukunaga, 2001). The same operator carried out all patients’ data measurements.
Biochemical Determinations
Participants’ blood samples were collected before they received HD therapy. The fractional clearance index for urea (Kt/V) and urea reduction ratio (URR) were measured before dialysis and immediately after dialysis, using a formal, single-compartment dialysis urea kinetic model. Blood samples (approximately 5 ml) were immediately centrifuged at 3,000g for 10 min. Serum samples were stored at 4°C and used for biochemical analysis within 1 hr of collection. Serum levels of blood urea nitrogen, creatinine, glucose, total cholesterol, triglyceride (TG), total calcium, and phosphorus were measured using an autoanalyzer (ADVIA 1800; Siemens Healthcare GmbH, Erlangen, Germany). Intact parathyroid hormone (iPTH) levels were measured using enzyme-linked immunosorbent assays (Diagnostic Systems Laboratories, Webster, TX), and serum adiponectin concentrations were determined using a commercially available enzyme-linked immunosorbent assay (SPI-Bio kit; Bertin Pharma, Montigny-le-Bretonneux, France; Ho et al., 2016; Hsu et al., 2015).
cfPWV and Pulse Wave Analysis Measurements
cfPWV was performed using a pressure tonometer to record the pressure pulse waveform of the underlying artery transcutaneously (SphygmoCor Cardiovascular Management System software version 8.2; AtCor Medical, West Ryde, Australia) as previously described (Ho et al., 2016; Hsu et al., 2015; Lee et al., 2014; J. H. Wang et al., 2014). cfPWV meets most of the essential criteria to be classified as a clinical surrogate end point and useful for primary and secondary CV disease prevention in Europe (recommendation: IIa, level of evidence: A; Vlachopoulos et al., 2015). All measurements were performed with the patient in the supine position after a minimum 10-min rest in a quiet, temperature-controlled room (24–26°C). Recordings were made simultaneously with an electrocardiographic signal, which provided an R-timing reference. Pulse wave measurements were recorded consecutively at the superficial carotid and femoral artery sites (carotid–femoral segment). The carotid–femoral distance was obtained by subtracting the carotid measurement site to sternal notch distance from the sternal notch to femoral measurement site distance. Integral software was used to process each set of pulse wave and electrocardiographic data to calculate the mean time difference between the R-wave and the pulse wave on a beat-to-beat basis, with an average of 10 consecutive cardiac cycles. The cfPWV was calculated using the distance and mean time difference between the two recorded points. Quality indices included in the software were set to ensure uniformity of data. A brachial pressure cuff was placed over the brachial artery on the patient’s left or right arm (the arm without HD access). The pulse wave analysis takes the patient’s brachial systolic blood pressure and diastolic blood pressure and then captures the patient’s brachial waveform.
Statistical Analysis
Data were analyzed using IBM SPSS Statistics for Windows version 19.0 software (IBM, Armonk, NY). Data were tested for normal distribution using the Kolmogorov–Smirnov test. Normally distributed data were expressed as the mean ± standard deviation, and comparisons between patients were performed using Student’s independent-samples t test (two-tailed). Data not normally distributed were expressed as the median and interquartile range. Data expressed as the number of patients were analyzed by the χ2 test. Because of HD duration, glucose, TG, and iPTH were not normally distributed, and we performed base 10 logarithmic transformations to achieve normality. For clinical variables that correlated with cfPWV values or adiponectin levels in HD patients, we used linear regression analysis. Variables that were significantly associated with cfPWV values or adiponectin levels in HD patients were tested for independence by multivariate forward stepwise regression analysis. A p value less than .05 was considered statistically significant.
Results
Baseline Characteristics and Biochemical Data
The study sample included 120 patients, comprising 62 males and 58 females. Demographic, biochemical, and clinical characteristics of the 120 HD patients appear in Table 1. Participants ranged in age from 27 to 92 years, with a mean age of 63.78 years. The mean HD therapy duration was 59.64 months (21.06–121.26). The mean body weights before HD and after HD were 62.81 ± 14.96 kg and 60.65 ± 14.52 kg, respectively. The major causes of uremia in this study were glomerulonephritis (n = 49 [40.8%]), DM (n = 47 [39.2%]), and hypertension (n = 10 [8.3%]).
Clinical and Analytical Characteristics of the 120 Participating Hemodialysis Patients.
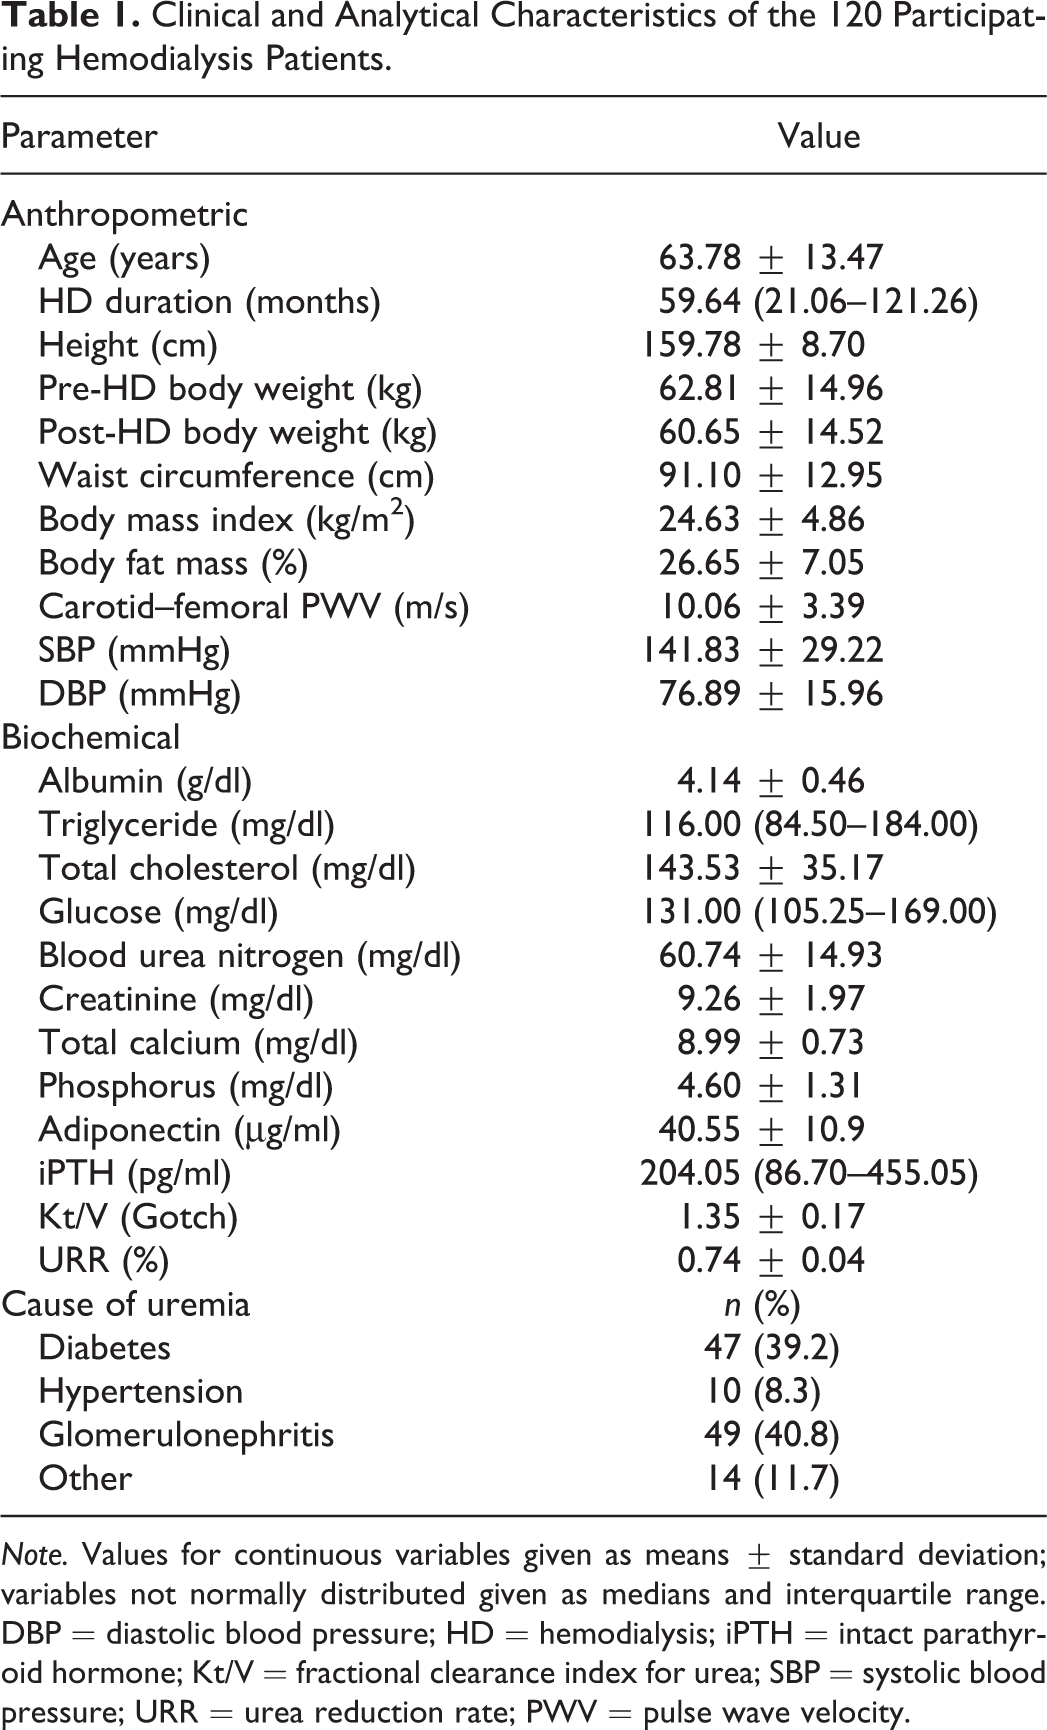
Note. Values for continuous variables given as means ± standard deviation; variables not normally distributed given as medians and interquartile range. DBP = diastolic blood pressure; HD = hemodialysis; iPTH = intact parathyroid hormone; Kt/V = fractional clearance index for urea; SBP = systolic blood pressure; URR = urea reduction rate; PWV = pulse wave velocity.
Clinical Characteristics and cfPWV
HD patients with DM had higher cfPWV values than those without DM (p = .001). The drugs used in HD patients included angiotensin-converting enzyme inhibitors (ACEi; n = 6 [9.5%]), angiotensin receptor blockers (ARBs; n = 27 [22.5%]), β-blockers (n = 30 [25%]), calcium channel blockers (CCB; n = 36 [30%]), statins (n = 20 [16.7%]), and fibrate (n = 20 [16.7%]). There were no statistically significant differences in cfPWV values in HD patients on the basis of sex, coexisting hypertension, or use of ACEi, ARB, β-blockers, CCB, statins, or fibrate (Table 2).
Clinical Characteristics With Central Pulse Wave Velocity Levels and Serum Adiponectin Levels of the 120 Participating Hemodialysis Patients.
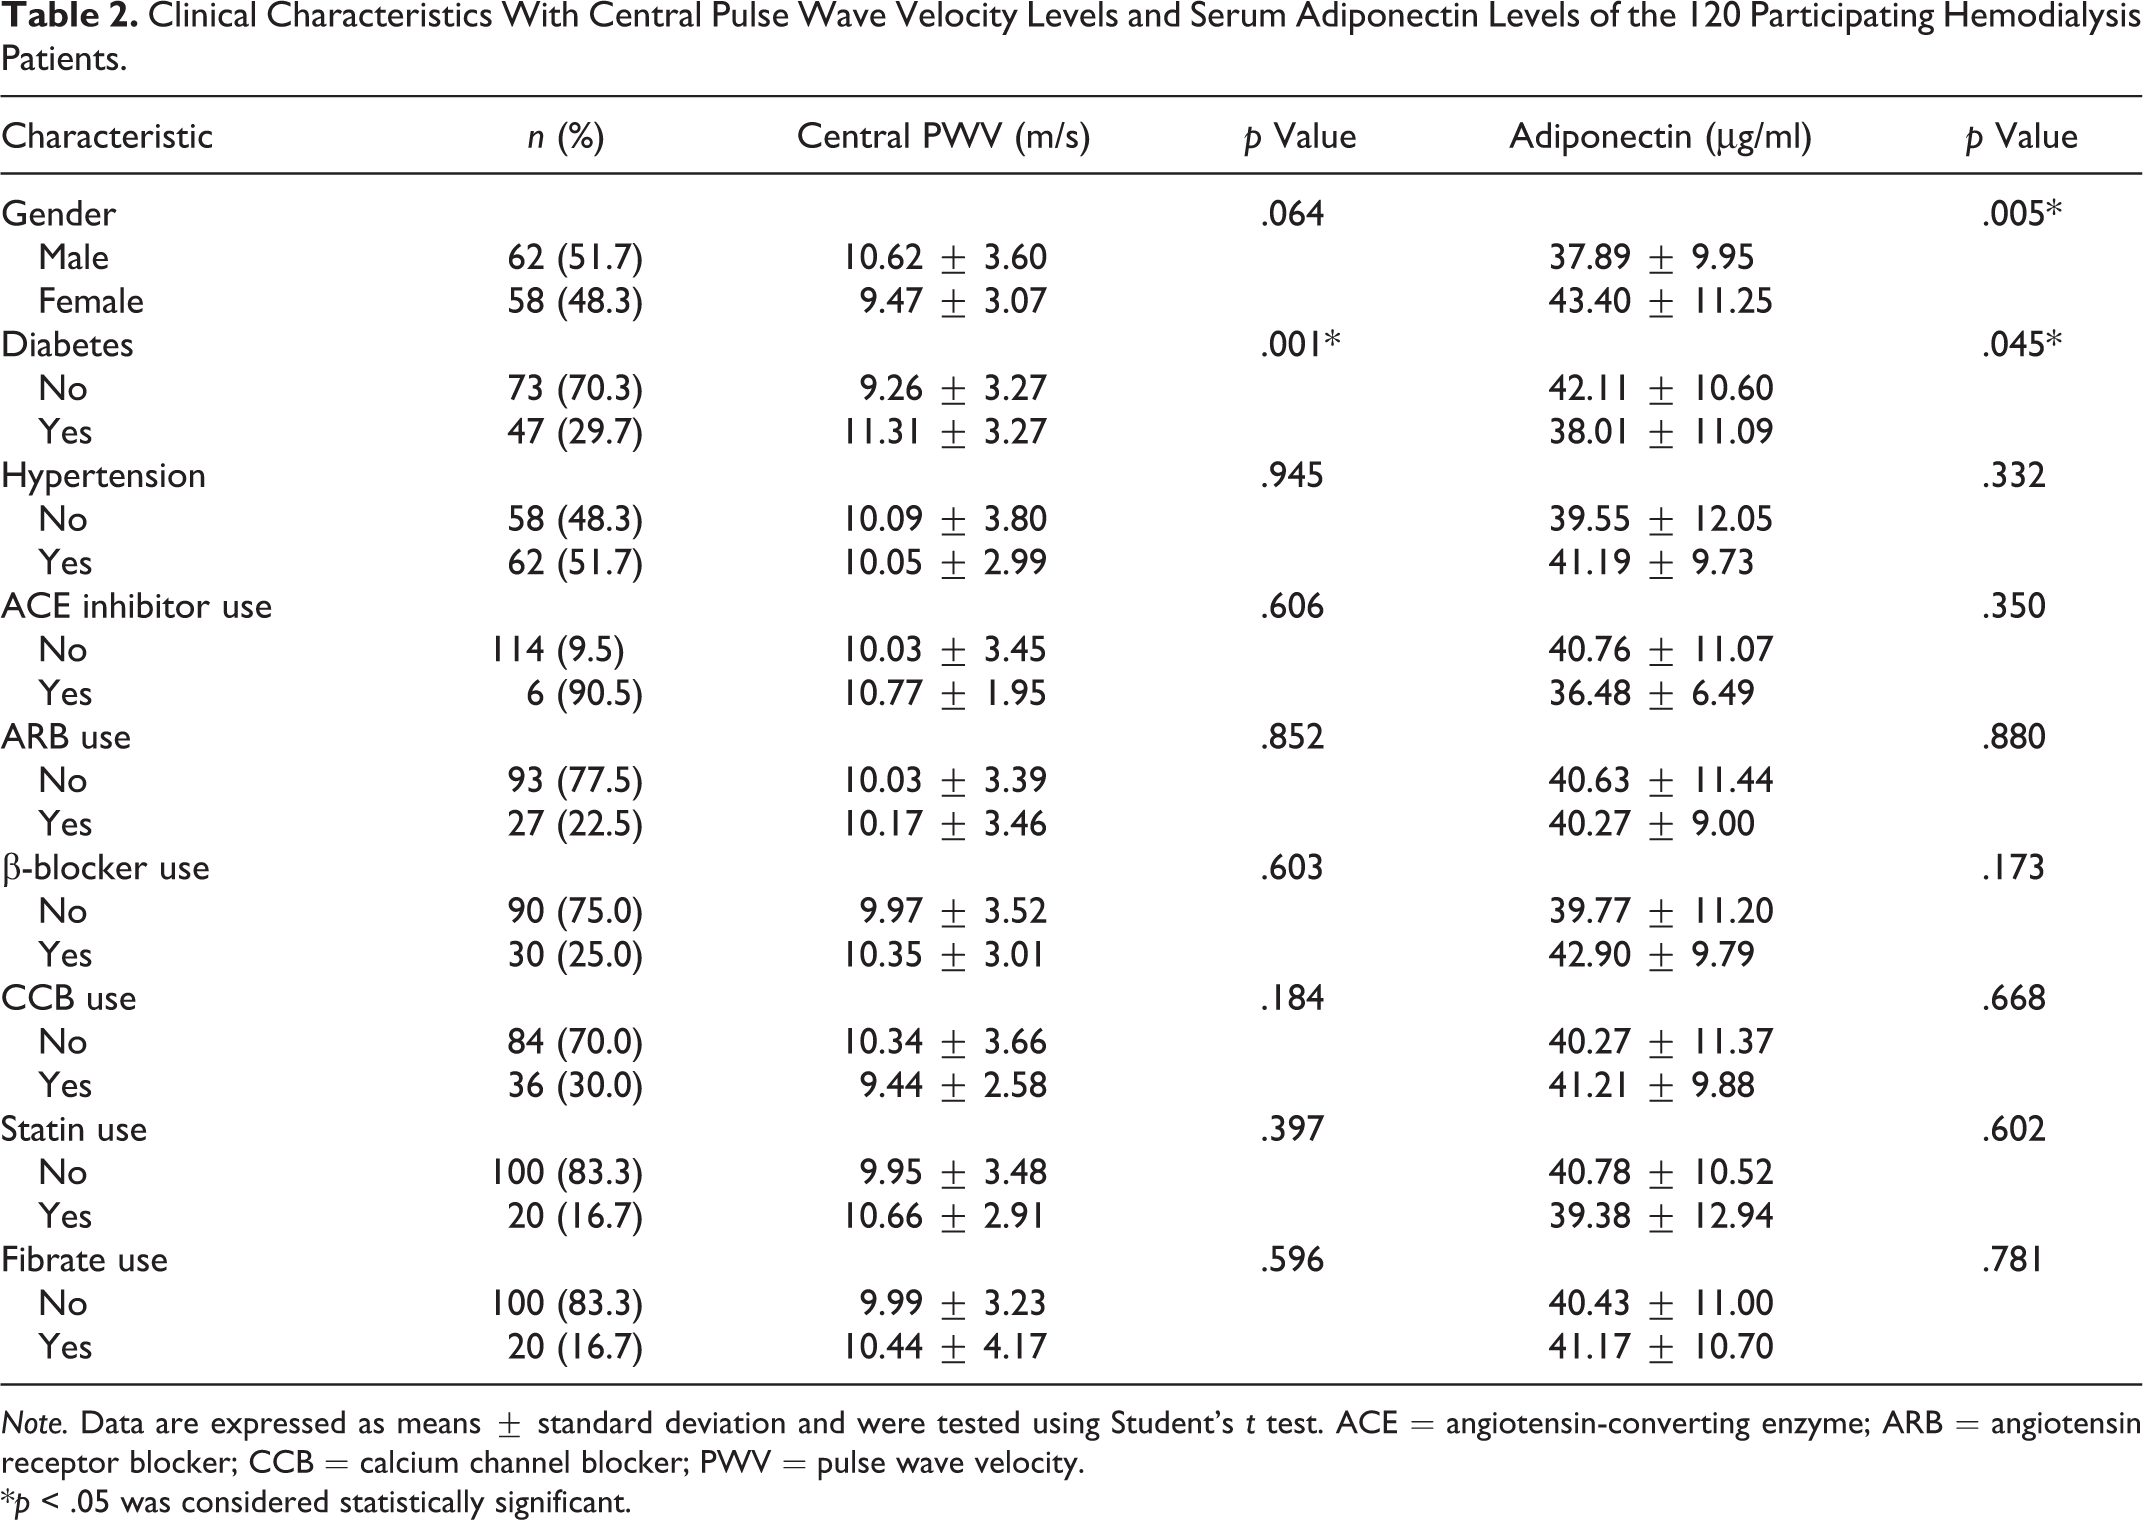
Note. Data are expressed as means ± standard deviation and were tested using Student’s t test. ACE = angiotensin-converting enzyme; ARB = angiotensin receptor blocker; CCB = calcium channel blocker; PWV = pulse wave velocity.
*p < .05 was considered statistically significant.
Clinical Characteristics and Adiponectin
Female HD patients had higher serum adiponectin levels than male HD patients (p = .005), whereas HD patients with DM had lower serum adiponectin levels than those without DM (p = .045). We observed no statistically significant differences based on adiponectin levels among HD patients with coexisting hypertension or among those who used ARB, ACEi, CCB, β-blockers, statins, or fibrate drugs (Table 2).
Correlations Between cfPWV and Clinical and Anthropometric Variables
Table 3 shows the results of univariate and multivariate linear analyses of the clinical and anthropometric variables associated with serum cfPWV values in HD patients. DM (r = .281, p = .002), pre-HD body weight (r = .194, p = .033), post-HD body weight (r = .192, p = .036), waist circumference (r = .210, p = .022), and body fat mass (r = .194, p = .034) were positively correlated, whereas serum adiponectin level (r = −.254, p = .005) was negatively correlated with cfPWV values in HD patients. Multivariate forward stepwise linear regression analysis of the factors significantly associated with cfPWV values showed that DM (β = .274, p = .006) and adiponectin level (β = −.215, p = .016) were the independent predictors of cfPWV values in HD patients.
Correlations Between Carotid–Femoral Pulse Wave Velocity (PWV) Levels and Clinical and Anthropometric Variables Among the 120 Participating Hemodialysis Patients.
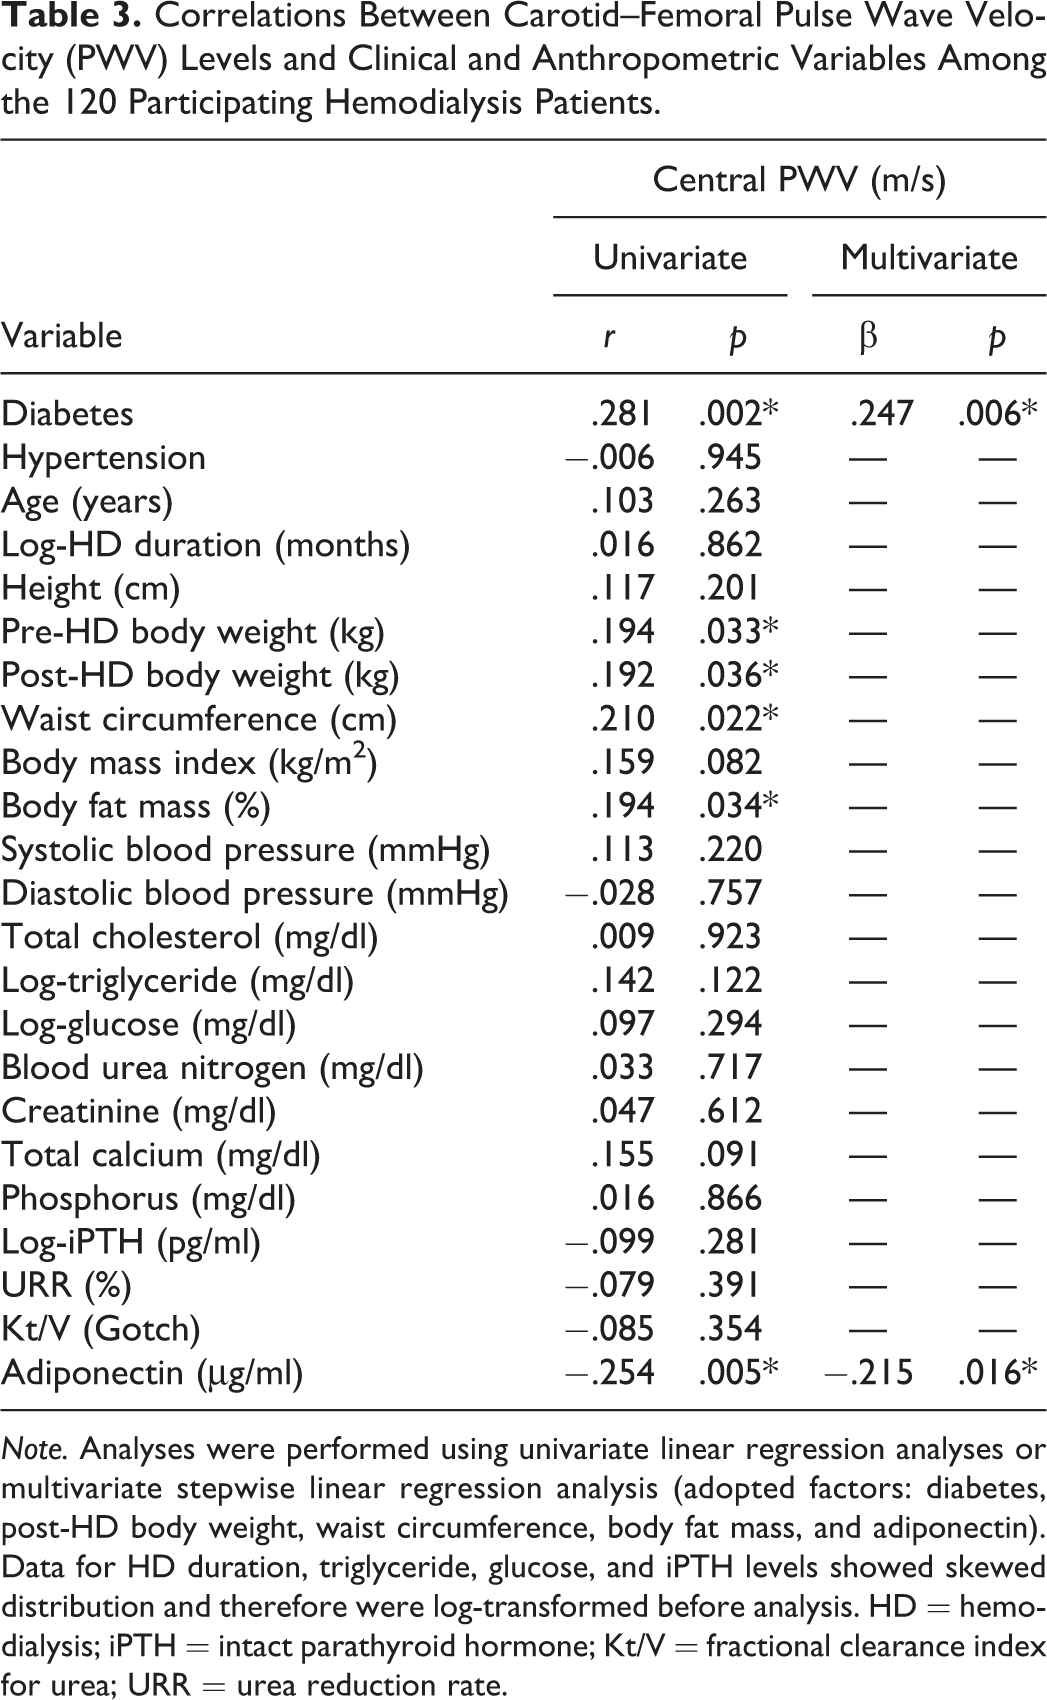
Note. Analyses were performed using univariate linear regression analyses or multivariate stepwise linear regression analysis (adopted factors: diabetes, post-HD body weight, waist circumference, body fat mass, and adiponectin). Data for HD duration, triglyceride, glucose, and iPTH levels showed skewed distribution and therefore were log-transformed before analysis. HD = hemodialysis; iPTH = intact parathyroid hormone; Kt/V = fractional clearance index for urea; URR = urea reduction rate.
Correlations Between Adiponectin Levels and Clinical and Anthropometric Variables
Table 4 shows the univariate and multivariate linear analyses of the clinical and anthropometric variables associated with serum adiponectin levels in HD patients. Height (r = −.180, p = .049), pre-HD body weight (r = −.427, p < .001), post-HD body weight (r = −.437, p < .001), BMI (r = −.410, p < .001), body fat mass (r = −.235, p = .010), cfPWV (r = −.254, p = .005), logarithmically transformed TG (log-TG; r = −.351, p < .001), and log-glucose (r = −.360, p < .001) were negatively correlated, whereas URR (r = .216, p = .018) and Kt/V (r = .201, p = .028) were positively correlated with serum adiponectin levels. Multivariate forward stepwise linear regression analysis of the factors significantly associated with serum adiponectin levels showed that post-HD body weight (β = −.274, p = .041), waist circumference (β = −.311, p < .001), log-TG (β = −.186, p = .031), and log-glucose (β = −.225, p = .008) were independent predictors of serum adiponectin levels in HD patients.
Correlations Between Serum Adiponectin Levels and Clinical and Anthropometric Variables Among the 120 Participating Hemodialysis Patients.
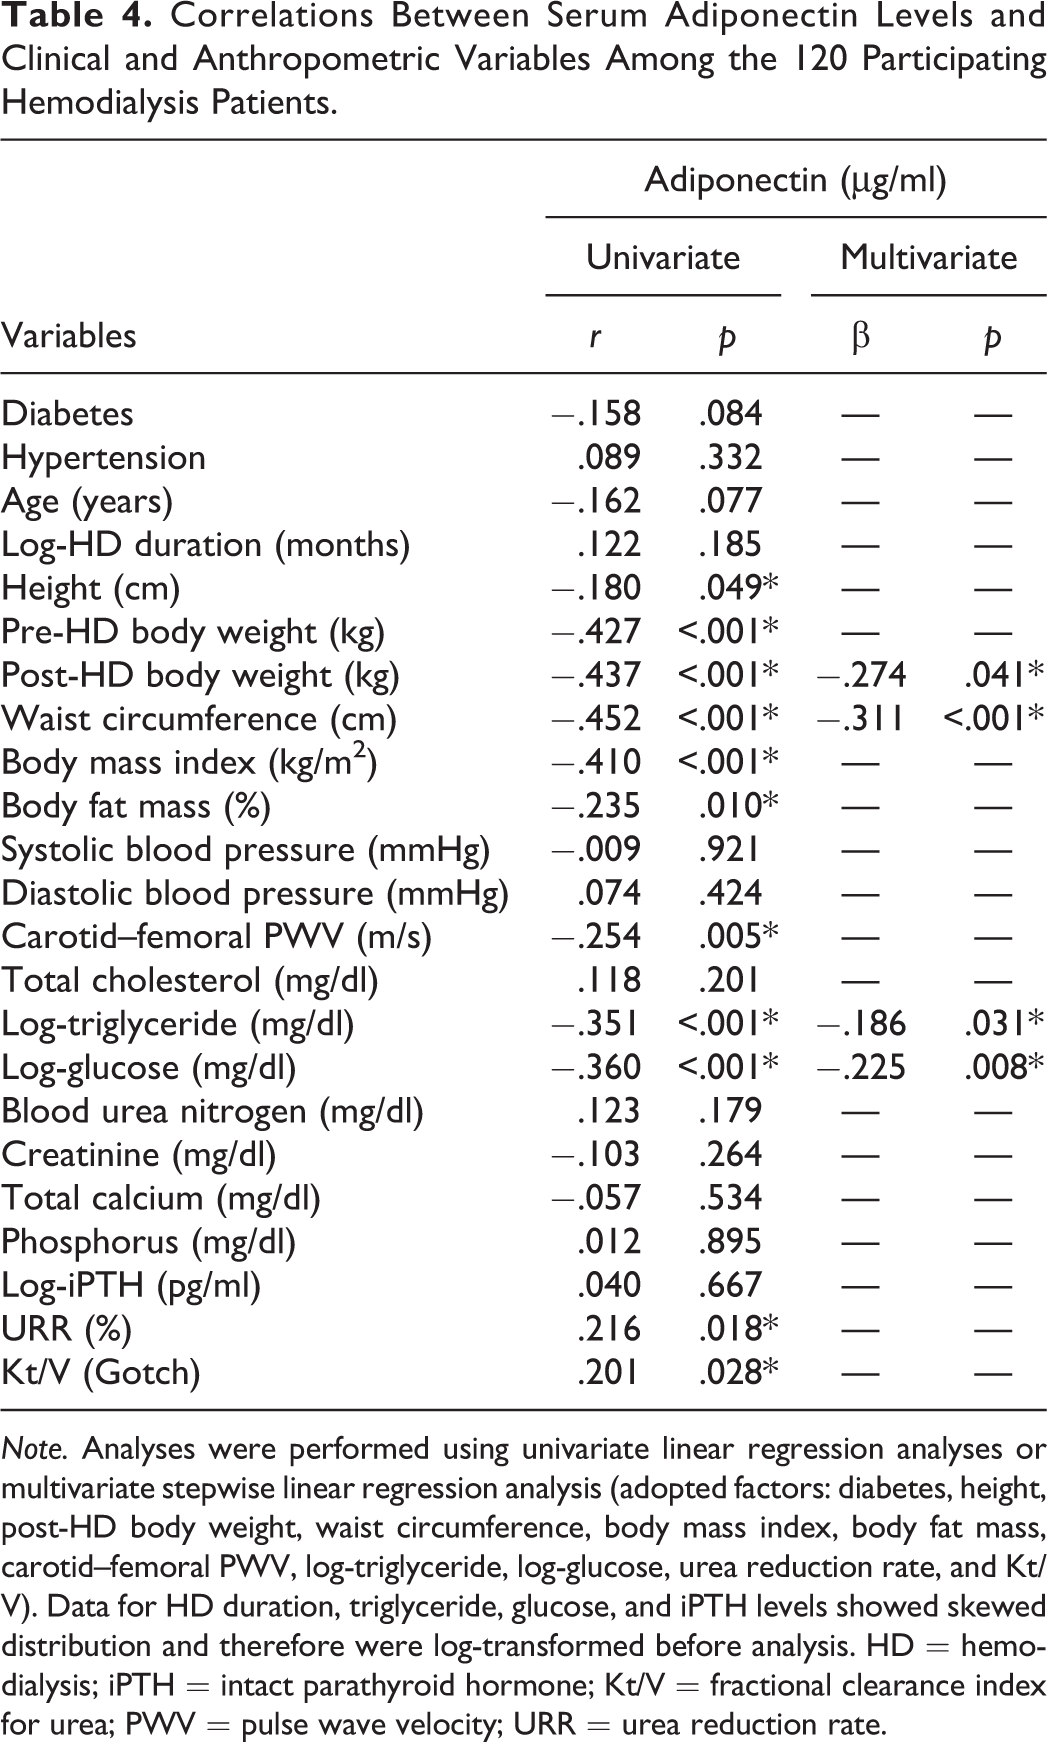
Note. Analyses were performed using univariate linear regression analyses or multivariate stepwise linear regression analysis (adopted factors: diabetes, height, post-HD body weight, waist circumference, body mass index, body fat mass, carotid–femoral PWV, log-triglyceride, log-glucose, urea reduction rate, and Kt/V). Data for HD duration, triglyceride, glucose, and iPTH levels showed skewed distribution and therefore were log-transformed before analysis. HD = hemodialysis; iPTH = intact parathyroid hormone; Kt/V = fractional clearance index for urea; PWV = pulse wave velocity; URR = urea reduction rate.
Discussion
The results of this study show that serum adiponectin level was negatively associated, whereas DM was positively associated, with cfPWV values among HD patients. Furthermore, post-HD body weight, waist circumference, TG, and glucose levels were negatively associated with serum adiponectin levels in HD patients.
Arterial stiffness has been associated with an increased risk of CV disease (Korjian et al., 2016; Prskalo et al., 2016). The cfPWV value is the gold standard for calculating aortic stiffness (Mancia et al., 2013). Aortic stiffness is associated with left ventricular hypertrophy, coronary artery calcification, and CV disease in HD patients (Di Iorio et al., 2011; Georgianos,Sarafidis, & Lasaridis, 2015; Nitta et al., 2004). CV disease is one of the major causes of morbidity and mortality in HD patients (Tonelli et al., 2016). Patients with DM have higher aortic stiffness than patients without DM, and increased aortic stiffness has been correlated with the presence of micro- and macrovascular complications in patients with DM (Cardoso & Salles, 2016). In the present study, we found that HD patients with DM had significantly higher cfPWV values than HD patients without DM. Furthermore, DM was positively correlated with cfPWV values in HD patients after adjustment for other confounding factors.
BMI, waist circumference, and body fat mass had linear associations with cfPWV change from a mean age of 66 years to 4 years later in a longitudinal study (Brunner et al., 2015). Body weight and waist circumference correlated positively with cfPWV values in kidney transplant patients in another study (Ho et al., 2016). Researchers found central fat distribution (trunk/total fat ratio) to be associated with higher cfPWV values in nonobese individuals (Wohlfahrt et al., 2015). While authors of a systematic review and meta-analysis noted that modest weight loss (8% of initial body weight) achieved with diet and lifestyle interventions seemed to reduce cfPWV values (Petersen, Blanch, Keogh, & Clifton, 2015). In the present study, we found that body weight, waist circumference, and body fat mass were positively correlated with cfPWV values in HD patients.
Adiponectin exhibits insulin-sensitizing, cardioprotective, anti-inflammatory, and antioxidant properties, thereby thwarting several pathologies associated with atherosclerosis or metabolic syndrome (Maury & Brichard, 2010). In previous studies, hypoadiponectemia was positively associated with cfPWV values in healthy men, young normotensive patients with type 1 DM, and kidney transplant patients (El Khoudary et al., 2012; Ho et al., 2016; Tsiakou et al., 2013). Furthermore, an adiponectin genotype (T allele of rs864265) was associated with a greater increase in cfPWV values in Chinese adults after adjustment for sex, age, BMI, fasting glucose, and lipid profiles in another study (Liang et al., 2015). Researchers in a recent study noted that plasma adiponectin level was inversely associated with cfPWV values in 366 HD patients (Liu et al., 2017). In the present study, our results also showed that serum adiponectin level was negatively correlated with cfPWV values in HD patients.
Hypoadiponectemia is a clinical feature of metabolic syndrome (Srikanthan, Feyh, Visweshwar, Shapiro, & Sodhi, 2016). Metabolic syndromeis a cluster of metabolic abnormalities consisting of central obesity, insulin resistance, hyperglycemia, dyslipidemia, and hypertension (Alberti, Zimmet, & Shaw, 2006). Previous research has shown that plasma adiponectin levels were inversely related to BMI and TG and glucose levels in HD patients (Abe et al., 2012; El-Shafey & Shalan, 2014). BMI, waist circumference, body fat mass, and TG and fasting glucose levels were negatively correlated with fasting serum adiponectin levels among peritoneal dialysis patients in another study (C. H. Wang et al., 2010). Researchers have also found that female HD patients had higher plasma adiponectin levels than male HD patients (El-Shafey & Shalan, 2014; Liu et al., 2017). Furthermore, one study found that plasma adiponectin levels were directly related to Kt/V in HD patients (El-Shafey & Shalan, 2014). In our results in the present study, we noted that in HD patients with DM, height, body weight, BMI, body fat mass, and TG and glucose levels were negatively correlated with serum adiponectin levels, whereas in female HD patients, URR and Kt/V levels were positively correlated with these levels. Adjustment for confounding factors in multivariate stepwise linear regression analysis revealed that body weight, waist circumference, and TG and glucose levels were independent predictors of serum adiponectin levels in HD patients.
The present study has some limitations. First, the study had a cross-sectional design, which poses difficulties for identifying the direction of causality between cfPWV values and serum adiponectin levels. Second, the sample size was small, which may have affected the statistical significance and introduced sample selection bias. Third, we did not collect data on the use of medications, such as antidiabetic drugs, that could have potentially affected serum adiponectin levels or cfPWV values in this study. Further long-term prospective studies are needed to follow upon the association we observed between serum adiponectin and cfPWV values in HD patients.
Conclusion
In the dialysis unit, HD patients have a dedicated nurse responsible for their care. Both the nephrologists and the nurses explain the laboratory report to patients and point out measures that could be improved. Nurses in the unit offer health education about the use of diet, nutrient intake, and physical activity to improve patients’ quality of life. According to our findings in the present study, body weight, waist circumference, and serum TG and glucose levels were negatively associated with serum adiponectin level, and serum adiponectin level was negatively associated with cfPWV values in HD patients. Dialysis nurses can educate HD patients about the importance of avoiding metabolic syndrome and increasing serum adiponectin levels throughdiet, nutrient intake, and physical activity to avoid arterial stiffness in the future.
Footnotes
Authors’ Note
The Ministry of Science and Technology had no further role in study design, data collection and analysis, interpretation of data, writing of the report, or the decision to submit the article for publication. All of the authors reviewed and approved the final version of this article. The data sets used and analyzed during the current study are available from the corresponding author on reasonable request.
Author Contributions
Yi-Maun Subeqand Bang-Gee Hsu conceived of and designed the experiments. Jia-Sian Hou, Chih-Hsien Wang, Yu-Hsien Lai, Yu-Li Lin, and Chiu-Huang Kuo performed the experiments. Jia-Sian Hou and Bang-Gee Hsu contributed reagents and analyzed the data. Jia-Sian Hou, Yi-Maun Subeq,and Bang-Gee Hsu wrote the manuscript. Yi-Maun Subeq and Bang-Gee Hsu contributed equally to this study.
Declaration of Conflicting Interests
The author(s) declared no potential conflicts of interest with respect to the research, authorship, and/or publication of this article.
Funding
The author(s) disclosed receipt of the following financial support for the research, authorship, and/or publication of this article: This study was supported by a grant from Ministry of Science and Technology, Taiwan (MOST-104-2314-B-303-010).