
Abstract
Nurse scientists are adept at translating findings from basic science into useful clinical- and community-based interventions to improve health. Over time, the focus of some nursing research has grown to include the assessment and evaluation of genomic and other output from high-throughput, or “omic,” technologies as indicators related to health and disease. To date, the growth in the application of omics technologies in nursing research has included calls to increase attention to omics in nursing school curricula and educational training opportunities, such as the Summer Genetics Institute offered by the National Institute of Nursing Research. However, there has been scant attention paid in the nursing literature to the complexity of data analysis or issues of reproducibility related to omics studies. The goals of this article are to (1) familiarize nurse scientists with tools that encourage reproducibility in omics studies, with a focus on the free and open-source data processing and analysis pipeline, and (2) provide a baseline understanding of how these tools can be used to improve collaboration and cohesion among interdisciplinary research team members. Knowledge of these tools and skill in applying them will be important for communication across disciplines and imperative for the advancement of omics research in nursing.
Keywords
Along with other biomedical fields, nursing has increasingly adopted high-throughout, or “omic,” technologies as part of its research toolbox. Rapid advancements in these technologies and steady decreases in the associated costs have allowed nurse scientists to implement increasingly complex study designs, producing prodigious amounts of data. Study data commonly comprise multiple types and require a research team for accurate analysis and interpretation. In order to translate omics data types in clinically meaningful ways and continue advancing nursing science, nurse scientists require additional tools and skill sets. To accurately analyze data and build knowledge in emerging areas of clinical research, including omics (i.e., genomics, epigenomics, metabolomics, proteomics, the microbiome, etc.), nurse scientists need to understand the requisite analysis methods, tools, and software programs (i.e., the workflow or “pipeline”). Of particular importance are analytic methods and tools that help ensure reproducibility of omics studies. Software programs and packages for analyzing omics data are continually being developed and evolving to keep pace with technological advancement and discoveries. Many nurse scientists may be unfamiliar with tools that help streamline omics analysis and encourage reproducibility, regardless of the data types produced.
The goal of this article is to provide guidance to readers on the benefits and use of the R statistical package for analyzing omics data. More specifically, our goals are to (1) familiarize nurse scientists with tools that encourage reproducibility in omics studies, with a focus on the free and open-source data processing and analysis workflow (including R statistical software [R], RStudio integrated development environment [IDE], Git version control, and Github file-sharing and code hosting repository), and (2) provide a baseline understanding of how these tools can be utilized to improve collaboration and cohesion among interdisciplinary research team members.
Omics in Nursing
Over the past quarter of a century, the use of omics technologies within the context of research to answer questions relevant to clinical translational science and beyond has grown considerably. Nursing research has focused on evaluating how genetic, microbiome, metabolome, transcriptome, or other omics variations contribute to health and disease states, function as biomarkers of disease and disease progression, and influence gene–environment interactions and on applying these methods to develop interventions to reduce or eliminate health disparities (Li, Dunlop, Jones, & Corwin, 2016; Loescher & Merkle, 2005; Taylor, Wright, Hickey, & Housman, 2017). However, there has been scant attention paid in the nursing literature to the analytic complexity or issues of reproducibility related to omics studies. In the present article, we aim to fill this gap in the literature by introducing nurse scientist to some of the tools that bioinformaticians and statisticians utilize to address reproducibility issues in complex data analyses. We describe the RStudio IDE, including the R statistical software package (version 3.5.1) (R. Development Core Team, 2008), and explore its utility in nursing research. We also describe tools that support dynamic documentation, version control, and cloud-based repositories, which enable the analysis, sharing, and dissemination of omics data, analysis codes, and results.
Reproducible Research
As of late, there has been increasing concern, from both scientists and the general public, regarding the reproducibility and accuracy of scientific results (Open Science Collaboration, 2015; Peng, 2011; Yaffe, 2015). Replication refers to the ability for others to achieve consistent results if they carry out the same experiment using new data. For example, if one laboratory found that the protein apolipoprotein E (ApoE) is not produced by APOE-knockout mice, and a separate laboratory-tested APOE-knockout mice and confirmed that they do not produce the protein ApoE, the initial study was successfully replicated. By contrast, reproducibility is the ability to recompute an identical result if the original data are reanalyzed in the same way. Reproducing study results helps to validate the accuracy of the results and, in the case of omics studies, requires a more detailed explanation of data cleaning and analysis steps (i.e., analytic pipeline). For example, an investigator could easily reproduce a study evaluating the effect of weight on blood pressure using the weight and blood pressure values and the statistical method specified in the original study. However, reproduction of the results from a study on the influence of epigenome-wide DNA methylation (DNAm) on blood pressure would be difficult if only the raw DNAm data, blood pressure, and statistical method were provided due to variations in the analytic pipeline required to configure raw DNAm data into data suitable for statistical analyses (Taylor, Wright, Crusto, & Sun, 2016; Wright et al., 2016).
Reproducibility entails the validation of reported study findings without the necessity of replicating the entire study (i.e., data collection) by using the exact same data, data cleaning, data-processing steps, and statistical methods. The study results should be easily reproduced if the raw study data and complete analysis pipeline (i.e., the code and/or steps used to move from raw data to results) are available for independent investigators to use and evaluate. Some journals (e.g., Nature Methods and Biostatistics) require authors to submit analysis code with raw data for validation of study results during the peer review process, while other journals also require publication of or undeterred access to data and analysis code, including PLoS One, Science, and the Nature group of journals (Nosek et al., 2015). The journal Biostatistics designates a manuscript as “reproducible” if the associate editor for reproducibility “…succeeds in executing the code on the data provided and produces results matching those that the authors claim are reproducible” (Peng, 2009, p. 406) and encourages authors to submit the code supporting their publications as well as a link to a Github (web-based) repository (Information for Authors, 2017). As the public and government entities increasingly demand openness and access to results of funded studies, sharing of analysis code and data promotes transparency and increases confidence in the findings of these studies (Alberts, Kirschner, Tilghman, & Varmus, 2014; Begley & Ioannidis, 2015; Iqbal, Wallach, Khoury, Schully, & Ioannidis, 2016).
In addition to the benefits of allowing for validation of completed research, use of tools to implement reproducible research practices creates more efficient research pipelines. Tools that record and retain explicit details of complex analysis pipelines allow for easy duplication of methods without wasting time attempting to decipher what exact steps were taken or which data types need to be included in the analyses. For example, when a scientist uses R to analyze data, units of code called “packages” are downloaded and installed in the R environment to carry out the analyses. Packages contain code (e.g., functions) usually focused on a specific set of analyses with instructions on how to use your data with the code, often supplying example data sets to illustrate how to use the functions within the package. Typically, most functions require the user to set specific options and make sure the data meet certain assumptions to complete the analysis. If these specifications are not explicitly reported, it will be difficult to reproduce the results. For example, when converting raw DNAm data from peripheral blood samples into usable analysis data, a researcher must statistically control for the heterogeneity of cell types within peripheral blood because DNAm varies by cell type within the blood (Wright et al., 2016). There are several different methods available for completing this step of the analysis pipeline, and if the method or parameter specifications are unclear or unspecified, validation of the results may be near impossible. When analysis pipelines and methods can easily be shared among collaborators and research teams, more time can be spent on applying the same methods to study the question in different populations or applying the analytic pipelines to different questions with similar data types (i.e., all DNAm data are processed using the same pipeline). For example, if one research group is evaluating the effects of a group of single nucleotide polymorphisms (SNPs) on the ability to detect sweet taste, another group may be able to apply the same research pipeline (e.g., SNP calling method) to evaluate the effects of a different group of SNPs on sweet taste. This approach improves comparisons by ensuring that consistent analysis methods (codes and algorithms) and pipelines (processing steps) are used, which minimizes any differences in results introduced by the analysis process. Sharing analysis code also encourages others to expand on one’s work more efficiently by focusing resources on expansion rather than replication. For example, Wright and colleagues developed an analytic pipeline to determine the contribution of SNPs and DNAm within the same genes to serum lipid levels, and they are now using the exact same processing steps and code for processing a different set of SNPs and DNAm to evaluate whether they contribute to metabolic syndrome (Wright, Ware, Smith, Kardia, & Taylor, 2018). Creating and sharing clear, explicit documentation of research methods and analysis pipelines reduces wasted time and accelerates the pace of scientific discovery.
Additionally, the National Institutes of Health require entering genomic data into shared repositories to maximize the utility of research dollars and data (Kaye, Heeney, Hawkins, de Vries, & Boddington, 2009). Recent shifts in attitudes toward open access for journals that publish clinical trial results have had a positive impact on data and code availability. Journals are also starting to require the availability of data as a condition for publication, including description of the input data and executable specifications of the study. The increasing demand that data be made publicly available, either with the published manuscript or uploaded to centralized databases created for deposition of data generated by publicly funded experiments (e.g., Database of Genotypes and Phenotypes [dbGaP], Database of single nucleotide polymorphisms [dbSNPs]), necessitates clearly documented and executable analysis code. The raw data that are uploaded generally have undergone several preprocessing steps prior to publication that may lead to downstream variation in results and interpretation if replication is attempted without further detail. For example, when analyzing genome-wide DNAm array data, there are multiple ways to control for probe types, “background” noise, batch effects, and cell composition of the sample as well as multiple options regarding how to filter inaccurate samples or probes (Wright et al., 2016). Therefore, even the free availability of data does not guarantee that results can be reproduced without explicit instruction on how to do so, nor does it guarantee that preprocessing and analyses are done correctly. Instead, detailed documentation must be provided regarding the data sources, data formats, how the data were imported, merged, and processed prior to analysis, the analysis assumptions and algorithms, as well as the codes used to produce the tables and figures used for final presentation, interpretation, and conclusions.
Tools for Reproducible Research (R, RStudio, Git, Github)
Several software tools support the production of reproducible research for use at individual and collaborative levels (Table 1 and Figure 1). Many nurse scientists are familiar with tools such as Word, Excel, and Powerpoint (Microsoft Office Suite) for creating documents and presentations, SPSS (version 25.0) or SAS (version 9.4) statistical analysis software, and file sharing via network drives and folders (either locally or in the cloud using web-based applications such as Dropbox or Google Drive). However, the use of these tools by multiple team members at various stages of research results in inconsistencies, there is generally a lack of tracking of changes and versions of data, code, and documentation (i.e., version control), and the practice of manually manipulating data and documentation (i.e., “cut-and-paste” approaches) is common and not recorded, all of which increase the risk of errors in data analysis, interpretation, and reporting. In 2009, Baggerly and Coombes reported critical problems reproducing results from studies on cell lines used as foundational data to support clinical trials predicting patient response and drug sensitivity, partially due to spreadsheet indexing confusion and undocumented mathematical transformations of data prior to analysis (Baggerly & Coombes, 2009). More recently, Ziemann, Eren, and El-Osta (2016) estimated that nearly one fifth of papers in leading genomic journals had gene name errors due to spreadsheet formatting issues.
Tools for Supporting the Reproducible Research Environment.
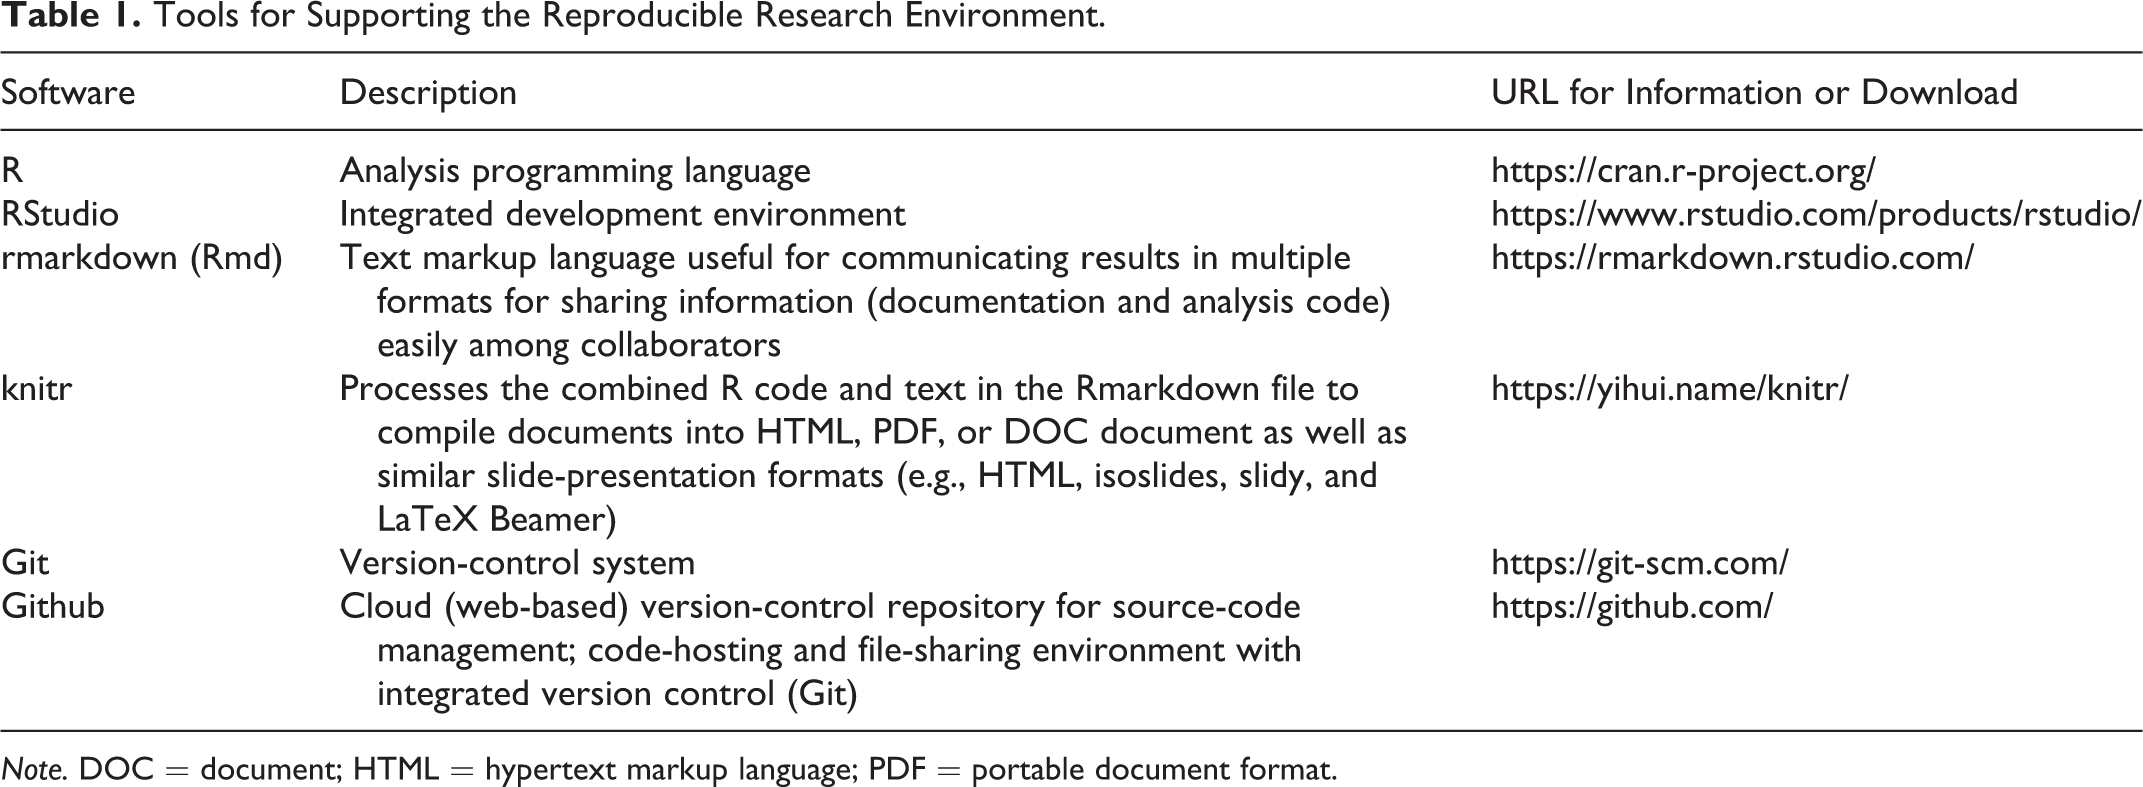
Note. DOC = document; HTML = hypertext markup language; PDF = portable document format.
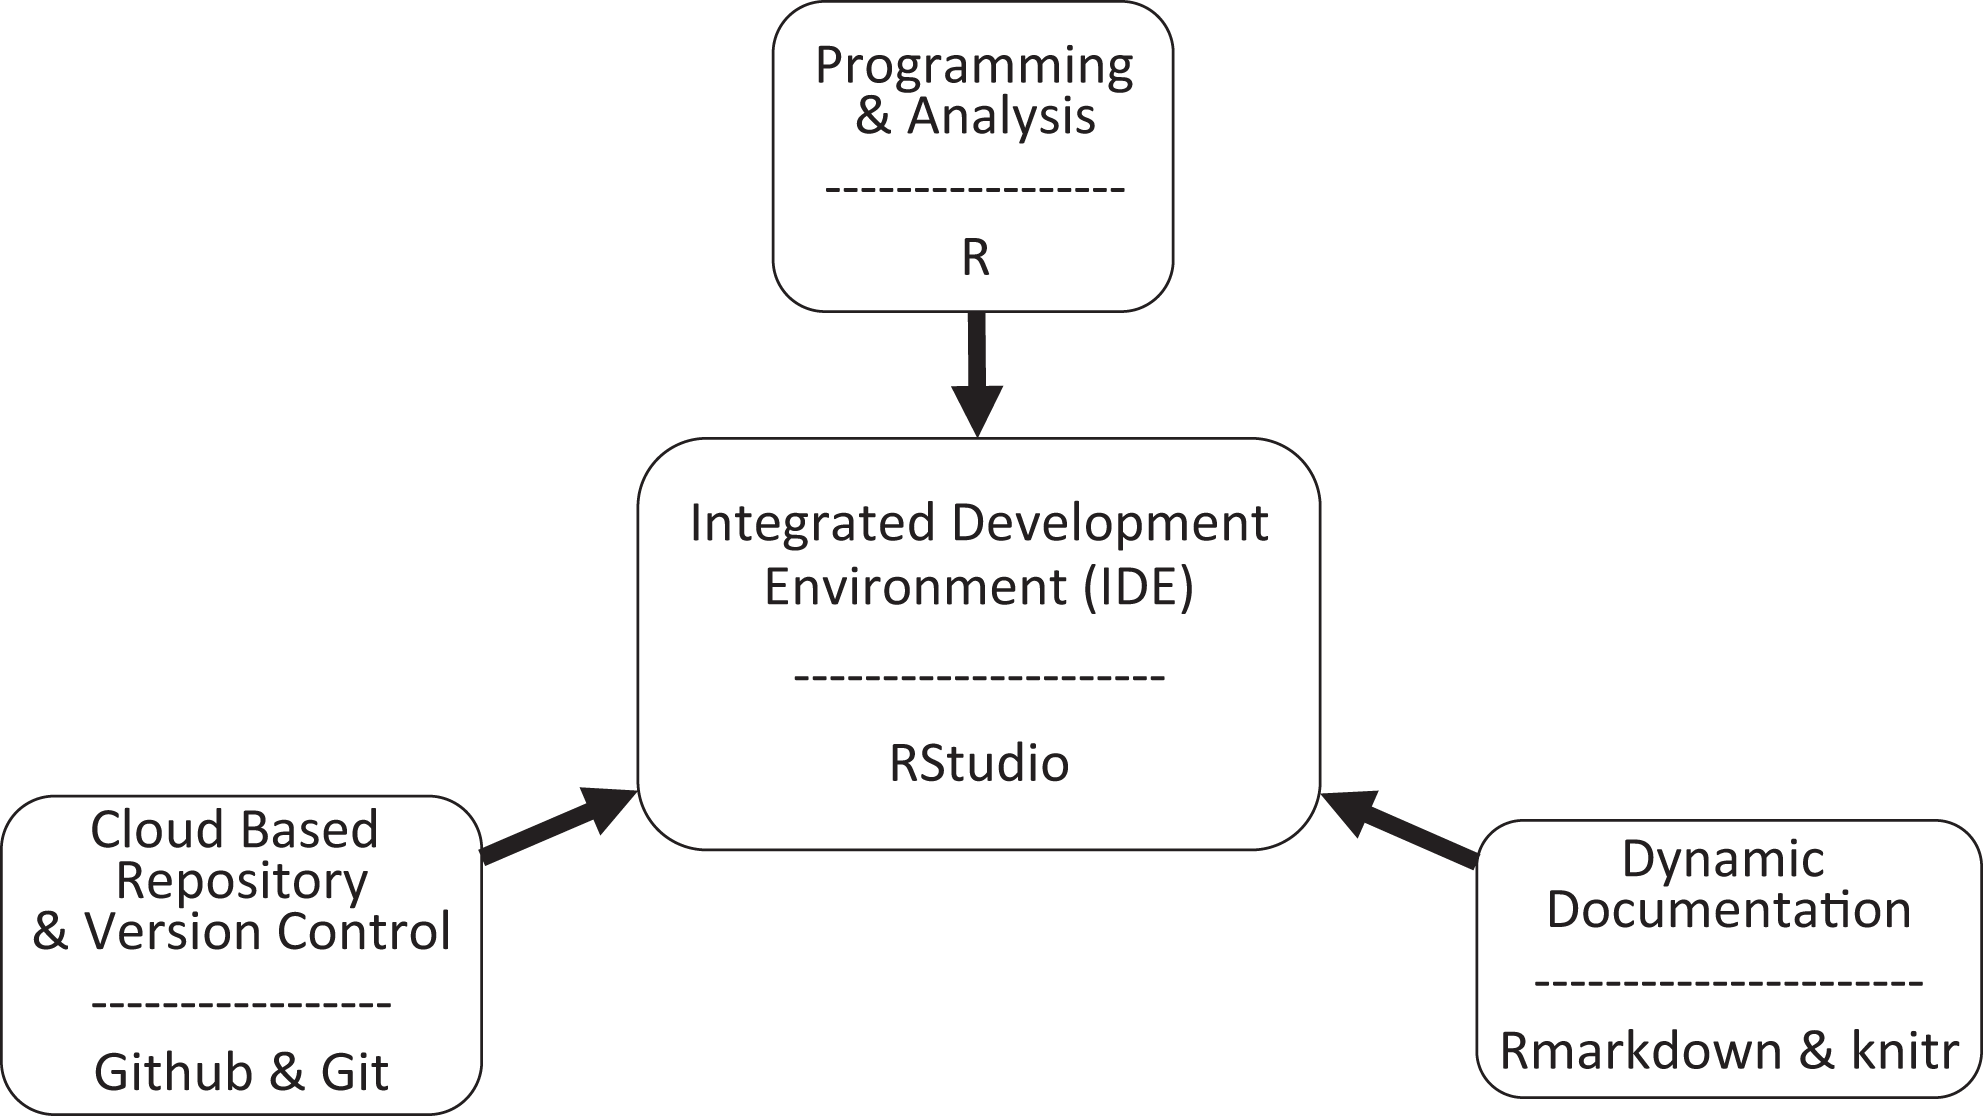
Reproducible research environment. Tools described here for analysis, version control, and documentation can be used within the integrated environment of RStudio. Analysis can be conducted and results formatted within this environment for seamless sharing among team members via web pages or word and portable document format documents.
Establishing which tools to use early in study planning minimizes the number of platforms being used for analysis, ensures version control of data sets and documents, potentially avoids the use of proprietary or expensive products not available to all team members, and improves downstream efficiency of the team. During the initial planning of a research project, in addition to discussing the research questions, the team should discuss the analysis pipeline, including the format(s) of the raw data, planned data transformations, the process of merging multiple data files, as well as how the data will be stored, cleaned, and analyzed. The planning phase is important when analyzing omics data, particularly in multi-omics studies and longitudinal studies, because different team members will have expertise at handling different portions of the research project. For example, a data manager organizes and cleans the raw data, while a bioinformatician completes the analyses on the cleaned data. If one of these team members is no longer involved in the project, as in the case of graduate students and postdoctoral associates, other team members must be able to easily access and understand meticulous documentation of what occurred during earlier steps (e.g., the graduate student cleaned the data in 2016, and information is available in the “cleandata2016.txt” file). It can be difficult, if not impossible, and time-consuming to tease out this type of information after the fact, thus tracking from the beginning can help limit confusion and ensure continuity of data and analysis approaches throughout the life of a research study.
R
R (version 3.5.1) is a programming language that is primarily used for data manipulation, statistical analyses, and creating graphics. A big advantage of R is that it is free both in terms of cost and in terms of having open licensing for copying, distribution, and modification (Free Software Foundation Inc., 1991). It has become the de facto platform for many omics analysis pipelines. There are several reasons researchers have embraced R for omics data analysis, with one of the primary reasons being that R is capable of handling large data sets with flexibility to evolve and develop new reproducible analysis pipelines quickly. R executes complex tasks easily. Commands for data processing and analysis are written in computer code in which the analyst explicitly states every computational step the computer must complete, therefore promoting reproducibility. The record of commands, however, may not always be “human readable,” particularly to team members with no previous coding experience. For this reason, it is important to annotate steps of computer code so it is clear why a command was included in the pipeline. Not only is this helpful to team members who are not fluent in coding, it is then much easier to return to these analysis steps in the future because the previous work and thought process will be clearly understood. This transparency is a strong advantage over some of the graphical user interface (GUI) programs such as SPSS, in which it is difficult to precisely reproduce the steps of a previous analysis with a series of point and clicks unless users annotate which dropdown boxes and options they selected for every step. Conversely, some GUI programs have options to view or save syntax that can be annotated for future reference.
R is not only an analytic tool that tracks analysis steps, it is also useful for gathering and combining data types and creating products for research dissemination. It can be difficult to extract tabular or graphic results from some GUI programs Illumina, Inc. (San Diego, CA) in the format and at the resolution necessary for publication quality. By contrast, users may export graphics produced using R in several high-resolution formats suitable for publication. R is also capable of importing data in a variety of formats and exporting data in formats acceptable for import to other programs. Many analysis software packages are limited in import and export capabilities, requiring the use of other programs for converting between data formats. For example, raw DNAm array data produced by Illumina is stored in the IDAT format, which is a data format specific to microarray results. Few programs can open these files, and many such programs are proprietary and cannot be used without a fee or license (e.g., GenomeStudio). These proprietary programs also often have limited downstream statistical analysis options and may be incapable of multiomic analyses. Conversely, IDAT files and other data types, such as raw fastq format sequence files generated in microbiome studies, can be read into R, processed, and analyzed with multiple data types all within the same workflow. Additionally, analysis code can be saved as a text file, the simplest format possible, preventing the loss of access to analysis files and avoiding pitfalls attendant with the usage of proprietary programs, such as discontinued programs, updated software not supporting previous versions, expired user licenses, and/or the possibility that not all team members will have appropriate software licenses.
RStudio Interface
The most common software interface for using and programming in R is RStudio, which is also free (no cost) and openly distributed under the GNU Affero General Public License. RStudio is an IDE that provides a console for executing R commands, an editor for writing R analysis scripts with syntax highlighting and supporting code execution, plus tools for graphics, command history, and code debugging. RStudio includes easy access to help manuals for R code and associated add-on packages plus project file management on local and networked directories and folders. Two key add-on packages that are built into the RStudio interface are rmarkdown (Allaire et al., 2017) and knitr (Xie, 2015). The rmarkdown package allows for the user to write plain text and then mark it up with specific syntax indicating how the text or objects within the text (e.g., tables, figures, mathematical equations, and web addresses) should be formatted. The rmarkdown package uses Pandoc (Pandoc, n.d.), which is included within RStudio, to allow for easy creation of and conversion between multiple document formats including hypertext markup language (HTML format read by Internet browsers), portable document format (PDF), and document (DOC format used by Microsoft Word, LibreOffice, and Google docs) plus slide presentation formats such as HTML ioslides, slidy, and LaTeX Beamer (R Markdown, 2016). RStudio also leverages the rmarkdown package to create electronic notebooks closely linking the analysis code with the output results, enhancing collaboration and transparency (R Notebooks, n.d.).
The knitr add-on package provides core functionality within the RStudio interface by processing rmarkdown documents combining both the marked-up plain text of the document and R code embedded within the document for performing the analyses, compiling the results, and creating tables and figures presenting the results. The knitr package thus allows for the generation of reports, manuscripts, and presentations directly from code used to perform the analyses. This approach not only greatly minimizes errors commonly introduced by manual cut-and-paste approaches when merging tables and figures from spreadsheet and analysis software (e.g., Excel, SPSS, or SAS) used separately from the documentation software (e.g., Microsoft Word), it also provides efficient updating of the results as changes in the data or analysis approaches are made. For example, if after a discussion, the team decides to include an additional variable as a covariate and that the data should be analyzed separately by gender, then, as these changes are implemented in the analysis pipeline, all downstream products, including text documents and slide presentations, will reflect these changes without further human intervention.
R Packages
While the R software includes good graphing and statistical analysis capability within the basic installation, the bulk of R functionality comes from user-contributed add-on packages. The two largest repositories of these packages are Comprehensive R Archive Network (CRAN) and Bioconductor. Both CRAN and Bioconductor require specific documentation and code testing prior to accepting and hosting a package. Thus, while the packages are user developed and contributed, some oversight and review are provided. However, it is still expected that the end user downloading and using the package has the domain expertise to know whether the add-on package is performing as expected. The packages hosted by CRAN cover a wide range of application areas (“CRAN Task Views,” n.d.). However, bioconductor focuses specifically on the high-throughput genomic-data community, providing not only useful add-on packages from their repository but also educational materials and community resources (Bioconductor, 2017). The RStudio IDE provides direct access to both repositories for easy integration of CRAN or Biconductor add-on packages along with their help manuals, tutorial vignettes, and upgrade functionality.
Git and Github
RStudio also supports version control and file sharing using Git and Github. Git is a free and open-source version control system that allows the tracking of every change in a document or computer code file as well as the review, reconciliation, and merging of multiple file versions. Git also allows for suggestions of changes from multiple (e.g., distributed) users or sources, which can improve collaboration efforts among research team members (Git, n.d.). Github is a code hosting platform for version control (via Git) and collaboration, allowing for the storage, sharing, and tracking of all data, files, and documents associated with a research study or project (GitHub, 2017). When users create a new analysis project within RStudio, they can easily link all associated files to a Github repository, which provides immediate backup of all files within a cloud-based storage system, sharing of these files, and tracking of all changes and contributions from all team members.
Reproducible Omics Research in Nursing
Use of appropriate analytic strategies that encourage reproducible research in nursing, particularly for omics studies, will require (1) utilization of tools and software that allow for reproducibility and replicability of research, (2) close collaboration with experts in the appropriate data analytic methods, and (3) team member access for inputting data and analysis components. As data complexity increases, data management and analysis tools continue to evolve. The de facto analysis tools utilized by most experts in omics analyses are freely available and continuously updated software packages curated by expert users, particularly R (Hofner, Schmid, & Edler, 2016; Huber et al., 2015; Leek & Peng, 2015). In fact, one of the primary goals of packages created for omics analyses within the R environment is to allow for reproducibility by a third party and to allow integration with additional tools and products, such as Python, C++, and interactive visualization with HTML5 (Huber et al., 2015). Others have begun creating packages for use within R for cleaning large electronic health record data sets to improve efficiency and documentation of data processing of medical records (Harris et al., 2018). It is not necessary for all nurse scientists who are conducting omics research to be experts at using R and associated software packages, although understanding the basics of R programming would allow these researchers to clearly communicate with team members conducting complex analyses and allow for seamless, transparent sharing of information and data. The ability to clearly communicate regarding the data and analyses helps to encourage interdisciplinary collaboration.
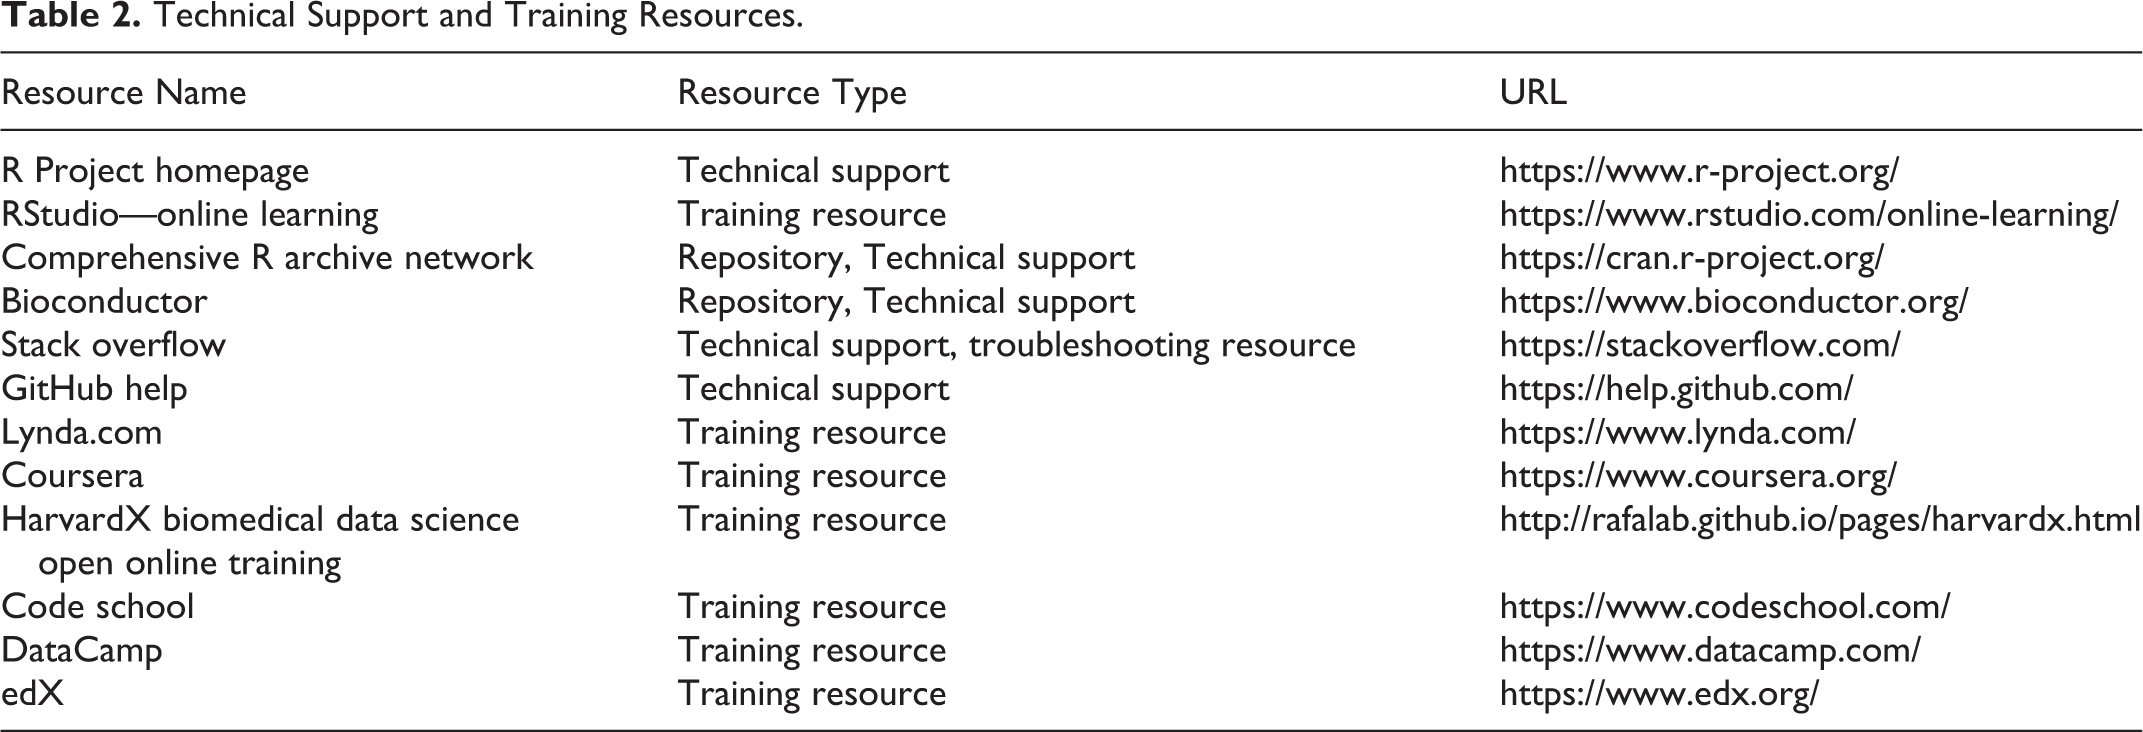
One challenge for nurse scientists that may wish to use R is the lack of previous exposure to computer coding. Incorporating R into their own personal lexicon will take some time and practice. There are several quick-start courses, texts with practice data sets, and an online course that can be used as primers (Table 2). Additionally, multiple packages that contain code for analysis with detailed documentation are freely available for use, which means that the code is already written and has been validated. User guides and vignettes are available for R packages that take a new user through the analysis pipeline, step by step, and explain commands available for use within the package, which can be extremely helpful for novice users. Additionally, many university libraries offer introductory R courses or sessions free of charge for students and faculty. Nurse scientists must stay abreast of the developments in analysis platforms that rely heavily on coding skills in order to keep pace with the rate of omics discovery. If nurse educators and researchers do not encourage familiarity with computational analysis tools and techniques to keep pace with the state of the science, it will be a grave disservice to nursing research and science. New investigators should receive, at the very least, exposure to these tools so they will be able to accurately interpret manuscripts that evaluate omics data.
Technical Support and Training Resources.
Conclusion
Nurse scientists have been called to embrace complex omics data to drive discovery and improve health outcomes across the life span. In applying these new approaches to research, it is imperative not to neglect the need for reproducibility. With an increasing push toward open-access publications and data repositories, meticulous documentation of research methods and analysis pipelines will remain an important aspect of scientific research. In the future, rmarkdown documents may become akin to the ubiquitous lab notebook. Now, more than ever, these practices will allow us to “stand on the shoulders of giants” and build on existing work instead of wasting precious time deciphering how exactly to reproduce the work of our predecessors. As the state of the science evolves, the number of studies incorporating large data sets requiring data-processing workflows and complex analysis methods will continue to increase. For these studies, transparency and collaboration among all members of the research team will be crucial. Many open-source tools (i.e., free [no cost] and openly licensed [freely distributed with appropriate attributions]) are available to nurse scientists. Knowledge of these tools and skill in applying them will be important for communication among research team members from different disciplines collaborating on omics research. Nurses at all levels will need to be able to interpret genomic results to patients or for their own research. To this end, we recommend that computational omics be incorporated into the statistical curriculum at the master’s level and expanded even further as part of doctoral-level education in nursing science. Such education should encompass useful open-source tools such as the R statistical software, RStudio IDE, Git version control language, and Github code-hosting and file-sharing cloud repository.
Footnotes
Author Contributions
M. Wright contributed to conception and design contributed to acquisition, analysis, and interpretation drafted the manuscript, critically revised the manuscript, gave final approval. M. Higgins contributed to conception and design contributed to acquisition, analysis, and interpretation critically revised the manuscript, gave final approval. J. Taylor contributed to conception and design, critically revised the manuscript, gave final approval. V. Hertzberg contributed to conception and design, critically revised the manuscript, gave final approval. All authors agree to be accountable for all aspects of work ensuring integrity and accuracy.
Declaration of Conflicting Interests
The author(s) declared no potential conflicts of interest with respect to the research, authorship, and/or publication of this article.
Funding
The author(s) disclosed receipt of the following financial support for the research, authorship, and/or publication of this article: Support for projects utilizing the methods described in this article was provided by NINR R01NR013520.