
Abstract
The “thin outside, fat inside” (TOFI) phenotype, also termed normal weight obesity (NWO), describes individuals with normal body mass index (BMI) but elevated visceral adipose tissue (VAT). Individuals at the lower boundary of the overweight range may also present with excess VAT despite near-normal BMI. Although exercise is widely recommended to improve body composition, its effects on VAT in these populations remain unclear. This review evaluated the effects of different exercise modalities on VAT in adults with BMI ≤27 kg/m2. A systematic search of PubMed, Scopus, and Web of Science was conducted for studies published between January 1999 and July 2024. Eligibility was determined at the study level based on reported mean BMI (≤27 kg/m2). Studies including aerobic, resistance, combined, or interval training interventions with VAT assessed via computed tomography, magnetic resonance imaging, or dual-energy X-ray absorptiometry were included. Between-group (controlled) and within-group (single-arm or pre–post) analyses were conducted separately using standardized mean differences (SMD). The protocol was registered on OSF (10.17605/OSF.IO/3DCXJ). Thirteen studies (n = 354 participants) were included. Between-group analysis demonstrated a significant reduction in VAT favoring exercise (SMD = −1.590; 95% CI: −2.283 to −0.898; p < 0.001), with substantial heterogeneity (I2 = 86.4%). Aerobic training showed the most consistent effects, while interval training was also associated with significant reductions based on a limited number of studies. Longer intervention duration (>5 months) was associated with greater effects. Within-group analyses showed a similar direction of effect but did not reach statistical significance. Sensitivity analyses indicated that results were directionally robust but partially influenced by high-impact studies. Exercise is associated with reductions in VAT in adults with normal BMI and those at the lower boundary of the overweight range. However, the certainty of evidence is low due to methodological limitations, heterogeneity, and potential bias. Greater emphasis should be placed on findings from controlled studies. Further well-designed randomized controlled trials are needed to confirm these findings and clarify the roles of different exercise modalities and intervention characteristics.
Introduction
Visceral adipose tissue (VAT) is increasingly recognized as a metabolically active fat depot with a disproportionate influence on cardiometabolic risk, independent of total body fat or body mass index (BMI). Unlike subcutaneous adipose tissue, VAT exhibits higher lipolytic activity, increased inflammatory cytokine secretion, and greater portal delivery of free fatty acids to the liver, thereby contributing directly to insulin resistance, dyslipidemia, and other components of metabolic syndrome (Conus et al., 2007; De Lorenzo et al., 2006; Kaur, 2014). These pathogenic characteristics position VAT as a critical therapeutic target, particularly in individuals who do not meet conventional BMI-based criteria for overweight or obesity.
The “thin outside, fat inside” (TOFI) phenotype, also referred to as normal-weight obesity (NWO) or metabolically obese normal weight (MONW), describes individuals with a normal BMI (18.5 – 24.9 kg/m2) who nonetheless exhibit excessive VAT accumulation and elevated metabolic risk. This phenotype is commonly identified using imaging-derived indices, including the intra-abdominal adipose tissue (De Lorenzo et al., 2006; Harrison et al., 2016; Kaur, 2014; Van Der Beek et al., 2017). The TOFI phenotype has been described using overlapping terms, including NWO and MONW. Although these constructs share common features, they are not fully interchangeable, as they may emphasize different aspects of metabolic dysfunction or body composition. In the present review, these terms are considered within a unified framework characterized by relatively normal BMI in the presence of disproportionate visceral adiposity, which serves as the primary feature of interest.
The distribution of visceral relative to subcutaneous adipose tissue, often expressed as the intra-abdominal to abdominal subcutaneous adipose tissue ratio (IAAT/ASAT), has also been proposed as an indicator of metabolic risk (Zdrojewicz et al., 2017). Higher ratios have been associated with adverse metabolic profiles, with some studies suggesting sex-specific differences in fat distribution patterns. However, universally accepted threshold values remain lacking, and reported cut-offs vary across populations and measurement techniques (Bennett et al., 2024). VAT areas exceed approximately 100 – 130 cm2, assessed via computed tomography, have been associated with elevated cardiometabolic risk in both men and women. However, these thresholds are not universally standardized and may vary according to sex, age, and measurement modality (Bennett et al., 2024; Després, 2006; Nicklas et al., 2003). Visceral adipose tissue accumulation is also influenced by age, with evidence indicating a progressive increase across adulthood due to hormonal changes, reduced physical activity, and alterations in fat distribution (Kuk et al., 2005).
Exercise is a well-established non-pharmacological intervention for improving cardiometabolic health and body composition, with substantial evidence demonstrating preferential reductions in VAT relative to total body mass (Bellicha et al., 2021; Park et al., 2003; Verheggen et al., 2016). Aerobic training (AT) is consistently associated with significant VAT reductions, while high-intensity interval training appears to elicit comparable effects to moderate-intensity continuous training (MICT) when energy expenditure is matched (Gonzalez-Ruiz et al., 2017). Resistance training (RT), although less effective for VAT reduction in isolation, contributes to increases in lean mass and overall metabolic health (Khalafi et al., 2021). Combined AT and RT protocols do not consistently produce greater VAT reductions than AT alone, potentially due to insufficient aerobic training volume when modalities are integrated (Ismail et al., 2012; Vissers et al., 2013).
Despite this body of evidence, current exercise-VAT literature is dominated by studies conducted in mixed-BMI or overtly obese populations. Consequently, it remains unclear whether conclusions regarding exercise modality, intensity, and volume can be directly extrapolated to individuals with normal BMI or those at the lower boundary of the overweight category. Emerging evidence suggests that VAT accumulation and metabolic dysfunction may already be present in individuals near the upper limit of normal BMI or slightly above it, despite the absence of clinical obesity (Chen et al., 2024; Oldham & Robinson, 2018; Robinson, 2017). Including individuals with BMI values up to 27 kg/m2 therefore represents a pragmatic strategy to capture early VAT-driven metabolic risk, despite not meeting conventional BMI-based definitions of overweight or obesity. As mentioned, while a BMI range of 18.5 – 24.9 kg/m2 is conventionally defined as normal weight, evidence suggests that visceral adiposity and related metabolic risk may increase progressively (Conus et al., 2007) within the upper range of normal BMI and extend into the lower boundary of overweight. Individuals within this range may be misclassified as metabolically healthy based solely on BMI despite harboring excess VAT (Oldham & Robinson, 2018; Robinson, 2017). Therefore, a threshold of BMI ≤27 kg/m2 was selected to capture individuals at the interface between normal weight and early overweight, where disproportionate visceral fat accumulation may already be present, while minimizing confounding effects associated with established obesity. This approach reflects a pragmatic strategy commonly adopted in aggregate-data meta-analyses, where individual participant data are not available to define phenotype boundaries more precisely (Higgins et al., 2024).
Therefore, the aim of this systematic review and meta-analysis was to evaluate the efficacy of different exercise modalities in reducing visceral adipose tissue in adults with normal BMI (18.5 – 24.9 kg/m2) and those at the lower boundary of the overweight range (25 – 27 kg/m2). Accordingly, the target population in this review is defined as adults with normal BMI or near-normal BMI who may exhibit elevated or disproportionate VAT, regardless of external anthropometric appearance. This review seeks to clarify whether established exercise prescriptions for VAT reduction are applicable to individuals who are not classified as obese by BMI.
Methods
Search Strategy and Study Identification
A systematic literature search was conducted in PubMed/MEDLINE, Scopus, and Web of Science from January 1999 to July 2024. Google Scholar was used as a supplemental source for citation tracking and identification of additional relevant studies not captured in the primary database searches. The search strategy combined controlled vocabulary and free-text terms related to visceral adipose tissue, body mass index, and exercise interventions. Database-specific search strategies were developed using Boolean operators and adapted to the syntax of each database. The full reproducible search strategies for all databases are provided in the Supplementary Material.
Inclusion criteria were: (1) human intervention studies, (2) adult participants (≥18 years), (3) BMI ≤27 kg/m2, (4) chronic exercise interventions (≥4 weeks), (5) direct measurement of visceral adipose tissue using CT, MRI, or DXA. Exclusion criteria included observational designs, pharmacological interventions, pediatric populations, and studies assessing adiposity solely via anthropometry or bioelectrical impedance. The review protocol was prospectively registered on the Open Science Framework (OSF; DOI: 10.17605/OSF.IO/3DCXJ). The study selection process is summarized in a PRISMA flow diagram presented in the Results section (Figure 1), including reasons for exclusion at each stage. Flowchart of systematic review search strategy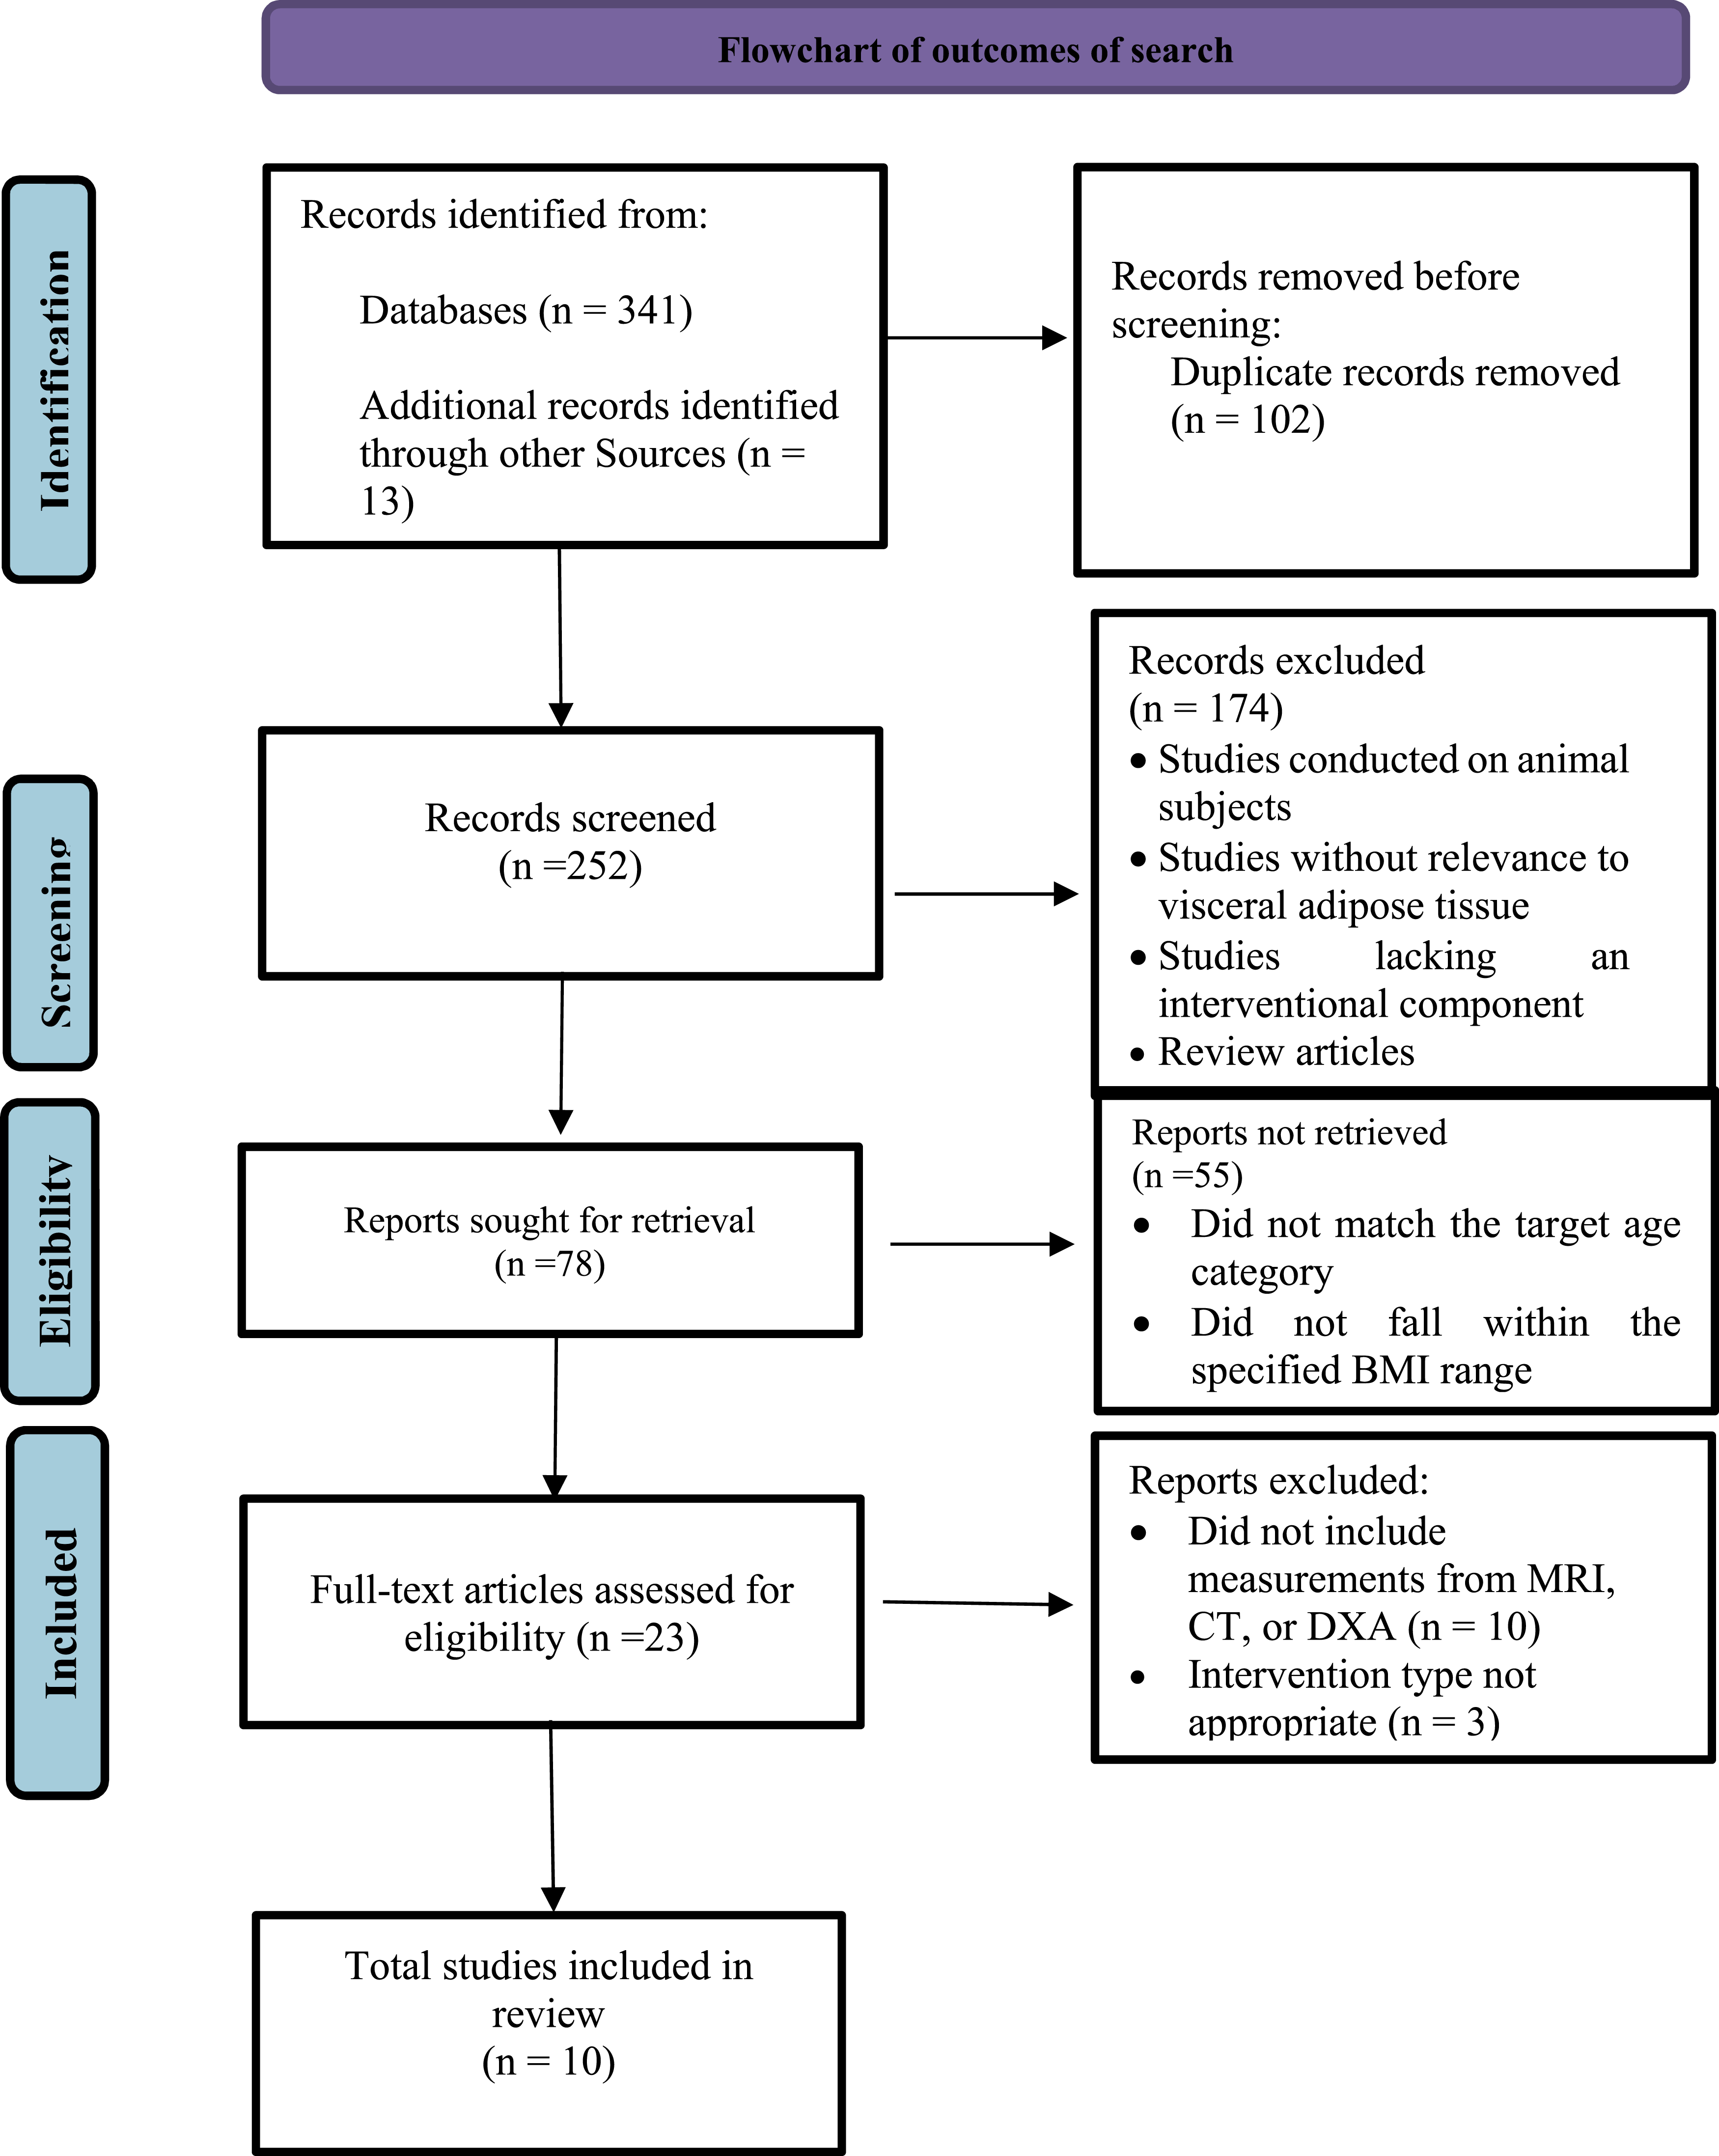
Risk-Of-Bias Assessment
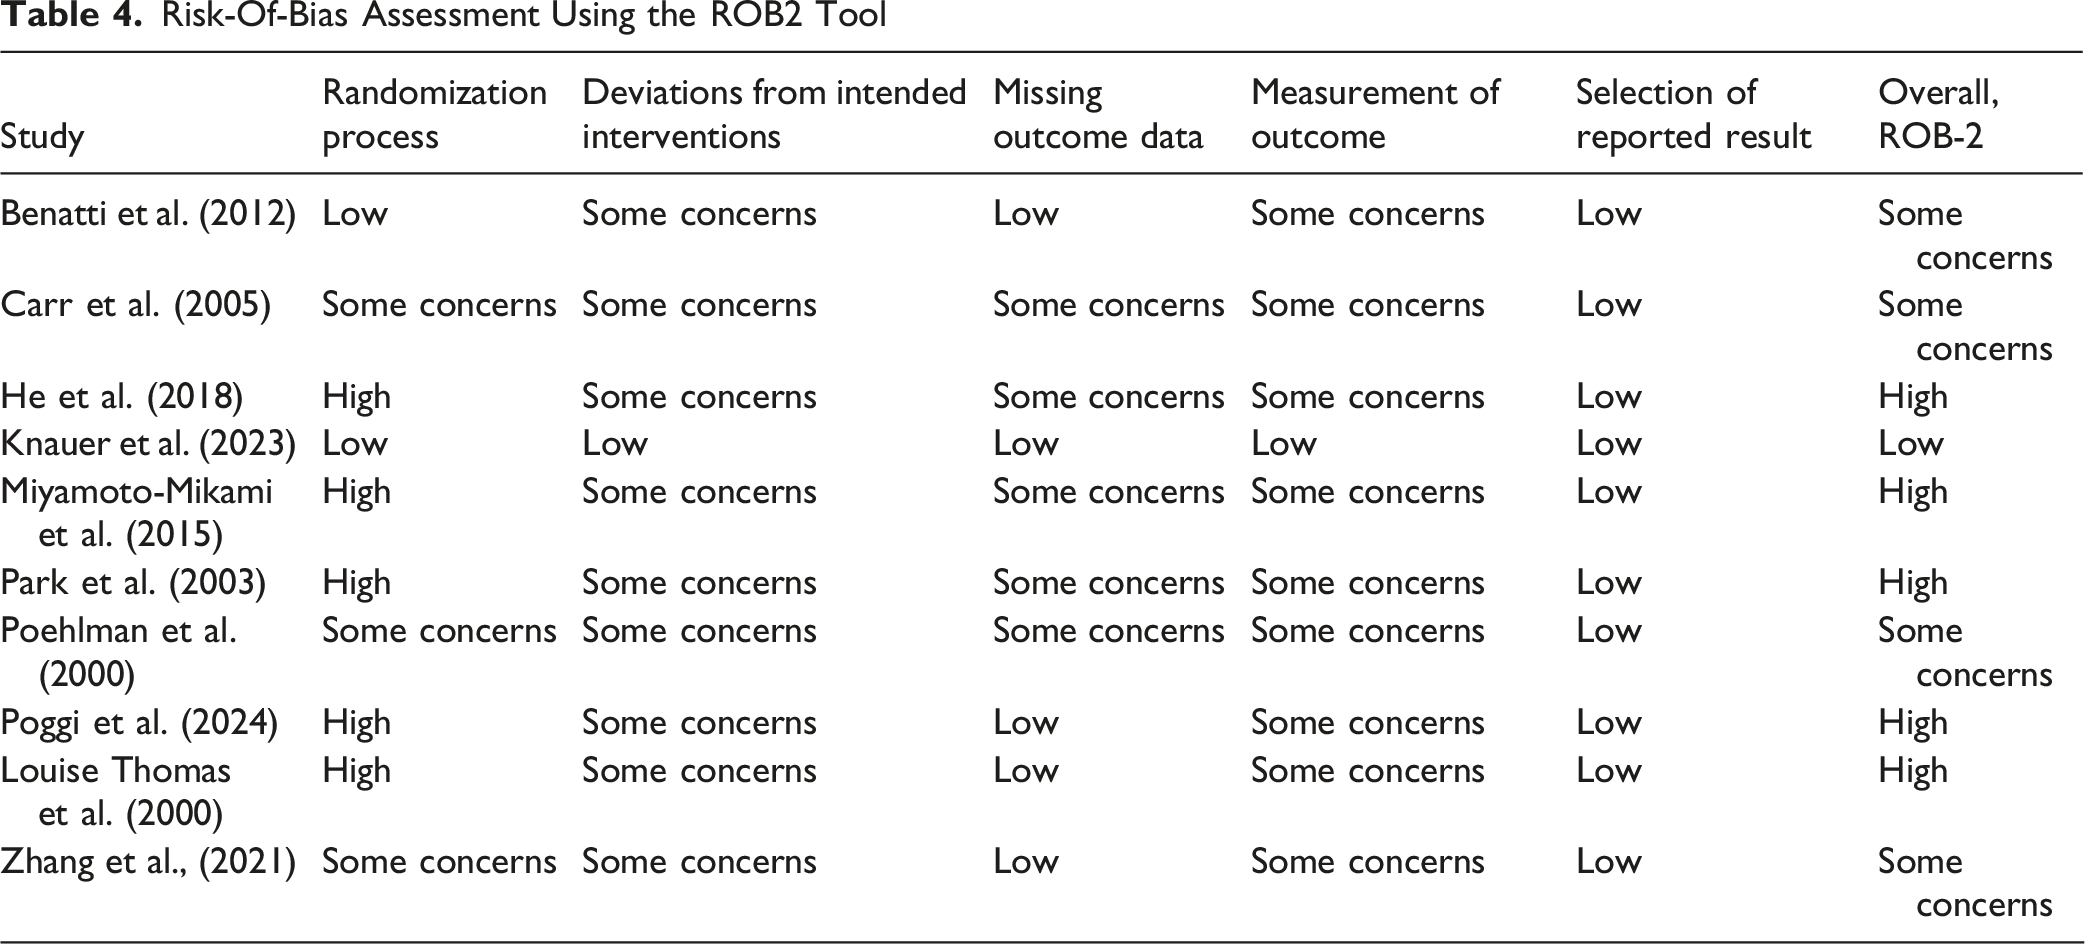
Risk of bias was assessed using the Cochrane Risk of Bias 2 (ROB2) tool (Chandler et al., 2019), which evaluates five domains: (1) bias arising from the randomization process, (2) bias due to deviations from intended interventions, (3) bias due to missing outcome data, (4) bias in measurement of the outcome, and (5) bias in selection of the reported result (Crocker et al., 2023). Two reviewers independently assessed each study. Disagreements were resolved through discussion or consultation with a third reviewer when necessary.
Certainty of Evidence Assessment (GRADE)
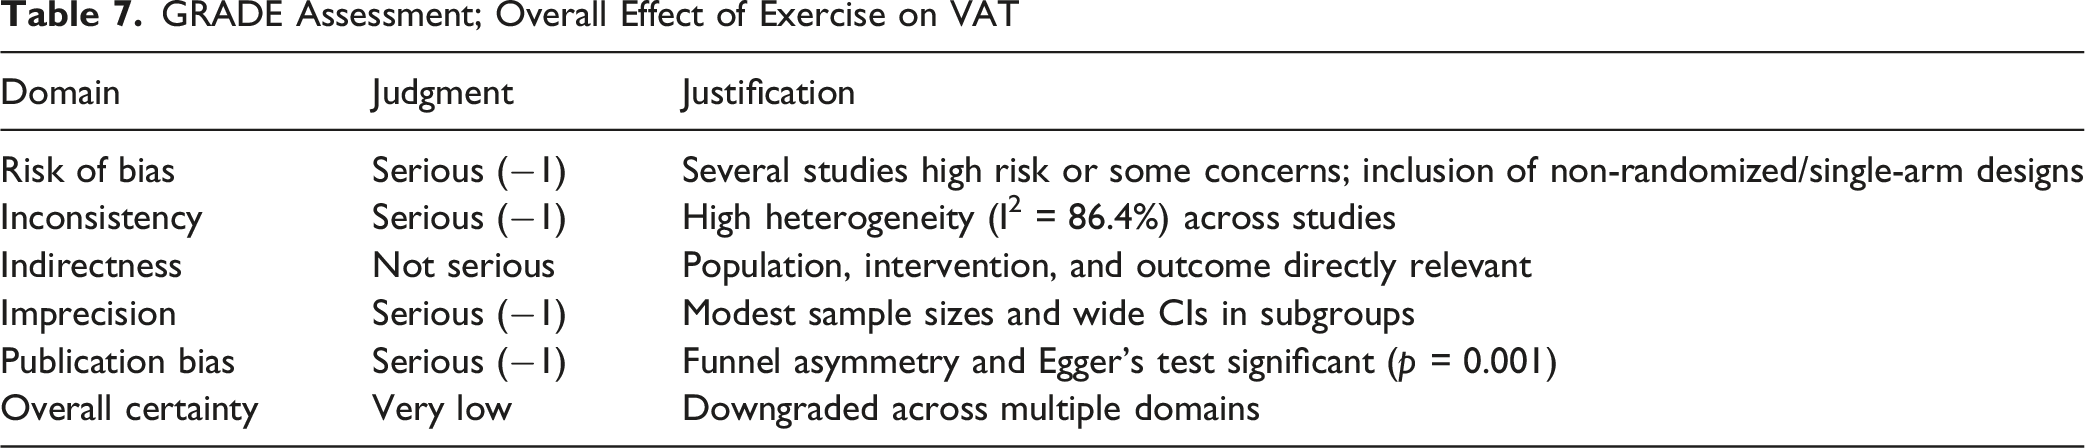
The certainty of evidence for the primary outcome (change in VAT) was evaluated using the Grading of Recommendations Assessment, Development, and Evaluation (GRADE) approach. The body of evidence was assessed across five domains: risk of bias, inconsistency, indirectness, imprecision, and publication bias. Randomized controlled trials were initially rated as high-certainty evidence and were downgraded if concerns were identified in any of the domains. Risk of bias judgments were informed by the ROB2 assessment. Statistical heterogeneity (I2), confidence intervals, total sample size, and funnel plot asymmetry with Egger’s regression test were considered when evaluating inconsistency, imprecision, and publication bias. The overall certainty of evidence was categorized as high, moderate, low, or very low (Guyatt et al., 2011, 2016).
Comparators
Studies were eligible if they reported either: between-group comparisons (exercise vs. control or alternative intervention), or within-group pre-post changes in visceral adipose tissue in the absence of a control group.
Interventions
Included studies examined chronic exercise interventions. Participants were assigned to groups according to the study design, based on different exercise modalities: aerobic exercise, endurance training, resistance exercise, or combined aerobic and resistance exercise, conducted in either continuous or interval formats.
Participants
Studies involving adult participants aged 18 years or older with a normal BMI (18.5 – 24.9 kg/m2) and the lower portion of the overweight range (≤27 kg/m2) were included. The threshold of BMI ≤27 kg/m2 was selected to capture individuals near the upper limit of normal weight and the lower range of overweight, where disproportionate visceral adiposity and early metabolic dysfunction have been reported, while minimizing confounding effects associated with established obesity.
Eligibility was determined at the study level based on reported mean BMI values, as individual participant data were not available across all studies. This approach is consistent with aggregate-data meta-analyses (Higgins et al., 2024) and allows for broader evidence inclusion while approximating the target population. However, it is acknowledged that within-cohort variability (e.g., BMI standard deviation) may include participants outside the intended BMI range, potentially reducing phenotype specificity. No restrictions were placed on sex, health status, or ethnic origin. BMI categories follow WHO definitions, but the cutoff was chosen for evidence capture and confounder control. These studies were retained to reflect the available evidence base; however, sensitivity analyses were conducted to evaluate their influence on the pooled estimates. In the present review, strict VAT cut-off values were not applied as eligibility criteria, as individual participant data were not available and reporting across studies was heterogeneous. Instead, the focus was placed on populations characterized by normal or near-normal BMI. This approach reflects a pragmatic strategy commonly used in aggregate-data meta-analyses, where phenotype definitions cannot be consistently operationalized at the individual level (Higgins et al., 2024).
Outcome Measures
Only studies that assessed VAT using computed tomography (CT), magnetic resonance imaging (MRI), or dual-energy X-ray absorptiometry (DXA) were included, while those relying on bioelectrical impedance or anthropometric evaluations were excluded. CT and MRI are widely regarded as reference-standard imaging modalities for the quantification of VAT due to their high spatial resolution and ability to directly differentiate visceral from subcutaneous compartments (Graffy & Pickhardt, 2016). DXA provides an indirect estimate of VAT based on regional attenuation algorithms (Katzmarzyk et al., 2013; Lin et al., 2013) and has demonstrated good agreement with CT and MRI, although some systematic differences may occur, particularly at higher levels of adiposity (Chan et al., 2023; Cheung et al., 2016; Micklesfield et al., 2012; Neeland et al., 2016). To account for potential variability across measurement techniques, standardized mean differences (SMD) were used in the meta-analysis, which minimizes the impact of differences in scale and measurement units across imaging modalities.
Data Synthesis and Grouping Strategy
Studies were grouped into two main categories for synthesis: within-group analyses, which included single-arm intervention studies reporting pre- and post-intervention changes in visceral adipose tissue (VAT), and between-group analyses, which included randomized or non-randomized controlled trials comparing exercise interventions with control or alternative treatment groups. Eligibility for each synthesis was determined based on the availability of comparable outcome data and sufficient statistical detail for effect size calculation.
Study Selection
The study selection process followed PRISMA guidelines. First, duplicate records were removed prior to screening. Titles and abstracts of the remaining studies were then screened for relevance according to the predefined eligibility criteria. Full-text articles were subsequently retrieved and assessed for eligibility. Studies that met the inclusion criteria were retained for the final analysis. Two investigators independently screened the studies, and any discrepancies were resolved through discussion. In cases where published articles contained incomplete or ambiguous data, the study authors were contacted for clarification. Extracted variables included study design, participant characteristics, intervention type and duration, comparator group (within- or between-group), visceral adipose tissue outcomes, and measurement methods (e.g., CT, MRI, DXA).
Statistical Analysis
Meta-analysis was conducted using Stata 17 (StataCorp, College Station, TX, USA) to calculate SMD for between group, standardized mean changes (SMC) for within group and confidence intervals (CI) to evaluate the impact of various exercise modalities on changes in visceral fat. A random-effects model was applied, and heterogeneity was assessed using the I2 statistic. Values of I2 greater than 50% indicated substantial heterogeneity, while values below 50% indicated low heterogeneity (Higgins et al., 2024). Data synthesis was conducted separately for controlled and single-arm studies. These analyses were conducted separately due to inherent methodological differences between study designs. Between-group comparisons provide stronger causal inference, whereas within-group analyses are more susceptible to bias and were therefore interpreted as supportive evidence. Where heterogeneity was present, subgroup analysis was used to explore potential sources. Effect sizes were interpreted following Cohen’s d guidelines, with d = 0.2 representing a small effect, d = 0.5 a medium effect, and d = 0.8 or greater a large effect (Cohen, 2013). Sensitivity analysis involved sequential exclusion of individual studies to assess the influence of each on overall results. Publication bias was assessed using a funnel plot and Egger’s test, with a p-value greater than 0.05 indicating no significant publication bias. For studies that did not report the standard deviation (SD) of change, were estimated using the following formula:

Assuming a correlation coefficient (r) of 0.8 between baseline and post-intervention values. A correlation coefficient of 0.8 was used, reflecting the strong relationship typically observed between repeated body composition measures in exercise trials. Sensitivity analyses were conducted using alternative values (r = 0.5 and r = 0.9) to assess the robustness of the results (Higgins et al., 2024; Lefebvre et al., 2024) forest plots were planned for effect sizes.
Results
Study Selection
A total of 341 original studies were identified through electronic database searches, supplemented by 13 additional manually identified articles. After initial screening and applying eligibility criteria, 344 articles were excluded, leaving 10 publications for analysis (see Figure 1). Several studies included multiple intervention arms or analytically distinct subgroups (different exercise modalities). Each arm was treated as a separate experimental cohort for meta-analytic purposes, resulting in 18 cohorts derived from 10 studies.
Subject Characteristics
Interventions and Participant Characteristics
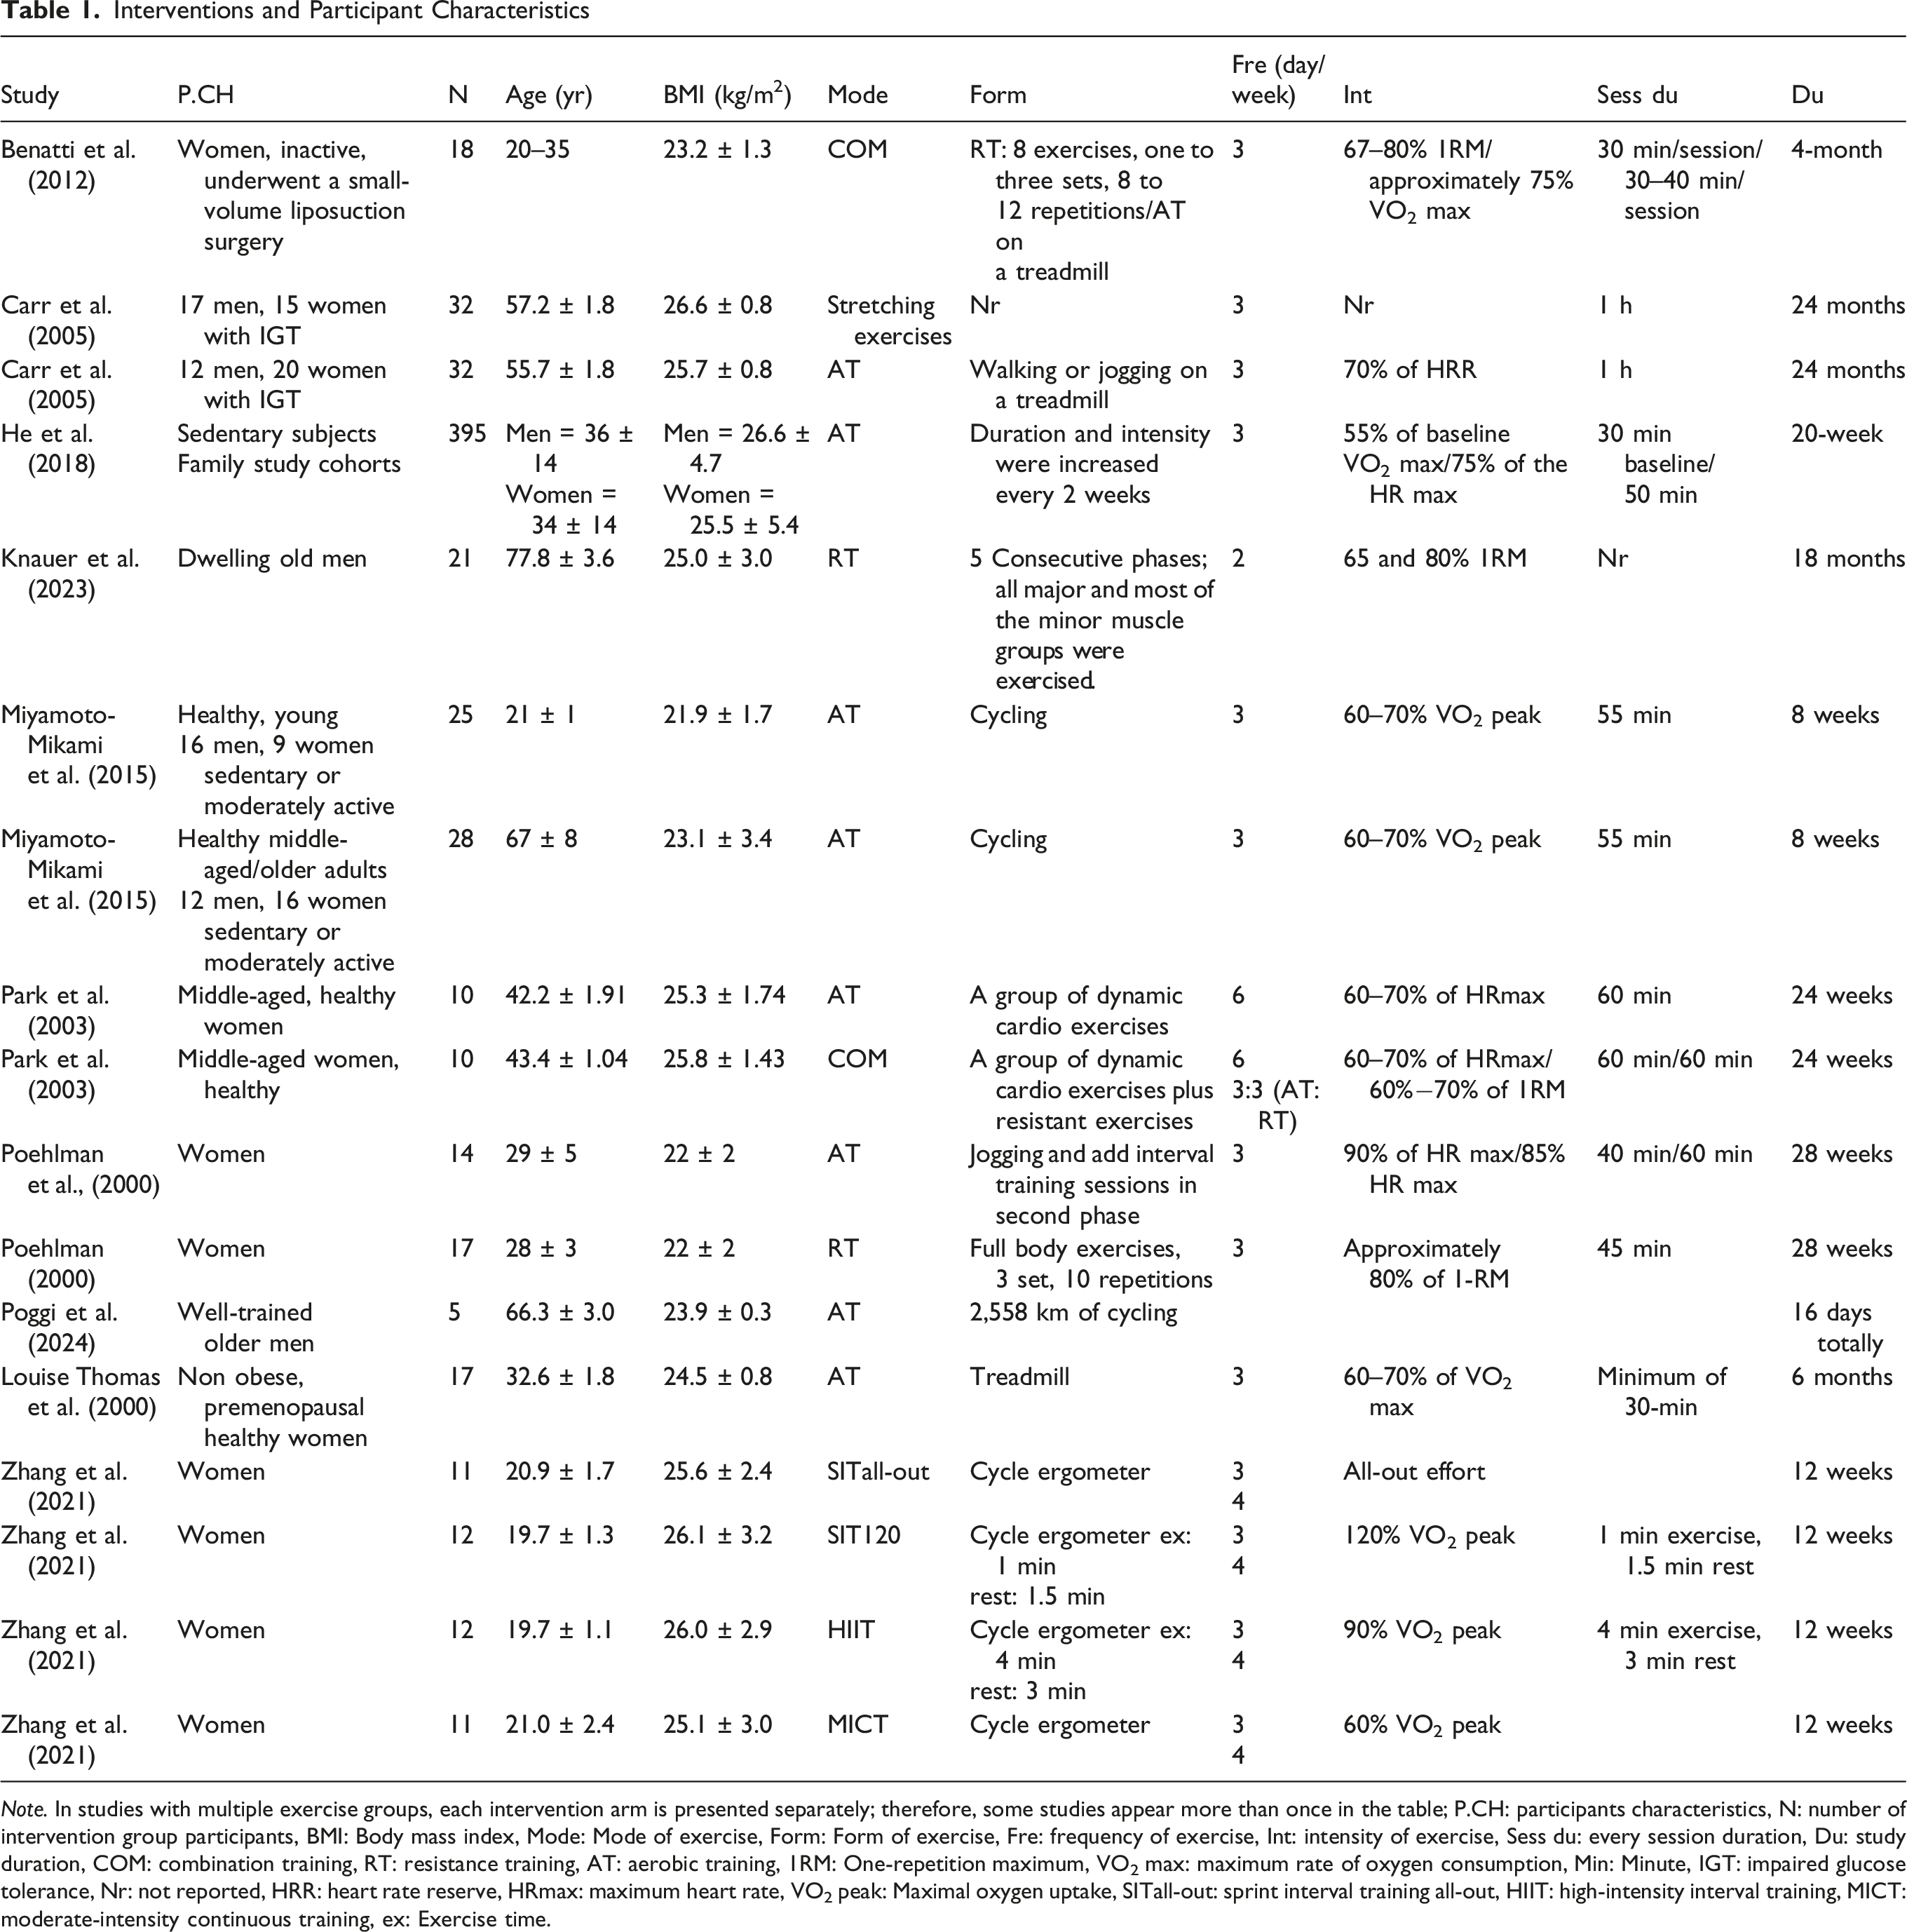
Note. In studies with multiple exercise groups, each intervention arm is presented separately; therefore, some studies appear more than once in the table; P.CH: participants characteristics, N: number of intervention group participants, BMI: Body mass index, Mode: Mode of exercise, Form: Form of exercise, Fre: frequency of exercise, Int: intensity of exercise, Sess du: every session duration, Du: study duration, COM: combination training, RT: resistance training, AT: aerobic training, 1RM: One-repetition maximum, VO2 max: maximum rate of oxygen consumption, Min: Minute, IGT: impaired glucose tolerance, Nr: not reported, HRR: heart rate reserve, HRmax: maximum heart rate, VO2 peak: Maximal oxygen uptake, SITall-out: sprint interval training all-out, HIIT: high-intensity interval training, MICT: moderate-intensity continuous training, ex: Exercise time.
Study Design Characteristics
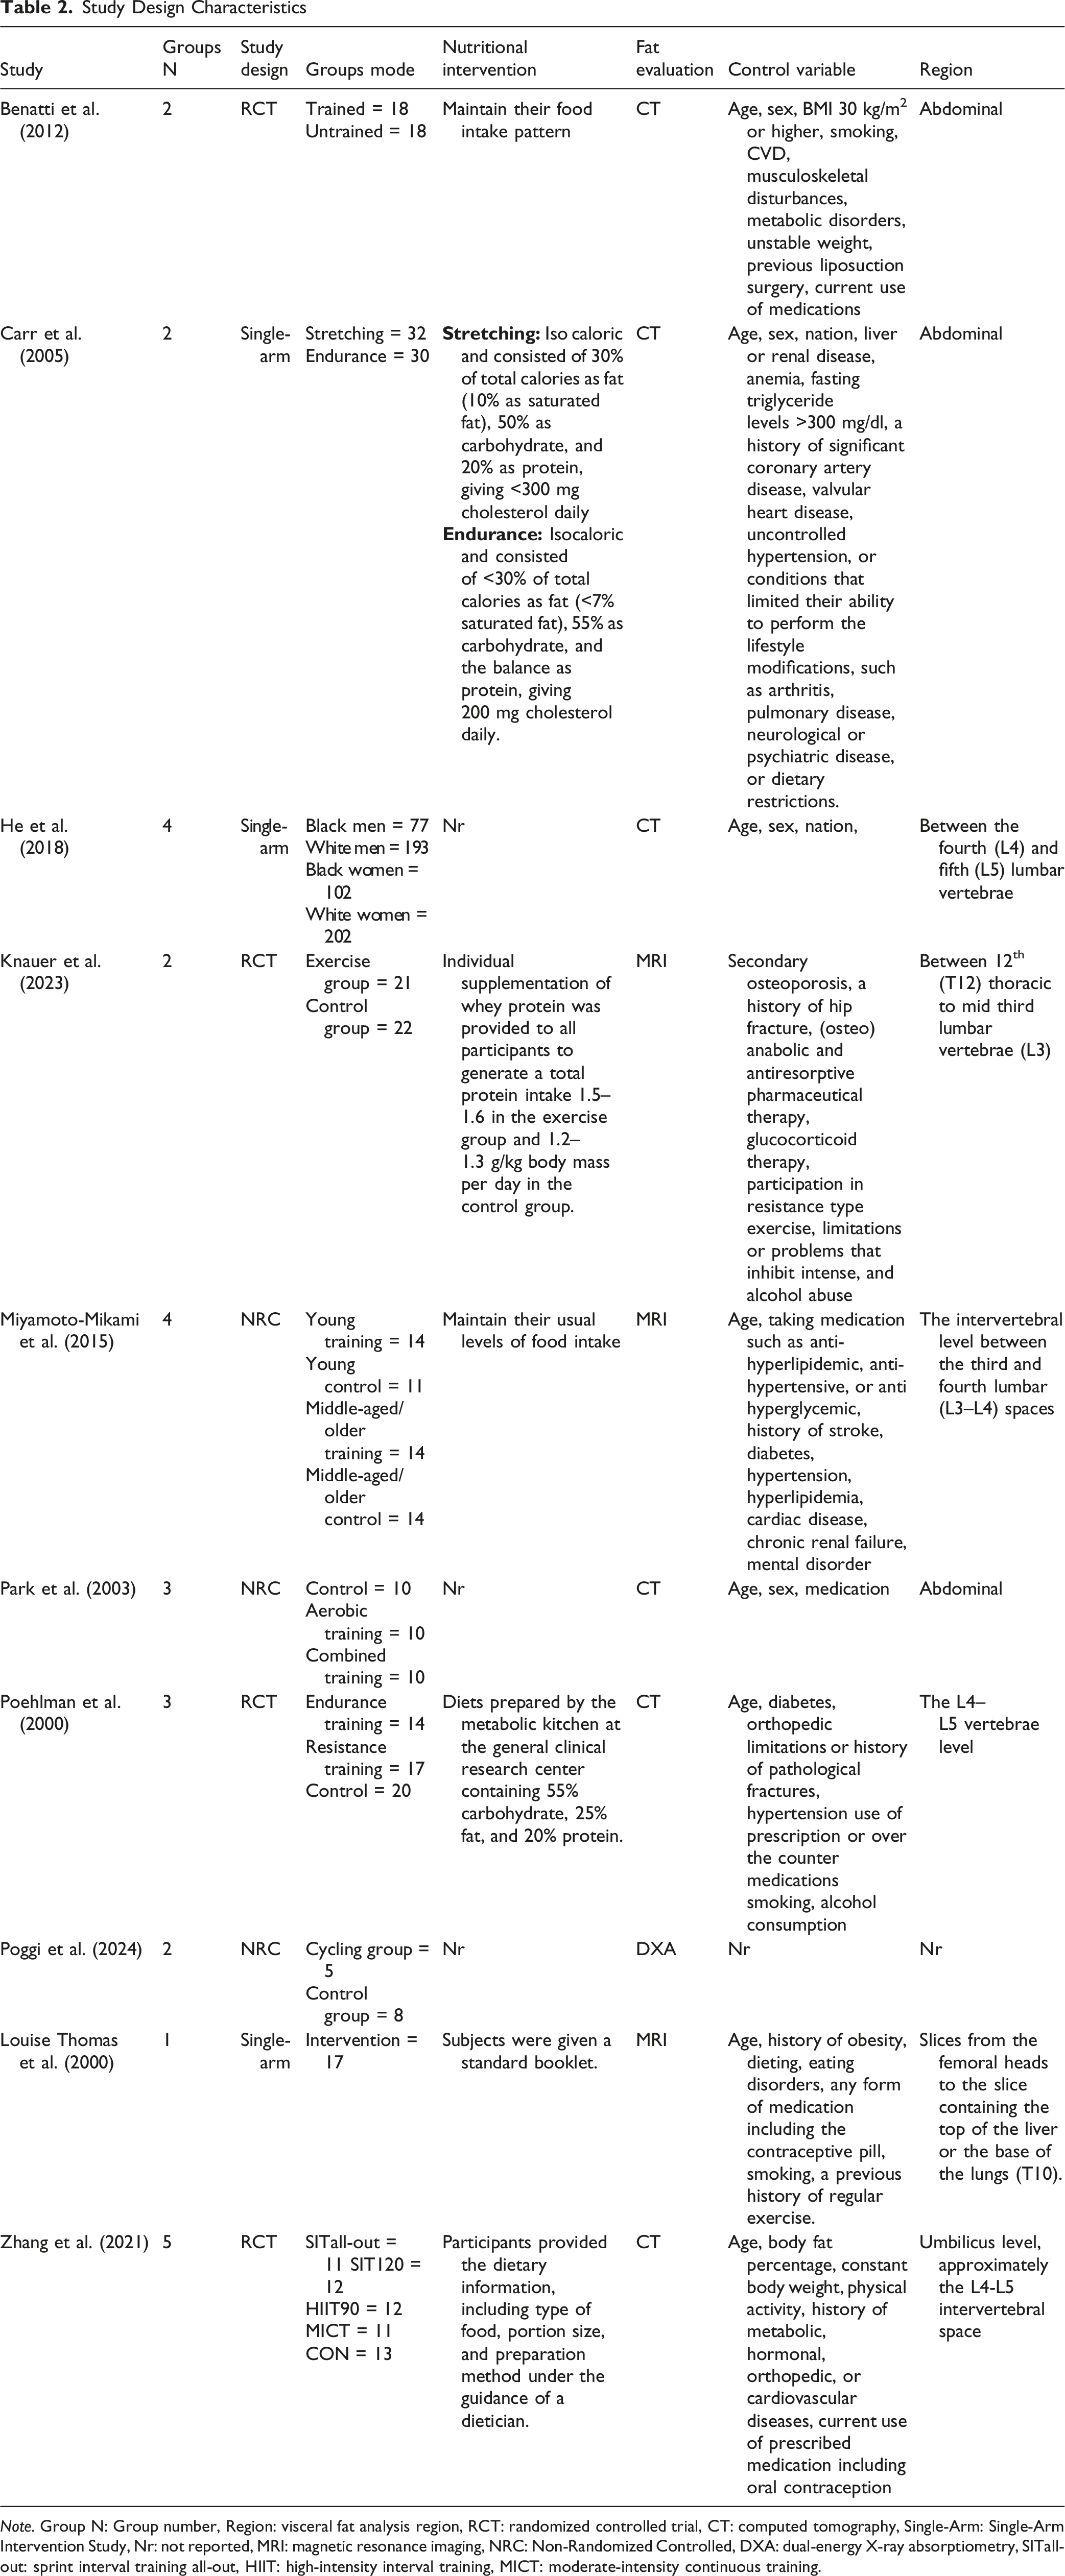
Note. Group N: Group number, Region: visceral fat analysis region, RCT: randomized controlled trial, CT: computed tomography, Single-Arm: Single-Arm Intervention Study, Nr: not reported, MRI: magnetic resonance imaging, NRC: Non-Randomized Controlled, DXA: dual-energy X-ray absorptiometry, SITall-out: sprint interval training all-out, HIIT: high-intensity interval training, MICT: moderate-intensity continuous training.
Across studies, mean participant age ranged from 19.7 ± 1.3 to 77.8 ± 3.6 years, with the BMI mean ranged from 23.1 ± 3.4 to 25.5 ± 5.4 kg/m2, encompassing normal-weight and lower-overweight individuals. Across studies, BMI variability within cohorts was substantial, indicating that some participants may have exceeded the nominal BMI threshold despite meeting study-level eligibility criteria. Most cohorts involved otherwise healthy but physically inactive adults, with three cohorts including specific clinical or trained populations. Seven studies recruited healthy individuals, while others included participants who had recently undergone a minor liposuction procedure (n = 1; Benatti et al., 2012) individuals with impaired glucose tolerance (n = 1; Carr et al., 2005), and older men with osteo-sarcopenia (n = 1; Knauer et al., 2023).
Exercise Intervention Characteristics
Aerobic training was the most common intervention, typically involving treadmill running, while resistance training frequently utilized weight machines. For aerobic interventions, the majority (8 studies) implemented a frequency of 3 days per week, with one study progressively increasing to 4 (Zhang et al., 2021) days, and one study beginning with 6 days per week (Park et al., 2003). Resistance training was performed 2 (Knauer et al., 2023) and 3 days per week (Poehlman et al., 2000), while combined aerobic and resistance training was conducted 3 days per week (Benatti et al., 2012) or 6 days per week (3 days each for aerobic and resistance training; Park et al., 2003).
The intensity of AT was typically indicated as a percentage of maximum oxygen consumption, Maximal oxygen uptake, heart rate reserve, or maximum heart rate (HRmax), ranging from 55% to 120% with 60–70% HRmax being the most common range. Resistance exercise intensity was based on the one-repetition maximum (1-RM), with loads between 60 – 80% of 1-RM. Two studies employed interval training (IT) modalities, including sprint, supra-maximal, and high-intensity intervals (Zhang et al., 2021), or intervals as part of an endurance training program (Poehlman et al., 2000).
Dietary Intake
In five studies, participants were provided specific diet prescriptions outlining macronutrient and energy intake (Carr et al., 2005; Knauer et al., 2023; Louise Thomas et al., 2000; Poehlman et al., 2000; Zhang et al., 2021; see Table 2). Two other studies advised participants to maintain their usual dietary patterns (Benatti et al., 2012; Miyamoto-Mikami et al., 2015), while the remaining three studies did not report on dietary intake. Dietary control varied substantially across studies and represents a potential source of residual confounding, particularly given the sensitivity of VAT to energy balance and macronutrient intake.
Visceral Adipose Tissue Assessments
Most studies used CT to assess VAT. Three studies used MRI (Knauer et al., 2023; Louise Thomas et al., 2000; Miyamoto-Mikami et al., 2015), and one used DXA (Poggi et al., 2024). The majority of assessments focused on the abdominal region, particularly the lumbar interspace between L4 and L5. Other studies varied in measurement regions, such as L3–L4 (Miyamoto-Mikami et al., 2015), from the femoral heads to the liver or lung bases (T10; Louise Thomas et al., 2000) and T12 to mid-L3 (Knauer et al., 2023). Poggi et al. (2024) did not specify the VAT region assessed.
Significant Changes in Visceral Adipose Tissue
Study Results
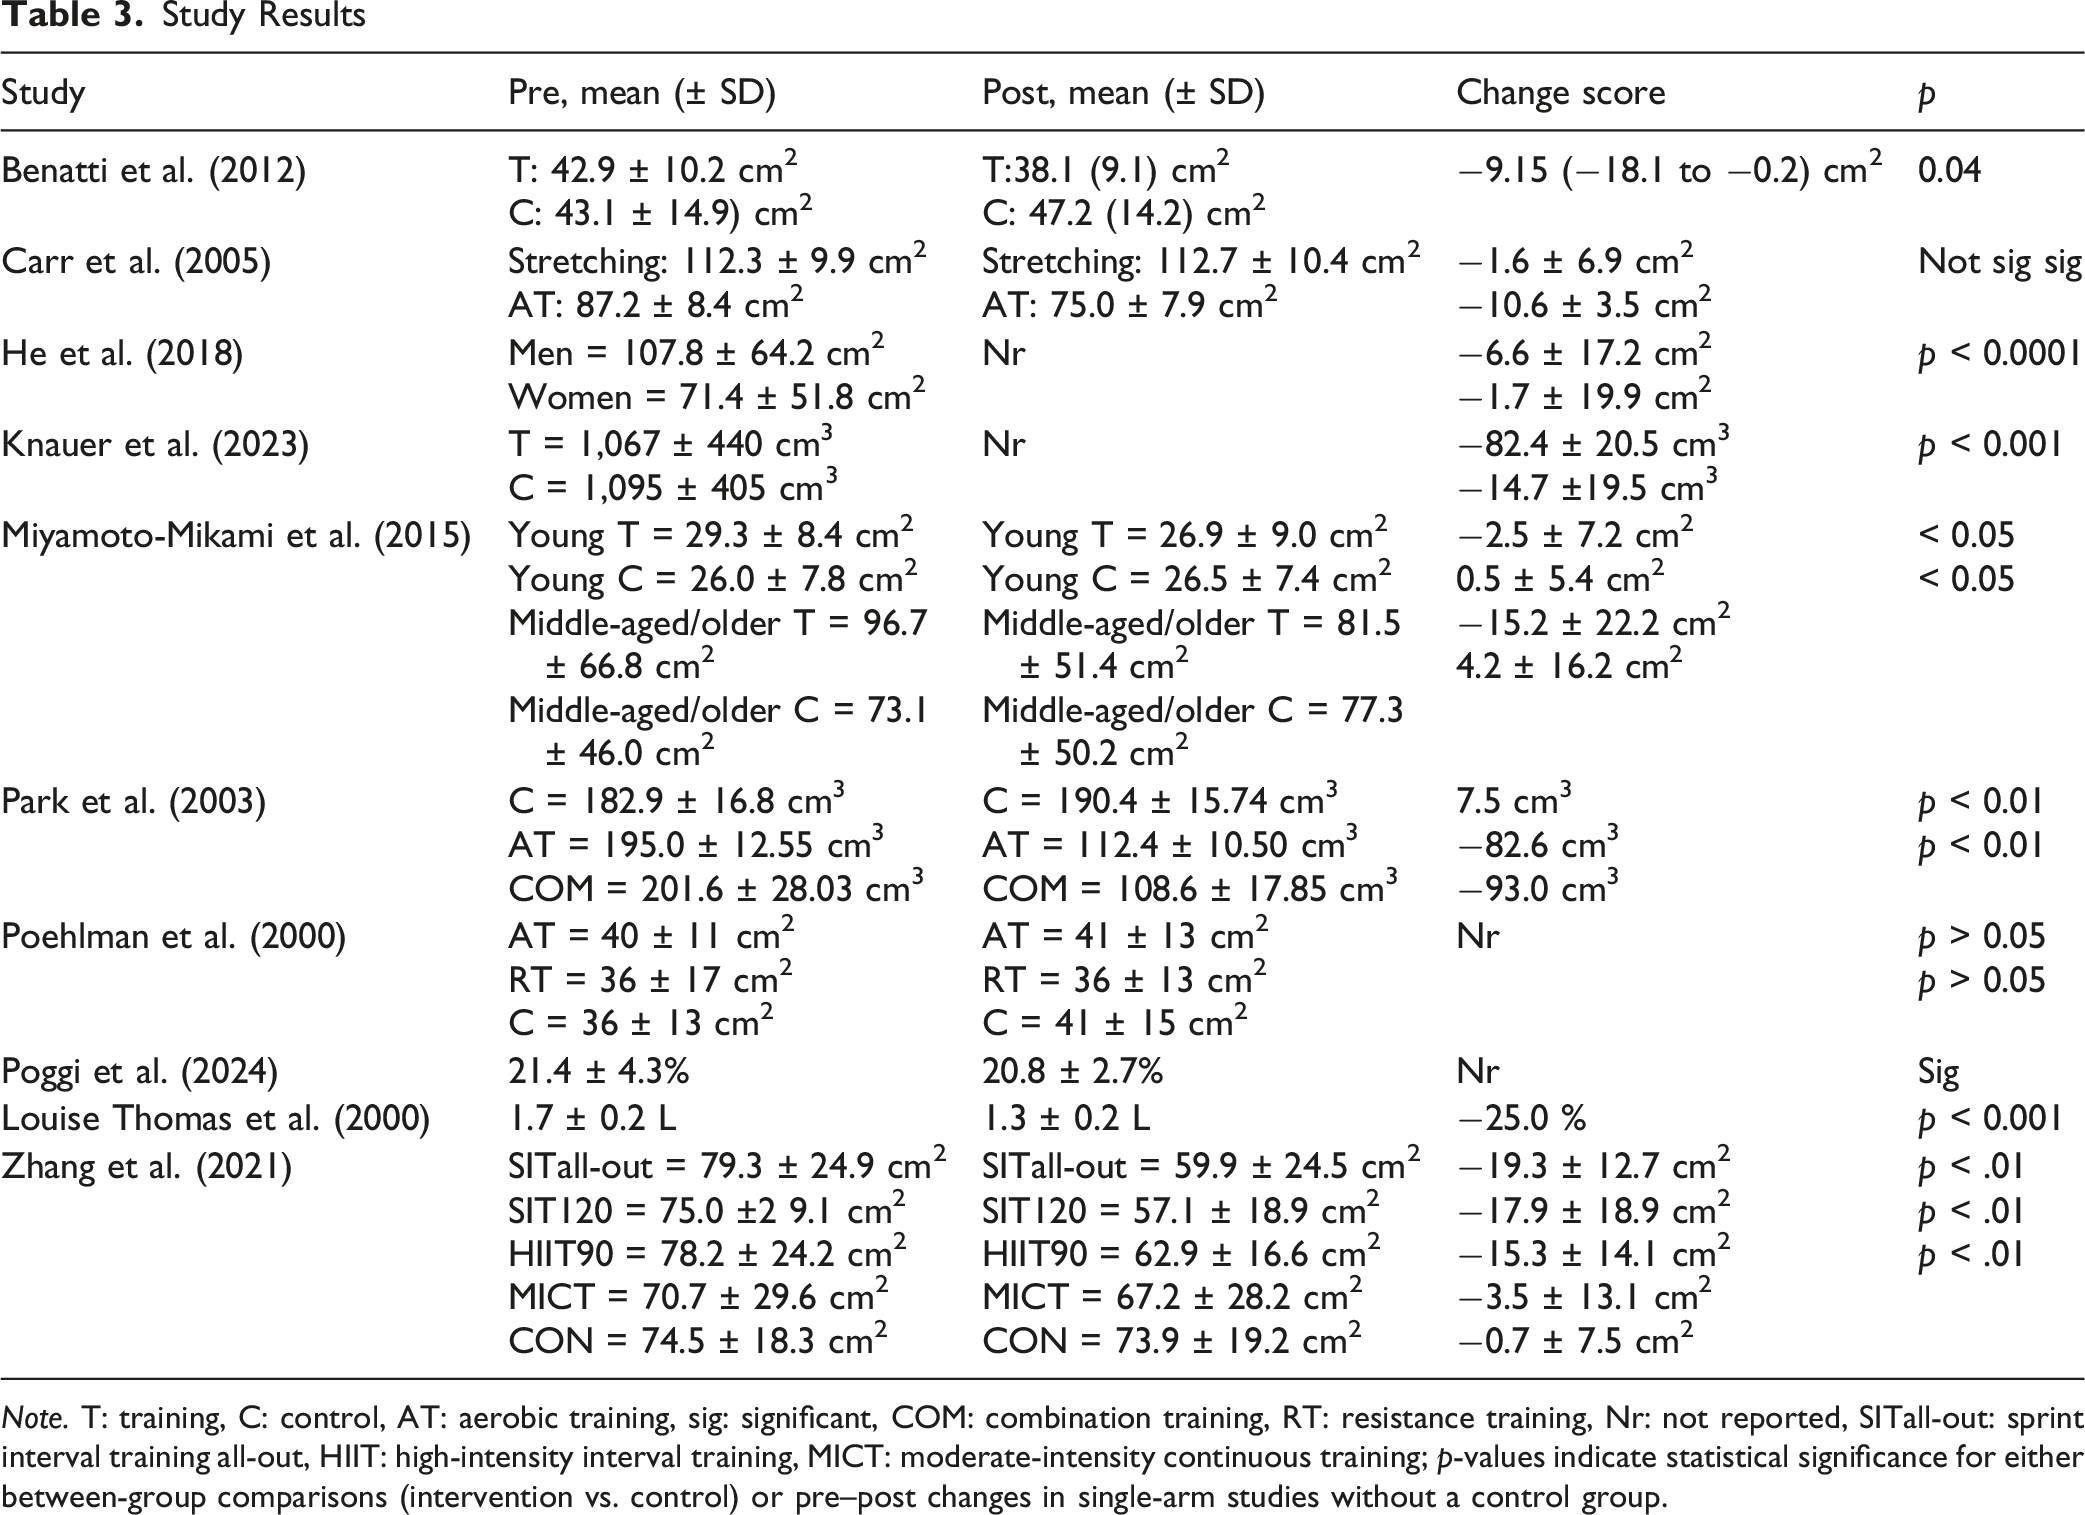
Note. T: training, C: control, AT: aerobic training, sig: significant, COM: combination training, RT: resistance training, Nr: not reported, SITall-out: sprint interval training all-out, HIIT: high-intensity interval training, MICT: moderate-intensity continuous training; p-values indicate statistical significance for either between-group comparisons (intervention vs. control) or pre–post changes in single-arm studies without a control group.
Risk of Bias
Risk-Of-Bias Assessment Using the ROB2 Tool
Meta-Analysis
The meta-analysis included 10 studies. Although 10 studies were analyzed, the meta-analysis included 18 data entries due to multiple study groups within some studies, which involved different interventions.
Between-Group Analysis
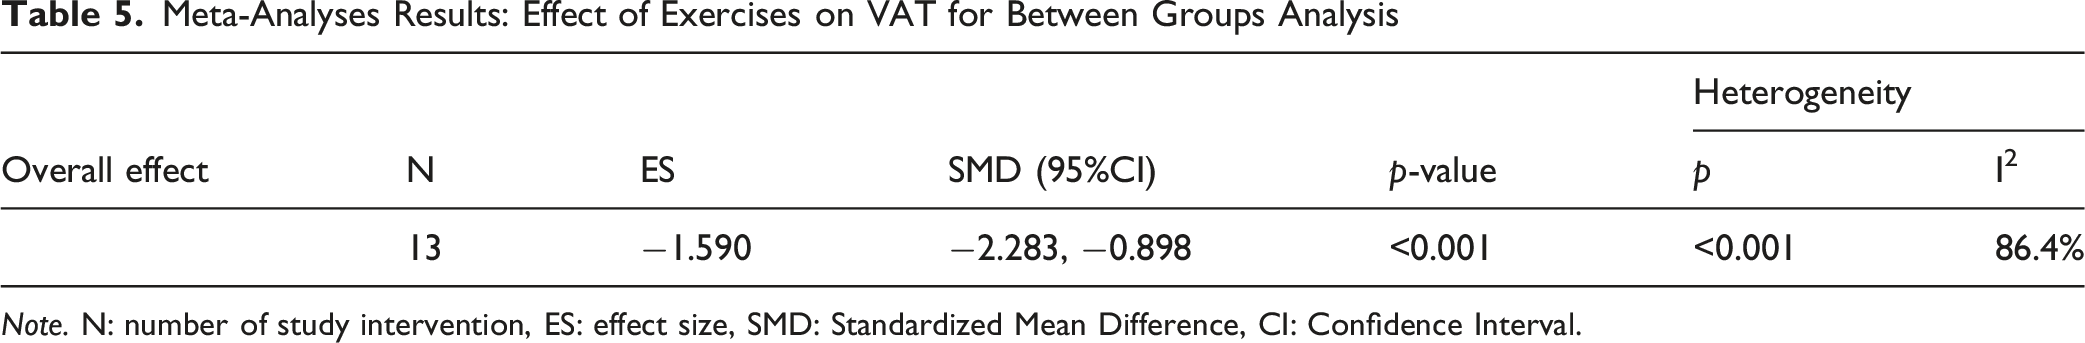
A meta-analysis of 13 controlled comparisons (n = 354) showed that exercise was associated with a significant reduction in visceral adipose tissue (SMD = −1.590, 95% CI: −2.283 to −0.898, p < 0.001) (Figure 2(a)). Substantial heterogeneity was observed (I2 = 86.4%) (Table 5). Forest plot; (a) between-group subgroup analysis; showing the weighted mean differences (Weight %) and standardized mean differences (95% confidence limits) between exercise and control groups, (b) within-group subgroup analysis; presenting the pre-to-post intervention changes in VAT within exercise-only groups; SMD: Standardized Mean Difference Meta-Analyses Results: Effect of Exercises on VAT for Between Groups Analysis Note. N: number of study intervention, ES: effect size, SMD: Standardized Mean Difference, CI: Confidence Interval.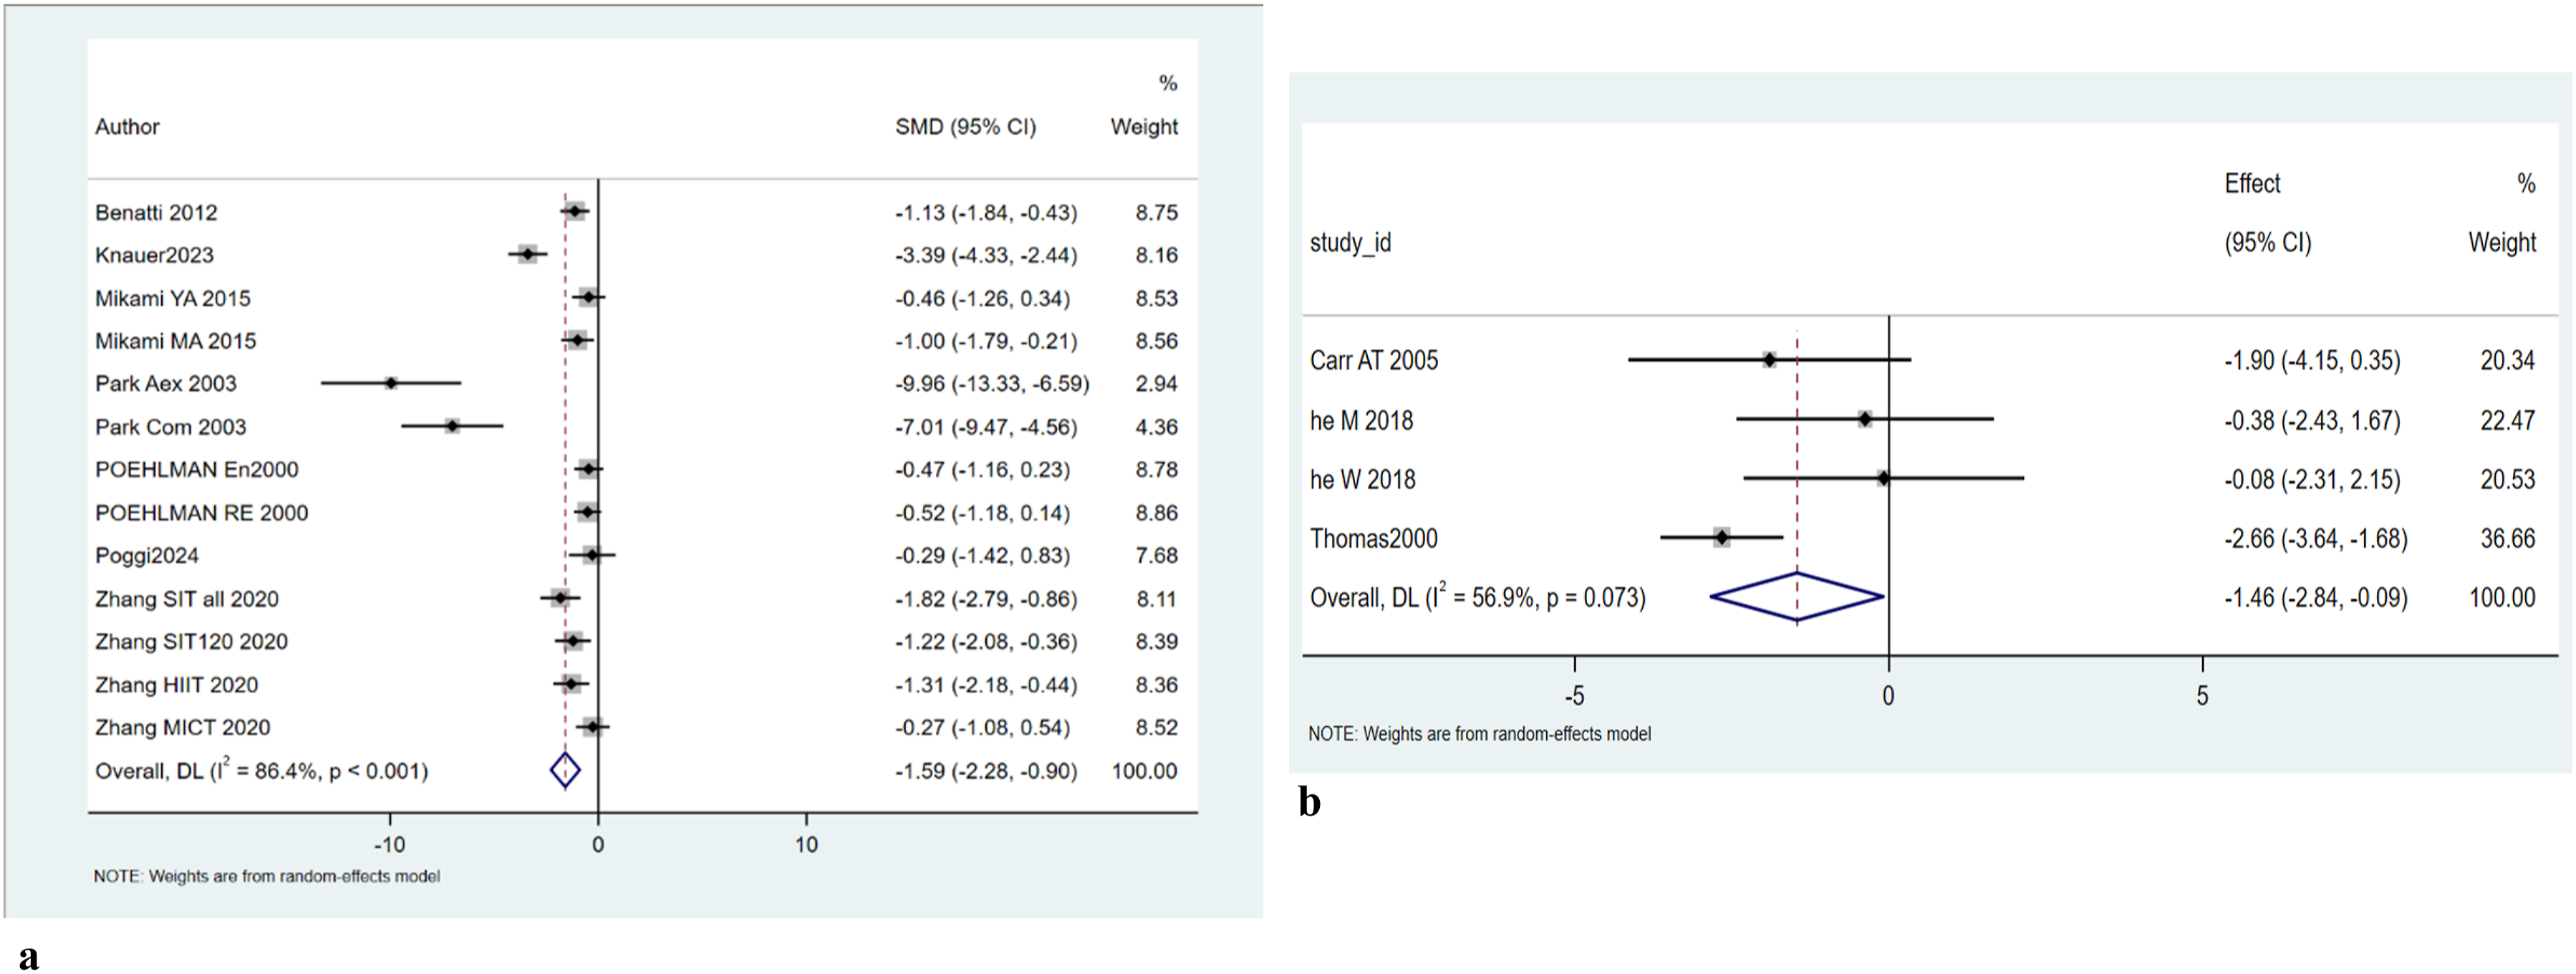
Within-Group Analysis
A within-group meta-analysis of five studies was conducted to evaluate changes in visceral adipose tissue following exercise interventions. The pooled analysis showed a reduction in visceral adipose tissue; however, the effect did not reach statistical significance (SMD = −1.247, 95% CI: −2.531 to 0.037, p = 0.057). Moderate heterogeneity was observed across studies (I2 = 54.8%, p = 0.065), indicating variability in effect sizes (Figure 2(b)).
Sensitivity Analysis
Between-Group Analysis
Sensitivity analyses were conducted to evaluate the robustness of the pooled estimates. Leave-one-out influence analysis demonstrated that the overall effect size remained statistically significant regardless of the study omitted, with pooled SMDs ranging from −1.291 (when excluding Park et al., 2003) to −1.730 (when excluding Zhang MICT 2020). These findings indicate that no single study disproportionately altered the direction or statistical significance of the overall effect. Notably, the exclusion of studies with comparatively large effect sizes, particularly Park et al. (2003) and Knauer et al. (2023), resulted in a reduction in the magnitude of the pooled estimate, while the overall direction and statistical significance remained unchanged.
Additional sensitivity analyses excluding studies involving atypical or clinical populations (Benatti et al., 2012; Knauer et al., 2023; Poggi et al., 2024) yielded a pooled effect size of SMD = −1.563 (95% CI: −2.342 to −0.784) for between-group comparisons, which remained consistent in both direction and statistical significance. In contrast, the corresponding within-group (Carr et al., 2005) analysis (SMD = −1.250, 95% CI: −3.107 to 0.607) showed greater uncertainty, with confidence intervals crossing zero.
Leave-one-out sensitivity analysis for r = 0.5 demonstrated that the pooled effect remained stable (SMD range: −1.38 to −1.85), indicating that no single study substantially influenced the overall result. The pooled effect was statistically significant (SMD = −1.70, 95% CI: −2.41 to −0.99, p < 0.001), although substantial heterogeneity was observed (I2 = 86.5%). In addition, influence analysis for r = 0.9 demonstrated that the pooled effect size remained negative across all leave-one-out iterations (SMD range: −0.97 to −1.35), indicating that no single study substantially influenced the overall estimate. The pooled effect remained statistically significant (SMD = −1.24, 95% CI: −1.87 to −0.60, p < 0.001), although substantial heterogeneity was observed (I2 = 85.4%).
Overall, these analyses suggest that the observed reduction in visceral adipose tissue is robust across analytical assumptions, although partially influenced by a small number of high-impact studies.
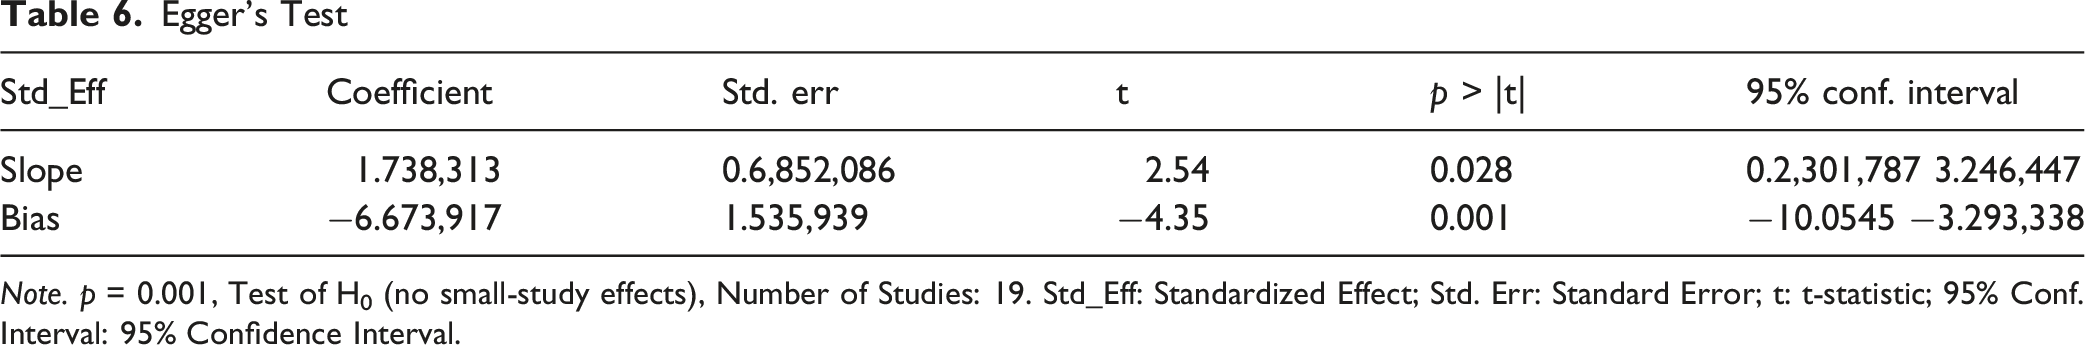
Publication Bias
Between-Group Analysis
Publication bias was assessed using visual inspection of the funnel plot and Egger’s regression test. The funnel plot demonstrated asymmetry, with several studies showing large effect sizes and relatively high standard errors (Figure 3). Egger’s test indicated significant small-study effects (p = 0.001), suggesting the presence of potential publication bias or related biases (Table 6). These findings should be interpreted with caution, as asymmetry in funnel plots may also arise from substantial between-study heterogeneity, differences in study design, or the presence of outlier studies. Publication bias and sensitivity analyses were not performed for within-group estimates due to the limited number of included studies, which restricts the reliability of such assessments. Funnel plot; effects of exercise interventions on VAT Egger’s Test Note. p = 0.001, Test of H0 (no small-study effects), Number of Studies: 19. Std_Eff: Standardized Effect; Std. Err: Standard Error; t: t-statistic; 95% Conf. Interval: 95% Confidence Interval.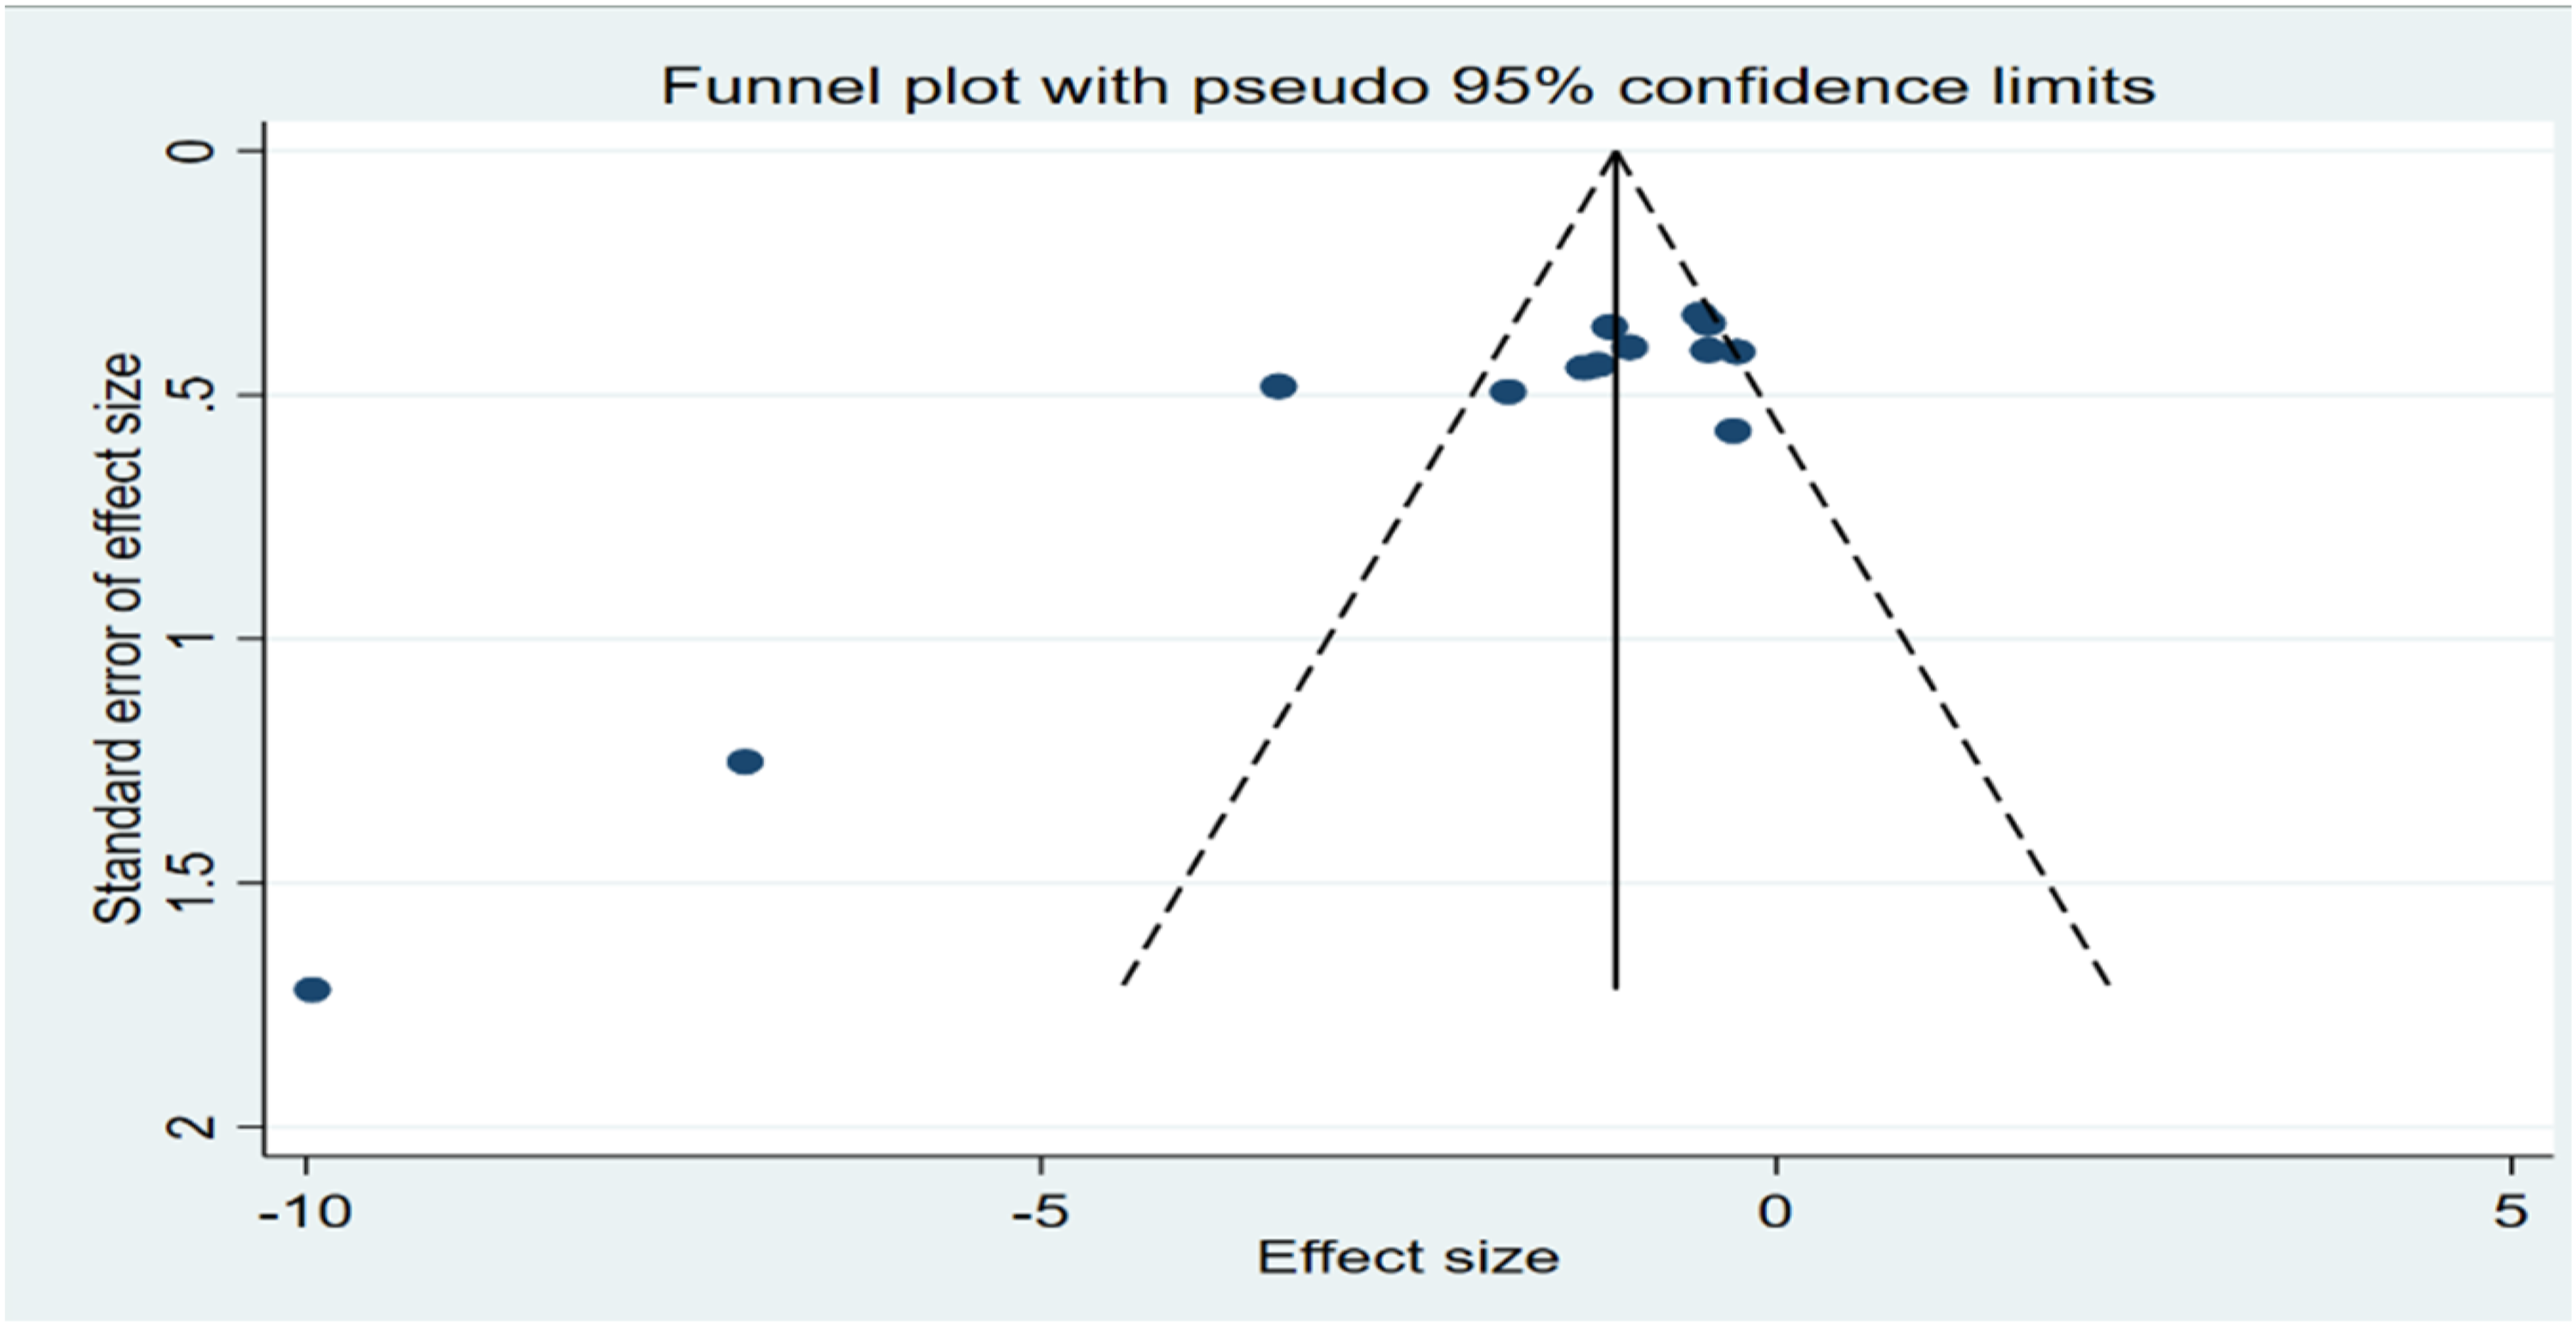
Certainty of Evidence
GRADE Assessment; Overall Effect of Exercise on VAT
Subgroup Analysis
Mode of Exercise
Between-Group Analysis
Subgroup analyses were conducted according to exercise modality, including AT, RT, COM, and IT. A statistically significant reduction in visceral adipose tissue was observed in the AT subgroup (SMD = −1.081, 95% CI: −2.064 to −0.099, p = 0.031) and the IT subgroup (SMD = −1.422, 95% CI: −1.939 to −0.905, p < 0.001). In contrast, the COM and RT subgroups did not reach statistical significance. Substantial heterogeneity was observed within the COM (I2 = 95.1%), RT (I2 = 95.8%), and AT (I2 = 84.3%) subgroups, whereas heterogeneity was negligible in the IT subgroup (I2 = 0.0%). The test for subgroup differences was not statistically significant (Q = 1.30, p = 0.730), indicating that the observed differences in effect size across exercise modalities should be interpreted with caution (Figure 4(a)). Subgroup forest plot for (a) Exercise mode, (b) Duration; (c) BMI (d) Age; showing weighted mean differences (Weight %) and SMD (95% confidence limits); SMD: Standardized Mean Difference, COM: combination training, RT: resistance training, AT: aerobic training, INT: interval training; DU: duration of study, x > 5: more than 5 months, x ≤ 5: less than 5 months, BMI: Body mass index, NW: normal-weight, LBO: lower boundary of overweight, Y: young, O: old, M: middle-aged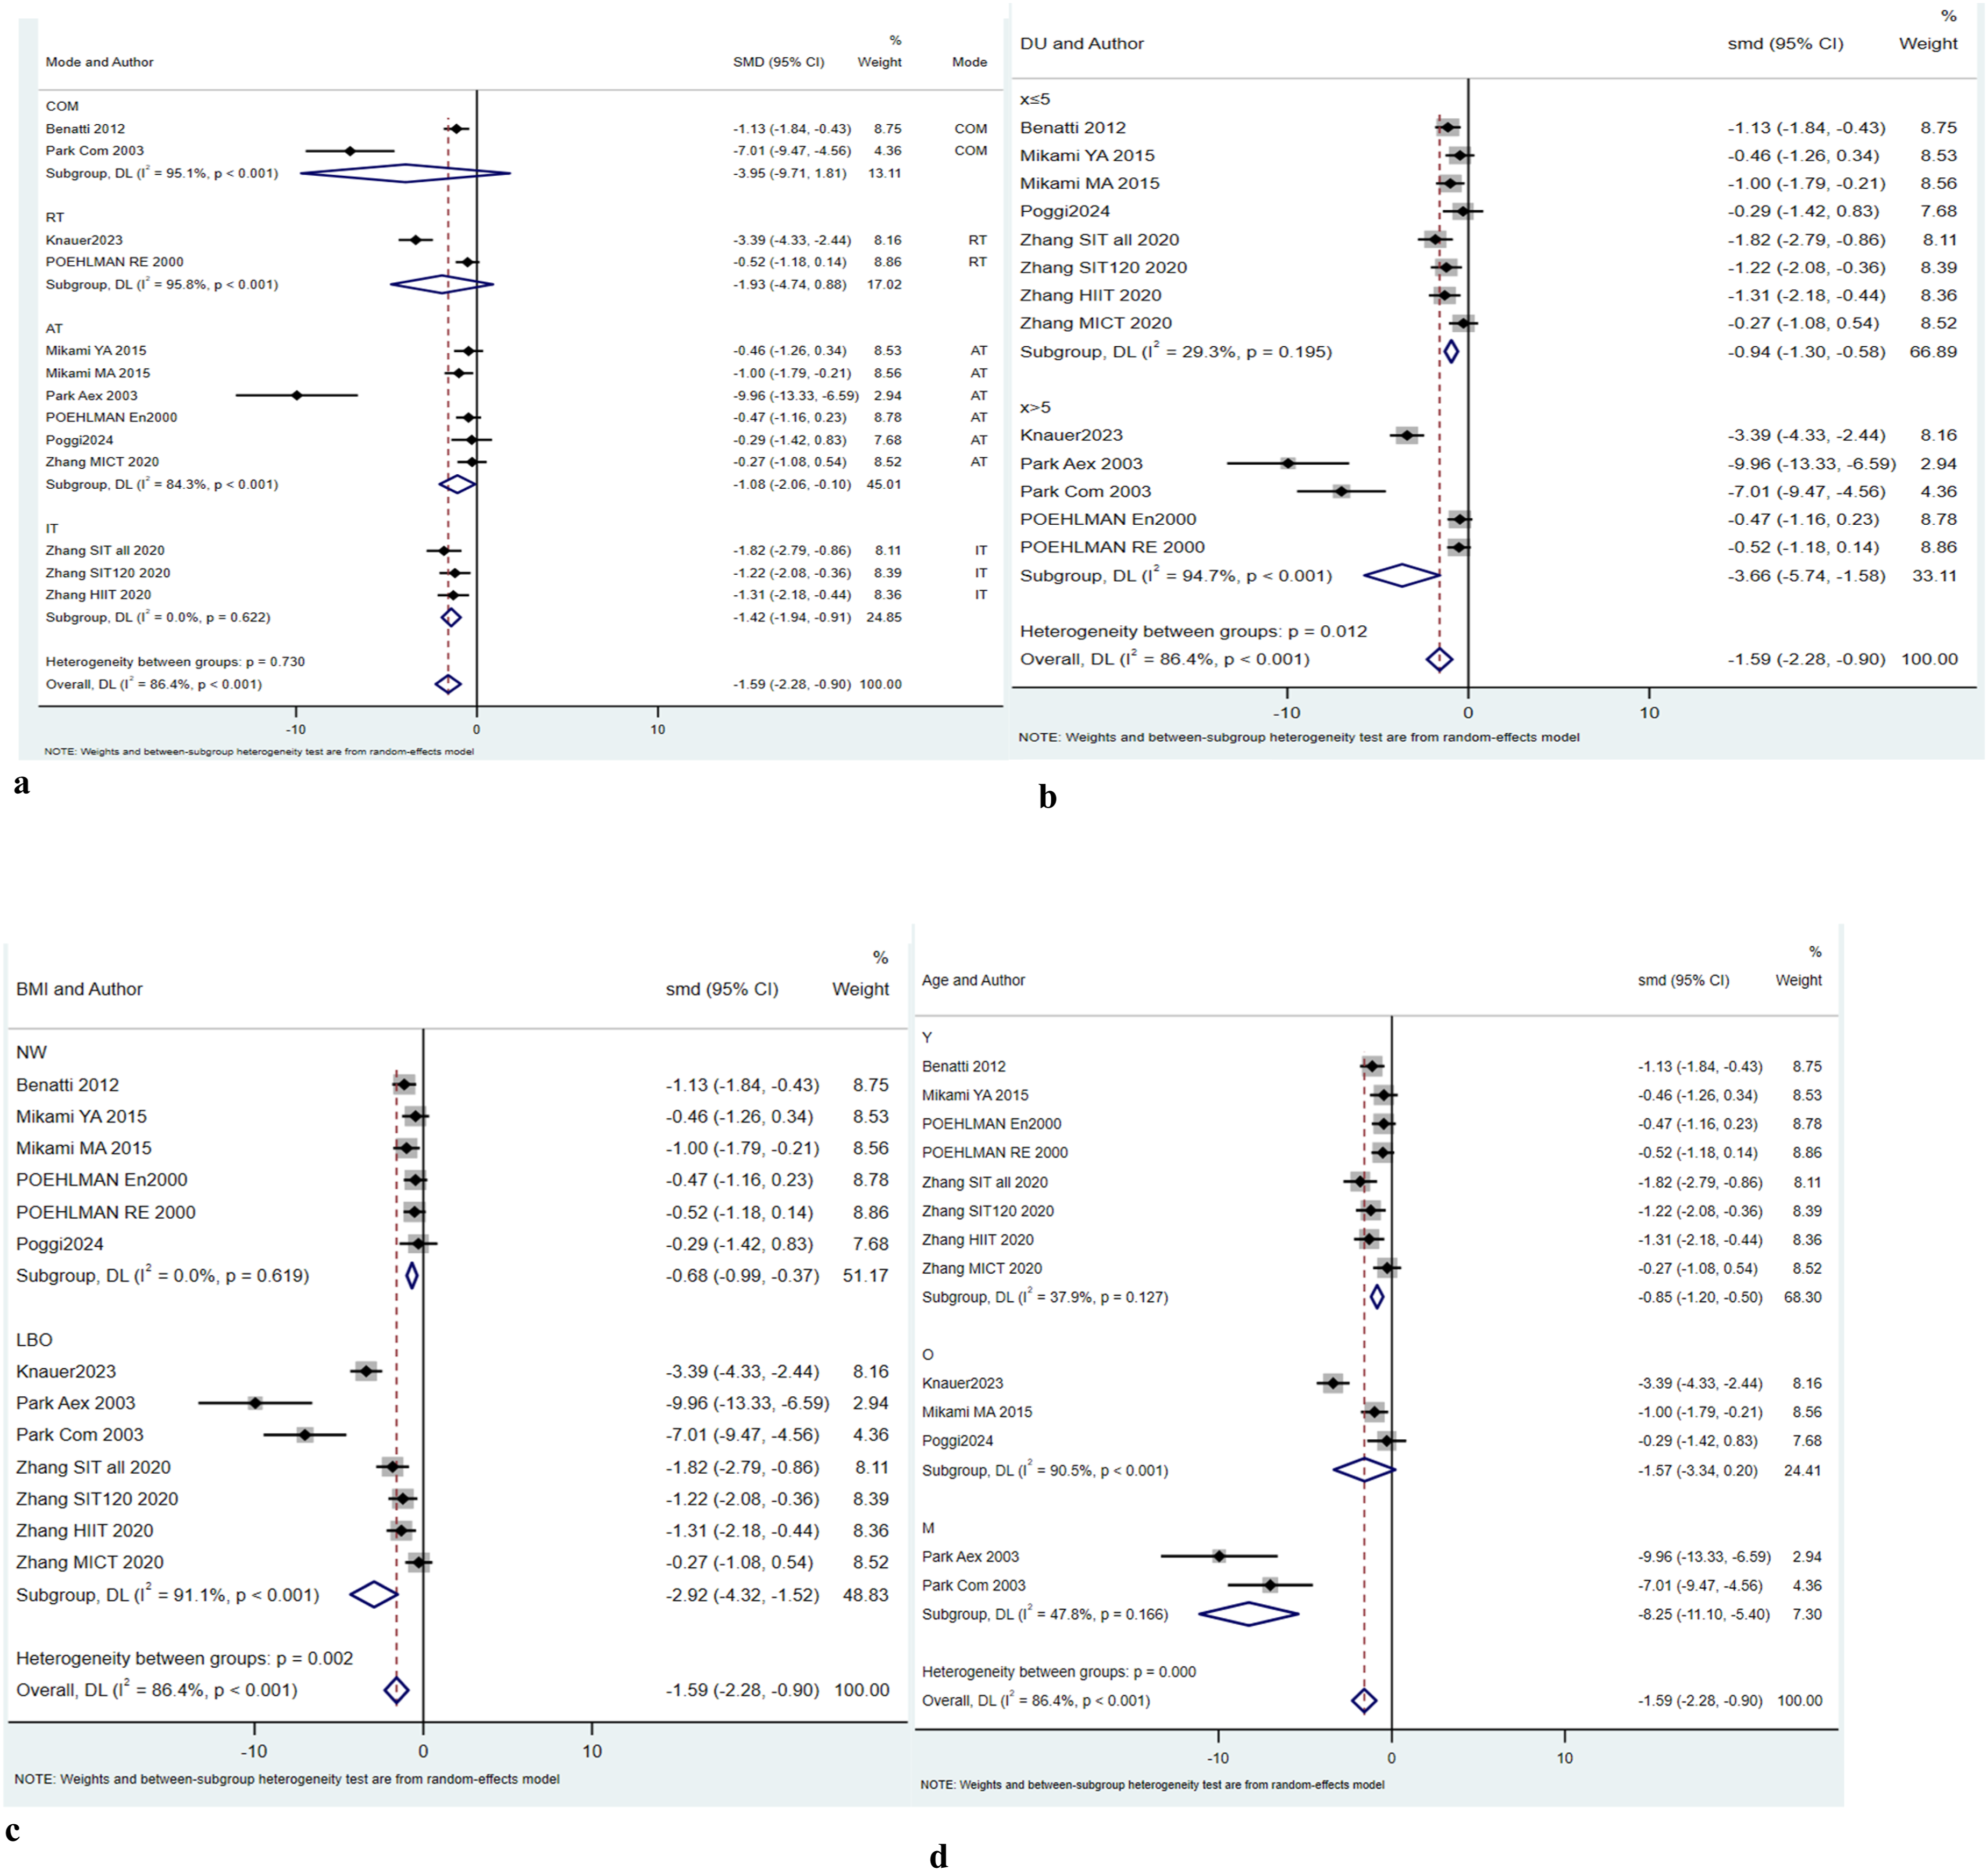
Duration
Between-Group Analysis
Subgroup analyses were conducted based on intervention duration (≤5 months vs. > 5 months). A statistically significant reduction in visceral adipose tissue was observed in both subgroups. Interventions with a duration of ≤5 months demonstrated a moderate effect size (SMD = −0.941, 95% CI: −1.298 to −0.583, p < 0.001), with relatively low heterogeneity (I2 = 29.3%). In contrast, interventions lasting >5 months showed a substantially larger pooled effect (SMD = −3.659, 95% CI: −5.740 to −1.578, p = 0.001), but with considerable heterogeneity (I2 = 94.7%). The test for subgroup differences was statistically significant (Q = 6.36, p = 0.012), indicating that intervention duration may act as a moderator of the effect of exercise on visceral adipose tissue (Figure 4(b)). The 5 months threshold was selected a priori as it corresponded to the median duration of the included interventions, providing a balanced basis for subgroup comparison.
BMI
Between-Group Analysis
Subgroup analyses were performed based on body mass index (BMI) categories, including normal weight (NW) and lower-bound overweight (LBO). A statistically significant reduction in visceral adipose tissue was observed in both subgroups. In the NW subgroup, the pooled effect size was SMD = −0.676 (95% CI: −0.987 to −0.365, p < 0.001), with no observed heterogeneity (I2 = 0.0%). In the LBO subgroup, the pooled effect size was SMD = −2.921 (95% CI: −4.319 to −1.523, p < 0.001), with substantial heterogeneity (I2 = 91.1%). The test for subgroup differences was statistically significant (Q = 9.44, p = 0.002), indicating a difference in effect sizes between BMI categories (Figure 4(c)).
Age
Between-Group Analysis
Subgroup analyses were conducted based on age categories (young [Y], older [O], and middle-aged [M]). A statistically significant reduction in visceral adipose tissue was observed in the Y subgroup (SMD = −0.849, 95% CI: −1.201 to −0.497, p < 0.001) and the M subgroup (SMD = −8.249, 95% CI: −11.097 to −5.402, p < 0.001). In contrast, the O subgroup did not reach statistical significance (SMD = −1.569, 95% CI: −3.342 to 0.203, p = 0.083). Moderate heterogeneity was observed in the Y subgroup (I2 = 37.9%) and the M subgroup (I2 = 47.8%), whereas substantial heterogeneity was present in the O subgroup (I2 = 90.5%). The test for subgroup differences was statistically significant (Q = 25.99, p < 0.001), indicating differences in effect sizes across age categories (Figure 4(d)).
Subgroup analyses were exploratory and should be interpreted with caution due to the limited number of studies within some subgroups.
Discussion
This systematic review and meta-analysis evaluated the effects of different exercise modalities on VAT in adults with predominantly normal BMI and those at the lower boundary of the overweight range (BMI ≤27 kg/m2), based on data from 10 studies encompassing 18 cohorts and 472 participants. It should be noted that the included studies did not consistently report VAT thresholds corresponding to established metabolic risk levels, and individual participant data were not available. Therefore, it was not possible to determine whether participants met specific criteria for VAT-defined metabolic risk. The findings should thus be interpreted as reflecting changes in VAT within generally normal or near-normal BMI populations, rather than effects in clinically defined high-risk groups.
The relevance of these findings is particularly evident for individuals exhibiting the TOFI phenotype, also referred to as normal-weight obesity, who present with relatively normal BMI yet disproportionately elevated VAT and heightened cardiometabolic risk (Zdrojewicz et al., 2017). In addition, individuals near the lower boundary of the overweight range may underestimate their health risk due to weight-status misperception, potentially delaying preventive behaviors (Robinson, 2017).
The inclusion of both controlled and single-arm studies introduced methodological heterogeneity. To address this, analyses were conducted separately for between-group (controlled studies) and within-group estimates. While this approach allows for a broader synthesis of the available evidence, within-group analyses are inherently more susceptible to bias due to the absence of a comparator and may overestimate intervention effects. In the present analysis, the direction of effect was generally consistent across study designs; however, the magnitude and statistical robustness differed, with within-group estimates showing greater uncertainty.
While most prior research on VAT reduction has focused on populations with overweight or obesity, our findings extend existing evidence by demonstrating that VAT remains responsive to exercise even in individuals without overt obesity. This observation is consistent with broader evidence linking physical activity to reductions in VAT and metabolic disease risk across BMI categories (Powell-Wiley et al., 2021).
The present meta-analysis indicates that exercise interventions are associated with reductions in VAT in adults with normal BMI and those at the lower boundary of the overweight range. The between-group analysis demonstrated a statistically significant effect favoring exercise; however, the magnitude of this effect should be interpreted with caution due to substantial heterogeneity and evidence of small-study effects. Sensitivity analyses confirmed that the direction of the effect remained consistent, although the pooled estimate was partially influenced by a small number of studies reporting comparatively large effects.
In contrast, the within-group analysis showed a similar direction of effect but did not reach statistical significance and was characterized by greater uncertainty. This discrepancy highlights the methodological limitations of uncontrolled designs, which are more susceptible to bias and may overestimate intervention effects. Accordingly, greater weight should be placed on the between-group findings derived from controlled comparisons.
Intervention duration appeared to play a role in observed outcomes. Although established guidelines suggest that health-related benefits of exercise may emerge after approximately three months (Pescatello et al., 2021), the present findings indicate that longer intervention periods may be required to elicit detectable changes in VAT in normal-weight populations. This observation contrasts with findings in populations with obesity (Merlotti et al., 2017), suggesting that VAT responsiveness to exercise may differ across BMI.
With respect to exercise modality, AT demonstrated the most consistent association with VAT reduction. This is in line with previous meta-analyses (Ismail et al., 2012; Verheggen et al., 2016), although some discrepancies exist, potentially due to differences in exercise dose, intensity, and adherence. IT was also associated with a statistically significant reduction in VAT in the present analysis. However, this finding was based on a limited number of studies, largely derived from a single research group, which may limit the generalizability of the result. These findings should be interpreted in the context of prior evidence. For example, Maillard et al. (Maillard et al., 2018) reported significant reductions in visceral fat following high-intensity IT in individuals with overweight or obesity. The partial inconsistency with the present findings may reflect differences in baseline body composition, suggesting that responsiveness to interval-based training may be attenuated in normal-weight populations. RT and COM training did not demonstrate statistically significant effects. Overall, differences across exercise modalities may reflect variability in exercise dose, intensity, adherence, and participant characteristics, as well as underlying physiological differences related to adiposity status.
Subgroup analyses further indicated variability across BMI and age categories, although these findings should be interpreted cautiously due to the limited number of studies within certain subgroups and the potential for residual confounding. The observed differences may reflect underlying heterogeneity in study design, intervention characteristics, or participant profiles rather than true effect modification.
Dietary intake represents an important potential confounder. Only a subset of included studies implemented controlled dietary protocols, while others allowed habitual intake or did not adequately report dietary adherence. Given the sensitivity of VAT to energy balance and macronutrient composition, the absence of standardized dietary control limits the ability to isolate the independent effects of exercise.
An additional consideration is the predominance of female participants across the included studies, which may influence the generalizability of the findings. Sex-related differences in fat distribution are well established, with men typically exhibiting greater VAT accumulation, whereas women tend to have higher subcutaneous fat storage. These differences are partly mediated by sex hormones, particularly estrogen, which is associated with a more favorable fat distribution profile (Karastergiou et al., 2012). Exercise-induced reductions in VAT may also differ by sex, potentially due to variations in lipolytic activity (Blaak, 2001), hormonal responses, and baseline adiposity patterns. Although some evidence suggests that both men and women benefit from exercise interventions (Hands et al., 2016), the magnitude and mechanisms of VAT reduction may not be identical. Given the limited representation of male participants in the included studies, the present findings may be more reflective of responses in women, and caution is warranted when extrapolating results to male populations. Future studies should aim to include more balanced samples or conduct sex-specific analyses to better understand potential differences in responsiveness.
Age-related differences in visceral adipose tissue should also be considered when interpreting the findings. VAT is known to increase with advancing age, even in the absence of substantial changes in body mass index, with distinct patterns observed between men and women. These changes are thought to reflect alterations in hormonal milieu, fat distribution, and metabolic regulation across the lifespan. Accordingly, variation in age across the included studies may have influenced baseline VAT levels and responsiveness to exercise interventions (Swainson et al., 2020).
Several limitations should be acknowledged. First, substantial heterogeneity was observed across analyses, likely reflecting variability in study design, populations, intervention characteristics, and measurement approaches. Second, Dietary intake represents a potential confounding factor. Only a subset of the included studies implemented structured dietary control, while others allowed habitual intake or did not report dietary adherence. Given the sensitivity of visceral adipose tissue to energy balance and macronutrient composition, the absence of standardized dietary control across studies may have influenced the observed effects. Third, eligibility was determined at the study level based on reported mean BMI values, as individual participant data were not available, which may have resulted in the inclusion of participants outside the intended BMI range. Fourth, some standard deviations of change were estimated using assumed correlations, which introduces additional uncertainty. Fifth, the relatively small number of studies and the presence of small-study effects suggest that the magnitude of the pooled effect may be overestimated. Finally, although different imaging modalities (CT, MRI, DXA) were used to assess VAT, the application of standardized mean differences mitigates concerns related to scale heterogeneity but does not eliminate potential measurement variability.
Overall, while the findings support an association between exercise and reductions in visceral adipose tissue in individuals with normal or near-normal BMI, the certainty of evidence remains low. Further well-designed randomized controlled trials with standardized protocols, adequate sample sizes, and controlled dietary conditions are required to confirm these findings and clarify the relative effects of different exercise modalities and intervention durations.
Conclusions
This meta-analysis indicates that exercise is associated with reductions in VAT in adults with normal BMI and those at the lower boundary of the overweight range. Among exercise modalities, AT demonstrated the most consistent effects, while IT also showed significant reductions, albeit based on a limited number of studies. Although the pooled findings were statistically significant and directionally consistent, substantial heterogeneity and methodological limitations, including variability in study design and the inclusion of within-group analyses, may influence the magnitude of the observed effects. Accordingly, the overall estimate should be interpreted with caution, and greater weight should be placed on evidence derived from controlled comparisons. The certainty of evidence was rated as low due to risks of bias, imprecision, and potential small-study effects.
From a practical perspective, AT may represent a valuable and potentially underutilized strategy for managing visceral adiposity in individuals who may otherwise be overlooked due to normal body weight. However, further well-designed randomized controlled trials with larger sample sizes, standardized protocols, and appropriate dietary control are required to confirm these findings and to better define the roles of RT, COM, and IT modalities, as well as the interaction between exercise and dietary factors in optimizing VAT reduction.
Supplemental Material
Supplemental Material - Impact of Different Exercise Modalities on Visceral Adipose Tissue in Normal Weight and Low-Overweight Individuals: A Systematic Review and Meta-Analysis
Supplemental Material for Impact of Different Exercise Modalities on Visceral Adipose Tissue in Normal Weight and Low-Overweight Individuals: A Systematic Review and Meta-Analysis by Hamid Arazi, PhD, Fatemeh Bagherpour, Grant M. Tinsley in Biological Research For Nursing.
Footnotes
Author Contributions
Arazi, H contributed to conception and design; contributed to acquisition, analysis, and interpretation; drafted manuscript; critically revised manuscript; gave final approval; and agrees to be accountable for all aspects of work ensuring integrity and accuracy. Bagherpour, F contributed to conception; contributed to acquisition, analysis, and interpretation; drafted manuscript; gave final approval; and agrees to be accountable for all aspects of work ensuring integrity and accuracy. Tinsley, G.M contributed to conception; contributed to analysis and interpretation; critically revised manuscript; gave final approval; and agrees to be accountable for all aspects of work ensuring integrity and accuracy.
Funding
The authors disclosed that this research was conducted independently of external funding.
Declaration of Conflicting Interests
The authors declared no potential conflicts of interest with respect to the research, authorship, and/or publication of this article.
Data Availability Statement
Further data supporting the findings of this study are available from the corresponding author upon reasonable request.
Supplemental Material
Supplemental material for this article is available online. Supplementary material including searched keywords at the different databases is appended to the manuscript and can be accessed.
References
Supplementary Material
Please find the following supplemental material available below.
For Open Access articles published under a Creative Commons License, all supplemental material carries the same license as the article it is associated with.
For non-Open Access articles published, all supplemental material carries a non-exclusive license, and permission requests for re-use of supplemental material or any part of supplemental material shall be sent directly to the copyright owner as specified in the copyright notice associated with the article.