
Abstract
Purpose:
To describe abnormal dark (hyposignal) and white (hypersignal) lesions observed on optical coherence tomography angiography in central serous chorioretinopathy.
Methods:
Prospective, multicenter, and descriptive study including patients with active or quiescent central serous chorioretinopathy. All patients had undergone a complete ophthalmic examination.
Results:
Abnormal dark lesions were detected as “dark spots” and “dark areas” on optical coherence tomography angiography. A “dark spot” could correspond to six different abnormalities: pigment epithelium detachment, subretinal deposit, “Lucency” within surrounding subretinal fibrin, choroidal cavitation, choroidal excavation, and choroidal fluid. A “dark area” could be related to a serous retinal detachment or choriocapillary compression. Abnormal white lesions were also detected: A “white spot” could correspond with the leaking point on fluorescein angiography or with hyper-reflective dots; A “white filamentous pattern” at the Brüch’s membrane level corresponded to abnormal choroidal neovascular vessels.
Conclusion:
A semiology is described using optical coherence tomography angiography in central serous chorioretinopathy as abnormal dark and white lesions. Multimodal imaging is mandatory in addition to optical coherence tomography angiography to diagnose non-neovascular retinal and choroidal central serous chorioretinopathy lesions. However, optical coherence tomography angiography alone is helpful in detecting choroidal neovascular membrane in central serous chorioretinopathy.
Keywords
Introduction
Central serous chorioretinopathy (CSC) is an idiopathic ocular disease characterized by serous detachments of the neurosensory retina and/or the retinal pigment epithelium (RPE) in or around the macular area, associated with an increase in choroidal permeability and thickness.1–3 The choroid, mainly involved in CSC, was until now a poorly imaged tissue in vivo. Recently, however, optical coherence tomography (OCT) technologies such as enhanced-depth imaging (EDI) OCT and swept source OCT have greatly improved the visualization of choroidal vessels and choroidal thickness measurements.4–7 Also, “En face” OCT or OCT C provides additional frontal information of retinal and choroidal changes, 8 while multimodal imaging has highlighted the role of “pachychoroid pigment epitheliopathy” in CSC pathogenesis. 9
Non-neovascular choroidal lesions (choroidal cavitation, excavation, 10 and fluid 11 ) have also been observed in CSC patients. A severe clinical form called “fibrinous or bullous CSC” has been recently described. 12 CSC could be associated with a defect in a pigment epithelium detachment, subretinal exudates, and a hyporeflective cavity within surrounding subretinal fibrin called “Lucency” which corresponds to the active leaking point observed on fluorescein angiography (FA). 13 Choroidal neovascular membrane type 1 is frequently associated with CSC, but the diagnosis may be difficult because of confounding signs between these two entities.14–18 Recently, OCT angiography (OCT A) has enabled non-invasive en face high-resolution vascular imaging of the ocular fundus.19,20 The terms “dark area” and “dark spot” have been described in previous studies.21,22 However, the real significance of these newly described lesions remains poorly understood.
The aim of this study was to describe and understand abnormal dark and white lesions observed on OCT A in patients with active or quiescent CSC. OCT A lesions were correlated with other multimodal imaging modalities in order to localize the lesions with respect to the layers of the retina and the choroid and to determine their significance in relation to the pathological environment.
Methods
In this prospective and descriptive study, patients with CSC were investigated from January 2016 to February 2017. It was a multicenter study including patients from three French Ophthalmological Centers: the Pôle Vision ophthalmological center in Lyon, the Maison Rouge ophthalmological center in Strasbourg, and the Rothschild Ophthalmologic Foundation in Paris, France. The study protocol, which followed the tenets of the Declaration of Helsinki, was approved by the Medical Ethics Committee of the Rothschild Ophthalmologic Foundation, Paris, France; written informed consent was obtained from all the study participants.
All study patients had undergone a detailed ophthalmological examination including best-corrected visual acuity (BCVA; Early Treatment Diabetic Retinopathy Study (ETDRS) scale at 4 m), indirect slit-lamp biomicroscopy, fundus photography, and fluorescein and indocyanine green angiographies (FA and ICGA). FA and indocyanine green angiography (ICGA) were performed using a confocal laser scanning system (Spectralis; Heidelberg Engineering, Heidelberg, Germany). OCT with conventional and EDI OCT B-scans, C-scan, and OCT angiography were performed using two different instruments (Spectralis OCT 2; Heidelberg Engineering, Heidelberg, Germany, in predefinitive software version β 1.9.204.0 and the DRI OCT Triton, Topcon, Japan, in software version β 1.18). Patients were examined with at least one of these two instruments. The OCT A software of both instruments enabled the manual adjustment of automated segmentation and its relative depth in the retina and choroid in order to compare them. OCT A images were analyzed at different depth intervals: manually segmented outer retina in order to detect blood flow around the RPE-Bruch membrane-choriocapillaris complex and manually adjusted segmentation of the choriocapillaris and choroid in order to detect blood flow in the choriocapillaris and the inner choroid.
Abnormal signals were observed on OCT A and analyzed at these different manual adjustments of automated segmentation: abnormal hyposignals were called as dark lesions and abnormal hypersignals were called as white lesions. On OCT A, a “dark area” corresponded to abnormal diffuse, multifocal, ill-defined, and hyposignal areas at the choriocapillaris level. The “dark spot” corresponded to abnormal black, single or multiple, and well-delineated hyposignal areas at the level of the outer retina, the choriocapillaris, and the inner choroid. At the choriocapillaris level, “dark spots” could be associated with “dark areas.” On OCT A, a “white spot” corresponded to abnormal focal or multifocal, single or multiple, tiny, round, punctuate, and hypersignal dots at the level of the outer retina, the choriocapillaris, and the inner choroid. A “white filamentous pattern” corresponded to an abnormal distinct, well-delineated hypersignal pattern at the level of the Brüch’s membrane and the choriocapillaris.
The obtained OCT A images were compared and matched with the corresponding OCT B, OCT C, and the other multimodal images of each patient. The aim of this comparison was to locate and understand the observed dark and white OCT A lesions. Both active and quiescent CSC patients, as well patients previously treated or treatment-naive, were included in this study. If both eyes were affected by CSC, the more severe eye was included in the study. Active CSC was defined as the presence of serous retinal detachment (SRD) and/or pigment epithelium detachment (PED) in the macular area secondary to one or several leaking points observed on FA. SRD could be associated with areas of RPE atrophy and pigment mottling. Quiescent CSC was defined as a physiological or slightly atrophic macula, without an SRD or leaking point on FA, in patients whose medical records indicated a previous history of CSC. Eyes with other macular abnormalities such as neovascular maculopathy (idiopathic choroidal neovascularization, age-related macular degeneration, or other secondary choroidal neovascularization), intraocular inflammation, and refractive errors greater than ±6 D were excluded.
This study used descriptive statistics (Microsoft Office Excel software; version 14.0, 2010; Microsoft Corp., Redmond, WA, USA) for the description of demographic and clinical data, as well as qualitative interpretations of the OCT A and multimodal imaging features.
Results
A total of 51 eyes of 51 CSC patients (39 males and 12 females) were included in this study. The mean age was 51 (range = 26–72) years. Mean BCVA was 75 (range = 33–89) letters using the ETDRS scale. A total of 14 patients (27.4%) had bilateral disease, while 37 patients (72.5%) had unilateral CSC. In all, 10 eyes (19.6%) had quiescent CSC, while 41 eyes (80.4%) had active disease. The mean choroidal thickness was 369 μm in the central point of the macular area. A total of 25 patients (49%) were treatment-naïve, while 26 patients (51%) had already been treated: 11 with verteporfin photodynamic therapy (PDT), 13 with intravitreal injection of anti-VEGF (3 patients had been treated by combined therapy with PDT and anti-VEGF), and 5 with oral medical treatment (spironolactone). Table 1 shows the demographic and clinical features of the study patients.
Patients’ demographical and clinical features.
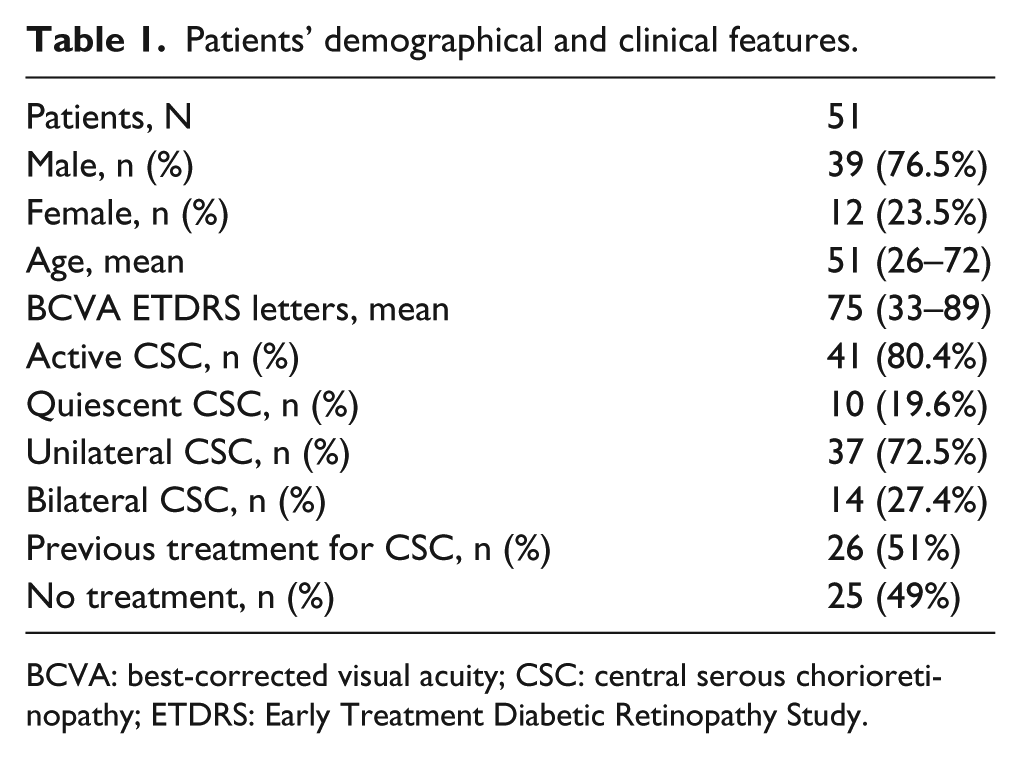
BCVA: best-corrected visual acuity; CSC: central serous chorioretinopathy; ETDRS: Early Treatment Diabetic Retinopathy Study.
OCT: OCT angiography observations
Retinal changes
OCT A images of manual adjustment of automated segmentation at the level of the outer retinal were obtained for all patients with at least one or both instruments. At this level, OCT A detected the presence of abnormal dark lesions as “dark spots” in 3 eyes (5.9%) and abnormal white lesions as “white spots” in 6 eyes (11.8%).
Choroidal changes
OCT A images of manual adjustment of automated segmentation at the level of the choriocapillaris and the inner choroid were obtained for all patients with at least one or both instruments. It revealed abnormal dark lesions as “dark areas” in 38 eyes (75%), “dark spots” in 27 eyes (52.9%), and abnormal white lesions as “white spots” in 12 eyes (23.5%) and “white filamentous patterns” in 12 eyes (23.5%).
The results of the multimodal correlation between dark and white lesions on OCT A are shown in the Table 2. There was good agreement between the “dark area” and the presence of SRD in 32 eyes (84%). However, in 7 eyes (18%), a “dark area” could also correspond to an area of choriocapillaris compression above the dilated choroidal vessels. One patient presented both SRD and choriocapillaris compression corresponding to a “dark area” in the same eye. On OCT A, a “dark spot” could correspond to several types of lesions: PED in 22 eyes (81.5%), subretinal deposit in 6 eyes (22.2%), choroidal cavitation in 5 eyes (18.5%), choroidal excavation in 1 eye (0.4%; Figure 1), and “Lucency” (corresponding to an hyporeflective cavity within surrounding subretinal fibrin 13 ) in 3 eyes (0.1%; Figures 2 and 3) and choroidal fluid in 2 eyes (0.7%; Figure 4). Several different lesions could correspond with a “dark spot” on OCT A in the same eye of the same patient (Figure 1). A “white spot” was found in 12 eyes (23.5%) and associated with hyper-reflective dots on OCT B and OCT C in 6 eyes (50%) or with fluorescein angiographic leaking points (Figure 5) in 6 eyes (50%). A “white filamentous pattern” was found in 12 eyes (23.5%) and always corresponded to abnormal choroidal vessels (Figure 6).
Meaning of dark and white lesions on OCT angiography at choroidal level and multimodal imaging.
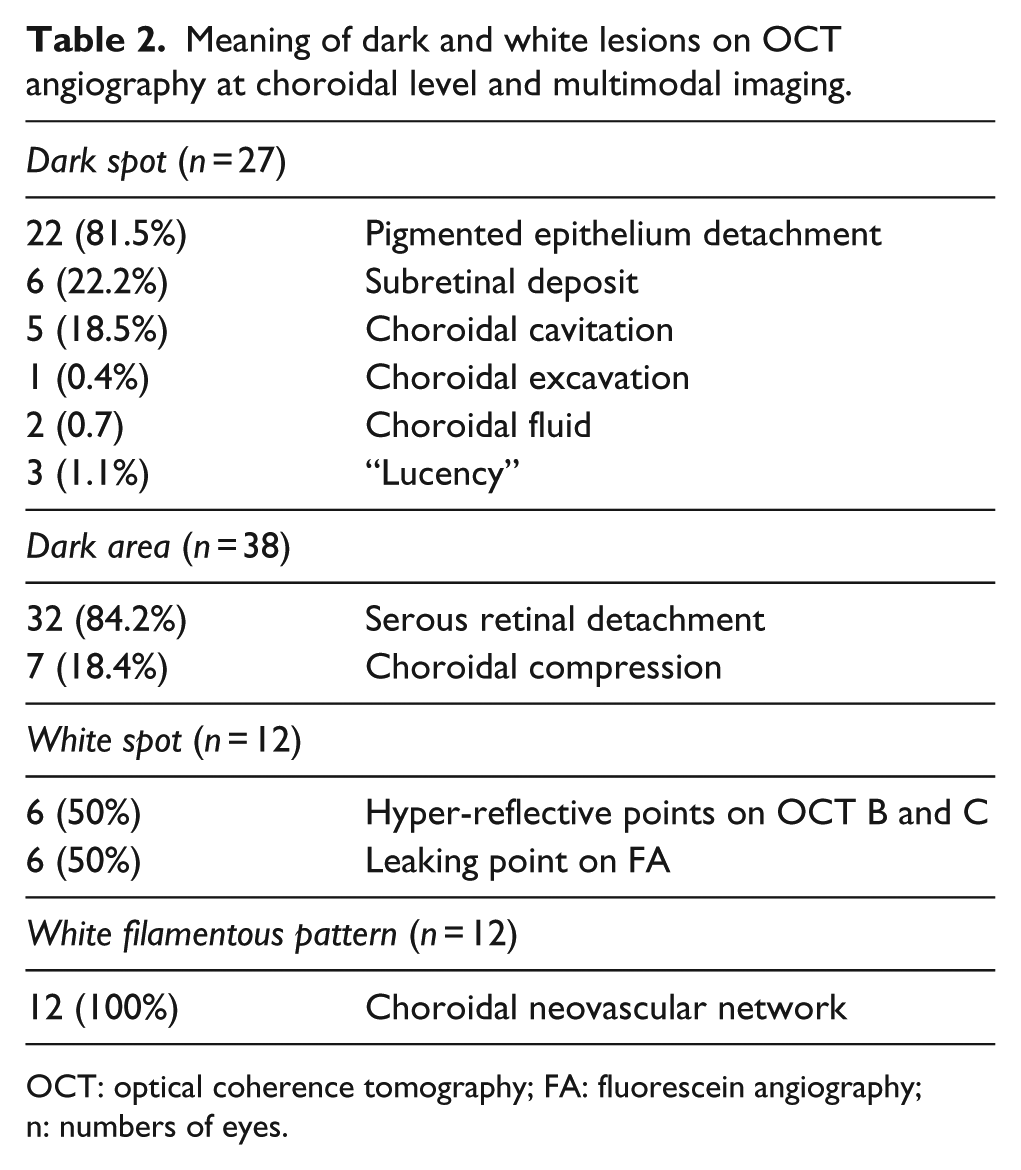
OCT: optical coherence tomography; FA: fluorescein angiography; n: numbers of eyes.
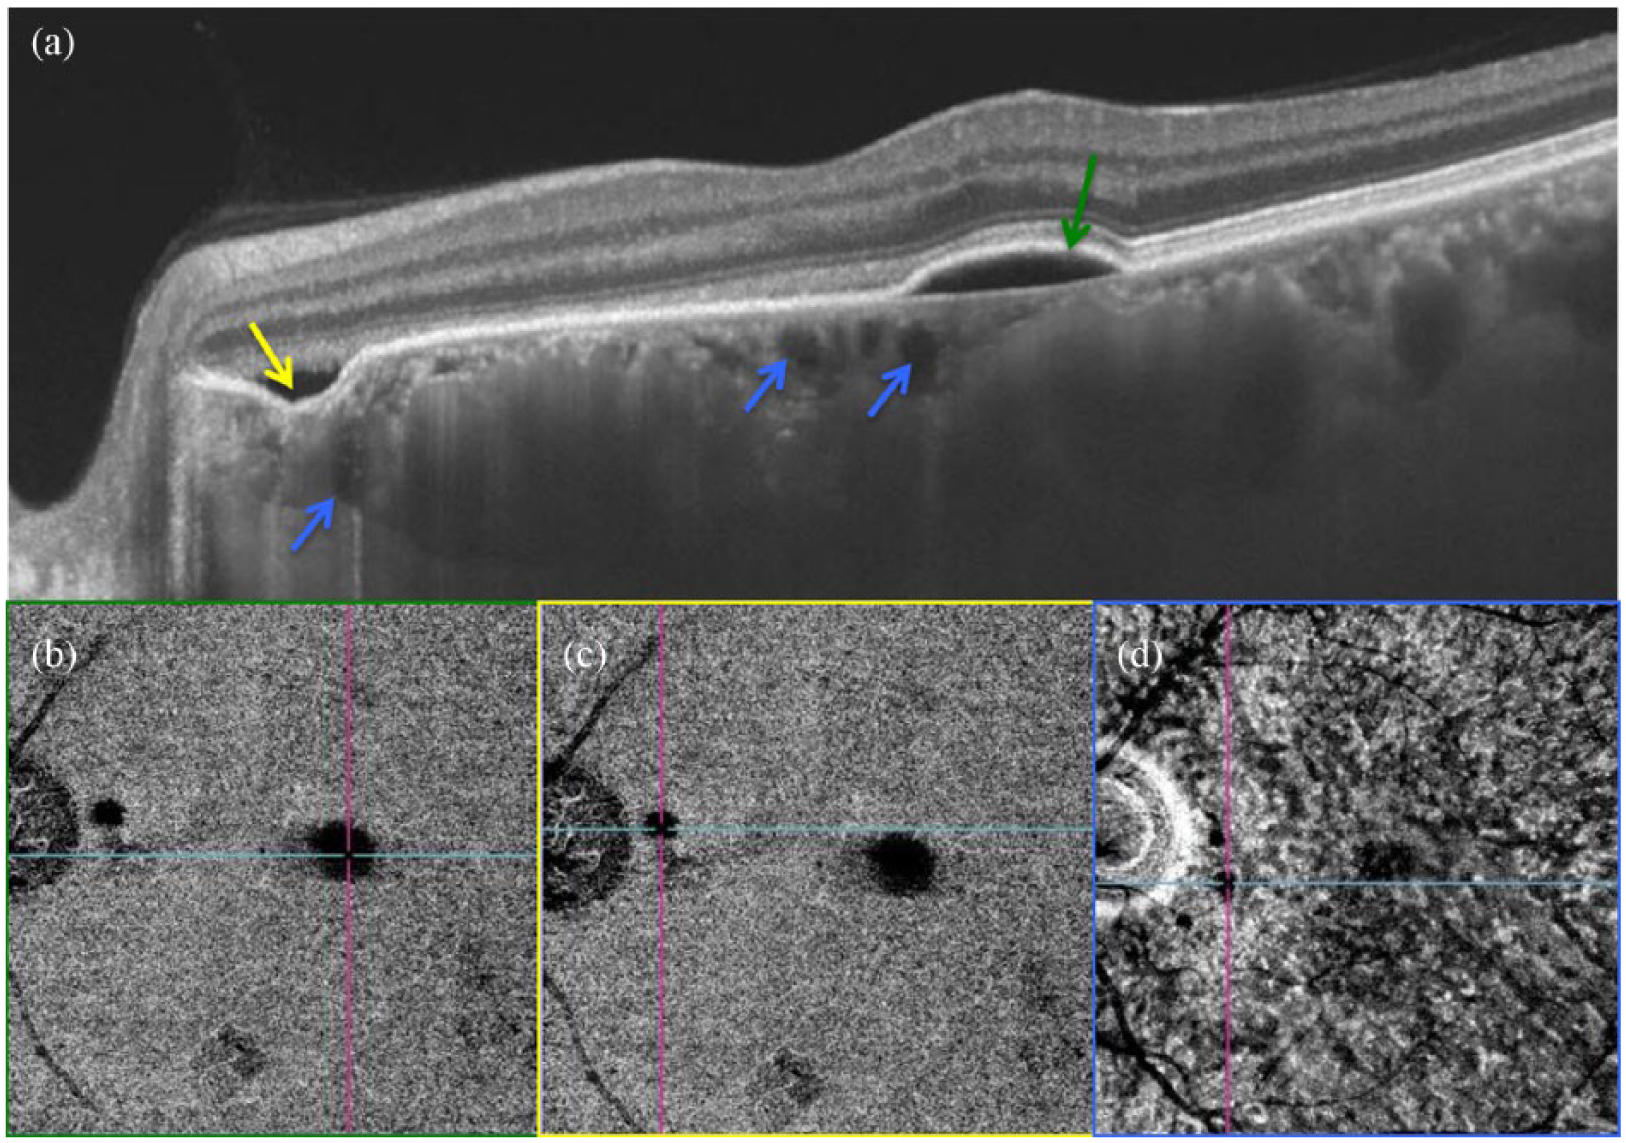
“Dark spot.” (a) Swept source OCT B of the left eye of a CSC patient with thickened choroid, subfoveolar PED (green arrow), peripapillary choroidal excavation (yellow arrow), and several choroidal cavitations in the choriocapillaris and inner choroid layers (blue arrows). (b) Swept source OCT A and decorrelation OCT B at the choriocapillaris level with the dark spot (located by the cross section of the blue and pink lines) corresponding to the PED. (c) Swept source OCT A and decorrelation OCT B at the choriocapillaris level with the dark spot (located by the cross section of the blue and pink lines) corresponding to the peripapillary choroidal excavation. (d) Swept source OCT A and decorrelation OCT B at the inner choroidal level with one of the peripapillary dark spots (located by the cross section of the blue and pink lines) corresponding to a choroidal cavitation.
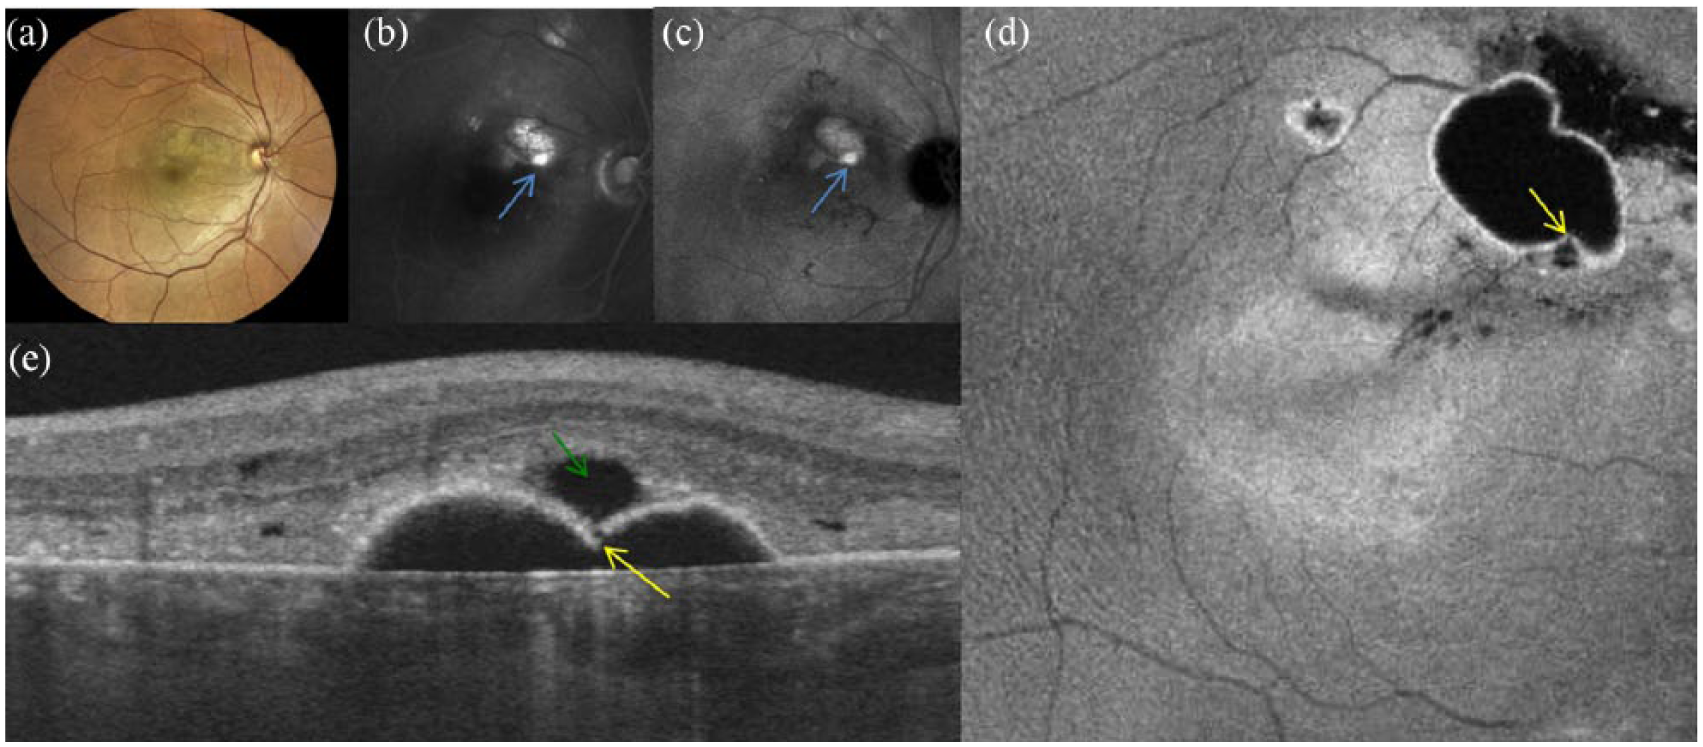
“Fibrinous or bullous” form of CSC with a “Lucency.” (a) Confocal white-light retinophotography of the right eye with serous retinal detachment and fibrinous deposit in the macular area. (b) and (c) Fluorescein and indocyanine angiographies showing the hyperfluorescent leaking point (blue arrows). (d) Swept source OCT C showing the defect in the large pigment epithelium detachment (yellow arrow) and the round hyporeflective “Lucency” within the surrounding subretinal fibrin. (e) Swept source OCT B showing the defect in the pigment epithelium detachment (yellow arrow), subretinal hyper-reflective fibrin, and the hyporeflective cavity called “Lucency” (green arrow).
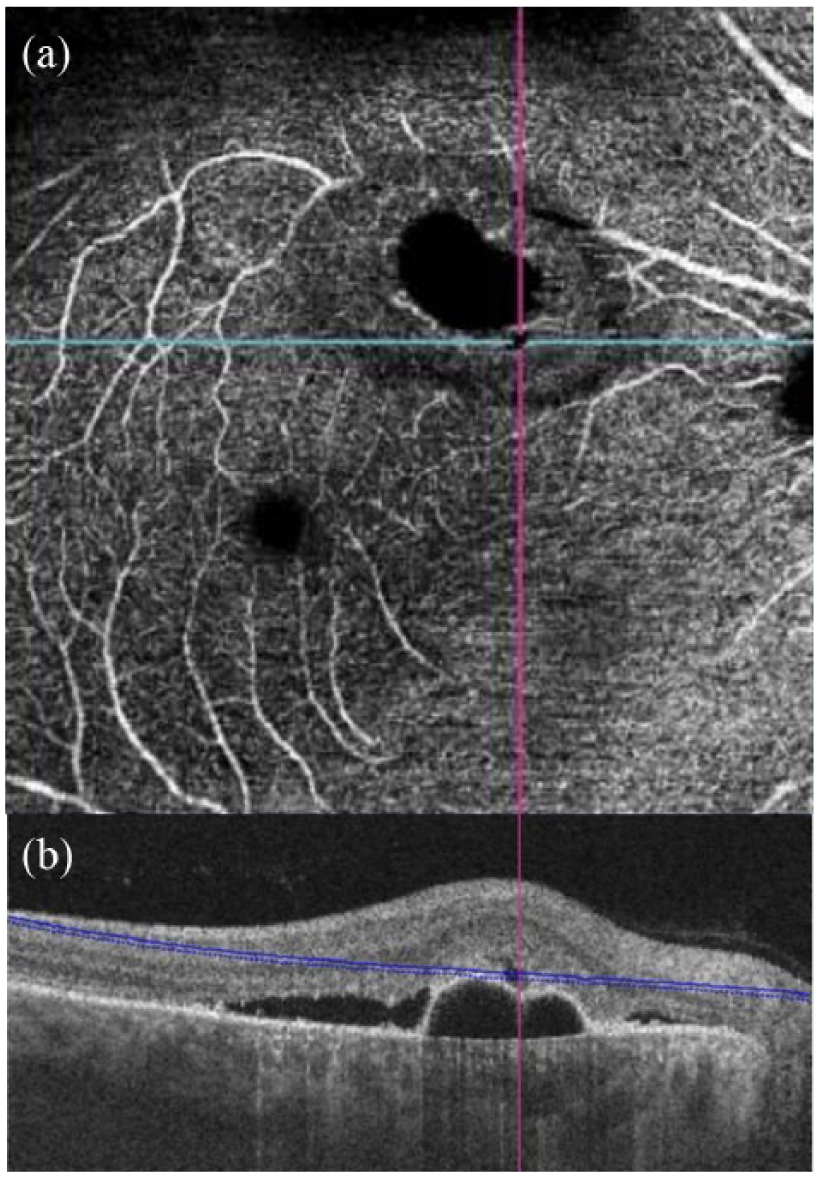
“Dark spot” of the “Lucency.” (a) Swept source OCT A at the outer retinal layer level with a transverse slab, showing the “dark spot” as a round hyposignal (located at the cross section of the blue and pink lines) corresponding to the “Lucency.” (b) Swept source OCT B corresponding to the OCT A, showing the hyporeflective cavity of the “Lucency” (cross section of the blue and pink lines) in the subretinal hyper-reflective fibrin and above the defect in the pigment epithelium detachment.
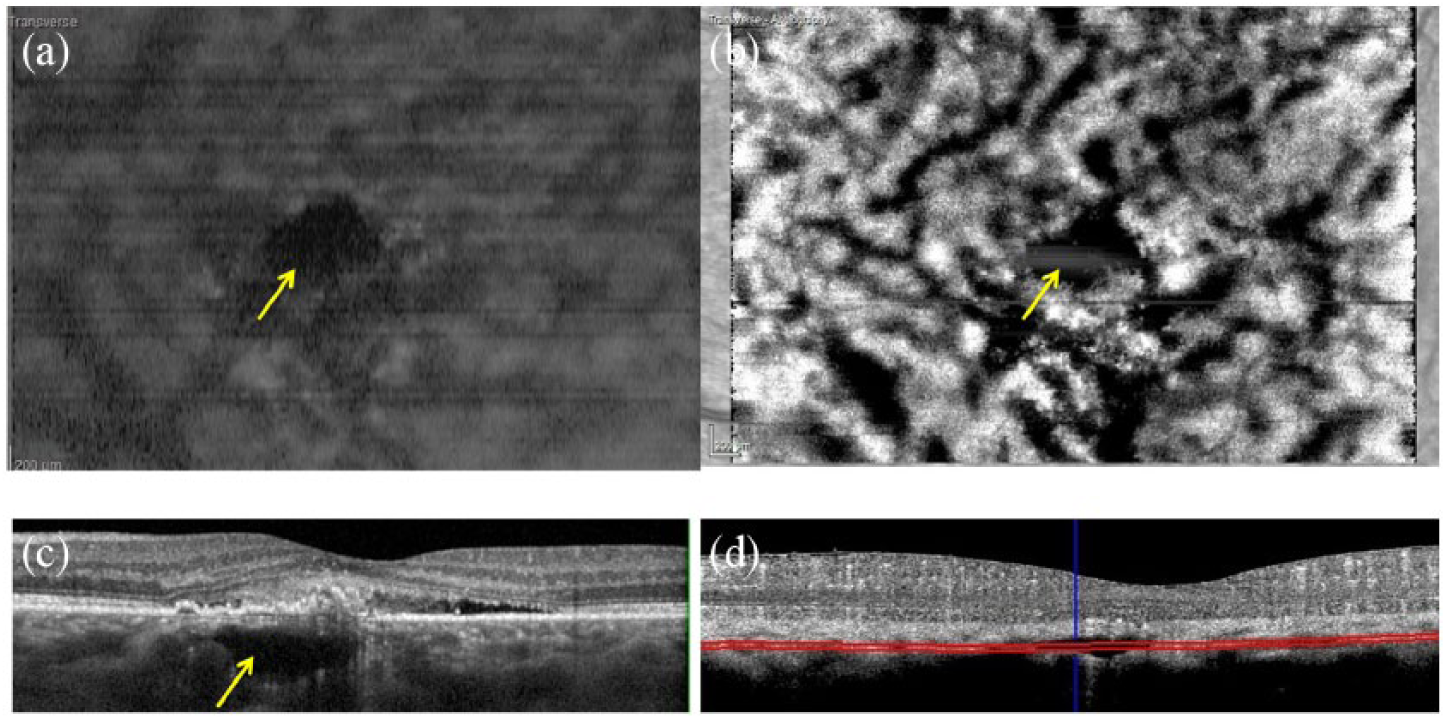
“Dark spot” associated with fluid in the choriocapillaris and the choroid. (a) EDI SD-OCT C at the choriocapillaris level with transverse slab, showing a large hyporeflective cavity (yellow arrows). (b) OCT A showing the “dark spot” (yellow arrows) at the choriocapillaris level with a transverse slab. (c) EDI SD-OCT B showing an active CSC with serous retinal detachment and a large hyporeflective cavity in the choriocapillaris and the inner choroid and outside the choroidal vessels. (d) Decorrelation OCT B corresponding to OCT A showing the location of the transverse slab.
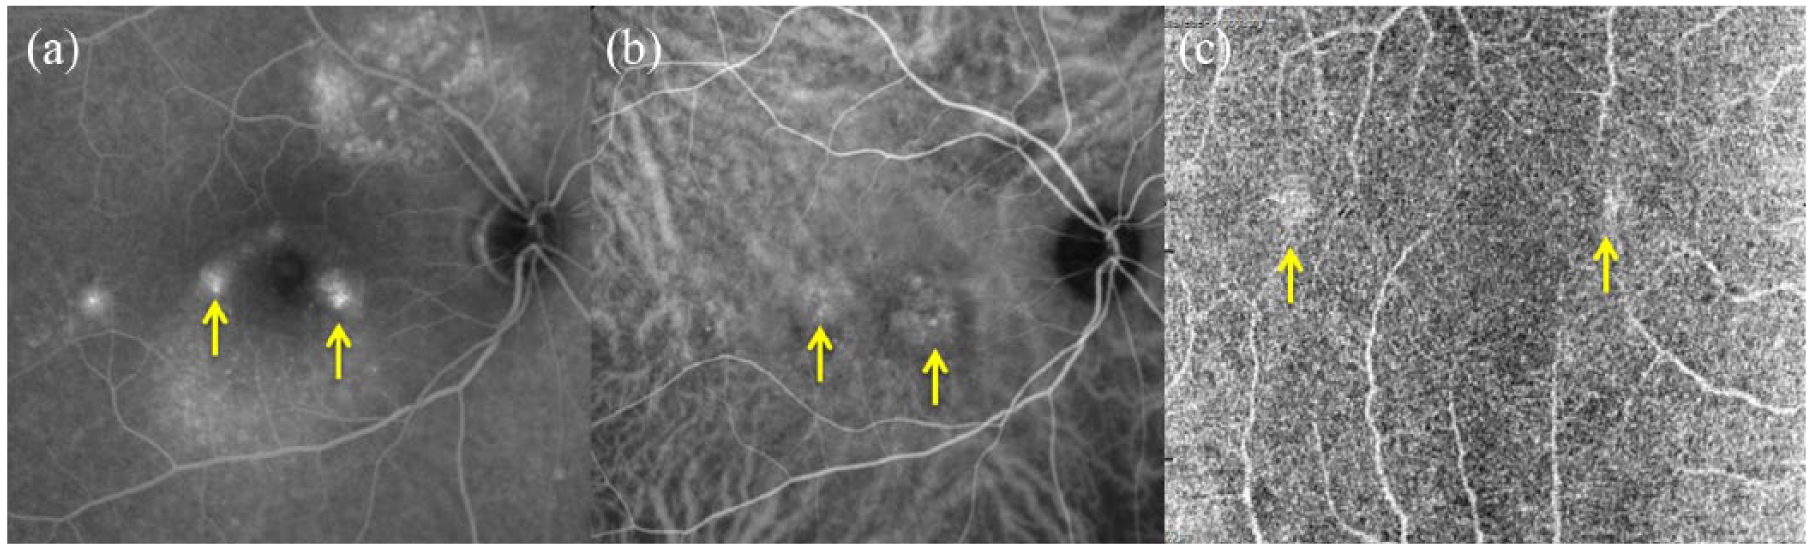
“White spot” corresponding to a leaking point. (a and b) Fluorescein and indocyanine angiographies showing the hyperfluorescent leaking points (yellow arrows). (c) OCT A at the choriocapillaris level with two “white spots” seen as two hypersignal areas (yellow arrows) that correspond to the leaking points of A and B.
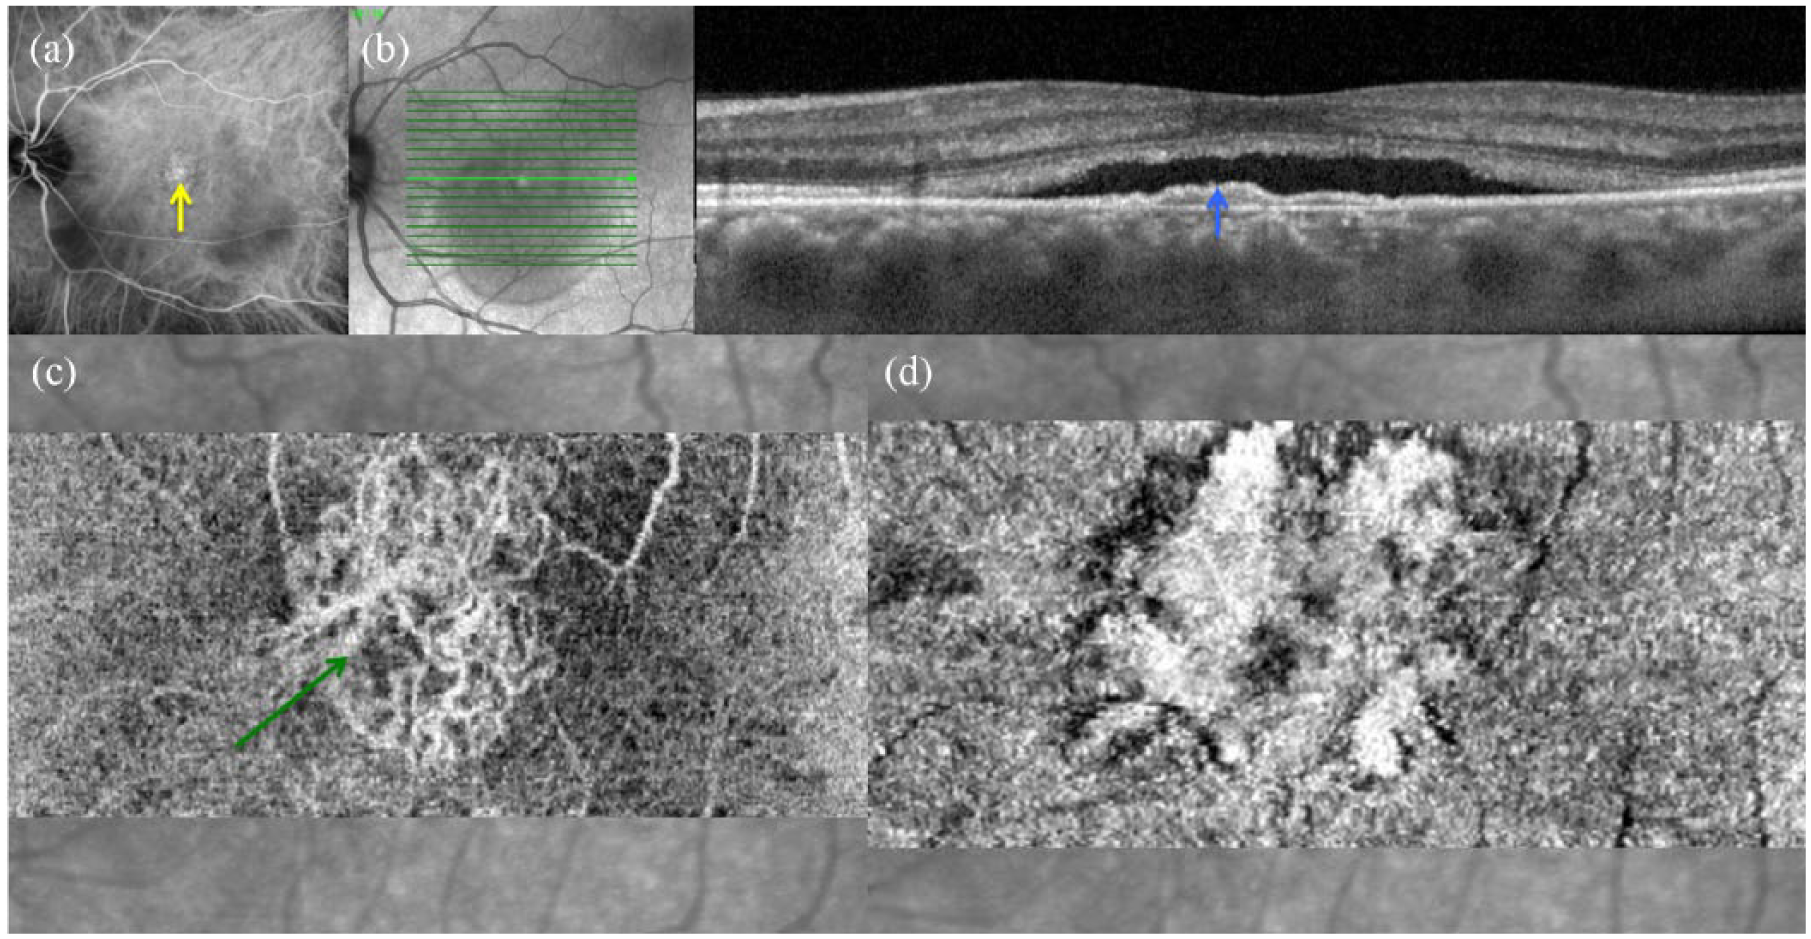
Neovascular CSC with “white filamentous pattern.” (a) Indocyanine angiography showing an hyperfluorescent membrane in the macular area (yellow arrow). (b) EDI SD-OCT B showing a subfoveal serous retinal detachment with a flat and irregular pigment epithelium detachment (blue arrow); (c) OCT A at the choriocapillaris level with hypersignal as a “white filamentous pattern” (green arrow) corresponding to the abnormal neovascular choroidal membrane. (d) SD-OCT C at the choriocapillaris level showing a non-linear pigment epithelium detachment with hyper-reflective heterogeneous content.
Discussion
OCT angiography is a non-invasive technique for detecting a decorrelation signal. A new semiology has recently been described using OCT A in CSC patients: Costanzo et al. 21 showed “dark areas” and “dark spots” as common features visualized at the choriocapillaris level. At this level, they found good agreement between a “dark area” and the presence of SRD as well as between a “dark spot” and the presence of PED. Consistent with their study, we also found that the multifocal hyposignal observed in “dark areas” could be associated with abnormal flow in the choriocapillaris. Above the dilated choroidal vessels, the choriocapillaris is thinner than in adjacent areas and can be compressed by the enlarged choroidal vessels in CSC. PEDs are also usually found above the site of the dilated vessels possibly indicating mechanical stress on the RPE caused by underlying compression. 21 However, in our study, a “dark spot” on OCT A was not pathognomonic of PED; it could correspond with six different entities such as PED, subretinal deposit, choroidal cavitation, choroidal excavation, choroidal fluid, and “Lucency.”
Choroidal cavitations are well defined on OCT B and OCT C images as multiple, black, hyporeflective, and cystic lesions located beneath the choriocapillary layer. 8 These cavitations may correspond to focal ischemic choroidal areas observed as a “dark spot” on OCT A. Focal choroidal excavations visualized in pachychoroid spectrum entities such as CSC are still poorly understood physiopathologically. 9 These excavations, as well as a “dark spot,” could be observed on OCT A.
CSC with hyper-reflective subretinal fibrin has been described, thanks to OCT B and OCT C. 13 In this form of CSC, a hyporeflective cavity within the surrounding subretinal fibrin called “Lucency” was found to correspond with the active leakage point observed on FA. The “Lucency” could be visualized as communicating with a PED defect. The hypermeability of the choroidal veins probably increase the choroidal hydrostatic pressure resulting in the development of a PED in which a defect could appear. It remains unclear whether such a defect is the way for the fluid to gain access to the subretinal space. 21 OCT C imaging of the “Lucency” corresponded with the leaking point and revealed a smoke-stack appearance on FA. The hyposignal as a “dark spot” of this “Lucency” on OCT A might be explained by very low flow at the level of the leakage in CSC.
Recently, Spaide and Ryan 11 described posterior “loculation of fluid” into the choroid as a common finding in the thickened choroid of CSC patients. On OCT A, this fluid appeared as a “dark spot” with a hyposignal area located outside of the choroidal vessels. OCT A appeared to be insufficient to help recognize what the “dark spot” could correspond to. However, the correspondence between OCT A and the other multimodal images enabled us to locate and understand these non-neovascular lesions in CSC patients. Spaide et al. 19 described OCT A artifacts and explained that overlying pathology such as pigment epithelial detachments can attenuate the OCT A signal making regions of the choriocapillaris appear absent even though flow is likely to be present. A “dark spot” was such an artifact when it corresponded with a PED or subretinal deposit (Figure 1(b)). Similarly, in a “dark spot” corresponding with choroidal excavation, the segmentation algorithm could fail resulting in incorrect vascular images because of decreased signal strength (Figure 1(c)). One limitation of this study was to include previous PDT treated patients that could have induced some choroidal changes. However, dark lesions as dark spot and dark area were observed in a majority of patients without previous PDT.
We observed that a “white spot” could be associated with the leaking point seen on FA possibly due to the plasmatic flow moving from the choroid to the subretinal space or to areas of RPE hyperplasia which were responsible for focal leaks in active CSC. 8 This correspondence between a “white spot” on OCT A and the leaking point on FA could be useful in guiding focal laser treatment. However, in many patients with active CSC, OCT A did not visualize such a “white spot” probably because the difference in fluid extension between two images at two different time points is too short or too long to be detected on OCT A. OCT A showed good agreement between a “white spot” and hyper-reflective dots even if their visualization seemed to be better on OCT B and OCT C. Hyper-reflective dots on standard deviation (SD)-OCT have been already described by Lehmann et al. 8 in the external and subretinal space and also in the inner choroidal space. These dots probably reveal the involvement of an inflammatory process in CSC patients. They could correspond to inflammatory cells such as macrophages, activated by the shedding of photoreceptor outer segments, in the subretinal space. A concentration of protein-like compounds, fibrin, or lipids could also present as hyper-reflective dots. Some of these molecules are static and their visualization may be due to an artifact since they do not induce a decorrelation signal.
Consistent with published literature, we found OCT A to be very effective in diagnosing the associated choroidal neovascular membrane in CSC patients; 16 no false-positive case was observed. In CSC, diagnosis of choroidal neovascularization may be challenging even with the classical multimodal images.17,18 Both entities can be associated with pigment epithelial detachment, subretinal fluid, and patterns of hyperfluorescence on fluorescein and indocyanine angiographies. OCT A is very sensitive and useful to diagnose these neovascular complications. It should therefore be considered as an essential complementary examination in the early diagnosis and follow up of CSC.
In conclusion, a semiology is described, using OCT A in CSC, as abnormal dark and white lesions. OCT B, OCT C, and multimodal imaging are mandatory in addition to OCT A to diagnose non-neovascular retinal and choroidal CSC lesions. However, OCT A alone is very helpful in detecting abnormal choroidal neovascular membrane in CSC. Further studies are required to confirm our observations.
Footnotes
Declaration of conflicting interests
The author(s) declared no potential conflicts of interest with respect to the research, authorship, and/or publication of this article.
Funding
The author(s) received no financial support for the research, authorship, and/or publication of this article.