
Abstract
Objectives:
To investigate agreement between intraocular pressure measurements by the rebound tonometer and handheld Perkins applanation tonometer in children with and without primary congenital glaucoma and test agreement with intraocular pressure and age variations.
Materials and methods:
A prospective non-interventional comparative study done on 223 eyes of 115 children, 161 normal eyes, and 62 eyes with primary congenital glaucoma. Intraocular pressure measurements were obtained in the upright position by rebound tonometer first, followed by installation of topical anesthetic eye drops (benoxinate), then measured by Perkins applanation tonometer.
Results:
For all eyes, mean difference between Perkins applanation tonometer and rebound tonometer was −0.59 ± 2.59 mmHg, p = 0.001. Regression analysis with (r) = 0.9, (r2) = 0.79, and p < 0.001. In primary congenital glaucoma: there was a mean difference of −.79 ± 2.82 (p = 0.032), a good correlation with (r) = 0.94, (r2) = 0.87%, and 95% level of agreement: –6.34 to +4.76. In normal eyes: mean difference was −.52 ± 2.5 (p = 0.01), correlation: (r) = 0.8, (r2) = 0.64, and p = 0.001. The 95% level of agreement −5.41 and +4.36 mmHg. In intraocular pressure ⩽ 15 mmHg: mean difference −0.89 ± 2.15 mmHg, 95% level of agreement between −5.1 and +3.32 mmHg, p < 0.001. In intraocular pressure >15 mmHg: mean difference was 0.04 ± 3.28 mmHg, 95% level of agreement −6.38 and +6.46 mmHg, p = 0.914.
Conclusion:
There is a good correlation between rebound tonometer and Perkins applanation tonometer in children with and without primary congenital glaucoma; however, rebound tonometer overestimates the intraocular pressure, and in intraocular pressure >15 mmHg there is less agreement between the two devices. Hence, in higher intraocular pressure measurement caution should be taken when interpreting rebound tonometer readings, and a confirmatory measurement using Perkins applanation tonometer is advised.
Introduction
Primary congenital glaucoma (PCG) is the most common form of pediatric glaucoma. It occurs in approximately one in 10,000 individuals and is responsible for 5% of childhood blindness.1,2
Accurate intraocular pressure (IOP) measurement is essential both in initial diagnosis of patients with PCG and in assessing the effectiveness of glaucoma treatment; since it is difficult to evaluate visual fields and subtle changes in optic disk appearance in young children. 3
The standard reference for tonometry is the Goldmann applanation tonometer (GAT, ISO 8612) mounted on a slit lamp. 4 Applying the GAT to children is challenging, as it requires a high degree of cooperation, and most children are uncooperative. As a result pediatric ophthalmologists are restricted to using the following tools to measure IOP in infants and young children: Perkins applanation tonometer (PAT; Veatch Ophthalmic Instruments, Tempe, AZ), Tono-Pen XL (Medtronic Xomed Ophthalmics, Inc, Minneapolis, MN), noncontact air-puff tonometry, and the newer rebound tonometers; the Icare and Icare pro (ICare Finland, Helsinki, Finland). 3
GAT requires the instillation of topical anesthetics and a high degree of cooperation from the child. This for many children can be perceived as intimidating. 3 As an alternative to the GAT, the PAT is a handheld applanation tonometer, which allows for IOP measurement in patients in the supine position. This enables the examiner to “move with the child” when required and is less intimidating to the patient. 5 As a result, the PAT has become the gold standard for IOP measurement under topical anesthetic in infants and children.
In 2005, another handheld device became available to measure IOP: the ICare rebound tonometer (RBT). The RBT acquires six readings in quick succession by propelling a fine sensor tip (less than 2 mm in diameter) against the central cornea from the instrument base, which is held at a distance of 4−8 mm from the surface of the eye. After contact, the probe bounces back; the higher the IOP, the faster the rebound. Measurements are taken within 0.1 s. The force impacting on the cornea is minimal and usually does not even trigger the highly sensitive blink reflex. The instrument display screen then shows the average of the six readings and whether the standard deviation (SD) is low, medium, or high.6,7 Its main advantage over other instruments is that no topical anesthesia is required. As a potentially superior tool for IOP measurement in children and infants, it is paramount to determine whether RBT measurements compare to those taken by PAT in terms of accuracy and reproducibility.
Purpose of study
To detect the degree of agreement between IOP measurements by RBT and PAT in children with and without PCG, to test their agreement under varying conditions of age and IOP and to investigate whether there is an IOP limit, above which the degree of agreement changes.
Materials and methods
This is a prospective non-interventional comparative study done on children being screened and followed up at the outpatient clinic of the ophthalmology department of Abou El Reesh Children’s Hospital, Cairo University, Egypt. A total of 223 eyes of 115 children, who visited the hospital in the period from January to June 2017, were included in the study. Informed written consent was signed by parents or guardians.
This study was approved by the local ethics committee. It fell under the category of service assessment and therefore, did not require any further formal ethical approval.
The children were divided into two groups: those suffering from PCG in at least one eye and those with healthy eyes (control group). A total of 62 eyes were diagnosed with PCG (patients with corneal edema, secondary glaucoma, and uncooperative patients were excluded from the study). The number and type of previous surgeries was not considered as an inclusion/exclusion criterion in this study.
The control group included 161 eyes of children coming for routine checkup or glasses prescription. Exclusion criteria were non-cooperative children and any concurrent ocular pathology.
IOP measurements were first obtained without topical anesthesia, in the upright position by Icare (TA01). Then, anesthetic eye drops, benoxinate hydrochloride 0.4 mg (Benox®), were instilled, and the IOP was measured by PAT. Only nine cases required sedation with chloral hydrate for measuring with PAT. One accurate measurement with each device for each eye was recorded successively during the same assessment by the same examiner and only reliable RBT readings were registered. According to the product manual guidelines of Icare (TA01); after six measurements are obtained, the average IOP appears on the display preceded by the letter P. If P is blinking then the SD is greater than normal. A line would indicate to what extent a new reading is required; with (_) indicating low, (_) indicates a new reading is needed if IOP > 19, and (¯) indicates SD is great and a new measurement is recommended.
The means and SDs of the IOPs measured by both tonometers were compared in both groups. Groups were then further stratified by age into children above the age of 3 years and those below 3 years. Patients were also stratified by IOP into those with IOP ⩽ 15 mmHg and those > 15 mmHg. The Bland-Altman plot was used to compare the bias, and 95% limits of agreement (LOA) between the RBT and PAT measurements in each group.
Statistical analysis
Data were coded and entered using the statistical package SPSS, version 23 (SPSS Inc, Chicago, IL, USA). Continuous data were summarized using mean, SD, minimum, and maximum. Categorical data were summarized using frequency (count) and relative frequency (percentage). Comparisons between quantitative variables were done using the parametric paired student t-test. All tests were two tailed and considered statistically significant at p < 0.05 and highly statistically significant at p < 0.01. A regression analysis was used to assess the degree of agreement between IOP readings from the two devices. Agreement between the methods was observed by estimating the LOA and assessed using Bland–Altman plots. 8
Results
The age of all children enrolled in the study ranged from 4 months up to 16 years, with a mean of 6.5 years. Around 19.7% of patients were aged 3 years or less, and 80.3% were above 3 years.
In the PCG group the mean age of patients was 7 years, ranging from 8 months to 16 years, and in the control group 6.3 years, ranging from 4 months to 14 years. The age difference between both groups was statistically insignificant (p = 0.205).
The mean IOP of all participants was 15.21 ± 5.51 mmHg when measured using the RBT and 14.61 ± 5.49 mmHg when using the PAT (Figure 1).
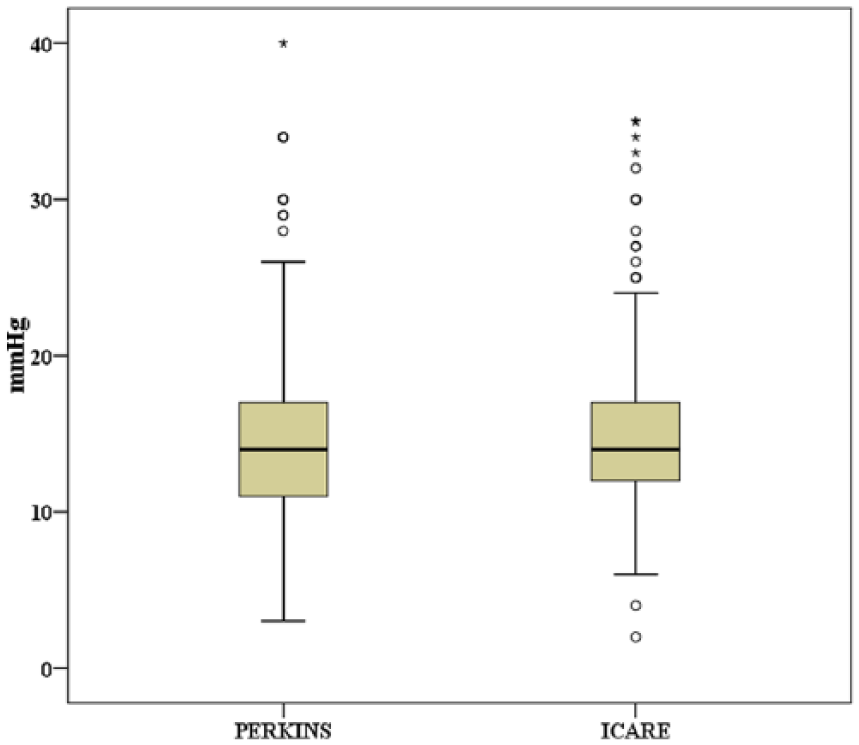
Box plot of the two devices: circles are the outliers, asterisks are the extreme outliers.
The mean difference between PAT and RBT measurements was −0.59 ± 2.59 (p = 0.001). Regression analysis of IOP between both devices showed strong positive correlation r = 0.9 and r2 = 0.79 (p < 0.001), the Bland–Altman plot showed 95% LOA between −5.67 and +4.49 mmHg, p = 0.001 with a fixed bias (Figure 2).
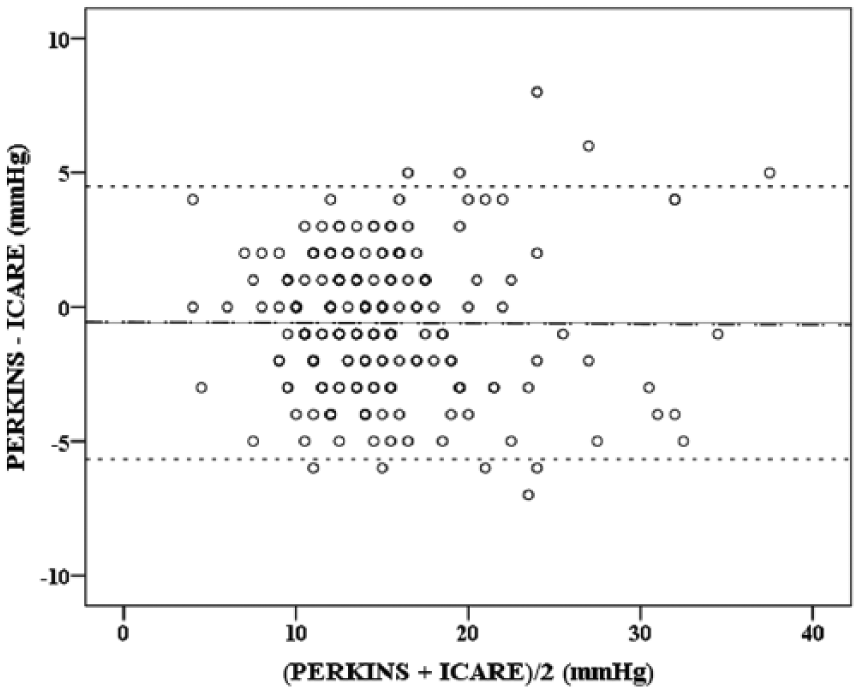
Bland–Altman plot between average and mean difference in IOP by both devices in all patients. The thin solid line is the mean of difference, the dashed line is the 95% limits of agreement, and the dash dotted line is the regression line.
Table 1 shows the bias and LOA of all groups.
Bias and 95% LOA in all groups.
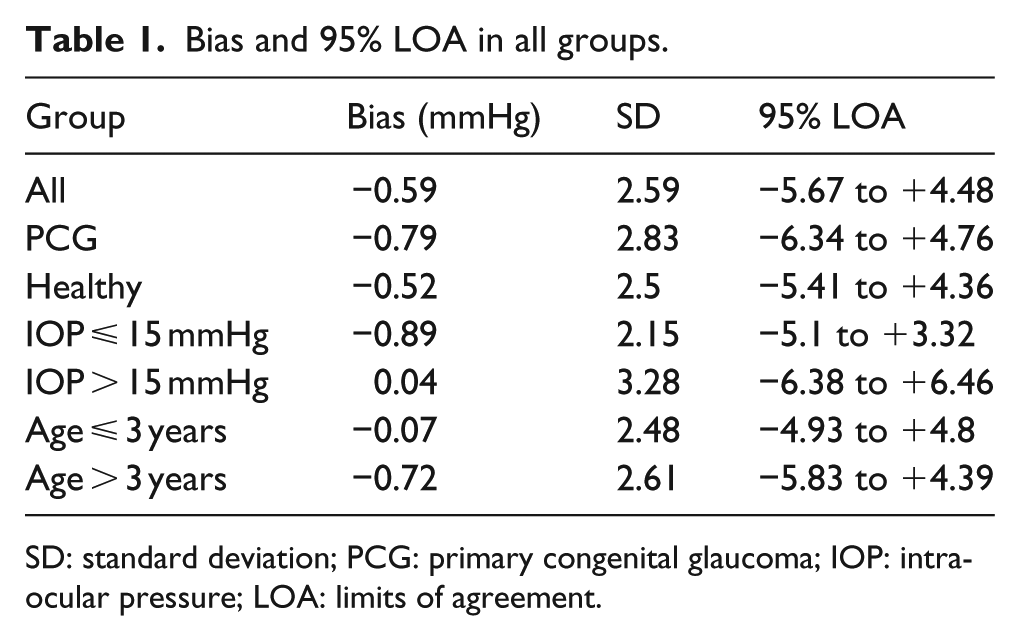
SD: standard deviation; PCG: primary congenital glaucoma; IOP: intraocular pressure; LOA: limits of agreement.
The PCG group
There were 62 eyes with PCG. Of these, 33 eyes (53.2%) had an IOP ⩽ 15 mmHg and 29 (46.8%) > 15 mmHg. The mean difference between the two devices was −0.79 ± 2.83 (lower and upper 95% confidence interval of the difference was −1.51 and −0.07, respectively, p = 0.032). The regression analysis of IOP between devices showed a strong positive correlation with a correlation coefficient (r) = 0.94, determination coefficient (r2) = 0.87, and p = 0.001 (Figure 3). The Bland–Altman plot (Figure 4) showed 95% LOA from −6.34 to +4.76 mmHg with a fixed bias (p = 0.032).
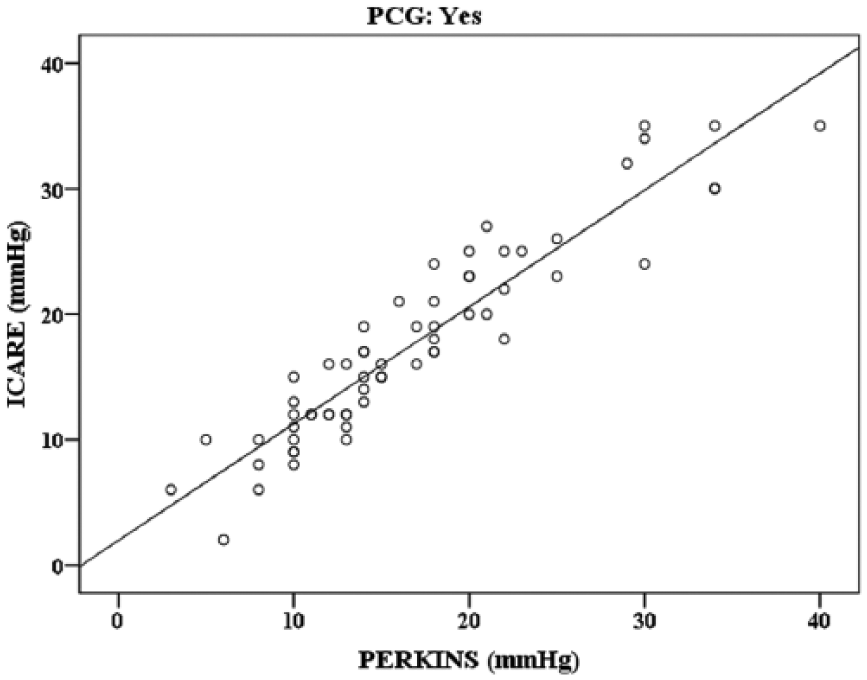
Scatter plot and regression line showing relationship between the two devices in PCG group.
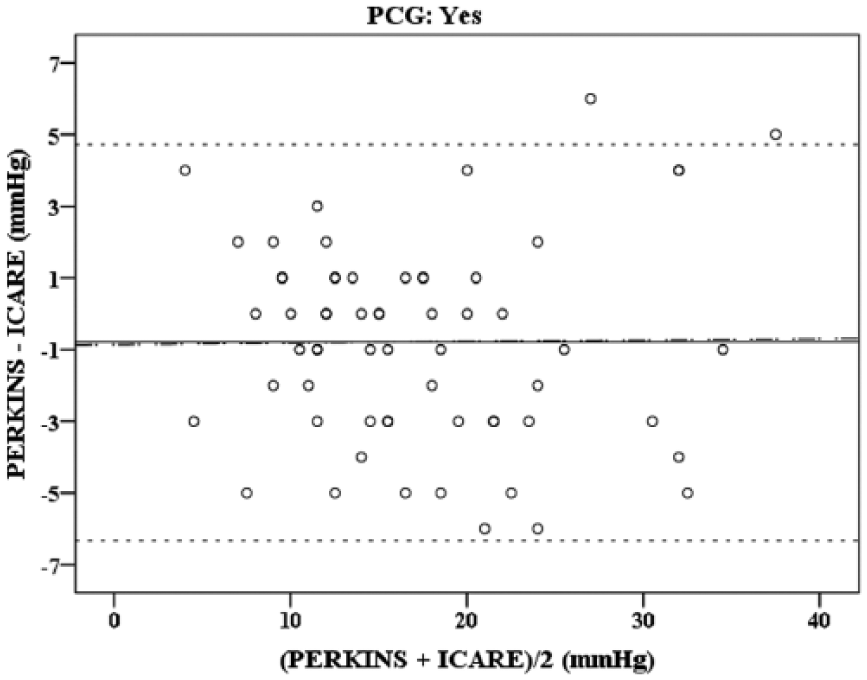
Bland−Altman plot showing 95% limits of agreement, in PCG group. The thin solid line is the mean of difference, the dashed line is the 95% limits of agreement, and the dash dotted line is the regression line.
In the healthy group
The healthy group included 161 eyes, of which 119 had IOP ⩽ 15 mmHg (73.2%) and 42 had IOP > 15 mmHg (26.2%).
The mean difference between the two devices was −0.52 ± 2.5 mmHg, with a lower and upper 95% confidence interval of −0.9 and −0.13, respectively, (p = 0.01). The regression analysis of IOP between devices showed a strong positive correlation with (r) = 0.8, (r2) = 0.64, p = 0.001 (Figure 5).The Bland–Altman plot (Figure 6) showed 95% LOA between both devices from −5.41 to +4.36 mmHg with fixed bias (p = 0.01).
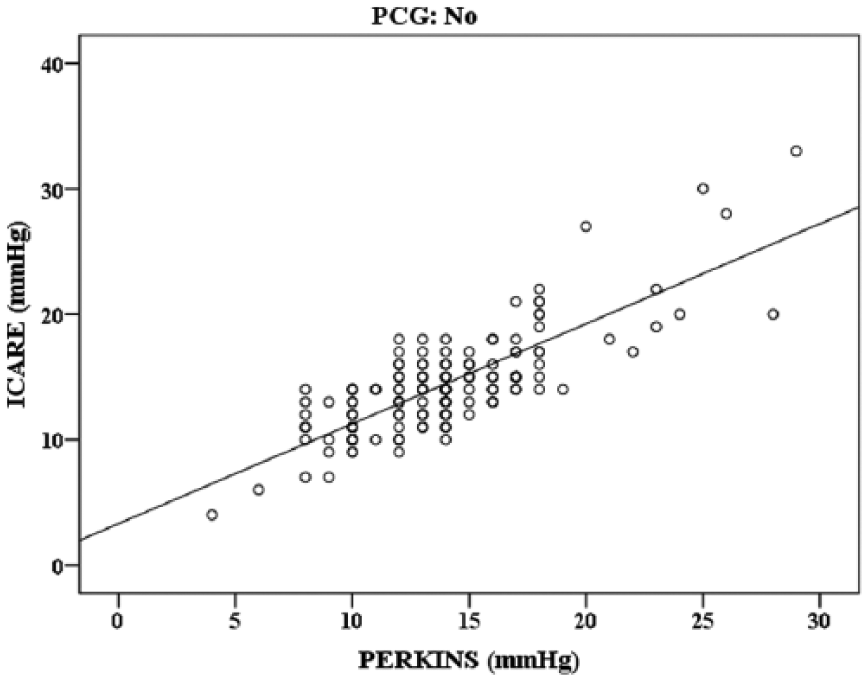
Scatter plot and regression line showing relationship between the two devices in the normal group.
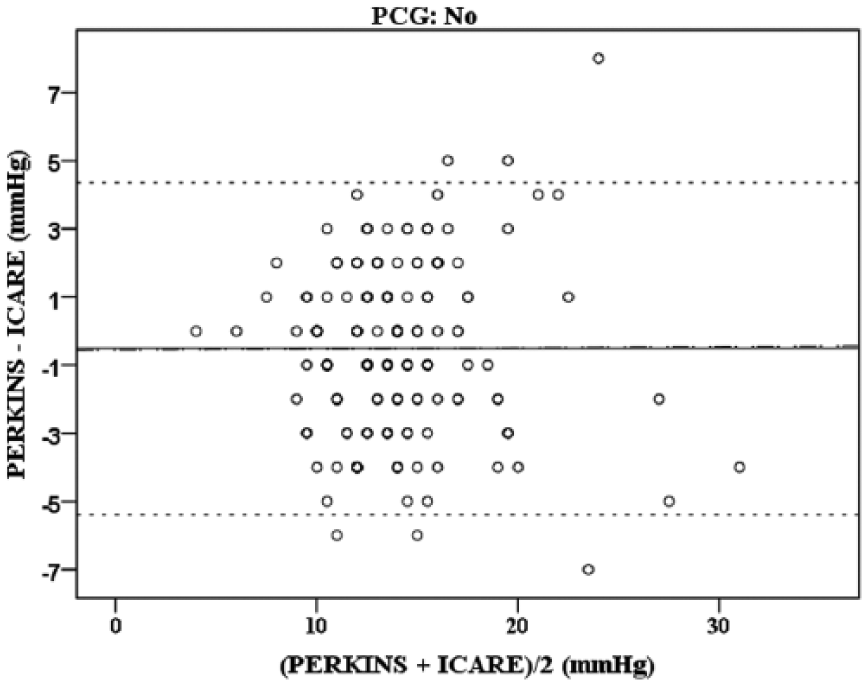
Bland–Altman plot showing 95% limits of agreement, in normal group. The thin solid line is the mean of difference, the dashed line is the 95% limits of agreement, and the dash dotted line is the regression line.
In ⩽ 15-mmHg group
A total of 152 eyes (68%) had IOP ⩽ 15 mmHg. The mean difference between the two devices was −0.89 ± 2.15 mmHg. The lower and upper 95% confidence interval of the difference was −1.23 and −0.54, respectively, (p < 0.001; Figure 7). Regression analysis of IOP between devices showed (r) = 0.67, (r2) = 0.45 with p < 0.001. The Bland–Altman plot (Figure 8) showed 95% of LOA between −5.1 and +3.32 mmHg with a proportional bias (p < 0.001).
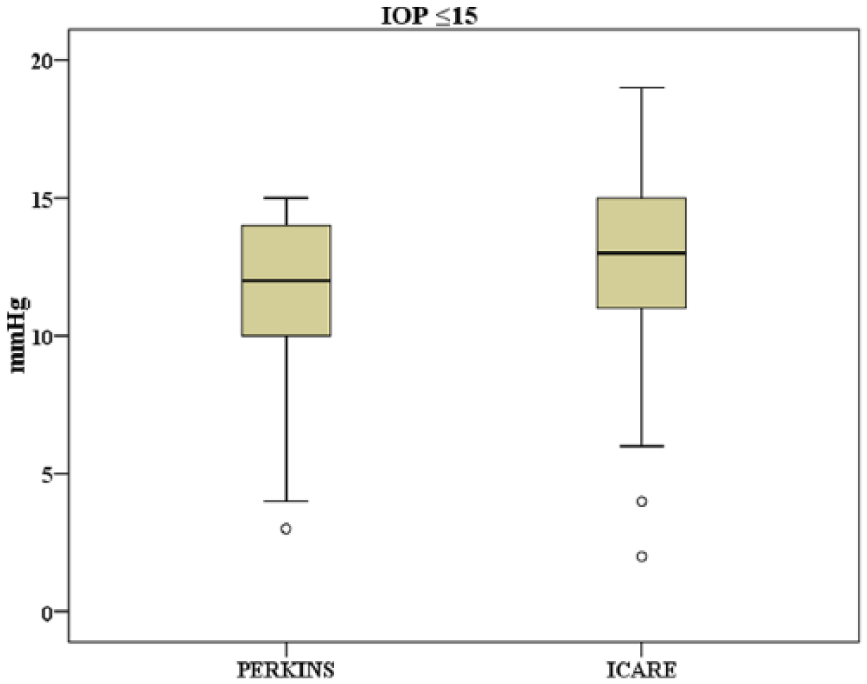
Box plot of the two devices in ⩽15-mmHg group: circles are the outliers and asterisks are the extreme outliers.
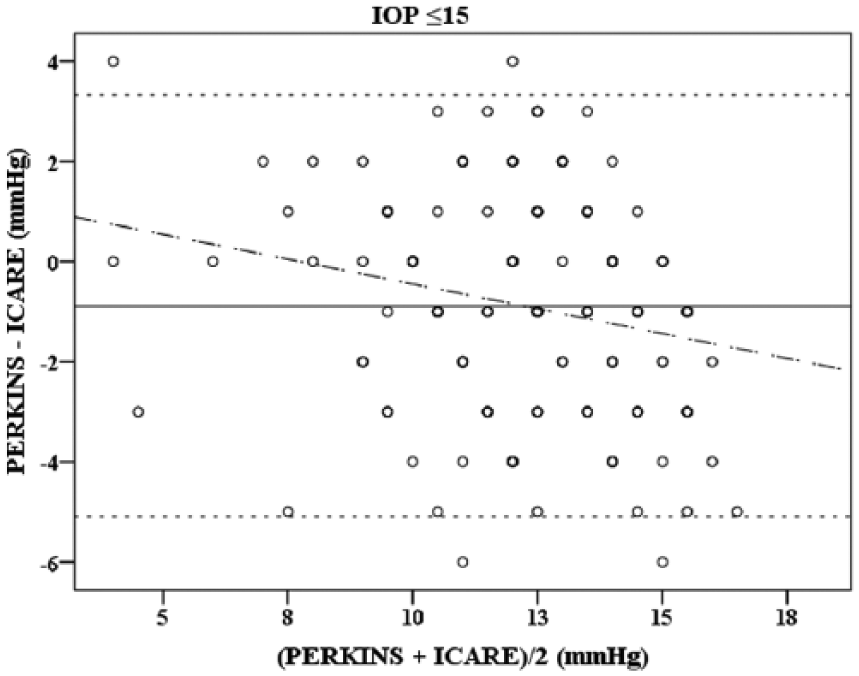
Bland–Altman plot showing 95% limits of agreement in ⩽15-mmHg group. The thin solid line is the mean of difference, the dashed line is the 95% limits of agreement, and the dash dotted line is the regression line.
In > 15-mmHg group
A total of 71 eyes (31.8%) had IOP > 15 mmHg. The mean difference between the two devices was 0.04 ± 3.28 mmHg. The lower and upper 95% confidence interval of the difference was −0.73 and 0.82, respectively, (p = 0.914; Figure 9). The regression analysis of IOP between devices showed positive correlation with (r) = 0.84, (r2) = 0.7, with a p < 0.001. The Bland−Altman plot showed 95% of LOA between −6.38 and +6.46 mmHg with a proportional bias (p = 0.914) (Figure 10).
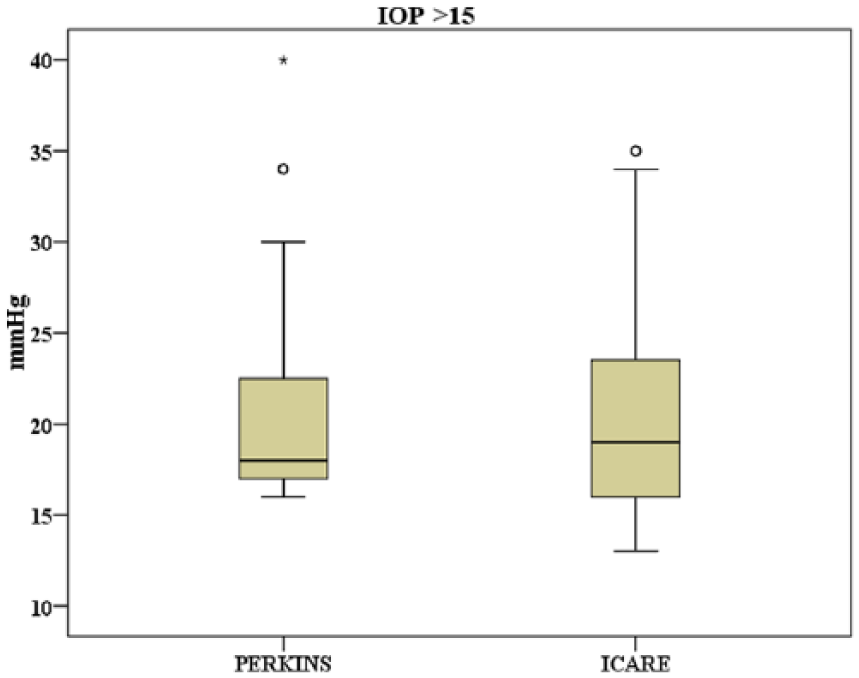
Box plot of the two devices in >15-mmHg group: circles are the outliers and asterisks are the extreme outliers.
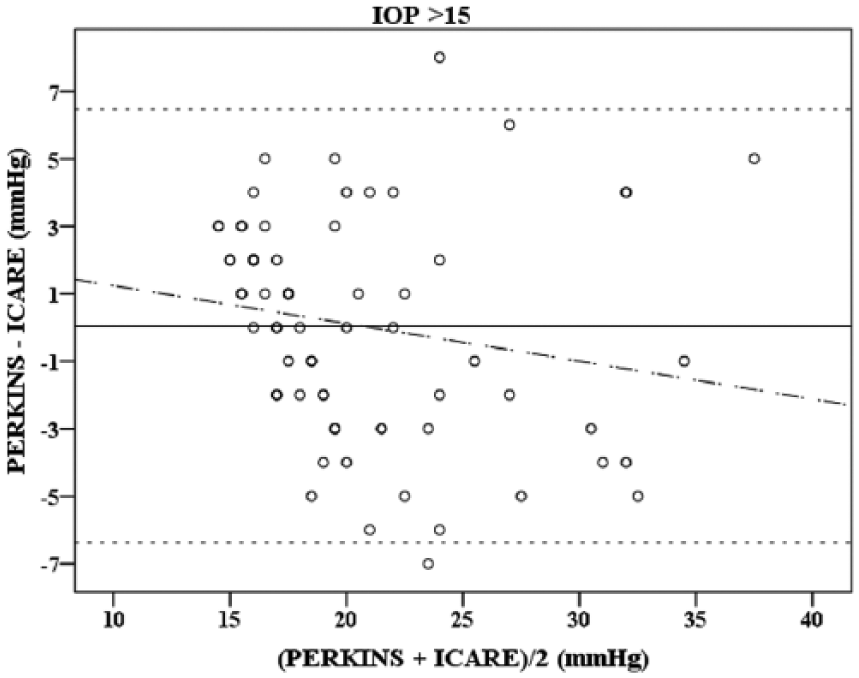
Bland–Altman plot showing 95% limits of agreement in >15-mmHg group. The thin solid line is the mean of difference, the dashed line is the 95% limits of agreement, and the dash dotted line is the regression line.
In the ⩽ 3 years group
A total of 44 eyes (19.7%) belonged to children who were 3 years of age or younger. The mean difference between both devices was −0.07 mmHg (p = 0.86). The upper and lower 95% confidence interval was 0.82 and 0.69. Regression analysis between devices showed good positive correlation (r) = 0.85, (r2) = 0.72, (p < 0.001). The Bland–Altman plot showed 95% LOA between −4.93 and +4.8 mmHg (p = 0.86) with proportional bias (Figure 11).
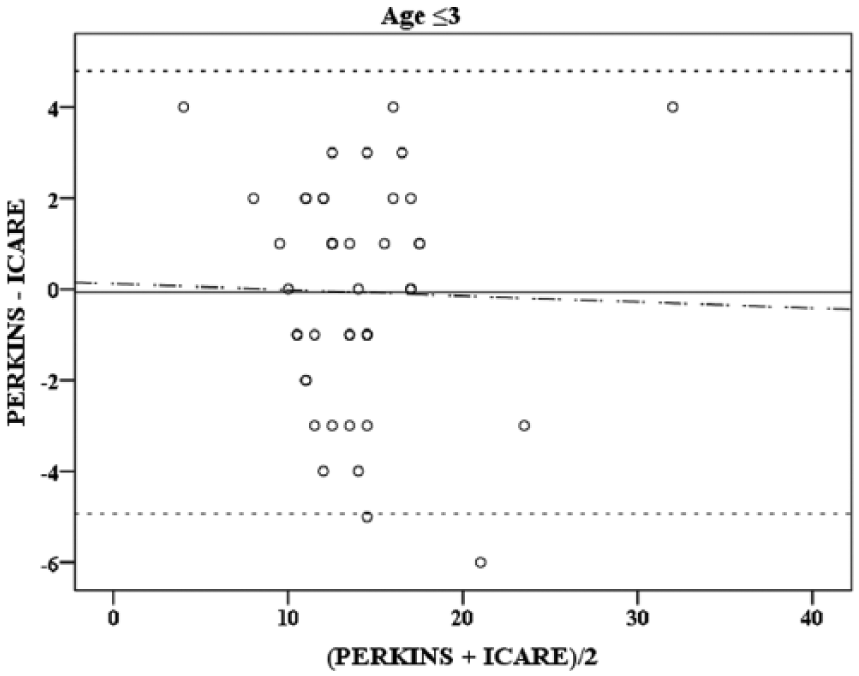
Bland–Altman plot showing 95% limits of agreement in ⩽3 years group. The thin solid line is the mean of difference, the dashed line is the 95% limits of agreement, and the dash dotted line is the regression line.
In the > 3 years group
A total of 179 eyes (80.2%) belonged to children older than 3 years. The mean difference between devices was −0.72 (p < 0.001) with a 95% confidence interval of −1.11 to −0.34 mmHg. Regression analysis between devices revealed a positive correlation with (r) = 0.9 and (r2) = 0.8 (p < 0.001). The Bland–Altman plot showed 95% LOA ranging from −5.83 to +4.39 mmHg with fixed bias (p < 0.001; Figure 12).
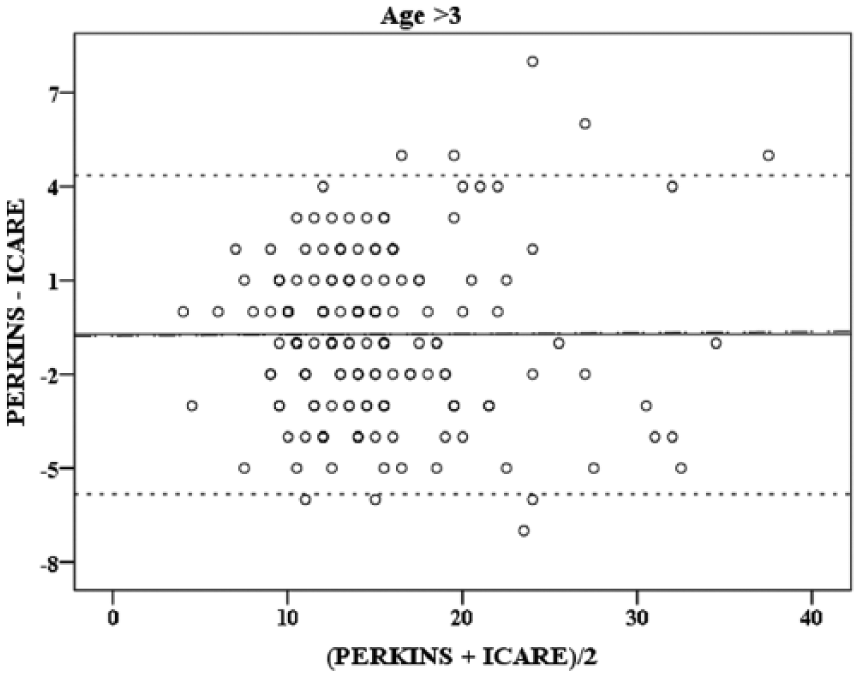
Bland–Altman plot showing 95% limits of agreement in >3 years group. The thin solid line is the mean of difference, the dashed line is the 95% limits of agreement, and the dash dotted line is the regression line.
Collectively, our results show that RBT consistently overestimates IOP compared to PAT. This occurred in all groups except in those with IOP > 15 mmHg. Difference is statistically significant overall as well as in patients without PCG. In patients with PCG, the difference was not significant, possibly due to limitations in power of the study. However, assuming we are looking for a difference of 2 mmHg between measurement using PAT and RBT; with the included sample size of 62 subjects, and an SD of 3 mmHg. If the true difference in the mean response of matched pairs was 2 mmHg or more, we will be able to reject the null hypothesis with probability (power) 0.999. The Type I error probability associated with this test of this null hypothesis is 0.05.
Discussion
In 2005, the ICare RBT became the first handheld tonometer to measures IOP without the requirement of a topical anesthetic. In order to assess whether the RBT is as reliable as the PAT, which is primarily used when examining infants and young children, we undertook a prospective study, where we compared the IOP measurement using the RBT with that using the gold standard PAT.
Large-scale studies to compare the two tonometers in patients with PCG are lacking due to relative rarity of the condition. Many previous study results have been complicated by the use of a general anesthetic, which can alter the IOP. 9 Moreover, previous studies have not included children younger than 3 years.
In this study, we recorded patients’ IOPs, using Icare (TA01) and PAT, in children aged between 4 months and 16 years with and without PCG. We hypothesized that the level of agreements between the two devices may vary under conditions of high or low IOP. Cut-offs for IOP were chosen according to our average recorded IOP readings (15.21 mm by RBT and 14.61 mm by PAT). Hence, we stratified our results, based on IOP, into above and below 15 mmHg. Division according to age, on the other hand, was done while limited literature is available for ages <3 years (e.g. a study by Rodrigues and Chan 10 in 2014 compared PAT to Icare Pro in infants with expected normal IOP). In addition, infants would require sedation or examination under general anesthesia, if PAT measurements, in an out patients-setting, could not be obtained while awake. Thus the authors were eager to see if agreement was different under such conditions. To our knowledge, this is the first study of this nature, which includes infants and children under the age of 3 years
Our data show a positive correlation between the RBT and PAT in both healthy eyes and those with PCG; however, the RBT consistently showed a higher IOP reading in all except in those with an IOP > 15 mmHg groups with a mean of overestimation of 0.59 ± 2.6 mmHg.
Other studies that evaluated the use of RBT for measuring IOP in children relative to applanation tonometry also showed that the RBT overestimates IOP. 11 However, they reported mean differences that are higher than the difference we observed. In a study on 71 eyes with known or suspected glaucoma, Flemmons et al. 11 showed that IOP by RBT was higher by mean of 2.3 mmHg, a result similar to but more dramatic than what we observed. This may be due to the fact that their study did not include children below 4 years of age. 11 A similar result was reported by Rosentreter et al., 12 who compared IOP measurements in 45 eyes with glaucoma and observed an overestimation of 1.96 mmHg. Their results may be confounded by the use of a general anesthetic, and it is likely that IOP may have decreased the longer the child was under general anesthesia. 3 Finally, Martinez-de-la-Casa et al. 13 compared RBT to PAT in 47 eyes and showed that RBT has a higher mean IOP by 3.1 mmHg in children over 3 years; however, small sample size may have affected their results.
In this study, we measured the IOP using RBT first followed by PAT, while applanation tonometry (especially repeated measurements) can progressively lower IOP by a mechanism know as “aqueous massage”; 14 however, there is no proof that repeated RBT affects the IOP. 3
Some studies have compared Icare Pro (the newer version of the ICare) to PAT and have also reported overestimation of IOP by ICare Pro; however, it was done under general anesthesia. 15
Our results show that the LOA between both devices decreases with higher IOP measurements, as IOP measurement difference increased markedly with higher IOP. A similar report by Dahlmann-Noor et al., 16 who compared GAT to RBT in 102 subjects with glaucoma (mean age 11 years), concluded that RBT gave higher readings than GAT. They noted that the magnitude of disagreement depended on the level of IOP being assessed. In their study, the LOA went from (−8.6, 3.9) in IOP < 21 mmHg to (−21.08, 10.04) in IOP > 21 mmHg. 16 Our results may not be as profound, while the majority of our cases had an IOP ⩽ 15 mmHg, with only 38.5% (62) of eyes were glaucomatous and a different applanation tonometry instrument utilized.
We observed that the RBT can over- or underestimate the IOP if the IOP is above 15 mmHg, with a mean difference of 0.046 and an LOA with 95% confidence interval of −6 to +6 mmHg.
In the ⩽3 years group, the RBT overestimated the IOP, and the LOA showed a wider 95% interval. However, this was statistically insignificant (p = 0.86). Further studies in this age group are required to better assess the agreement between the two devices. An assessment involving corneal biomechanics may add further understanding and explanation for age variations, since the mechanical properties of the cornea are different in infancy. 10
Our results indicate that the RBT is a good screening tool, as it tends to overestimate the IOP, so it will not under diagnose glaucoma. It is a suitable follow-up method to detect changes in IOP in patients already diagnosed with glaucoma; however, if high IOP is recorded, we recommend to assess the patient further with other methods before diagnosing or initiating treatment.
We also observed that the RBT was easier to use especially in infants with small palpebral fissures due to the small size of the probe in comparison to the PAT. It was less intimidating to the children and neither topical anesthesia nor sedation, by chloral hydrate, was required, rendering it a good screening tool in the outpatient clinics. This is especially useful in our setting, a tertiary hospital in a developing country with limited resources serving a large number of cases daily.
Conclusion
There is a positive correlation between the RBT and PAT in patients with and without PCG; however, the RBT overestimates the IOP, and in IOP > 15 mmHg, there is less agreement between the two devices. Hence, we recommend that in higher IOP measurement, caution should be taken when interpreting RBT readings, and a confirmatory measurement using PAT would be advised.
Footnotes
Declaration of conflicting interests
The author(s) declared no potential conflicts of interest with respect to the research, authorship, and/or publication of this article.
Funding
The author(s) received no financial support for the research, authorship, and/or publication of this article.