
Abstract
Purpose:
To describe the patterns on near-infrared fundus autofluorescence in eyes affected by early age-related macular degeneration.
Design:
Cross-sectional observational case series.
Participants:
A total of 84 eyes of 84 patients suffering from early age-related macular degeneration (>63 μm but <125 μm drusen and no-to-mild retinal pigment epithelium abnormalities) were enrolled.
Methods:
Patients underwent best-corrected visual acuity, biomicroscopy, infrared reflectance, short-wavelength fundus autofluorescence, and near-infrared fundus autofluorescence. Eyes were classified according to different patterns of near-infrared fundus autofluorescence. Main outcome was definition of relative prevalence and features of each near-infrared fundus autofluorescence pattern; secondary outcomes were correlation between near-infrared fundus autofluorescence and short-wavelength fundus autofluorescence and between near-infrared fundus autofluorescence patterns and best-corrected visual acuity.
Results:
Four different patterns of near-infrared fundus autofluorescence identified: normal foveal signal (Pattern A, 7%); normal foveal signal with hyperautofluorescent/hypoautofluorescent spots not involving the fovea (Pattern B, 65.5%); hyperautofluorescent/hypoautofluorescent spots involving the fovea (Pattern C, 15.5%); patchy pattern (Pattern D, 12%). best-corrected visual acuity was lower in eyes with foveal signal alteration (Patterns C and D).
Conclusion:
Near-infrared fundus autofluorescence pattern in early age-related macular degeneration might be suggestive of visual function deterioration when the fovea is involved. Longitudinal studies are warranted to confirm our preliminary results.
Introduction
Clinical characterization of age-related macular degeneration (AMD) is complex. AMD has been classified into different categories, namely early, intermediate, and advance, with increasing clinical severity and macular structural damage. Thanks to advanced imaging techniques, each stage has been further characterized in terms of visual function, histopathology, and prognosis.1,2
Early AMD is defined by the presence of medium-sized (i.e. >63 μm but <125 μm) focal deposits of lipofuscin, photoreceptors debris, and inflammatory components between the Bruch’s membrane (BM) and the retinal pigment epithelium (RPE), known as drusen, with no-to-mild pigmentary abnormalities. 3 Nevertheless, these categories of AMD include a wide range of phenotypes, differing each other in visual acuity, ophthalmoscopic presentation, and risk of progression. 4 Even in those patients featuring apparently intact visual acuity, several studies have documented impaired mesopic function, 5 reduced contrast sensitivity, 6 and reduced macular sensitivity on microperimetry. 7
Fundus autofluorescence (FAF) is a non-invasive imaging technique that uses the natural property of certain intraretinal fluorophores, as lipofuscin, melanin, and melanofuscin, to estimate the qualitative and quantitative molecular changes that take place in the macular region in AMD. 8 The distribution of the macular fluorophores appears to vary according to the stage of the disease, and correlates with retinal function and cell survival. 9 Accumulation of lipofuscin, detected by 488-nm blue-light autofluorescence or short-wavelength fundus autofluorescence (SW-FAF), indirectly reflects the grade of metabolic derangement of RPE, 10 while loss of melanin, excited by 787-nm near-infrared fundus autofluorescence (NIR-FAF), has been observed with retinal aging. 11
Many previous studies have focused on SW-FAF changes in advanced AMD, 12 but little is known regarding the distinctive NIR-FAF alterations in the initial stages of AMD. As distinct patterns of NIR-FAF may reflect heterogeneity at a cellular and molecular level, and eventually in visual function, the aim of this study is to describe and classify the different patterns of abnormal NIR-FAF in eyes with early AMD. Secondary aim was to seek a correlation between these patterns, visual acuity, and macular sensitivity measured on microperimetry.
Methods
This trial study is a cross-sectional, observational case series conducted on prospectively enrolled patients affected by early AMD, referring to the Medical Retina service of San Raffaele Scientific Institute between January 2015 and 2019. Study design was approved by the local Institutional Review Board (IRB), and written informed consent was obtained from all patients. The research adhered to the tenets of the Declaration of Helsinki.
The inclusion criteria were age ⩾50 years old, diagnosis of early AMD, 3 clear media, Snellen visual acuity of 20/40 (logarithm of the minimum angle of resolution (logMAR) 0.30) or better, and stable fixation for high-quality imaging acquisition. Exclusion criteria were the presence of any other ocular disorder, including amblyopia, potentially affecting visual acuity measurement, media opacities, and evidence of more advanced stages of AMD (i.e. RPE atrophy or choroidal neovascularization). When both eyes met the inclusion criteria, the eye with better visual acuity was chosen as the study eye; in case of equal best-corrected visual acuity (BCVA), the right eye was chosen arbitrarily.
Healthy volunteers without any ocular or systemic condition were used as a control group. Both patients and control subjects underwent BCVA measurement and a complete ophthalmic examination, which included slit-lamp examination, dilated fundus biomicroscopy, optical coherence tomography, and SW-FAF and NIR-FAF, obtained using a confocal scanning laser ophthalmoscope (Heidelberg Retina Angiograph cSLO, Heidelberg Engineering, Heidelberg, Germany), using a 30° field of view and 512 × 512-pixel resolution.
Visual acuity tests were performed under photopic conditions on standard Early Treatment Diabetic Retinopathy Study (ETDRS) charts at 4-m distance (Lighthouse International, New York, NY, USA), before fundus imaging acquisition, to prevent bleaching of the retinal photoreceptors. Patients and control subject were required to read the chart from the top to the bottom and from the left to the right, until >2 letters were undetectable on the line. The visual score was assigned as the smallest line red, with 3 of 5 letters correctly identified.
SW-FAF was recorded using blue laser light at 488 nm for excitation and a barrier filter at 500 nm, 13 NIR-FAF with an excitation power and wavelength of 789 nm and a detection filter of >800 nm. 14 A total of 5–10 images were taken and averaged to obtain a single image for SW-FAF and NIR-FAF. SW-FAF assessment followed the International Fundus Autofluorescence classification. 15 Qualitative analysis of SW-FAF and NIR-FAF images was independently conducted by two trained ophthalmologists masked to the patients’ clinical characteristics (P.I., M.V.C.). Uncertain cases were reviewed by a third ophthalmologist (A.P.).
A subset of 25 patients (25 eyes) underwent microperimetry assessment (MP1, Nidek Technologies, Italy), performed with a Goldmann III stimulus, 200 ms stimulation time, and macula 12° program.
Statistical analysis including descriptive statistics for demographics and clinical records, and comparative analysis (Student’s t-test and one-way Analysis of Variance (ANOVA) with Bonferroni correction) were executed with GraphPad Prism 6.0 (GraphPad software Inc., San Diego, CA, USA). BCVA was converted to logMAR for statistical purposes. The chosen level of statistical significance was two-sided p < 0.05.
Results
A total of 84 patients (45 females, 53.8%) affected by early AMD were considered for the study. The mean age was 75.3 ± 6.9 years and the mean BCVA was 0.12 ± 0.12 logMAR (20/25 Snellen equivalent). In total, 40 volunteers (24 females, 60%), mean age 73.3 ± 7.2 years and mean BCVA 0.01 ± 0.03 logMAR (20/20 Snellen equivalent) were included as the control group. In all the control eyes, posterior-pole SW-FAF and NIR-FAF appeared as previously described, with SW-FAF signal intensity very low at the fovea, due to blockage by macular pigment, and NIR-FAF intensity peaking under the fovea, and then gradually declining toward the perifoveal and peripheric regions.
Four different patterns of NIR-FAF were identified in the patient group (Figure 1). Pattern A was defined as normal, being totally identical to that visible in the control group (Figure 1(a)); it was detected in six eyes (7%). Pattern B corresponded to a normal pattern associated with hyperautofluorescent/hypoautofluorescent spots surrounding but not involving the fovea (Figure 1(b) and (c)). Pattern B was identified in 55 eyes (65.5%). Pattern C was detected in 13 eyes (15.5%) and was characterized by a normal pattern associated with hyperautofluorescent/hypoautofluorescent spots involving the fovea (Figure 1(c) and (d)). Pattern D was defined as a patchy pattern, irregularly combining reduced and increased FAF signal and involving the fovea (Figure 1(e)). Pattern D was identifiable in 10 eyes (12%). BCVA in Patterns B–D was significantly lower with respect to controls (Table 1).
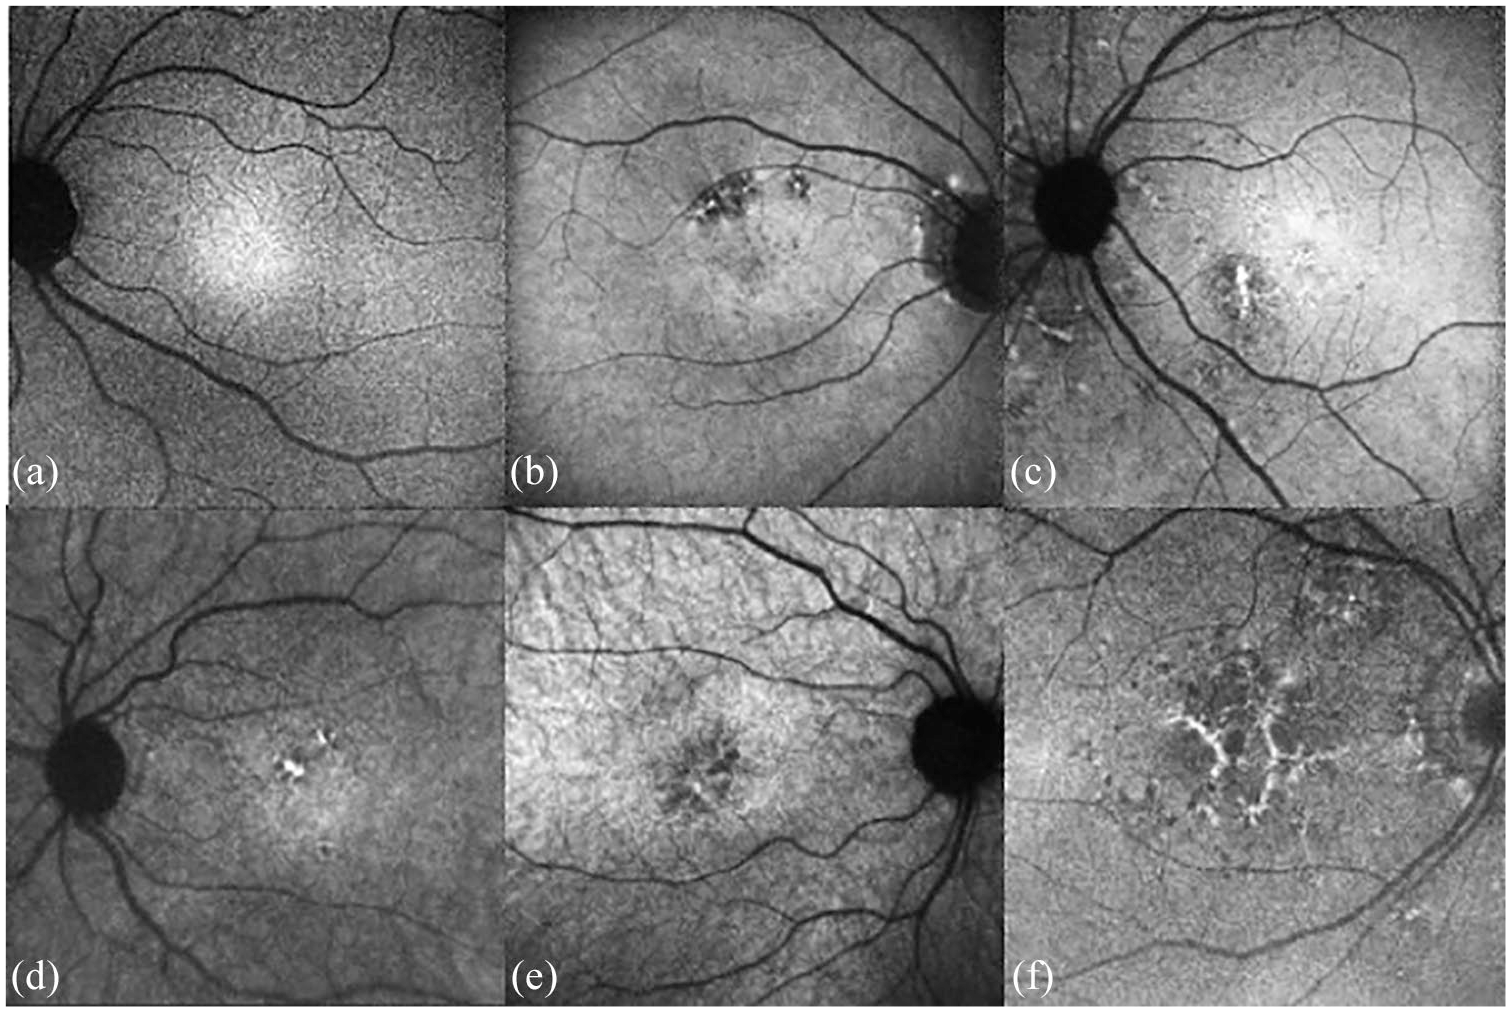
Patterns of early AMF on near-infrared fundus autofluorescence: (a) normal pattern on NIR-FAF, (b) normal pattern associated with hypofluorescent spots not involving the fovea, (c) normal pattern associated with hyperfluorescent spots not involving the fovea, (d) normal pattern associated with hyperfluorescent spots involving the fovea, (e) normal pattern associated with hypofluorescent spots involving the fovea, and (f) patchy pattern.
Best-corrected visual acuity (BCVA) comparison between different NIR-FAF and SW-FAF patterns in early AMD and controls (BCVA 0.01 ± 0.03 logMAR).
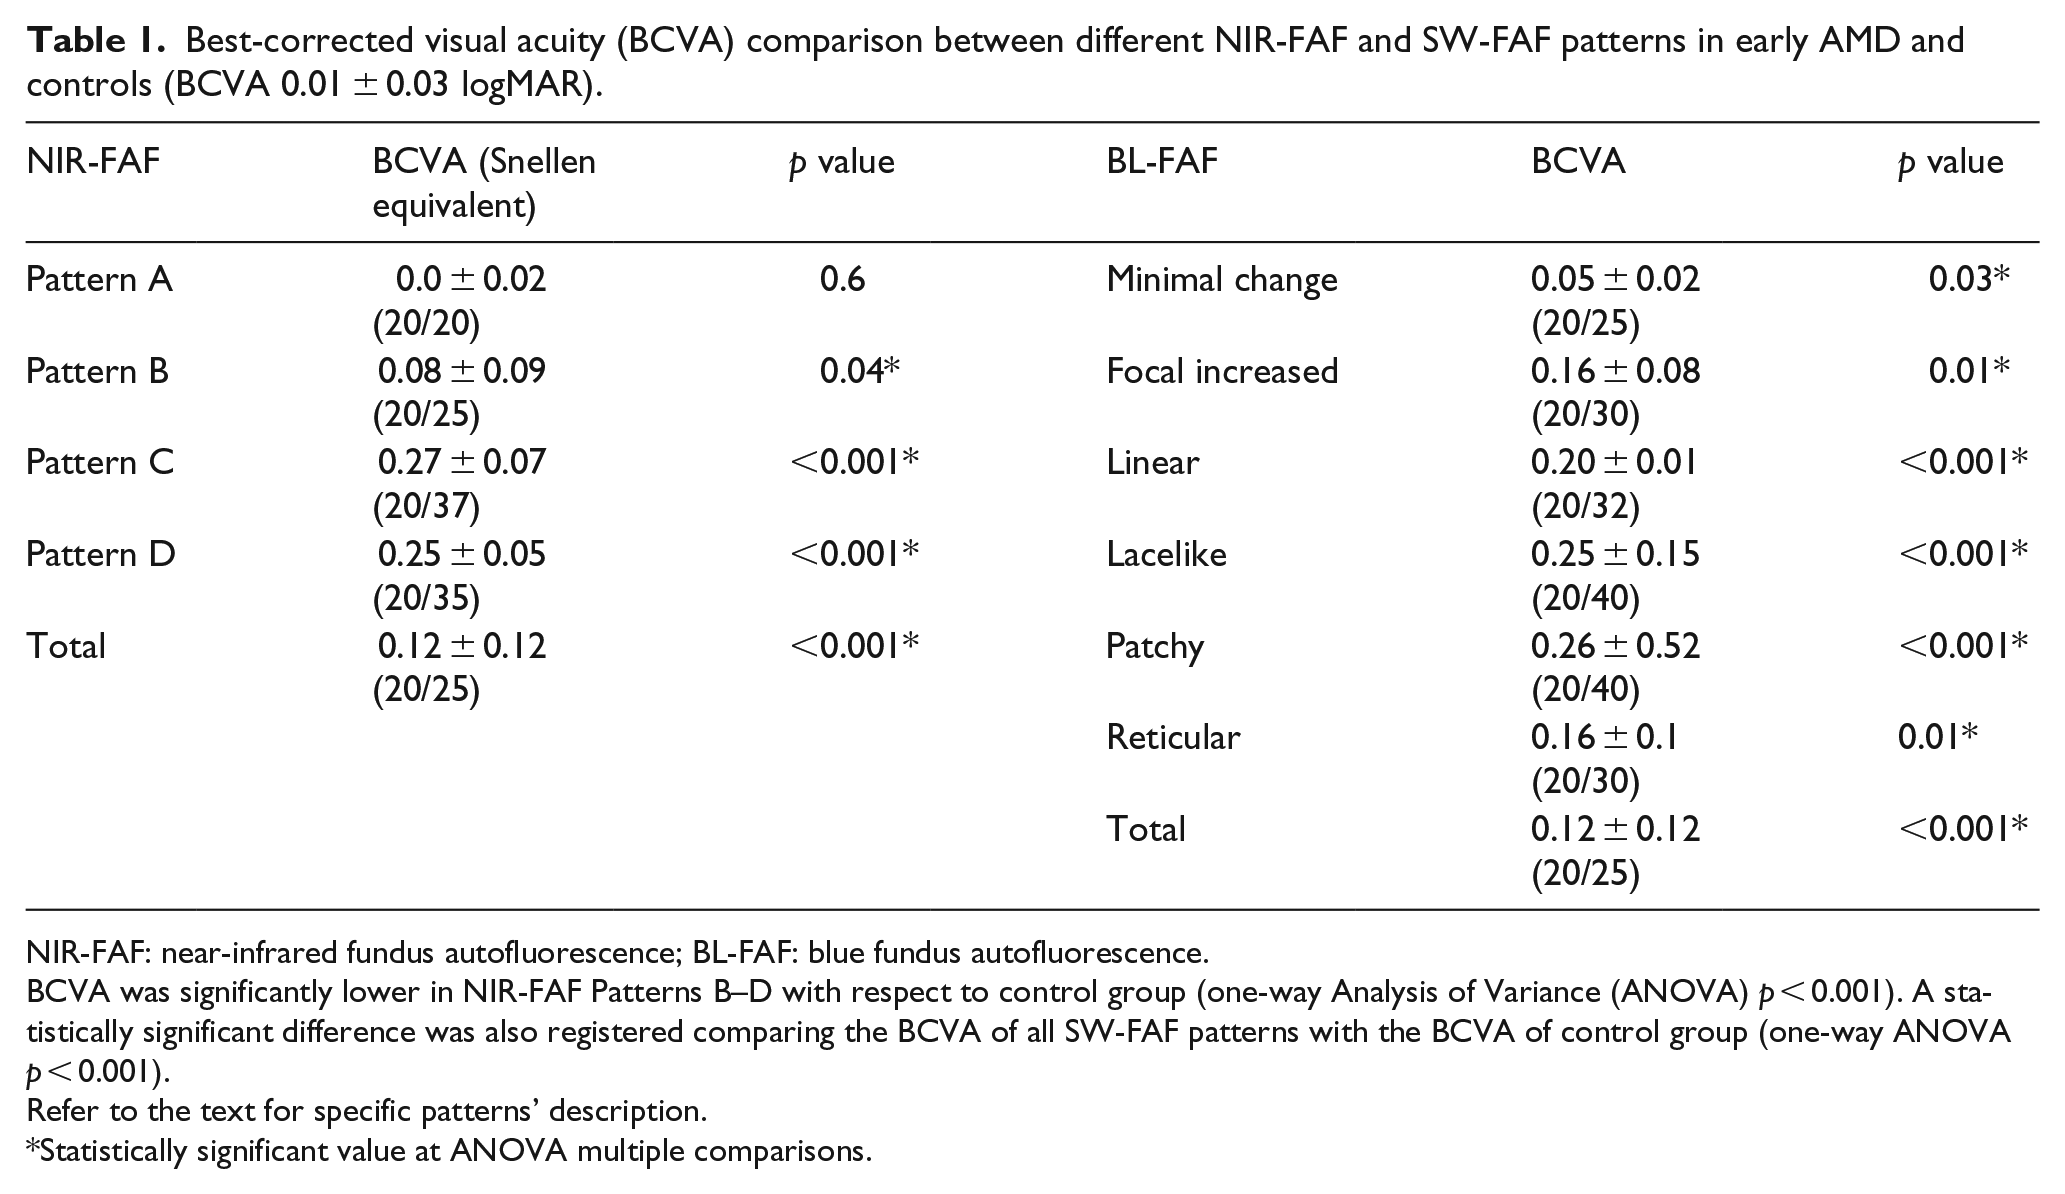
NIR-FAF: near-infrared fundus autofluorescence; BL-FAF: blue fundus autofluorescence.
BCVA was significantly lower in NIR-FAF Patterns B–D with respect to control group (one-way Analysis of Variance (ANOVA) p < 0.001). A statistically significant difference was also registered comparing the BCVA of all SW-FAF patterns with the BCVA of control group (one-way ANOVA p < 0.001).
Refer to the text for specific patterns’ description.
Statistically significant value at ANOVA multiple comparisons.
SW-FAF signal was altered in 100% of eyes; SW-FAF patterns in the study group were classified in a minimal changes pattern in 30 eyes (36%), a focal increased pattern in 33 eyes (39%), a patchy pattern in 4 (5%), a linear pattern in 5 (6%), and a lacelike pattern and a reticular pattern each found in 6 eyes (7%). BCVA in each SW-FAF pattern turned out to be significantly reduced in comparison with the control group (Table 1).
The correlation of patterns identified on NIR-FAF with those on SW-FAF is shown in Table 2. Even though a precise correlation could not be found, the two most common patterns on SW-FAF (i.e. minimal change and focal increased pattern) more frequently corresponded to Pattern B on NIR-FAF (i.e. normal pattern associated with hyperautofluorescent/hypoautofluorescent spots not involving the fovea).
Correlation between BL-FAF and NIR-FAF patterns in early ARM.
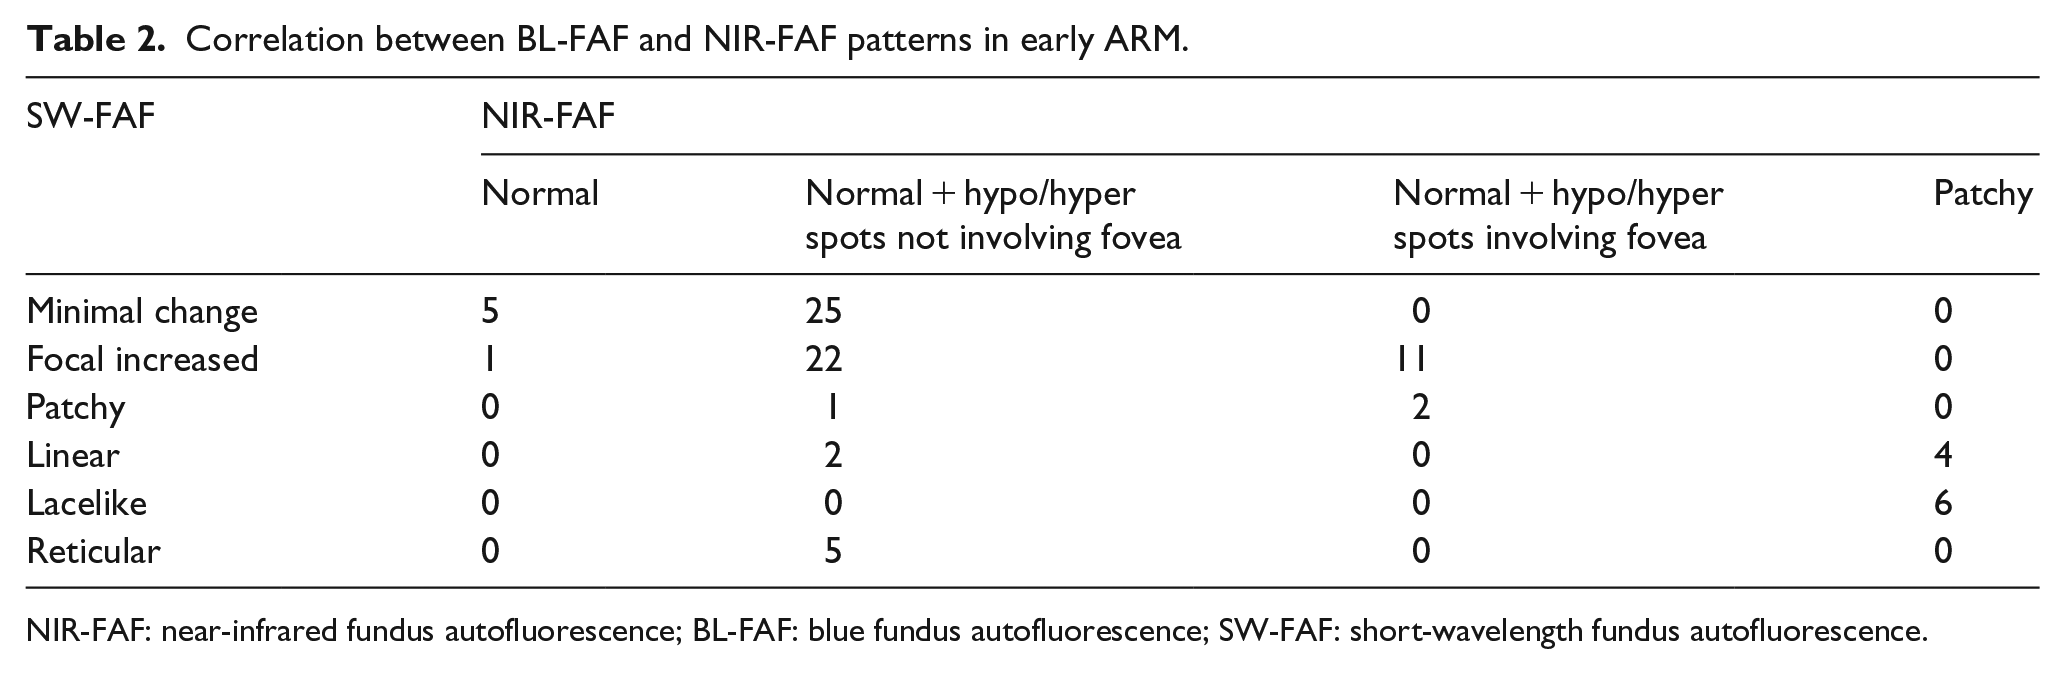
NIR-FAF: near-infrared fundus autofluorescence; BL-FAF: blue fundus autofluorescence; SW-FAF: short-wavelength fundus autofluorescence.
Overall, eyes showing foveal involvement on NIR-FAF (characterized by the presence of hyperautofluorescent/hypoautofluorescent spots involving the fovea, as found in Patterns C and D) had a BCVA of 0.26 ± 0.06 logMAR (20/36 Snellen equivalent), considerately lower with respect to eyes without foveal involvement (i.e. Patterns A and B), which showed a BCVA of 0.08 ± 0.09 logMAR (20/25 Snellen equivalent) (p < 0.001).
Microperimetry showed that central retinal sensitivity with two central degrees was statistically significantly reduced in eyes presenting with Patterns C and D (10.5 ± 1.7 dB) with respect to both control eyes (19.8 ± 0.6 dB) and also to eyes showing Patterns A and B (18 ± 1) (p < 0.001).
Discussion
AMD pathogenesis involves a complex interaction of genetic and environmental factors including the harmful effect of oxidative damage. Melanin is a fundamental, natural, protective agent against oxidative stress, light damage, and radiation. 16 In addition, melanin can delay the lipofuscin accumulation in retina and choroid. Correspondence between NIR-FAF and melanin was first investigated by Keilhauer and Delori, 14 where they showed that NIR-AF appears to originate from the melanin of the RPE and to a varying degree from melanin in the choroidal layers. This correspondence was then histologically confirmed by animal studies in pigmented and albino rats as well as donor human eye. 17 Our group has extensively investigated alterations in melanin distribution, as visualized on NIR-FAF, in different macular dystrophies, including Best vitelliform dystrophy, adult-onset foveo-macular dystrophy, myopic macular degeneration, Stargardt disease, and cone dystrophy.18–23
Despite a considerable number of research works regarding SW-FAF patterns in AMD have been published, 15 little is known regarding NIR-FAF characteristics in AMD. 24 Pilotto et al. 25 focused on NIR-FAF alterations in advanced AMD, specifically in geographic atrophy, compared with those on SW-AF and correlating their findings with microperimetry. In their study, NIR-FAF resulted more accurate in identifying areas of damaged RPE with respect to SW-FAF; abnormal NIR-AF at the borders of geographic atrophy also correlated more strongly with macular functionality on microperimetry compared to SW-FAF. The aim of this study was to investigate exclusively early AMD, with the main hypothesis that alteration in the foveal melanin and melanofuscin might be predictive of reduced visual acuity and central sensitivity. Overall, we identified four main NIR-FAF patterns, that is, normal foveal signal, normal foveal signal with hyperautofluorescent/hypoautofluorescent spots not involving the fovea, hyperautofluorescent/hypoautofluorescent spots involving the fovea, and patchy pattern, confirming a negative trend in visual function from Pattern A to the more complex Patterns B–D. Interestingly, a worse retinal sensitivity was registered in patterns involving the fovea, confirming the early central dysfunction reflected by NIR-FAF signal alterations.
We used for SW-FAF classification the patterns suggested by Bindewald and associates. 15 No direct correlation was detected comparing those SW-FAF with the NIR-FAF patterns identified in this study. Previous pieces of evidence have already shown no perfect correspondence between SW-FAF and NIR-FAF, especially in cases with RPE atrophic changes and pigment migration. 26 For instance, Kellner et al. 12 examined 172 patients with different stages of dry and exudative AMD and compared the fundus SW-AF and NIR-AF imaging findings. In eyes with non-advanced AMD, areas of increased SW-AF corresponded to increased NIR-AF in the majority of cases, but decreased SW-AF corresponded to reduced NIR-AF in only half of the sample. Heiferman and Fawzi 26 found that 79 out of 86 eyes had discordance between SW-FAF and NIR-FAF, even though the most common discrepancy was normal SW-FAF and hyper NI-FAF, followed by SW-FAF and normal NIR-FAF. However, only 16 eyes of their series featured non-advanced AMD. 26
On the contrary, in our case series, SW-FAF turned out to be always altered, whereas 7% of eyes revealed a normal NIR-FAF with fully conserved BCVA. The interpretation of our results is not a straightforward matter. Melanin displacement within the RPE and different levels of oxidation could justify variations in the fluorescence of melanin even in the presence of preserved light detection and transmission. 27 However, we may speculate that the present changes in melanin distribution, as visualized on NIR-FAF, correlate with early functional dysfunction, as detected by microperimetry. Interestingly, all the eyes displaying NIR-FAF Pattern A and normal BCVA revealed abnormal SW-FAF with a minimal change (five eyes) or a focal increased pattern (one eye). This feature may suggest that NIR-FAF reflects BCVA variation more precisely, as compared with SW-FAF, and that lipofuscin accumulation might precede melanin abnormalities in early AMD.
One of the limitations of the study is its cross-sectional design; longitudinal studies may investigate the possible evolution of the different patterns identified; some patterns might predispose to atrophy, while some others might evolve to neovascular complications of advanced AMD. Another limitation is the inclusion of one eye only; if possible genetic factors might influence the melanin distribution and changes and distribution, we would expect a certain degree of symmetry between fellow eyes.
In essence, this study reveals that early AMD is characterized by different NIR-FAF patterns. Visual function is worst in eyes with foveal involvement on NIR-FAF. This investigation can be regarded as a pilot study to address future research; NIR-FAF signal might be looked at first to estimate the degree of functional derangement of the potentially includible eye. Further studies are warranted in an attempt to define better the NIR-FAF alterations related to AMD. Genetic characterization associated with NIR-FAF may also add useful information in identifying different patient subsets, leading to preventive therapy.
Footnotes
Declaration of conflicting interests
The author(s) declared no potential conflicts of interest with respect to the research, authorship, and/or publication of this article.
Funding
The author(s) received no financial support for the research, authorship, and/or publication of this article.