
Abstract
Purpose:
To investigate a subset of diabetic patients without diabetic retinopathy with optical coherence tomography angiography, assessing the differences in macular perfusion between diseased eyes and healthy controls.
Methods:
Monocentric cross-sectional study, including 86 eyes from 43 diabetic patients with no clinical signs of diabetic retinopathy and 78 eyes from 39 controls. Patients underwent 3.0 × 3.0 mm and 4.5 × 4.5 mm swept-source optical coherence tomography angiography. Vessel density (%), foveal avascular zone area (mm2), and avascular density (%) were provided for the superficial capillary plexus and the deep capillary plexus.
Results:
The foveal avascular zone area at the superficial capillary plexus was larger in the study group compared to controls, irrespective of the area of the slab considered. A meaningful difference was found in the vessel density at the deep capillary plexus of the 3.0 × 3.0 mm slab (p = 0.03). Almost all the variables considered in the study showed a significant within-subject effect. Age significantly correlated with vessel density of superficial capillary plexus on 4.5 × 4.5 mm in both control and diabetic eyes.
Conclusion:
Diabetic patients with subclinical diabetic retinopathy feature a larger foveal avascular zone at the superficial capillary plexus compared with controls, as well as relative reduction of the vessel density at the deep capillary plexus. These findings might serve as the basis for screening between normal and diabetic subjects.
Introduction
Approximately 100–120 million diabetic people suffer from diabetic retinopathy (DR) worldwide, of which 17–20 million are in the proliferative stage of the disease (proliferative diabetic retinopathy, PDR), and 20–30 million feature any stage of DR complicated by diabetic macular edema (DME).1,2 As an exponential increase in diabetic prevalence is expected according to the latest projections, 3 DR burden is destined to worsen both in industrialized areas and in many developing countries. 4 Although up to 98% of DR-related blindness is thought to be preventable by combining effective first-, second-, and third-level prevention with timely treatment,5,6 about 50% of cases remain undiagnosed until a late stage of the disease. 7 Nowadays, screening of DR is based on the detection of funduscopically visible signs of the disease (i.e. microaneurysms, hard exudates, neovascularization, macular edema) by means of direct/indirect ophthalmoscopy or color retinographies. However, it is generally accepted that clinically invisible microvascular changes, as well as neural retinal damage, take place during the interval between the diagnosis of systemic diabetes and detectable DR.8,9
The development of a diagnostic tool capable of timely recognition of subclinical disease may influence the follow-up schedule and the therapeutic management of this subset of patients at greater risk of disease progression. Many functional and structural tests have been used with this purpose: electroretinography (ERG),10,11 microperimetry, 12 dynamic vessel analyzer, 13 contrast sensitivity, 14 color vision, 15 and optical coherence tomography (OCT).16–18
Optical coherence tomography angiography (OCTA) is a relatively new technology enabling to qualitatively and quantitatively assess the retinal blood circulation in both healthy and diseased subjects, without using any dye. 19 DR-related pathologic changes on OCTA have been extensively described,20–22 but only a few reports about the OCTA findings in patients without DR have been published so far.23–27
The primary aim of our work was to investigate a subset of diabetic patients without DR, assessing the differences in macular perfusion between diseased eyes and healthy controls.
Methods
Monocentric cross-sectional study carried out at the Department of Ophthalmology of the University of Bari between October 2016 and June 2017. A written consent approved by the local institutional review board (IRB) was acquired for all participants, and the study was performed in agreement with the Declaration of Helsinki for research including human subjects.
Inclusion criteria were as follows: (1) age ⩾ 18 years; (2) diagnosis of diabetes mellitus, either type 1 or type 2; (3) absence of any clinical sign of DR, including clinically significant DME (according to Early Treatment Diabetic Retinopathy Study (ETDRS) guidelines). Exclusion criteria were as follows: (1) diagnosis of any other retinal conditions (e.g. retinal vein occlusion, age-related macular degeneration, post-surgical macular edema, retinal detachment); (2) media opacities or fixation instability; (3) history of any intraocular surgery, with exception of uneventful cataract surgery, performed at least 6 months before the inclusion in the study. Refractive error of ±3 diopters was also considered as an exclusion criterion. Sex- and age-matched healthy subjects were included as a control group. Both eyes from each patient were included in the study, if eligible.
Demographic and clinical data, namely, age, gender, type of diabetes, values of glycosylated hemoglobin (HbA1c), and years from diagnosis of diabetes, and systemic therapies, were collected for each patient. All the participants underwent best-corrected visual acuity (BCVA) measurement using standard ETDRS charts, intraocular pressure (IOP) assessment and dilated fundus biomicroscopy before OCTA examination.
OCTA was performed by means of the Swept Source DRI OCT Triton (Topcon Corporation, Japan), featuring an A-scan rate of 100,000 scans per second, a wavelength-scanning light centered on 1050 nm, and an in-depth resolution of 2.6 μm. The characteristics of the device have been described in detail elsewhere. 28 Images were analyzed by the fully-automated OCTARA (OCT Angiography Ratio Analysis) algorithm provided by the manufacturer, which is based on an intensity ratio analysis without requiring splitting the spectrum, thus preserving the axial resolution. 28 Both 3.0 × 3.0 mm and 4.5 × 4.5 mm slab areas were acquired for each patient; in case of motion artifacts, the scan was repeated until acceptable quality was achieved. En face images were generated from the superficial capillary plexus (SCP) and deep capillary plexus (DCP) based on automated layer segmentation performed by the in-built digital software (IMAGEnet 6 V.1.19 (IMAGEnet Ophthalmie Data System 6 [http://www.topconmedical.com/products/imagenet6.htm])). The SCP was defined as the vascular plexus shown in the slab between 3 μm below the internal limiting membrane and 15 μm below the inner plexiform layer; the DCP was the vascular plexus shown in the slab between 15 and 70 μm below the inner plexiform layer.
For each layer, the vessel density (VD) (i.e. the ratio between the area occupied by white pixels assumed as the vessels and the total area of the slab, expressed as %), and the foveal avascular zone (FAZ) area (expressed in mm2) were automatically provided by IMAGEnet software installed on the OCTA device. We calculated also the avascular density (AD, equal to 1 minus the VD and the area corresponding to the FAZ). OCTA images affected by significant motion or projection artifacts were arbitrarily excluded by a trained retina specialist (C.F.).
Statistical analysis
Variables included in the analysis were as follows: age, BCVA, duration of diabetes, FAZ area at the SCP and the DCP, and VD and AD at the SCP and the DCP. Visual acuity was converted to logMAR. Statistical analyses were carried out with the open-source R Statistical Software (version 2.14.0; R Foundation for Statistical Computing, Vienna, Austria). All the quantitative continuous data were expressed as mean ± standard deviation. Differences regarding FAZ area at the SCP and the DCP, VD and AD at the SCP and the DCP on both 3.0 × 3.0 mm and 4.5 × 4.5 mm slab were explored with a nested analysis of variance (ANOVA) to account for the within-subject correlation.
The nested modeling procedure simultaneously estimated the fixed effect parameters for the observed data (i.e. group effects) and the variance of the random effect (i.e. within-subject effect). In order to test the significance of our nested model, we fit a new model with fixed effects only, using the gls function in the nlme package for each of the parameters investigated. p-values are reported regarding the comparison between the original nested model and the alternative fixed-only model.
A two-tailed p-value < 0.05 was considered statistically significant.
Results
Overall, 164 eyes from 82 subjects were included: 86 eyes from 43 diabetic patients and 78 eyes from 39 controls. Mean demographic and clinical data are listed in Table 1; no statistical difference was found between the two study groups. Mean diabetic history was 9 years, mean HbA1c was 42 mmol/mol, 11.9% patients were treated with insulin, 78.6% were taking oral hypoglycemic agents, and 9.52% were managed with a dietetic plan only.
Demographic characteristics of diabetic patients without diabetic retinopathy and controls.
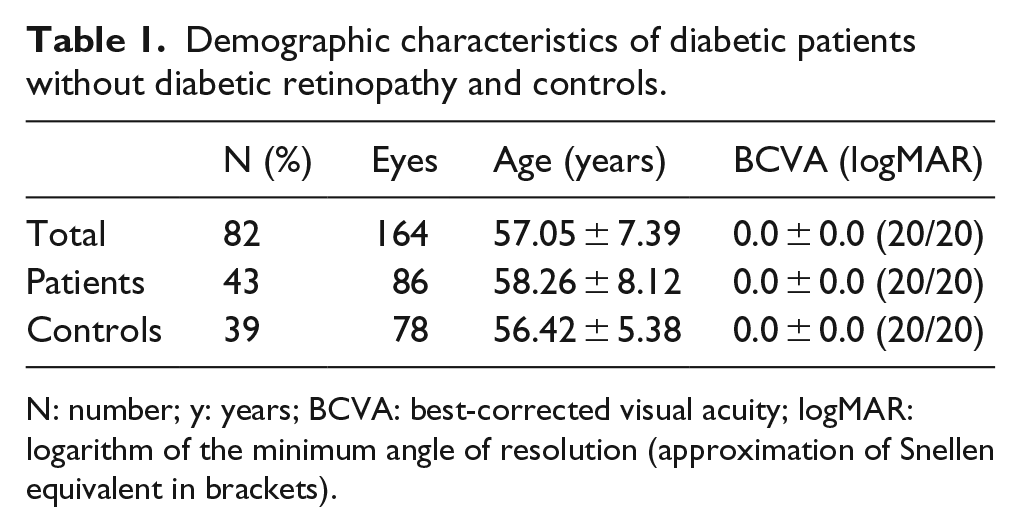
N: number; y: years; BCVA: best-corrected visual acuity; logMAR: logarithm of the minimum angle of resolution (approximation of Snellen equivalent in brackets).
The quantitative assessment of the 3.0 × 3.0 mm and the 4.5 × 4.5 mm scans between patients and controls is shown in Table 2. The main significant differences among the two groups were in the FAZ area at the SCP, irrespective of the area of the slab considered (p = 0.04 and p = 0.007 for the 3.0 × 3.0 mm slab and the 4.5 × 4.5 mm slab, respectively). A greater estimate in the 4.5 × 4.5 mm slab (75.81 mm2 greater in diabetic patients compared to controls) was found (Figure 1(a) and (b)).
Quantitative comparison of the macular vessel density (VD), the avascular density (AD), and the foveal avascular zone (FAZ) area among diabetic patients and controls.
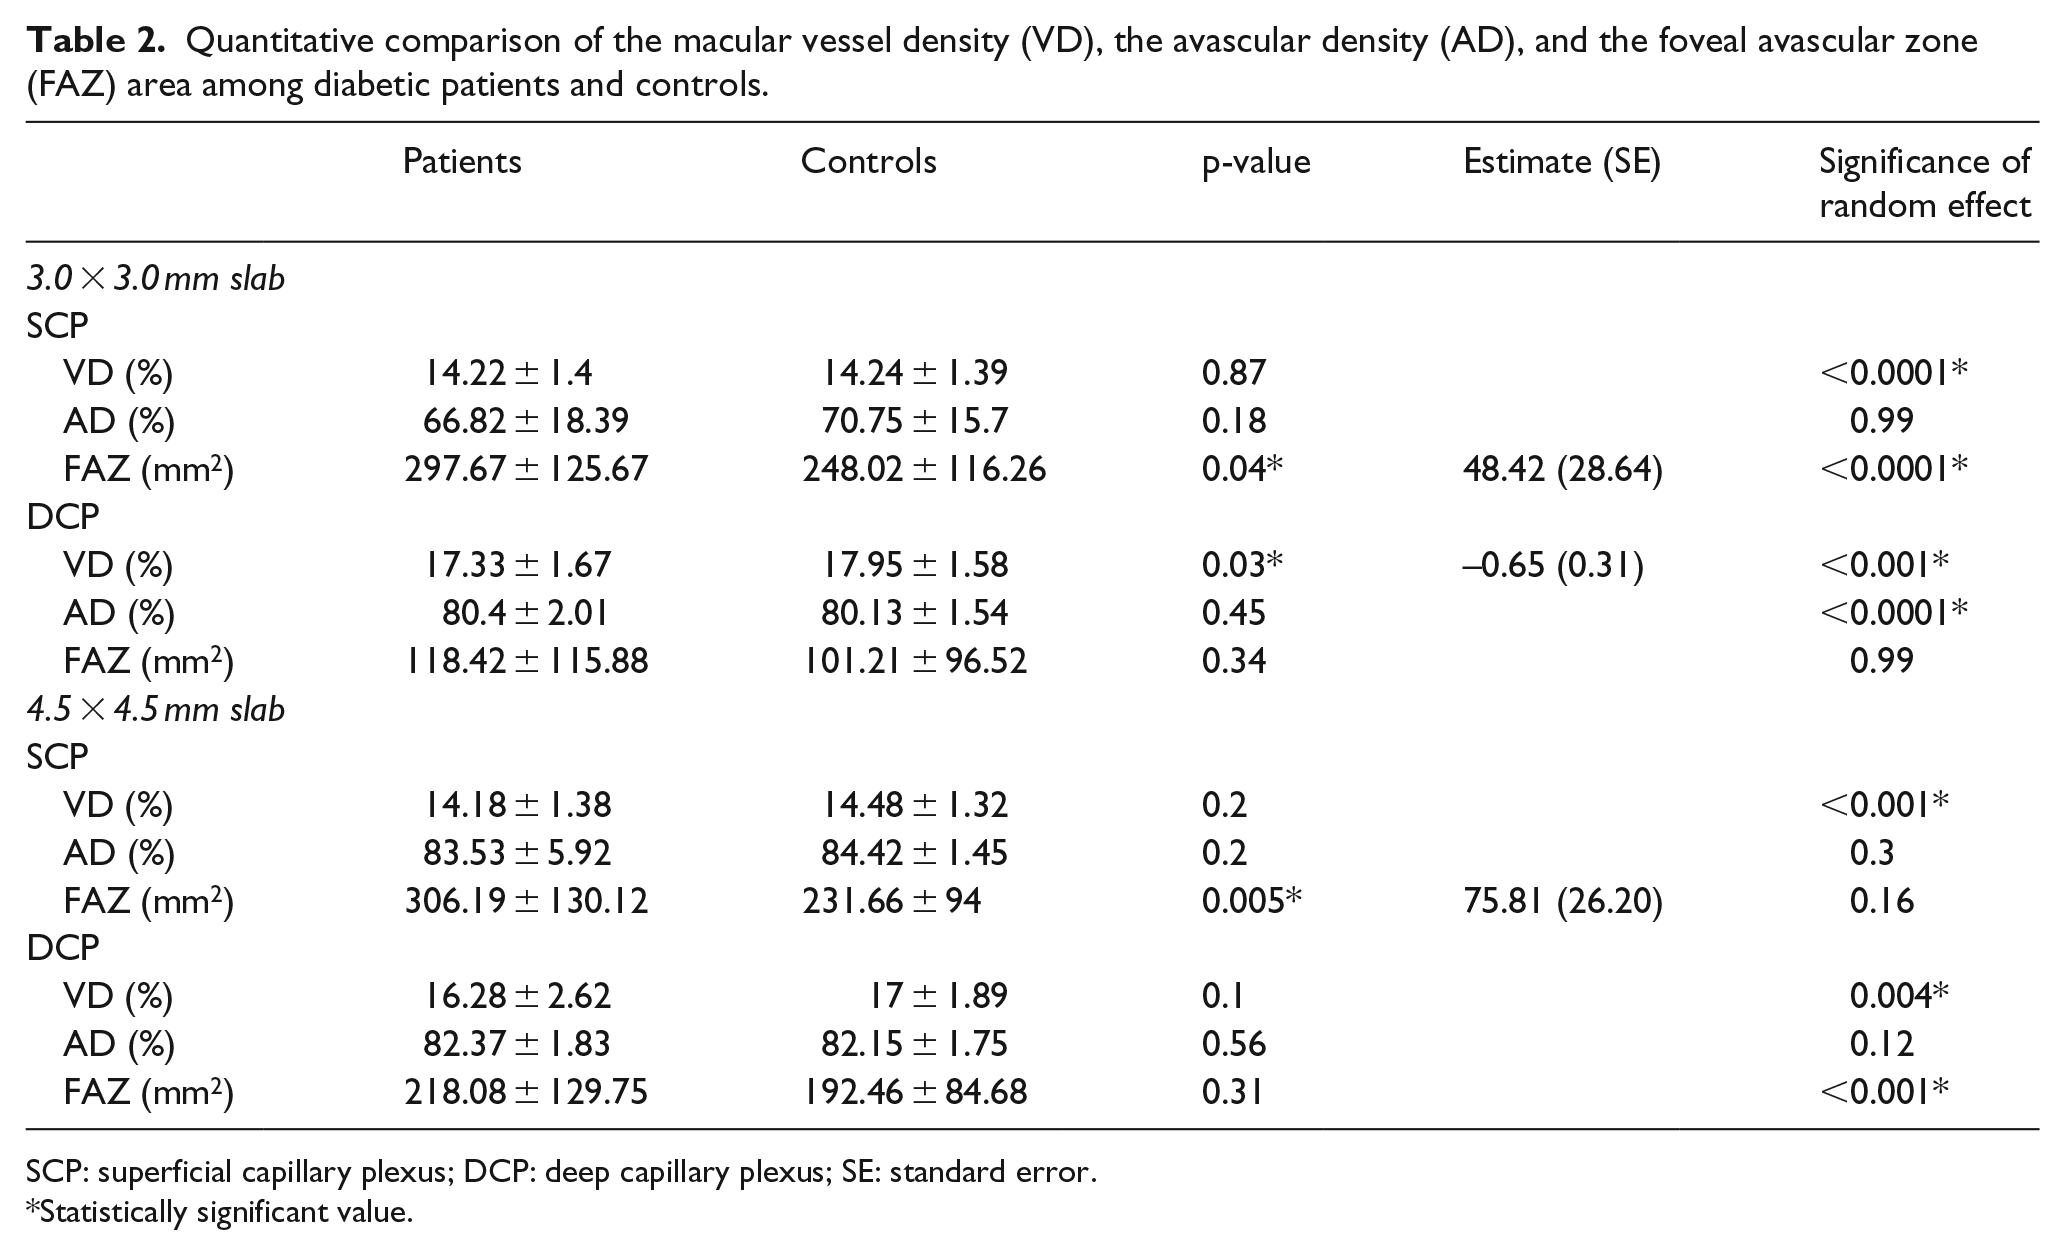
SCP: superficial capillary plexus; DCP: deep capillary plexus; SE: standard error.
Statistically significant value.
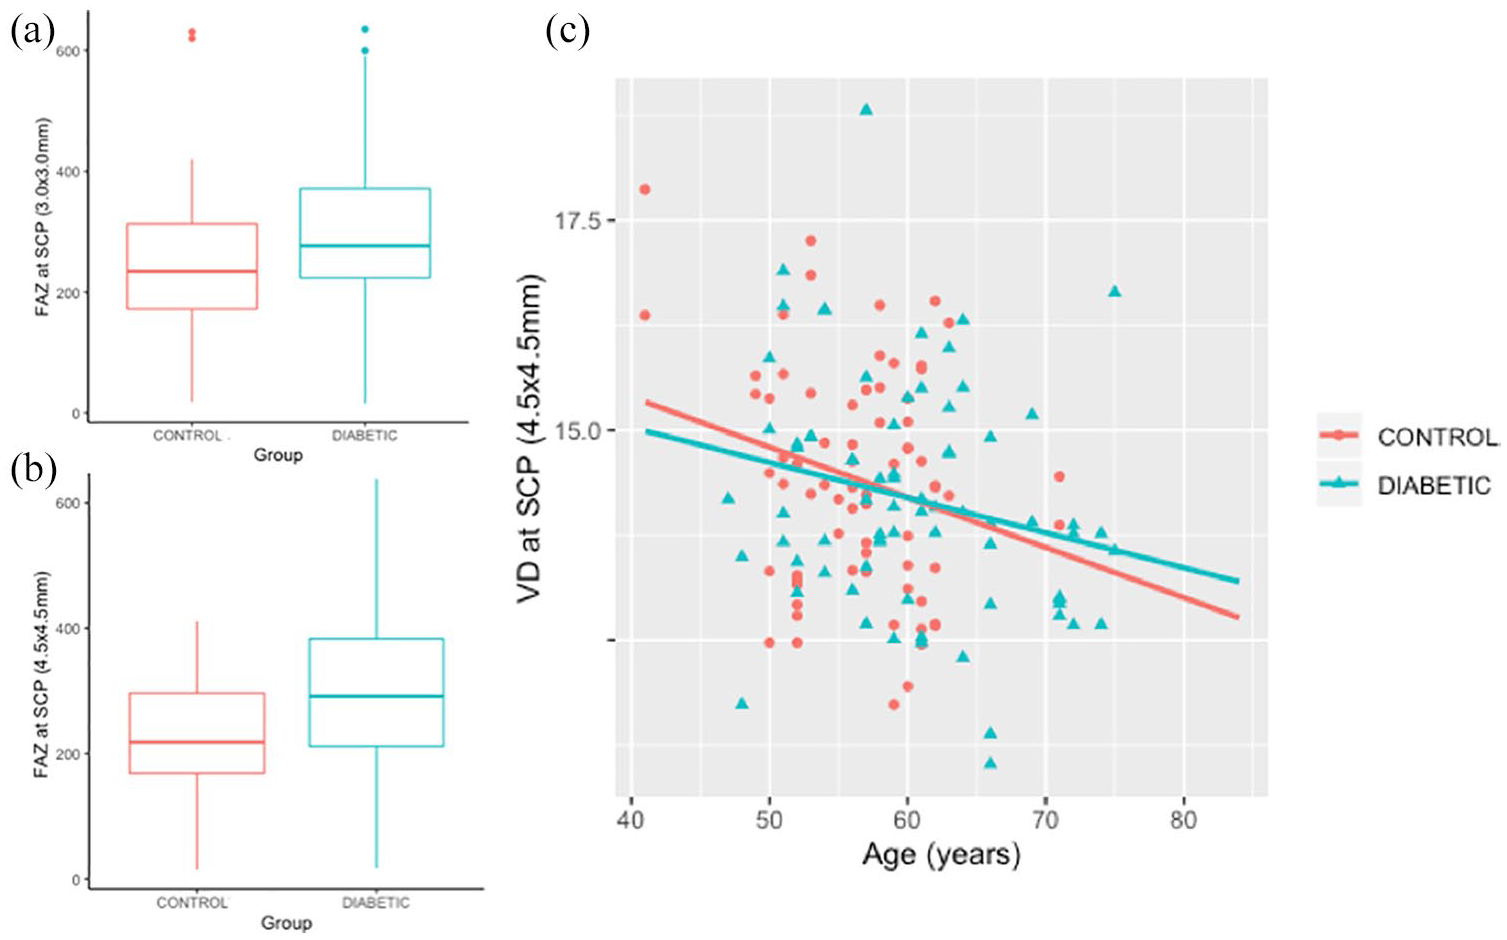
Main findings from the comparison between the diabetic patients without diabetic retinopathy and controls. (a) Boxplot showing a significant difference between patients and controls (p = 0.04) in the foveal avascular zone (FAZ) at the superficial capillary plexus (SCP) on the 3.0 × 3.0 mm slab. The FAZ is expressed as mm2. (b) Boxplot showing a significant difference between patients and controls (p = 0.005) in the foveal avascular zone (FAZ) at the superficial capillary plexus (SCP) on the 4.5 × 4.5 mm slab. The FAZ is expressed as mm2. (c) Linear regression between the vessel density (VD) at the SCP on 4.5 × 4.5 mm slab and age. The two variables showed an inverse correlation (p = 0.02) with similar slopes.
A meaningful difference was found in the VD at the DCP of the 3.0 × 3.0 mm slab (p = 0.03). All the variables considered in the study showed a significant within-subject effect, with exception of the AD at the SCP in the 3.0 × 3.0 mm slab, the FAZ at the DCP in the 3.0 × 3.0 mm slab, the AD and the FAZ at the SCP in the 4.5 × 4.5 mm slab, and the AD at the DCP in the 4.5 × 4.5 mm slab.
The age significantly correlated with the VD of the SCP on the 4.5 × 4.5 mm (p = 0.02), with a similar slope for the two groups (diabetic vs. controls, Figure 1(c)). In the diabetic group, no correlation was found between the duration of diabetes and any of the OCTA parameters.
Discussion
de Carlo and coworkers 26 were the first to use OCTA to demonstrate the increased size of the FAZ and the appearance of capillary non-perfusion in diabetic subjects with no DR. From that point, diverse studies focusing on OCTA in diabetic patients have shown enlargement and fragmentation of the vascular arcades of the FAZ, as well as reduced perifoveal capillary density in subclinical disease. Our results represent further evidence of this theory, showing that vascular changes take place in the macular region before the appearance of clinically detectable retinal signs. The main finding of our analysis was an enlarged FAZ area at the SCP, while the FAZ area at the level of the deep circulation seemed to be relatively not involved. Enlargement of FAZ has been described in both retinal plexa;26,29 however, FAZ area enlargement at the SCP demonstrated a higher degree of prediction of diabetic damage compared to the FAZ area at the DCP in previous reports. 30 As difference in the FAZ area was significant considering the 3.0 × 3.0 mm and the 4.5 × 4.5 mm slabs separately, our study seems to confirm the interscan reliability of FAZ area measurement among different angiocubes. 31
Contrarily to Dimitrova et al. 23 and Cao et al., 32 who found a reduced VD at both the superficial and the deep capillary circulation in type 2 diabetic subjects, our analysis disclosed an initial sparing of the superficial vascular network in the macular area. Analyzing only patients with type 1 diabetes, Scarinci et al. 24 and Carnevali and associates 27 found a reduced VD only in the deep circulation of subclinical DR patients compared to controls. Our study, including both type 1 and type 2 diabetic subjects, confirmed these observations.
The involvement of the deep capillary circulation seems to be particularly specific of DR, as microaneurysms have been found in a larger extent at this level with respect to the superficial plexus. 33 However, focal alterations have been found in the SCP as well, in adult patients without clinical signs of DR. 34 As longitudinal studies using OCTA are not available yet, we cannot exclude if a timely consecutio of the vascular damage exists, that is, ischemic damages that start at the DCP and then move to more superficial layers. Conversely, a progression in the prevalence and severity of OCTA abnormalities has been demonstrated in the different stages of DR.35,36
In our study, we found an association between the VD at the SCP and the age of the study participants. An age-dependent reduction in the retinal perfusion density has been recently described in the macular area in both normal subjects 37 and diabetic patients. 23 On the contrary, we confirm the apparently absent correlation between OCTA parameters and duration of diabetes. 23
One of the advantages of OCTA compared to traditional imaging techniques is its capability to qualitatively and quantitatively assess retinal perfusion with reliability and reproducibility. Our study confirms both of these features of OCTA device: our findings are coherent with the previous literature, demonstrating the early perfusion changes in preclinical DR. Despite differences have been found among different OCTA instruments and analysis modules, the Swept Source DRI OCT Triton was found to be reliable and comparable to other commercially available competitors in VD calculation.38,39
We examined the effect of within-patient correlation on OCTA parameters in both diabetic and healthy subjects using mixed modeling, as suggested in recent reports. 40 To our knowledge, this is the first time that the structure of the random individual contributions to macular perfusion has been explored and reported, and the results highlight the importance of between-subject differences.
The lack of analysis of the peripapillary area should be acknowledged among the limitations of our study. Recently, initial microcirculatory damage at the level of optic nerve head (ONH) has been described in diabetic eyes without clinically evident retinopathy,41,42 along with a reduction in the retinal nerve fiber layer (RNFL) thickness. These findings would further confirm that a strong neuro-vascular coupling exists at the bases of DR. 43
Another limitation is that we considered the absolute value of the FAZ area, instead for a normalization of the FAZ area at the DCP for the FAZ area at the SCP; this adjustment has been proposed so that each FAZ area measurement is matched with its own internal control. 44 Furthermore, we did not adjust the FAZ area for differences in retinal magnification (due to individual differences in axial length), but exclusion of subjects with moderate-to-high refractive errors might have partially limited this flaw. Finally, anatomo-functional correlation has not been performed in our preliminary study; non-invasive investigation by means of microperimetry, multifocal, or full-field electroretinogram could provide useful insights on this topic.
In conclusion, our study showed that patients with subclinical DR feature a larger FAZ at the level of the SCP compared with age-matched and gender-matched healthy subjects, with a reduction of the VD at the DCP in the perifoveal area.
Footnotes
Authors’ contributions
All the authors contributed to the conception or design of the work, the acquisition, analysis and interpretation of data, drafting the work, revising it critically for important intellectual content, and gave final approval of the version to be published.
Declaration of conflicting interests
The author(s) declared no potential conflicts of interest with respect to the research, authorship, and/or publication of this article.
Ethical approval
All procedures performed in studies involving human participants were in accordance with the ethical standards of the institutional and/or national research committee and with the 1964 Helsinki declaration and its later amendments or comparable ethical standards.
Funding
The author(s) received no financial support for the research, authorship, and/or publication of this article.
Informed consent
Informed consent was obtained from all individual participants included in the study.