
Abstract
Purpose:
To investigate whether qualitative and quantitative features of choroidal neovascular membranes are associated with anti-vascular endothelial growth factor treatment response in patients with neovascular age-related macular degeneration.
Methods:
A total of 41 eyes were included in this cross-sectional observational study and divided into “good responders” and “poor responders” based on the long-term functional changes, frequency of recurrent choroidal neovascular activity, and injection need. Enface optical coherence tomography angiography images were obtained and qualitative features of choroidal neovascular membranes were described based on vessel network density. Then, quantitative measurements including vessel area, vessel length, junction density, and lacunarity were calculated using validated software (ImageJ and AngioTool). Chi-square tests, t-test, or Mann–Whitney U tests were used for group comparisons, and intraclass correlation coefficients were calculated for reliability assessment of quantitative analyses.
Results:
Twenty-two eyes treated by a median of 9 (3–24) anti-vascular endothelial growth factor injections at a median follow-up of 41 (12–89) months were categorized as good responders, 19 treated by a median of 26 (11–46) injections at a median follow-up of 44.5 (12–84) months as poor responders. Good responder group mostly had loose network (45.5%), and poor responders mostly had dense network (47.7%). The difference was not statistically significant (p = 0.25). The size of the lesion was 2.7 times greater at baseline (p = 0.04) and 1.7 times greater at final examination in the poor responder group (p = 0.04). Lacunarity index, showing lesion heterogeneity, was higher in good responders (p = 0.018) than poor responders. Other quantitative vascular features did not significantly differ between the groups (p > 0.05).
Conclusion:
Long-term remodeling of chronically treated choroidal neovascular may be non-invasively and reproducibly investigated using optical coherence tomography angiography. Quantitative analysis and lacunarity index, in particular, may be used as a measure of vessel maturation and guide treatment strategies in neovascular age-related macular degeneration.
Introduction
Advances in intravitreal antiangiogenic drugs and multimodal imaging modalities have significantly improved the management of neovascular age-related macular degeneration (AMD). The visual prognosis has changed from almost blindness to preservation of the vision, and even improvement in the majority of the patients. 1 However, not all patients benefit from the treatment in the same manner. A subgroup of patients continues to have persistent or recurrent exudation and lose vision despite monthly anti-vascular endothelial growth factor (anti-VEGF) therapies.2–5 Numerous factors, including demographic, genetic, clinical features, and morphological characteristics of the lesions, have been investigated to date in an attempt to better understand this variation.6–9 Recently, optical coherence tomography angiography (OCTA) has shown a promise to identify novel morphological markers that might characterize treatment response. 10 Previous studies mostly focused on qualitative evaluation of vascular changes after treatment and correlation of structural features with disease activity.11,12 However, these studies had inconsistent results, which may be explained by the complex and variable morphology of the neovascular lesions that could be hard to define solely by qualitative observations. Therefore, quantitative translation of qualitative findings could provide more objective and precise information and detect subtle differences regarding the behavior of the choroidal neovascular (CNV) membranes in response to treatment. Several studies reported a significant reduction in size and vessel density of the neovascular lesion with the anti-VEGF treatment.13,14 However, another study that focused on the quantitative characteristics of the CNV, such as vessel size, vessel and junction density, and lacunarity, did not find any significant association between any of the parameters and the treatment response, assessed by injection frequency. 15 The study populations and design, as well as the investigated morphologic parameters of CNV, have varied among these studies and the value of these new biomarkers is yet to be evaluated. For a more homogeneous approach, we tried to incorporate both anatomical and functional outcomes, as well as treatment intervals to define “treatment response” in this study. The aim was to investigate the association between morphological characteristics of CNV membranes and anti-VEGF treatment response using qualitative and quantitative OCTA analyses, which may guide clinical decision-making in the management of neovascular AMD.
Methods
The study was approved by the Gazi University School of Medicine Ethics Committee (registration number: 275) and conducted in accordance with the Declaration of Helsinki. Patients under treatment with intravitreal anti-VEGF for neovascular AMD were recruited from March 2017 through April 2018. All the patients included in the study had a thorough ophthalmic assessment at primary presentation including conventional fluorescein and indocyanine angiography as needed, as well as a course of anti-VEGF treatment of at least 12 months. Exclusion criteria were presence of central geographic atrophy, subretinal fibrosis, significant media opacity, other ocular disease (such as diabetic retinopathy, glaucoma, pathologic myopia) that could cause decreased vision, evidence of polypoidal choroidal vasculopathy, history of previous treatment besides anti-VEGF (such as laser photocoagulation, photodynamic therapy, intravitreal steroids, vitrectomy), poor image quality of OCTA due to poor fixation. Patients’ characteristics were retrieved from the medical charts, including the age, sex, CNV type, and best corrected visual acuity (BCVA), fundoscopic and optical coherence tomography (OCT) findings at baseline and at each follow-up. All the patients were treated with a standard protocol of three initial monthly anti-VEGF injections using either ranibizumab (Lucentis®, Novartis AG) or aflibercept (Eylea®, Bayer HealthCare) followed by pro re nata–guided re-injections whenever signs for CNV activity (intraretinal or subretinal fluid in OCT, hemorrhage associated with the lesion, decrease in visual acuity) were observed. Patients were classified into “good responders” and “poor responders” based on functional and morphological aspects. A “good response” was defined as complete dissolvement of intraretinal or subretinal fluid on spectral domain optical coherence tomography (SD-OCT) after the loading phase, followed by injection interval of 4 months or more, and stable or increased BCVA during the entire follow-up. A “poor response” was defined as persistent exudation despite monthly treatment or recurrence within 2 months, along with deterioration of BCVA during the follow-up. All the cases in “poor response” group had been switched to other anti-VEGF agent following at least six consecutive monthly treatment without any improvement.
OCTA protocol
OCTA images were acquired on the day of anti-VEGF treatment using the RTVue XR Avanti with AngioVue (Optovue Inc, Fremont, CA, USA), with an A-scan rate of 70,000 scans per second, a light beam of 840 nm, and a bandwidth of 45 nm. Angioscans (3 mm × 3 mm and 6 mm × 6 mm) centered on the CNV membrane were obtained for each case, employing split-spectrum amplitude-decorrelation algorithm 16 and motion correction technology. 17 The software automatically subtracted projection artifacts using “reverse shadowing” effect of the retinal vessels. Depending on the CNV location, automatically generated outer retinal or choriocapillaris slab was reviewed, along with the corresponding B-scan, and manually adjusted by correcting the horizontal segmentation lines contoured to the retinal pigment epithelium (RPE) profile and slab thickness as necessary to best visualize the neovascular complex.
We evaluated previously described qualitative features of CNV membranes (in both 3 mm × 3 mm and 6 mm × 6 mm angioscans) based on vessel network density: 18 Lesions containing well-defined large-diameter vessels with low branching index were defined as loose network (LN); lesions with dense capillary sprouting containing small-diameter vessels resembling a net-like pattern as dense network (DN). The lesions that contain features of loose and dense network almost equally were described as mixed network. Qualitative assessments were independently performed by two investigators (E.O.Z. and G.G.). For discrepant cases, two graders met in open adjudication to reach consensus.
For the quantitative analysis, either 3 mm × 3 mm or 6 mm × 6 mm angioscan was used depending on the lesion size. None of the lesions exceeded the size of the scanned area. The lesion borders were delineated from the background using an open-source image processing FIJI software (ImageJ 2.0.0, imagej.net) and pixel measurements were converted to millimeters using the following equations: length (mm) = length (px) × 3/304 or 6/608 depending on the scan size. Then, a validated, publicly available software (AngioTool 0.5a, https://ccrod.cancer.gov/confluence/display/ROB2) was used to calculate the various morphological and spatial features of the vascular network (Figure 1). The software was introduced by Zudaire et al. 19 for the reproducible quantification of vascular networks in microscopic images and has been successfully used in quantitative assessment of CNV membranes in a recent study. 15 On opening an image, AngioTool identifies vascular configuration according to preset parameters such as vessel diameter and intensity. As the first approach, we used the same preset parameters for all the lesions and compared the resulting skeletonized image to the enface OCTA images. However, this approach caused segmentation of false negative and positive structures in some areas (Figure 2). Hence, we used a more individualized approach adjusting vascular diameter and intensity scales for each subject to obtain more accurate segmentation. The images were further fine-tuned by elimination of small particles and optimization of the fill holes function until the outline overlay matches the best with the vessels in the displayed image. Following features were computed: overall size of the vascular complex (explant area); total area covered by vessels within the complex, which corresponds to the area showing flow signal on OCTA (vessel area); vessel length; junction density (number of junction points/unit area) that provides a measurement of the sprouting activity; and lacunarity that characterizes lesion non-uniformity, with higher values resembling a more heterogeneous vascular structure. For further information, the reader is referred to the publication by Zudaire et al. 19
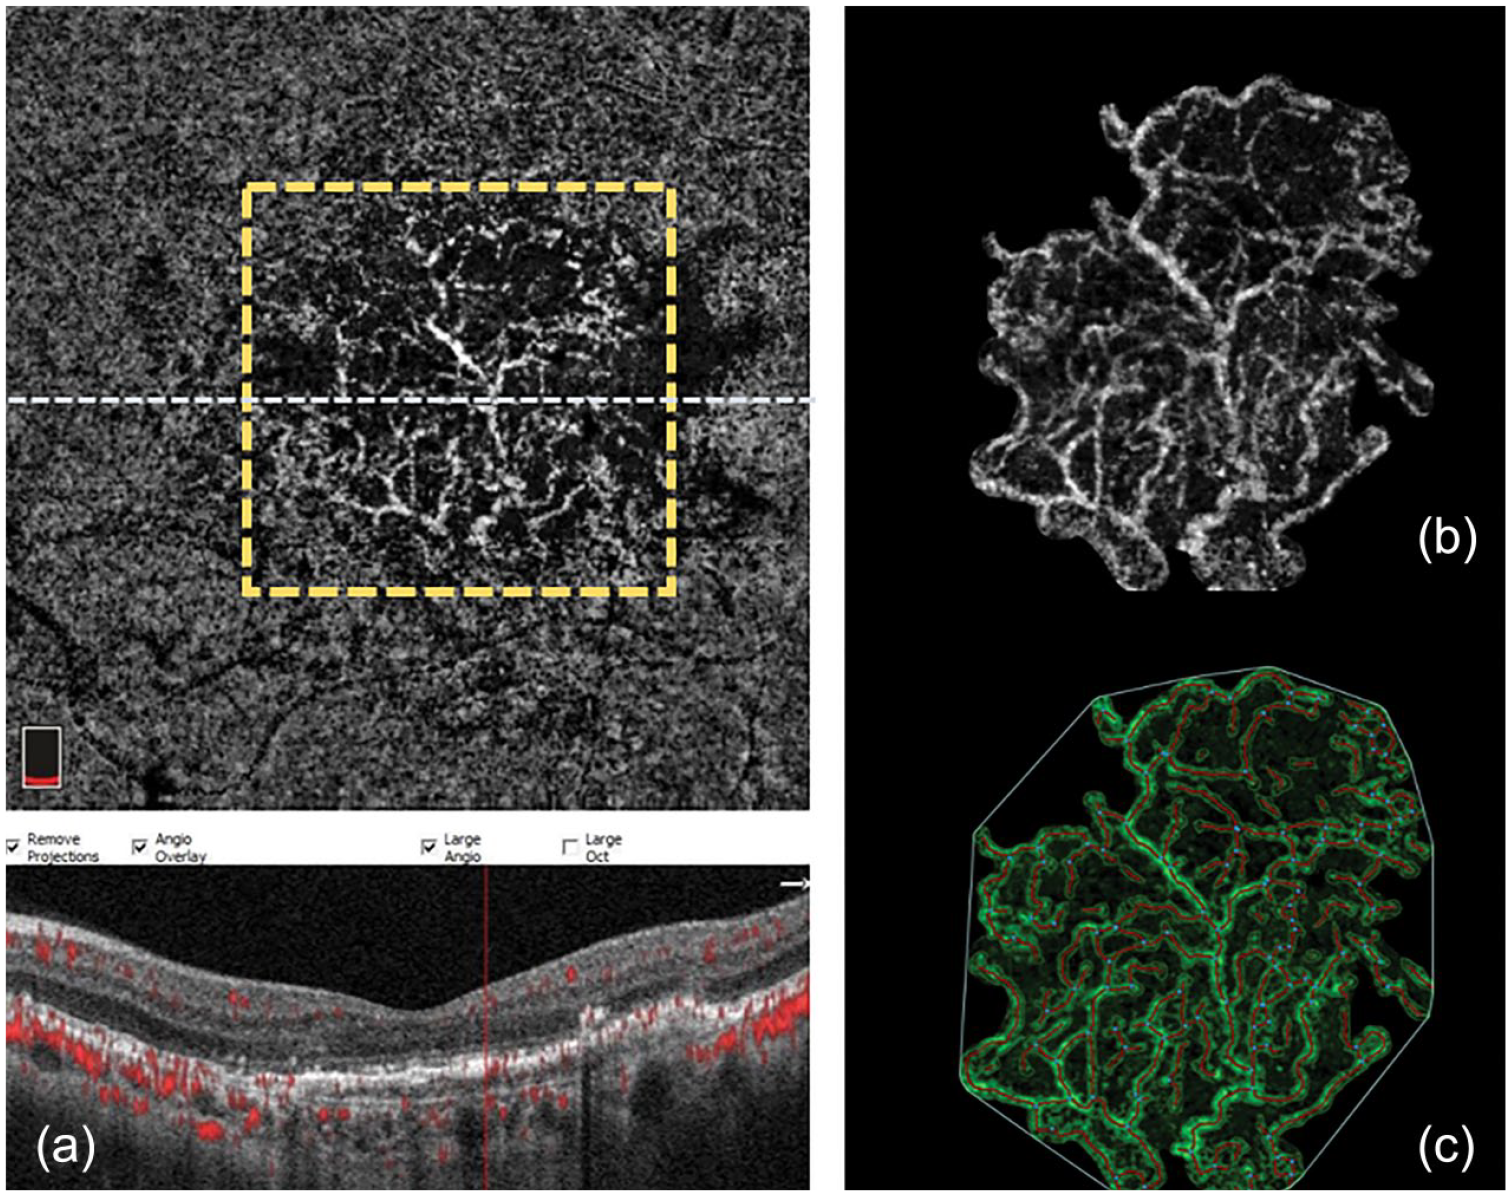
Steps of the image postprocessing for the quantitative analysis (a). Manually segmented enface OCT angiogram with corresponding B-scan. The dashed white line indicates the position of the B-scan cross-section below and the yellow square outlines the area shown in (b, c). (b) Delineation of the boundaries of the neovascular lesion. (c) Reconstruction of the lesion with the AngioTool software: the outline of the vasculature is shown in green; the skeleton representation of vasculature is shown in red and branching points are blue.
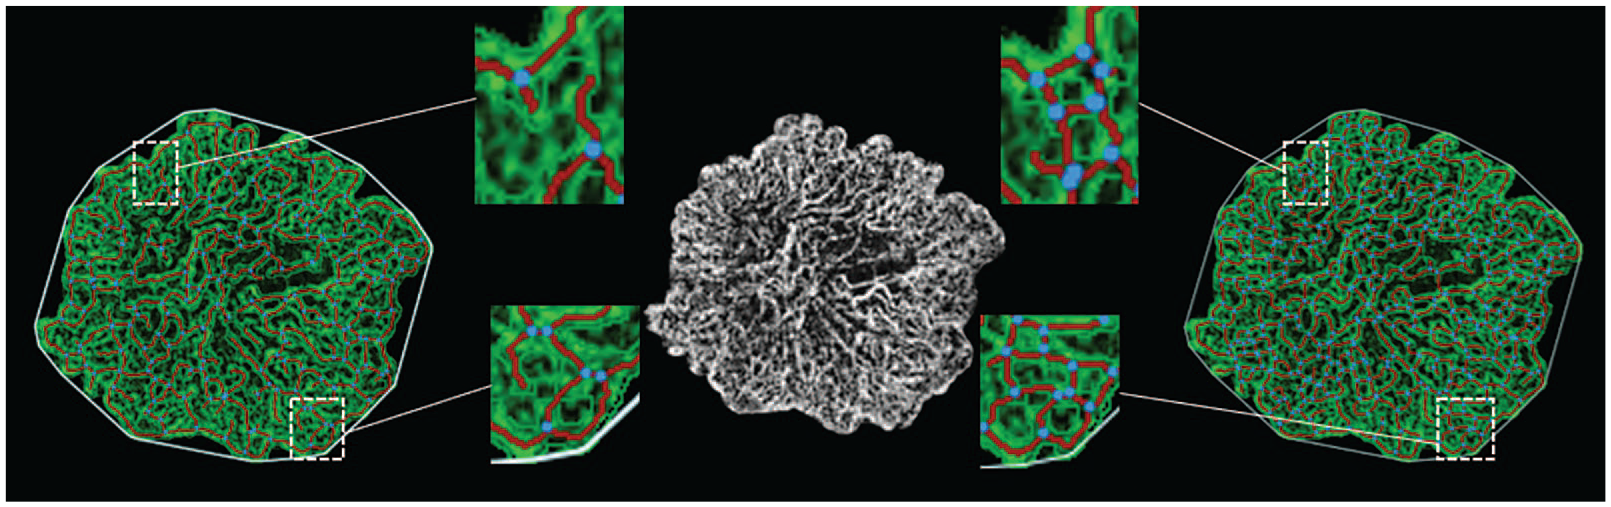
An example of dense vascular network (middle); vascular configuration was built with AngioTool according to the pre-set parameters (left) or after careful optimization (right). A few examples of missed vessels and junctions in the non-optimized skeleton are seen.
Statistical analysis
Statistical analyses were performed with IBM SPSS Statistics v22.0 (SPSS Inc., Chicago, Illinois, USA) and statistical significance was set at p < 0.05 (two sided). Snellen BCVA results were converted to logarithm of minimal angle of resolution (logMAR) values. Continuous data, tested for normality using the Shapiro–Wilk test, were expressed as mean ± standard deviation (SD) if normally distributed and as median values with ranges if not normally distributed. Depending on the normality, independent samples t-test or Mann Whitney U test were used to compare continuous data between the good and poor responders. Pearson chi-square and Fisher’s exact tests were used for categorical data. To ascertain the reproducibility, quantitative analyses were independently performed by two investigators (E.O.Z. and G.G.) and intraclass correlation coefficient (ICC), along with 95% confidence intervals, was calculated for each parameter. The ICC scores were based on a single-rating, absolute agreement, two-way mixed-effects model and interpreted using ranges suggested by general guidelines: 20 <0.5, poor; 0.5–0.75, moderate; 0.75–0.9, good, and values greater than 0.90 excellent agreement.
Results
Forty-one eyes of 41 patients were included in the study, 22 in the “good responder” group and 19 in the “poor responder” group. All the patients were treatment-naïve at presentation. The average duration from the initiation of anti-VEGF treatment to OCTA examination was 41 months (range: 12–89 months) with a median of nine injections (range: 3–24) for the good responders and 44.5 months (range: 12–84 months) with a median of 26 injections (range: 11–46) for the poor responders. Good responders received injections every 5.3 (±1.19) months on average, whereas poor responders had treatment every 1.15 (±0.18) months. There were no significant differences between the groups in terms of age, sex, duration of treatment, CNV type, baseline BCVA, baseline central foveal thickness, and choroidal thickness (p > 0.05). Angiographically measured baseline lesion size was 2.7 times larger in the poor responders compared to good responders (p = 0.035) (Table 1).
Baseline patient characteristics.
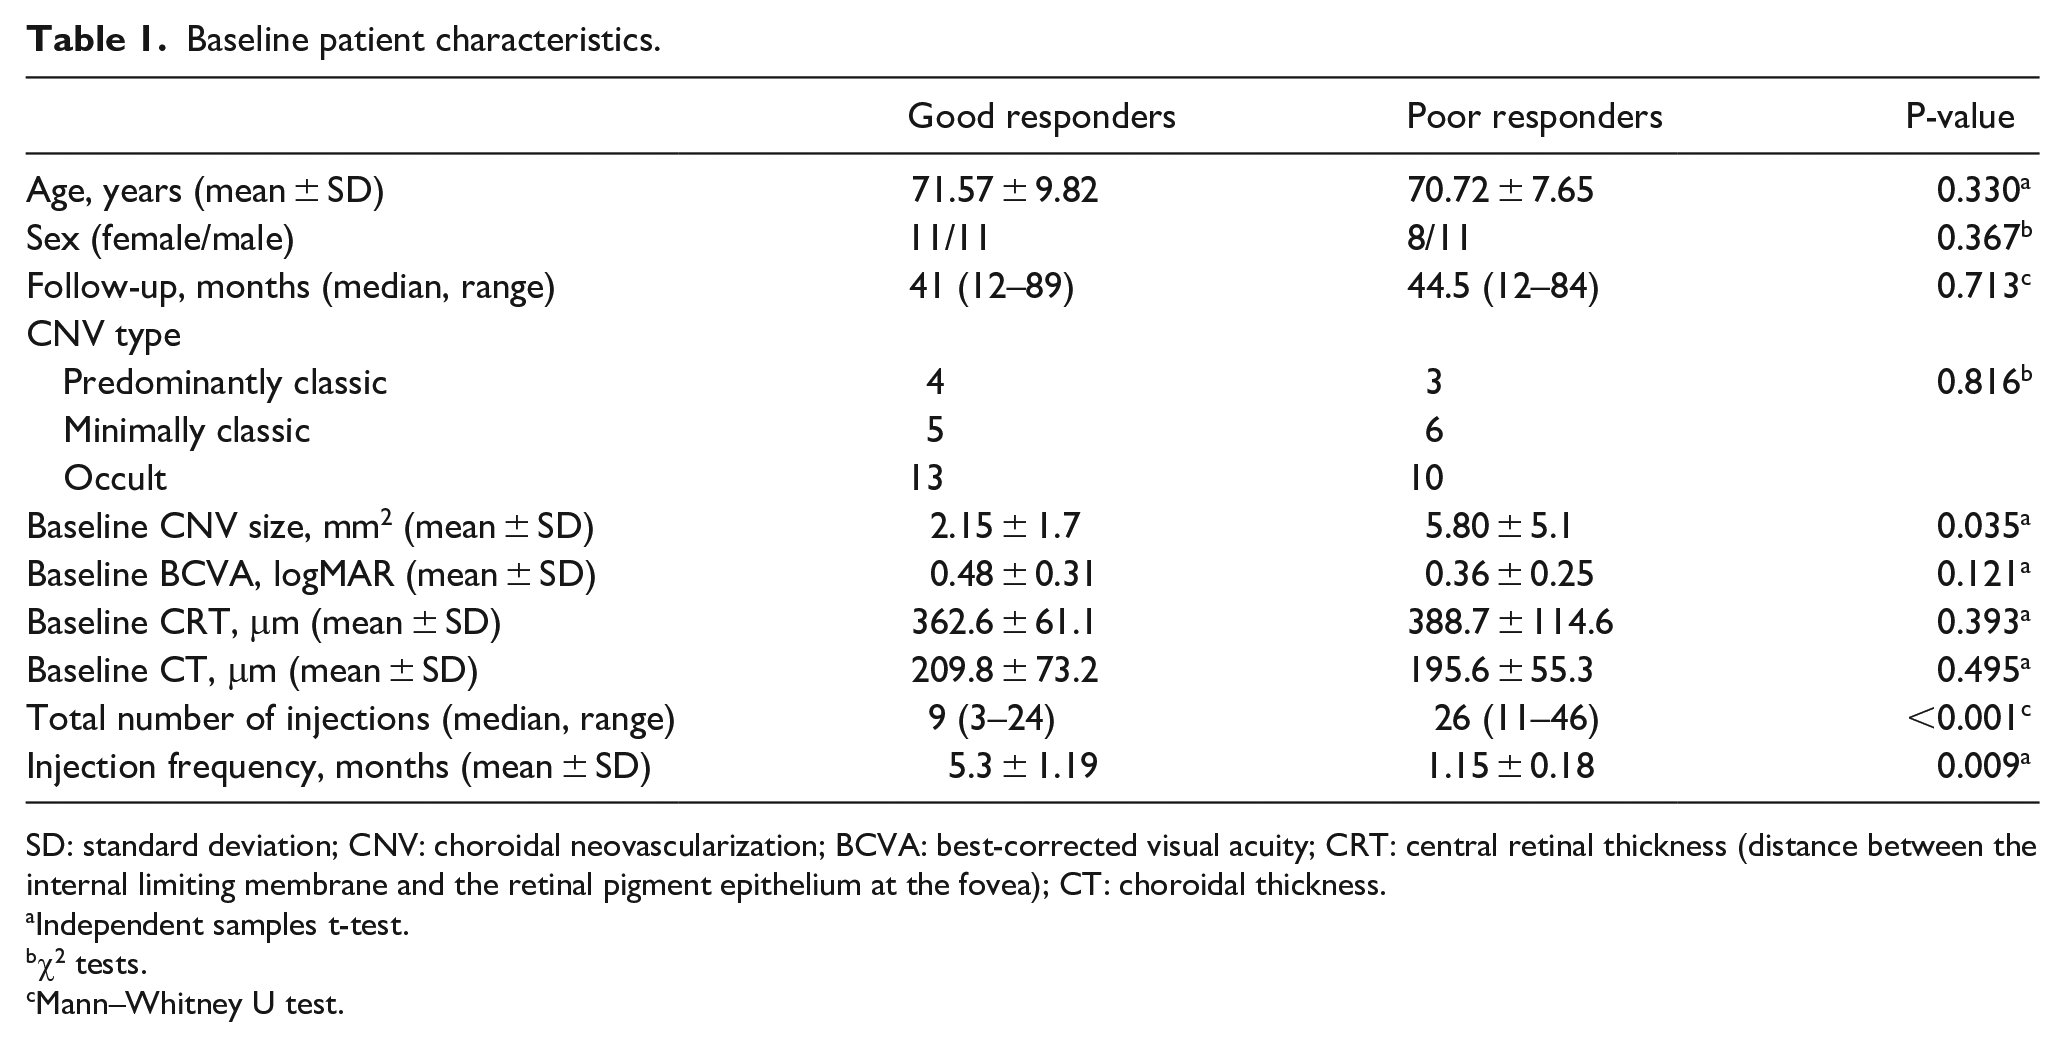
SD: standard deviation; CNV: choroidal neovascularization; BCVA: best-corrected visual acuity; CRT: central retinal thickness (distance between the internal limiting membrane and the retinal pigment epithelium at the fovea); CT: choroidal thickness.
Independent samples t-test.
χ2 tests.
Mann–Whitney U test.
Qualitative findings
Five of the 22 eyes (22.7%) in the good responder group had a DN pattern, 10 (45.5%) had an LN pattern, and 7 (31.8%) had a mixed pattern. Of the 19 eyes in the poor responder group, nine (47.7%) had a DN pattern, six (31.1%) had an LN, and four (21.1%) had a mixed pattern. The differences between the groups were not statistically significant (p = 0.25).
Quantitative findings
The intergrader reproducibility showed good to excellent agreement for all the quantitative parameters with ICC values ranging between 0.85 and 0.95 (Supplementary Table). The lesion area was about 1.7 times, and the vessel area was about 2.3 times larger in the poor responder group compared to the good responder group (p = 0.04, p = 0.002, respectively). Junction points were significantly higher among the poor responders; however, junction density did not differ significantly between the groups (p = 0.35). Average lacunarity was significantly higher in the good responders than the poor responders (p = 0.018). Table 2 shows the quantitative results in detail. Figure 3 represents an example of a lesion with high lacunarity.
Results of the quantitative analysis.
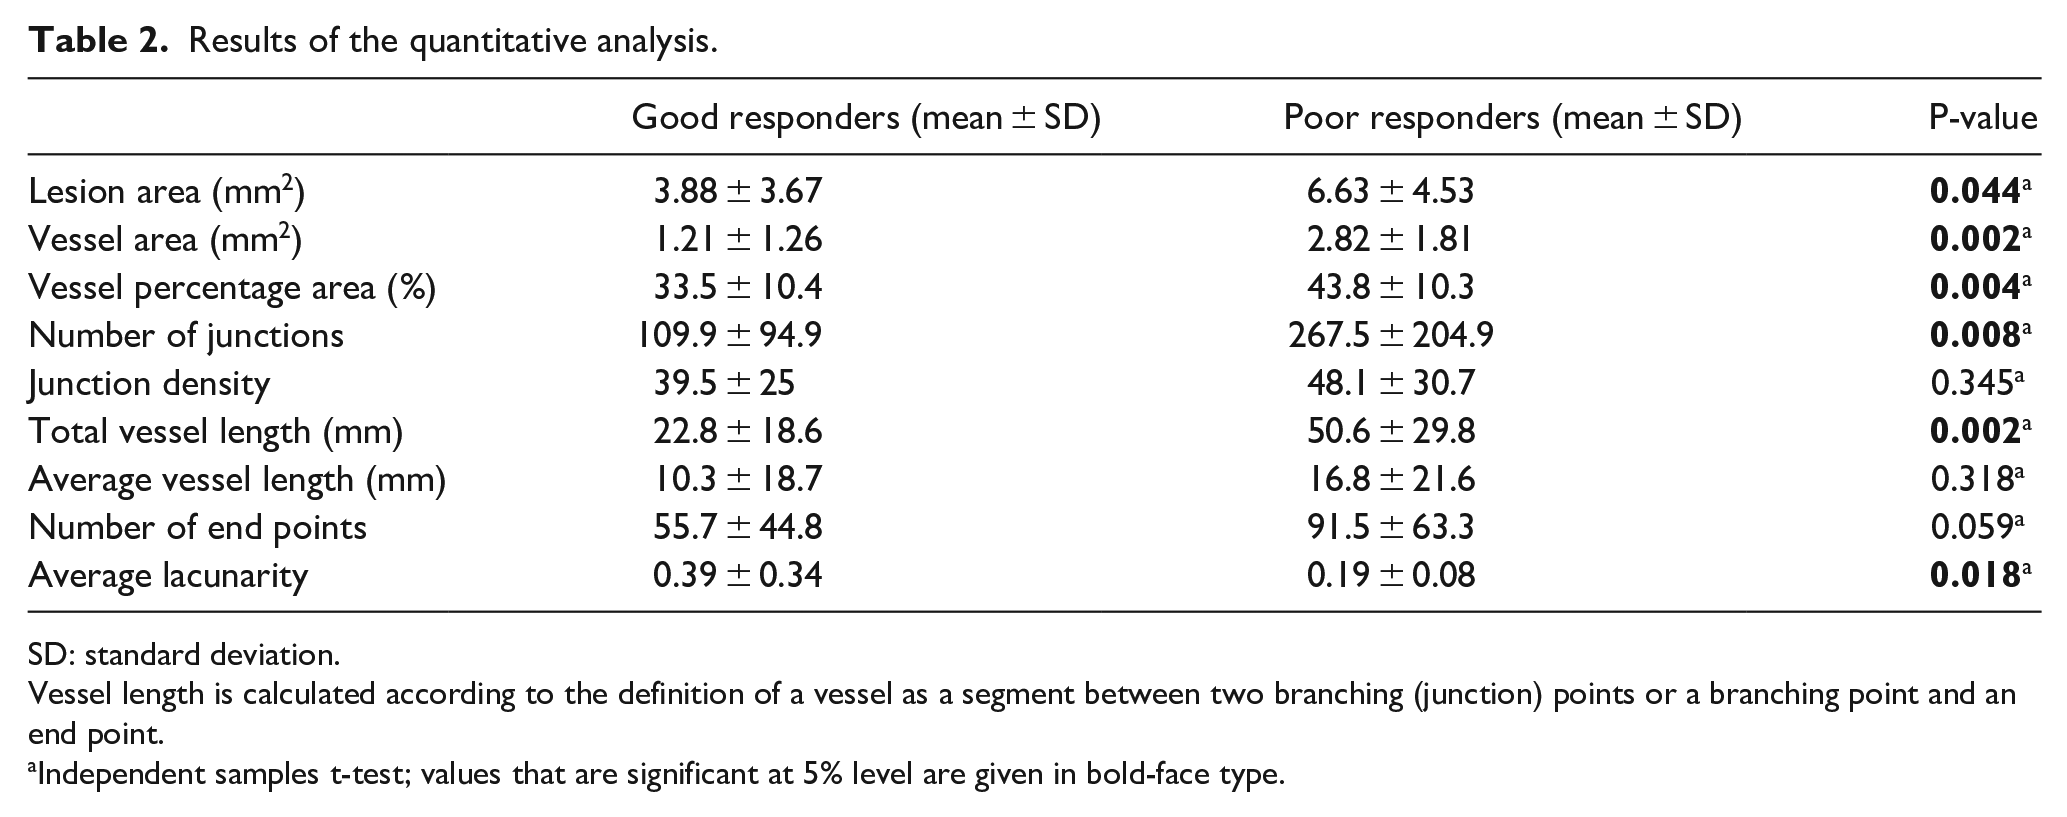
SD: standard deviation.
Vessel length is calculated according to the definition of a vessel as a segment between two branching (junction) points or a branching point and an end point.
Independent samples t-test; values that are significant at 5% level are given in bold-face type.
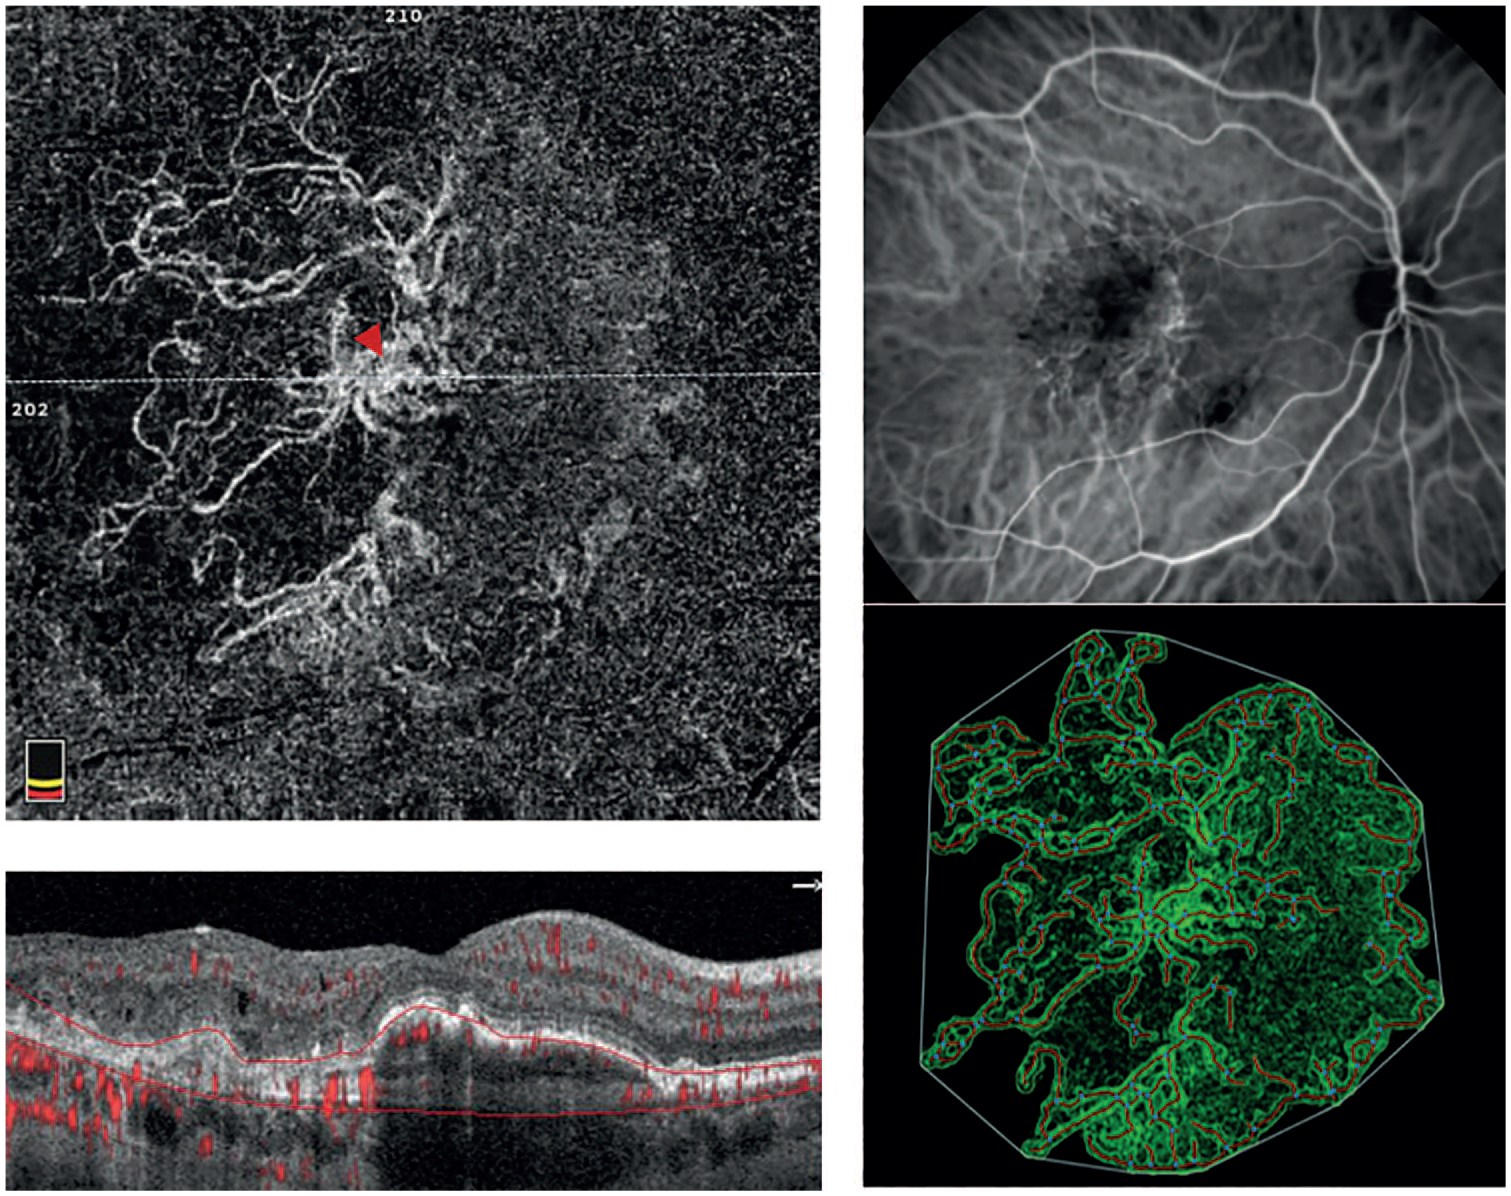
Multimodal imaging and result image after quantitative analysis of a 68-year-old female patient in good responder group who had been treated with a total of eight ranibizumab injections during a 36-month follow-up period. Note the highly heterogeneous structure of CNV, with a prominent central vessel (arrow head) and dilated centrifugally radiating vessels forming loops at the periphery of the lesion. The neovascular vessels seem to have partially regressed, especially in the nasal half of the lesion, leaving hollow-like structures inside the CNV lesion and the absence of branching tiny vessels is observed.
Discussion
In this study, we aimed to describe long-term remodeling characteristics of CNV that may be associated with treatment response in eyes undergoing antiangiogenic therapy. Previous studies based on OCTA have shown that microvascular properties of CNV membranes undergo transformation by anti-VEGF treatment. Spaide 21 hypothesized that receiving periodic anti-VEGF treatment leads to “vascular abnormalization” characterized by recurrent pruning of vascular sprouts that results in increased flow through the remaining trunk vessels leading to arteriogenesis with increased vascular diameter. Lumbroso et al. 22 confirmed this by demonstrating loss of small vessels after each anti-VEGF injection and associated strengthening of the trunk. It has been noted that the trunk vessels have a different structure than the surrounding finer plexus. While mature trunk vessels with adequate pericyte coverage become less leaky and more resistant to anti-VEGF therapy, newly forming finer plexus lacking a pericyte cover continues to leak and gets pruned in each treatment cycle.23–26 Sulzbacher et al. 18 observed similar findings of arteriogenesis in a mixed population of treatment naïve and continuously treated eyes and suggested that the disease activity can be assessed by determining the amount of focal vascular sprouting at the edge of the lesion. The authors used a classification system based on vascular growth behavior where loose nets described as mature lesions related with longer disease duration and dense nets showing higher proliferative activity associated with more leakage and shorter disease duration. Adopting this system, we observed that good responders had predominantly loose type neovascular lesions (45.5%), whereas poor responders mostly had dense nets (47.7%). Although the difference between the groups was not statistically significant, it is noteworthy that in both groups, a significant proportion of CNV lesions included mixed type lesions composed of both fine sprouts and large vessels (varying between 21% and 32%). Hence, we continued our study with quantitative and more objective analysis in order to better identify the features of mixed lesions and to detect subtle differences in lesion composition that may not have been detected by subjective qualitative analyzes. Several morphometric parameters were calculated including the vascular network size, total and average vessel length, junction density (i.e. branching index), and lacunarity. Junction density is a quantitative measure of angiogenic sprouting activity, and lacunarity is an index of vascular non-uniformity provided by AngioTool software using a box-counting algorithm. Higher lacunarity reflects a non-uniform and heterogeneous vessel organization, whereas lower lacunarity reflects a more homogeneous vascular structure. If we interpret the qualitative observations of vascular maturation 21 into quantitative findings, we may expect an increase in lacunarity with antiangiogenic treatment as the small sprouts regress and CNV transforms into a more heterogeneous structure with hollows inside. Moreover, the junction density may be expected to decrease in parallel with the decrease in the sprouting activity. We observed significantly higher lacunarity values in the good responder group compared to poor responders (p = 0.018). Conversely, lower lacunarity values were found in eyes with poor response, indicating a delay in vascular stabilization and maturation. Junction density was slightly higher in the poor responders than good responders (48.1, 39.5, respectively); however, the difference was not statistically significant (p = 0.35). Nevertheless, it is unclear whether sprouting vessels could be detected comprehensively due to reduced flow velocity. The possibility of capillaries being present, but not visualized within the lesions may be responsible for nonsignificant results regarding junction density. Another reason may be the small sample size.
A previous study by Roberts et al., 15 that investigated quantitative OCTA parameters by AngioTool in a population of previously treated eyes, found no association between any of the CNV features and the treatment response. The authors supported the “vascular normalization” hypothesis, arguing that neovascular vessels with abnormal shape at the beginning may have reached a more normal form with equilibrium of antiangiogenic and proangiogenic factors independent of the treatment frequency, and therefore appear to be similar. In contrast, our findings support the “vascular abnormalization” hypothesis suggested by Spaide. 21 Although the disease duration was similar to ours (58-month history of CNV), different approaches used in the qualification of treatment response may explain the different outcomes. Unlike our study, where anatomic and functional outcome measurements as well as treatment intervals were assessed, Roberts et al. 15 defined response groups using the length of treatment interval (treated less or more frequently than 6 weeks) as the only criterion.
In our series, poor responders had larger and less lacunar lesions than good responders. Both qualitative and quantitative analyses showed the presence of a slightly higher percentage of thin branches in the poor responder group as well, although the difference did not reach significance. These findings suggest that even if the smaller branches are lost to some point in the chronically treated CNV in both groups, the larger space they occupy (large lesion size) and the more uniform placement of the remaining vessels (low lacunarity) may contribute to the development of frequent exudation in the poor responders. Larger lesion size is a well-known factor that has been associated with poorer response to therapy.3,6,7,27 Confirming this, a recent study 28 that investigated three-dimensional structure of neovascular lesion using OCTA found out that eyes requiring more frequent injections had significantly greater distance between Bruch’s membrane and highest CNV flow signal. The authors concluded that lesions that flatten into a more planar structure require less treatment over time, whereas CNV membranes that change into a more complex, multilayered structure require more frequent injections. We observed that poor responders had significantly larger lesion area at baseline and at the end of the follow-up. Although the findings presented here are based on two-dimensional enface images and direct comparison is not possible, a similar growth pattern where neovascular lesions expand three dimensionally rather than on a single plane may be expected. In addition to larger lesion size, poor responders had low lacunarity values, indicating a more homogeneously filled space within the neovascular structure. Conversely, good responders had higher lacunarity with regression of neovascular structures in part, leaving a less homogeneously filled space within the lesion. Even though these observations show the results of changing morphology after antiangiogenic treatment, it is arguable whether the vascular pattern contributes to the survival of the neovascular lesion as well, creating a vicious cycle. Previous studies showed that CNV membranes possess one or several choroidal feeder vessels. 29 In one histopathologic study, more than half the eyes had two or more sources of CNV. 30 These vessels were identified as the potential source of lesion growth and feeder vessel closure, using thermal photocoagulation, was used to shut down the perfusion of the CNV with subsequent resolution of leakage and regression of the lesion. 31 Theoretically, uniform and homogeneous vascular structure of CNV may be expected to prevent its regression by facilitating its own internal circulation, as well as its perfusion from the surrounding choroid. Moreover, the presence of multiple feeder vessels may have a role in the maintenance of neovascular network perfusion despite regular therapy. However, current knowledge regarding the behavior of feeding vessels (i.e. number, diameter, flow) and CNV perfusion is still lacking. These points may be elucidated by further development of OCT and swept-source technologies that would allow better visualization of the choroid and ease the identification of feeder vessels and CNV perfusion patterns.
The authors are aware of the limitations of this study including its retrospective design. Due to the new introduction of OCTA into clinical use, we were to examine the appearance of CNV in previously treated eyes to assess the features related to the long-term treatment response. To overcome this limitation to some point, we meticulously reviewed the patient records in each visit considering both functional and morphological response parameters and regular treatment intervals. In addition, we included the evaluation of the prognostic factors previously defined in the literature6,32,33 in an aim to better explain the results of cross-sectional OCT analysis in different response groups. Baseline patient and ocular characteristics were similar between the groups except that the lesion size was found to be one of the most important parameters negatively affecting the response in accordance with the literature.6,32,34 Despite limitations, the use of an objective and quantitative analysis method in the examination of neovascular structures and the ability to reveal small differences that cannot be determined by merely qualitative analysis are the most important strengths of the study. This approach may allow OCTA to be used as a marker of vascular stabilization and help clinicians determine the optimal follow-up and treatment strategies for each patient.
To conclude, long-term remodeling of chronically treated CNV showed signs of vascular abnormalization as described by Spaide. 21 This process of vessel maturation seems to be delayed in the poor responder group, which may be attributed to larger lesion sizes. To quantify this, lacunarity index can be used as a measure of vessel maturation. Prospective studies including baseline OCTA features of treatment-naive CNV membranes are warranted in order to validate the results and to obtain reference values for the follow-up of the lesions.
Supplemental Material
Supplementary_Table – Supplemental material for Optical coherence tomography angiography markers associated with treatment response in neovascular age-related macular degeneration
Supplemental material, Supplementary_Table for Optical coherence tomography angiography markers associated with treatment response in neovascular age-related macular degeneration by Ece Ozdemir Zeydanli and Gokhan Gurelik in European Journal of Ophthalmology
Footnotes
Declaration of conflicting interests
The author(s) declared no potential conflicts of interest with respect to the research, authorship, and/or publication of this article.
Funding
The author(s) received no financial support for the research, authorship, and/or publication of this article.
Supplemental material
Supplemental material for this article is available online.
References
Supplementary Material
Please find the following supplemental material available below.
For Open Access articles published under a Creative Commons License, all supplemental material carries the same license as the article it is associated with.
For non-Open Access articles published, all supplemental material carries a non-exclusive license, and permission requests for re-use of supplemental material or any part of supplemental material shall be sent directly to the copyright owner as specified in the copyright notice associated with the article.