
Abstract
Objective
Obstructive sleep apnea syndrome has been identified as a possible risk factor for optic nerve pathology such as glaucoma, nonarteritic ischemic optic neuropathy, and optic disk edema. Accordingly, we aimed to evaluate structural changes of the apparently normal optic nerve in obstructive sleep apnea syndrome patients with effects of its severity.
Materials and methods
In this prospective case–control study, 47 eyes of 47 obstructive sleep apnea syndrome patients diagnosed with polysomnography and 40 eyes of 40 healthy subjects were included. Spectral-domain optical coherence tomography was used to evaluate the peripapillary retinal nerve fiber layer thickness, optic nerve head topographic parameters, and retinal ganglion cell-inner plexiform layer thickness.
Results
The average peripapillary nerve fiber layer thickness was lower in obstructive sleep apnea syndrome patients than in controls (90.74 ± 7.98 vs 94.93 ± 6.13 μm; p = 0.008). The average cup/disk ratio and the vertical cup/disk ratio in patients with OSAS were significantly higher compared to the controls (both p < 0.001). However, no significant difference in retinal ganglion cell-inner plexiform layer thickness was found.
Conclusion
Even if the retinal ganglion cell-inner plexiform layer thicknesses did not significantly differ between the obstructive sleep apnea syndrome and control groups, obstructive sleep apnea syndrome patients showed a decreased peripapillary nerve fiber layer thickness and increased optic nerve head parameters. These findings can be used as an indicator of optic nerve damage in the early diagnosis of obstructive sleep apnea syndrome patients.
Keywords
Introduction
Obstructive sleep apnea syndrome (OSAS) is a disorder characterized by recurrent episodes of upper respiratory tract obstructions during sleep. The prevalence of OSAS is 2%–5% in the middle-aged population, and the symptoms are chronic fatigue, excessive daytime sleepiness, and decreased cognitive abilities. 1 Several studies have reported that OSAS was also associated with ophthalmic disorders, including floppy eyelid syndrome, optic disk edema, central serous chorioretinopathy, and glaucoma.2,3 An increased incidence of glaucoma in patients with OSAS has similarly been reported in previous studies.4,5 The relationship between OSAS and these disorders is not fully understood, but it is generally accepted to be due to hypoxemia, vascular dysregulation, and increased sympathetic activity. 6 There is acute and long-term sympathoexcitation, compatible with increased vascular tone due to the release of circulating hormones with vascular actions including catecholamines, atrial natriuretic peptide, angiotensin II, and arginine vasopressin. 7 In addition, frequent episodes of nocturnal hypoxemia during sleep may induce a risk of optic nerve hypo-perfusion and decreased oxygenation, ultimately leading to optic neuropathy. Furthermore, it has been suggested that the retinal nerve fiber layer (RNFL) was thinner in severe OSAS cases and these changes were directly correlated with the severity of OSAS. 8
Spectral domain-optical coherence tomography (SD-OCT) provides reproducible, high-resolution, cross-sectional imaging of the RNFL and optic nerve head (ONH) topography. In addition, Mwanza et al. 9 reported that the ability of macular ganglion cell-inner plexiform layer (GCIPL) parameters to discriminate normal eyes and eyes with early glaucoma were high and comparable to that of the best peripapillary RNFL and ONH parameters. In this study, we aimed to evaluate the peripapillary RNFL thickness, ONH parameters, and macular GCIPL thickness, which has been previously assessed in very few studies and may help in understanding of the optic nerve damage. We also aimed to detect the effects of OSAS severity on these structural parameters using SD-OCT.
Materials and methods
Study population and design
This prospective case–control study was conducted at Dünyagöz Eye Hospital, Department of Ophthalmology, and Sureyyapaşa Thoracic Diseases and Thoracic Surgery Hospital Sleep Disorders Center from May 2013 to April 2015. The study protocol was approved by the local ethics committee and complied with the Declaration of Helsinki. Patients who were diagnosed as having OSAS were properly informed and their written consent was received.
The subjects were classified into two groups, as the OSAS group and the control group. Forty-seven patients with newly diagnosed OSAS who had an apnea-hypopnea index (AHI) >4 events per hour were consecutively recruited. Forty healthy individuals who were admitted to our department for a routine eye examination were recruited as control subjects. The control group was selected using a self-administered questionnaire that collected information from healthy individuals without symptoms of sleep-related breathing disorders such as loud snoring, observed apnea, and excessive daytime sleepiness. In addition, the OSAS group was divided into two subgroups based on the AHI values as follows: 23 patients with scores ≤30 (mild/moderate) and 24 patients with scores >30 (severe).
The inclusion criteria for both the OSAS and control groups were as follows: best corrected visual acuity (BCVA) score >6/12, refractive defect ±3 diopter (spherical equivalent value), and intraocular pressure (IOP) of 21 mmHg or lower were included in the study. Patients with a history of glaucoma, severe ocular trauma, chronic uveitis, optic neuropathy, retina-choroid disease, intraocular or refractive surgery, or any ocular or neurologic disease that could affect the ONH or RNFL were excluded from the study.
Examination protocol and measurements
Each subject underwent a comprehensive ophthalmic evaluation, including visual acuity (VA) measurement, slit-lamp examination, refraction, IOP measurement using Goldmann applanation tonometry, and dilated fundus examination. The central corneal thickness was measured using a Pentacam Scheimpflug (Oculus Inc., Wetzlar, Germany). The visual field (VF) examination was performed using a Humphrey Field Analyzer 750i (Humphrey Systems Inc., Dublin, California, USA). Axial lengths were measured using an ocular biometer (IOL Master; Carl Zeiss Meditec Inc.).
Polysomnography (PSG): all patients with OSAS underwent full-night PSG (Natus—Grass Technologies, Comet Plus, West Warwick, Rhode Island, USA), during which body parameters were recorded using the following: electrocardiogram; central, temporal, and occipital electroencephalogram; bilateral electro-oculogram; submental and anterior tibialis electromyogram; nasal air flow (using a nasal cannula and pressure transducer); naso-oral air flow (using a thermistor); and respiratory effort (using chest and abdominal piezoelectric belts). Oxygen saturation (SpO2) was monitored using pulse oximetry. Apneas were defined in compliance with the international standards established in a report by the American Academy of Sleep Medicine Task Force published in 1999. 10 The number of apneas and hypopneas per hour of sleep was calculated to obtain the AHI.
OCT examination procedure: all eye examinations were performed using SD-OCT (Cirrus; Carl Zeiss Meditec, Dublin, California, USA). After pupil dilatation, the optical disk cube (200 × 200) protocol and the macular cube (512 × 128) protocol were applied for the peripapillary and macular examinations using the Cirrus HD-OCT. The RNFL thickness and ONH topographic parameters were measured with peripapillary scanning. The macular GCIPL thickness was measured with macular scanning, using the GCA algorithm. Of the signal strength screening scores 1–10, those with 7 or more were considered for the study. Patients with signal strength <6, movement (blinking and tremble), flying particles on the vitreous, or artifacts due to other reasons or images associated with algorithm segmentation insufficiency were excluded.
Mean outcome measures
The following data were used for analyses: GCIPL thicknesses (average, minimum, and sector quadrant (superior, superior nasal, superior temporal, inferior, inferior nasal, inferior temporal)); RNFL thickness (average, quadrants (temporal, superior, nasal, inferior)); and ONH topographic parameters (average cup/disk (C/D) ratio, vertical C/D ratio, cup volume, rim area).
Statistical analyses
The SPSS statistical software version 18.0 for Windows (SPSS, Inc., Chicago, Illinois, USA) was used for statistical analysis. The data are expressed as means ± standard deviation for continuous variables. One randomly selected eye from each participant was used for statistical analysis. Student’s t-test and a simple Chi-square test were performed for comparisons between the OSAS and control groups. The OSAS groups were compared with the control group according to disease severity data using one-way analysis of variance (ANOVA). Differences with a value of p < 0.05 were considered statistically significant.
Results
Demographic results
Fifty patients with OSAS who were included in the study were later excluded due to past intraocular surgery, pigmentary retinopathy, and diabetic retinopathy. Forty-seven patients who met the study criteria were included in the study.
The demographic and clinical data of the groups are shown in Table 1. In all, 47 eyes of 47 patients with OSAS (11 women, 36 men) and 40 eyes of 40 control subjects (15 women, 25 men) were included in the study (p = 0.15). The mean age was 46.0 ± 10.7 years in the control group and 47 ± 9.9 years in the OSAS group (p = 0.55). No significant differences were found between the OSAS and control groups in terms of IOP, central corneal thickness (CCT), axial length (AL), mean deviation (MD), and pattern standard deviation (PSD; p = 0.40, p = 0.63, p = 0.53, p = 0.64, and p = 0.71 respectively). Body mass index (BMI) was significantly lower in the control group compared with the OSAS group (p < 0.001).
Demographic characteristics and clinical data of control and patients with OSAS.
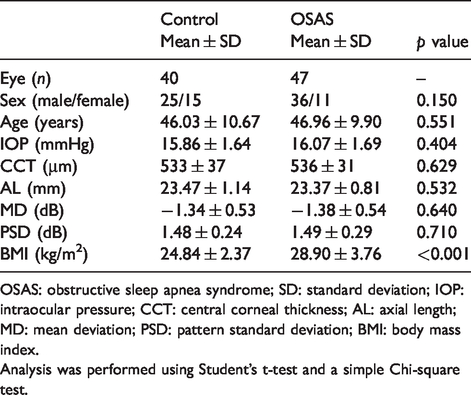
OSAS: obstructive sleep apnea syndrome; SD: standard deviation; IOP: intraocular pressure; CCT: central corneal thickness; AL: axial length; MD: mean deviation; PSD: pattern standard deviation; BMI: body mass index.
Analysis was performed using Student’s t-test and a simple Chi-square test.
SD-OCT findings
Table 2 shows a comparison of the OCT values of the OSAS and control groups. The average RNFL thickness in the patients with OSAS was lower than that of the control group (p = 0.008). The average C/D ratio and the vertical C/D ratio in the patients with OSAS were 0.43 ± 0.16 and 0.42 ± 0.15, respectively. The average C/D ratio and the vertical C/D ratio in the patients with OSAS were significantly higher than in the control group (p = 0.001 for both).
Comparison of macular GCIPL thickness and optic nerve head data in the controls and patients with OSAS.
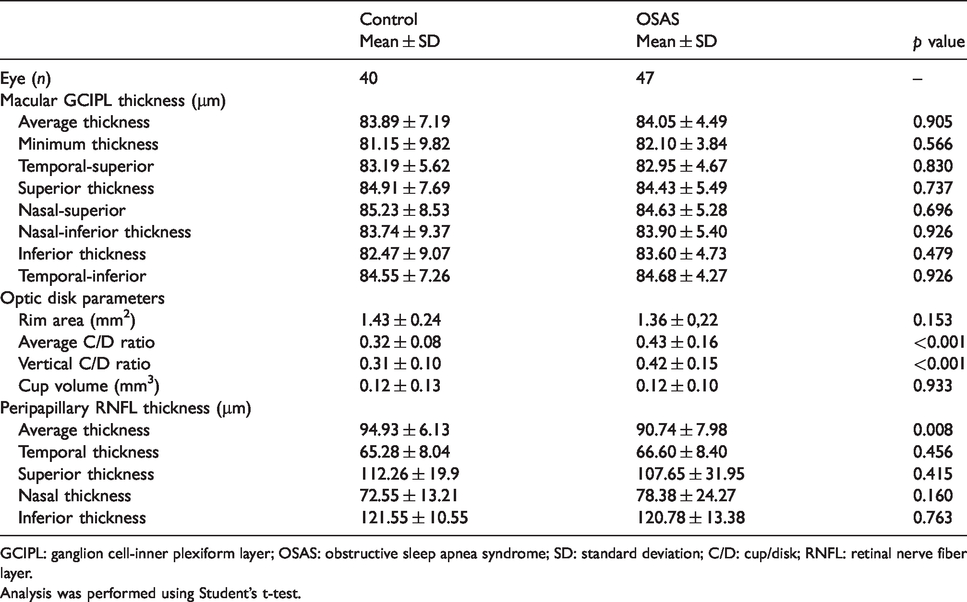
GCIPL: ganglion cell-inner plexiform layer; OSAS: obstructive sleep apnea syndrome; SD: standard deviation; C/D: cup/disk; RNFL: retinal nerve fiber layer.
Analysis was performed using Student’s t-test.
Table 3 shows the comparison of the patients with OSAS in terms of disease severity. A significant difference was found between the mild/moderate and severe OSAS groups in terms of the lowest oxygen saturation during sleep (SpO2; p = 0.016), and oxygen desaturation index (ODI; p < 0.001). No statistically significant difference was found between the two groups in terms of BMI (p = 0.87) and the mean SpO2 (p = 0.93).
Comparison of polysomnographic data in patients with OSAS according to disease severity.
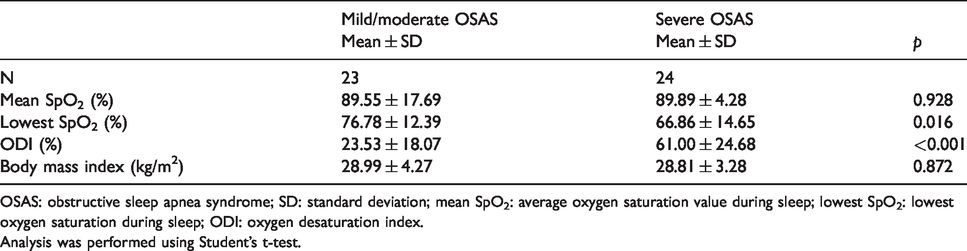
OSAS: obstructive sleep apnea syndrome; SD: standard deviation; mean SpO2: average oxygen saturation value during sleep; lowest SpO2: lowest oxygen saturation during sleep; ODI: oxygen desaturation index.
Analysis was performed using Student’s t-test.
Table 4 shows the OCT measurement comparisons in the mild/moderate group, patients with severe OSAS, and the control group. No statistically significant difference was found between the groups in terms of macular thickness and macular GCIPL (p > 0.05 for both; Figures 1 and 2). The post hoc pairwise comparison showed significant differences in the average C/D ratio, vertical C/R ratio, and average RNFL thickness between the control subjects and the patients with mild/moderate and severe OSAS (p = 0.001, p = 0.001, p = 0.031, respectively), whereas no difference was found between the mild/moderate and severe OSAS groups (p = 0.65, p = 0.90, p = 0.61, respectively).
Comparison of GCIPL and ONH data in the controls and patients with OSAS according to disease severity.
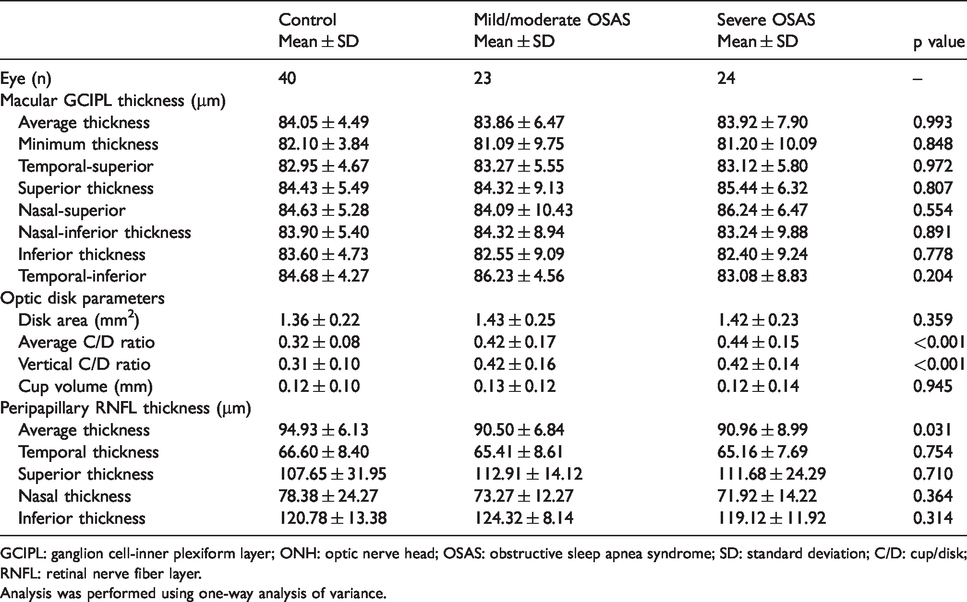
GCIPL: ganglion cell-inner plexiform layer; ONH: optic nerve head; OSAS: obstructive sleep apnea syndrome; SD: standard deviation; C/D: cup/disk; RNFL: retinal nerve fiber layer.
Analysis was performed using one-way analysis of variance.
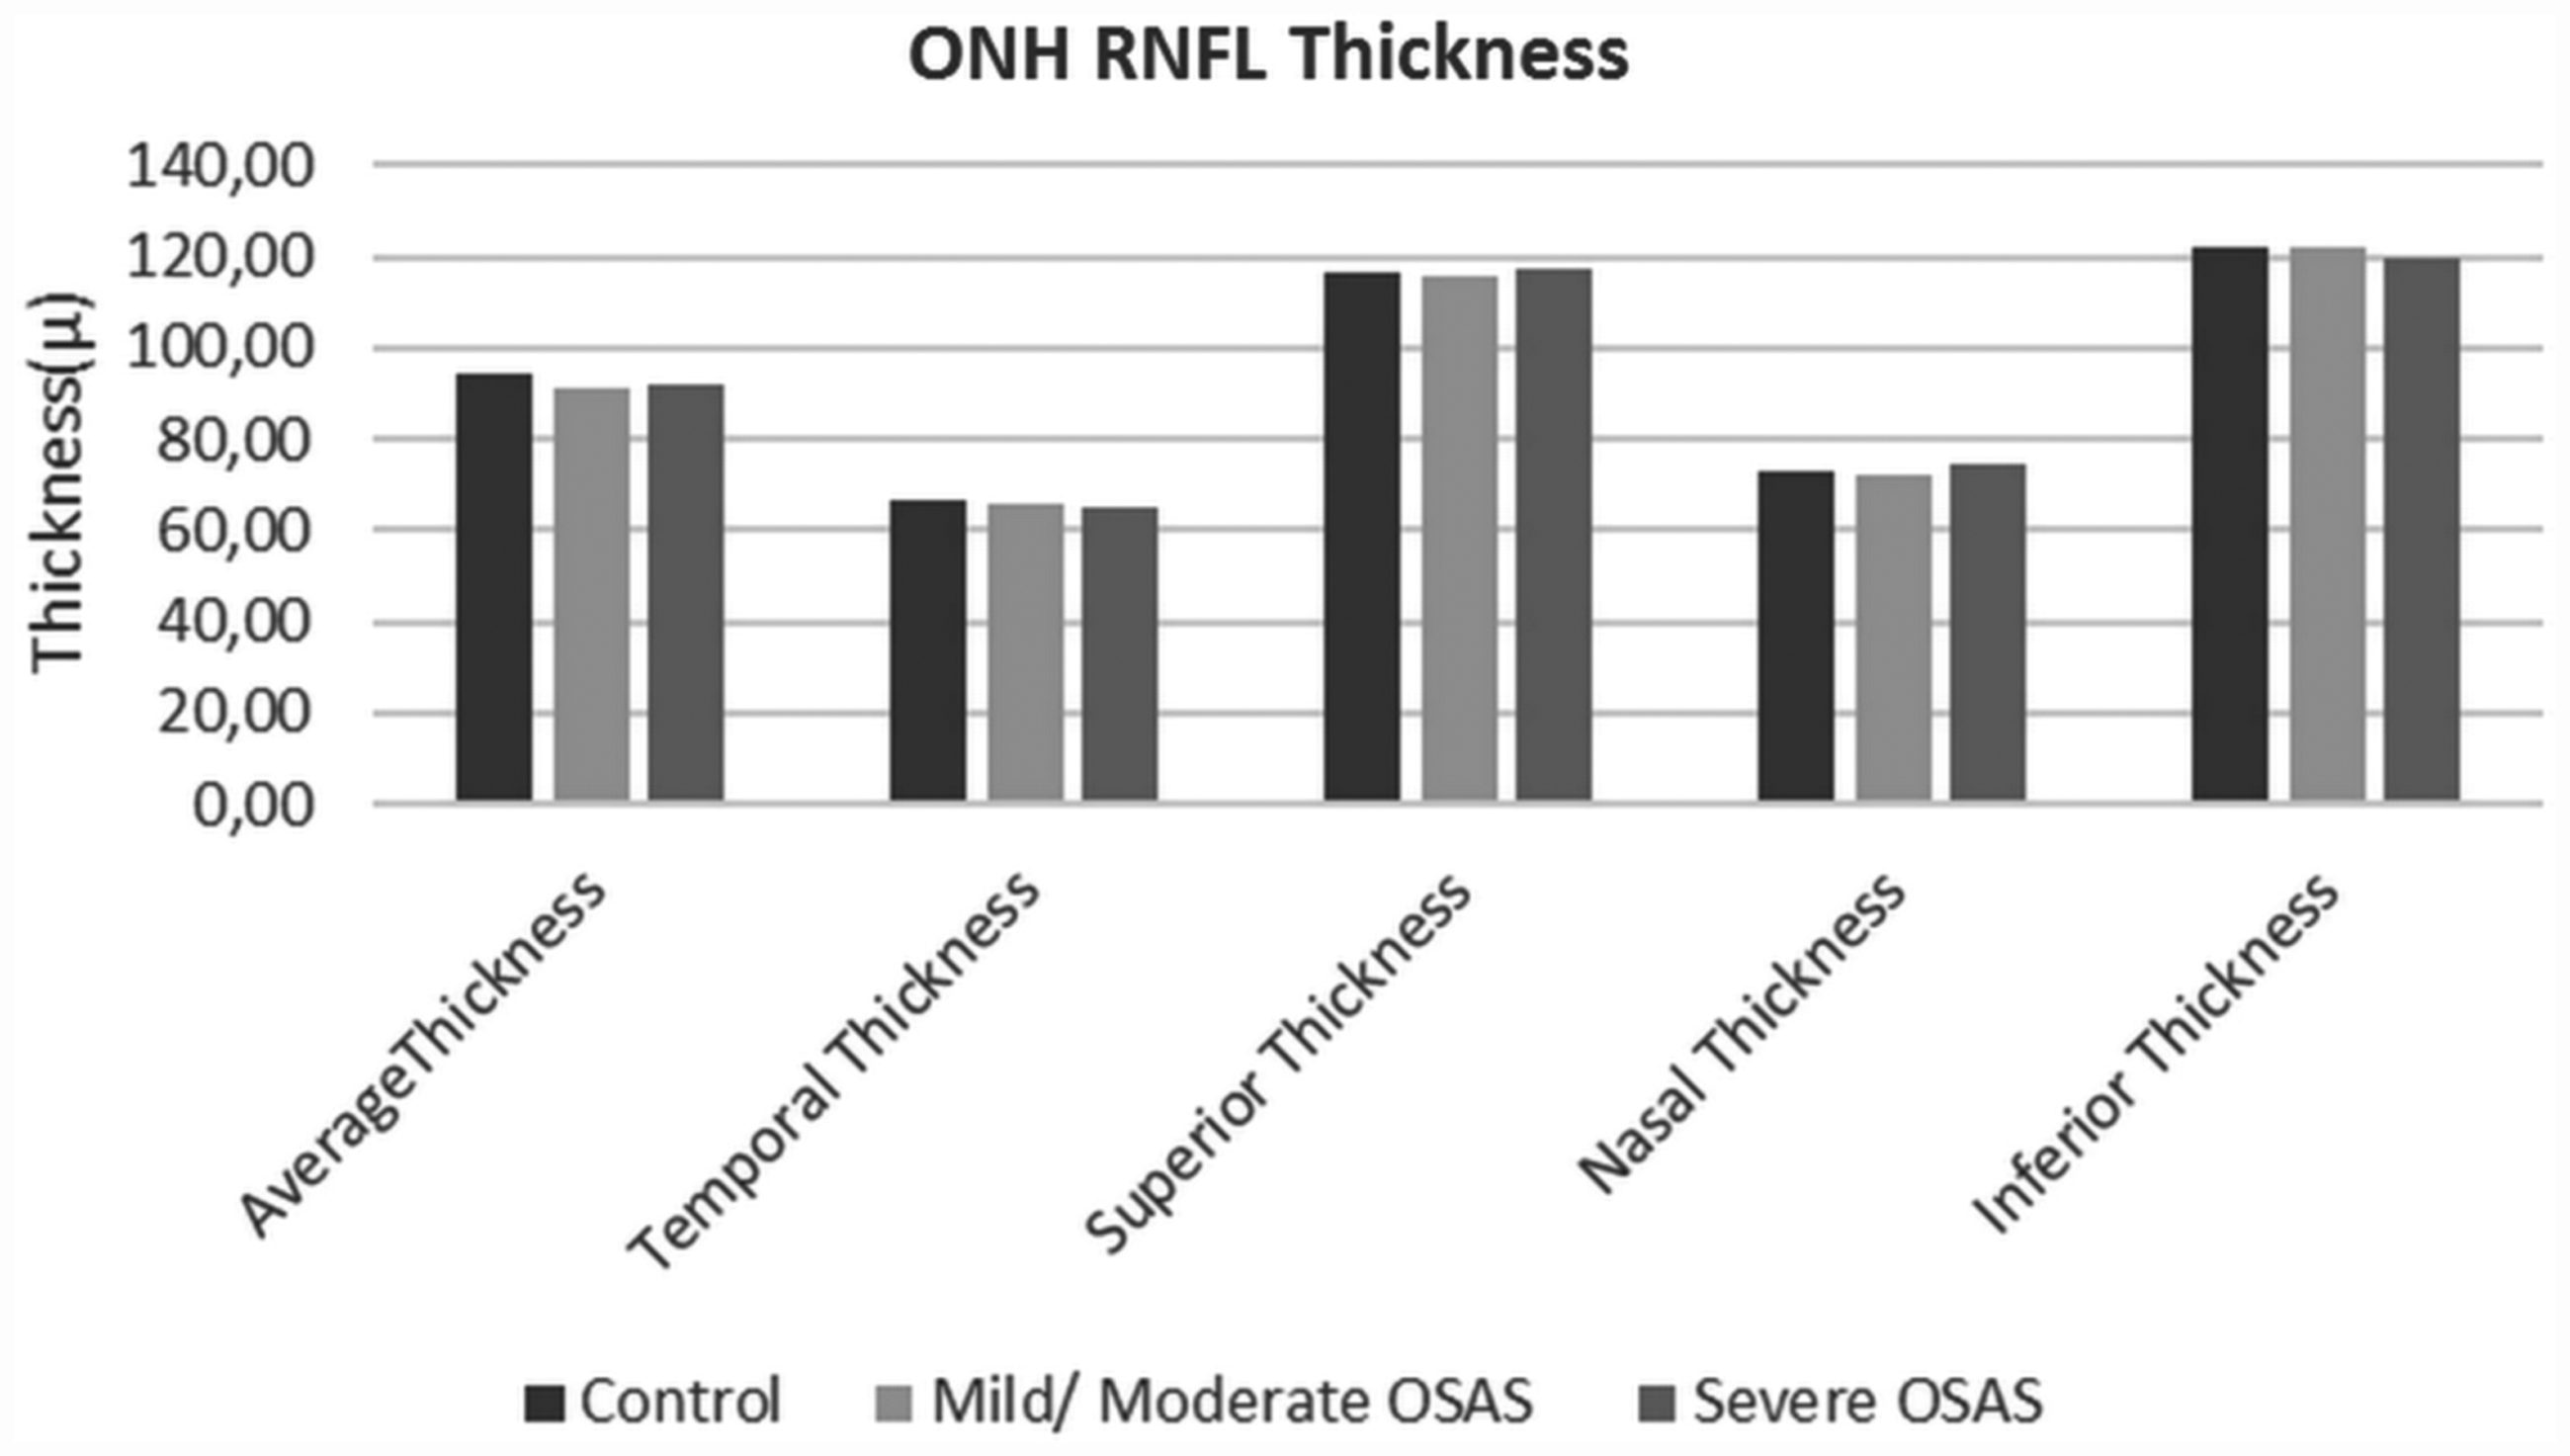
Bar graph represents a comparison of the peripapillary retinal nerve fiber layer thickness values of patients with mild/moderate, and severe OSAS, and the control subjects.
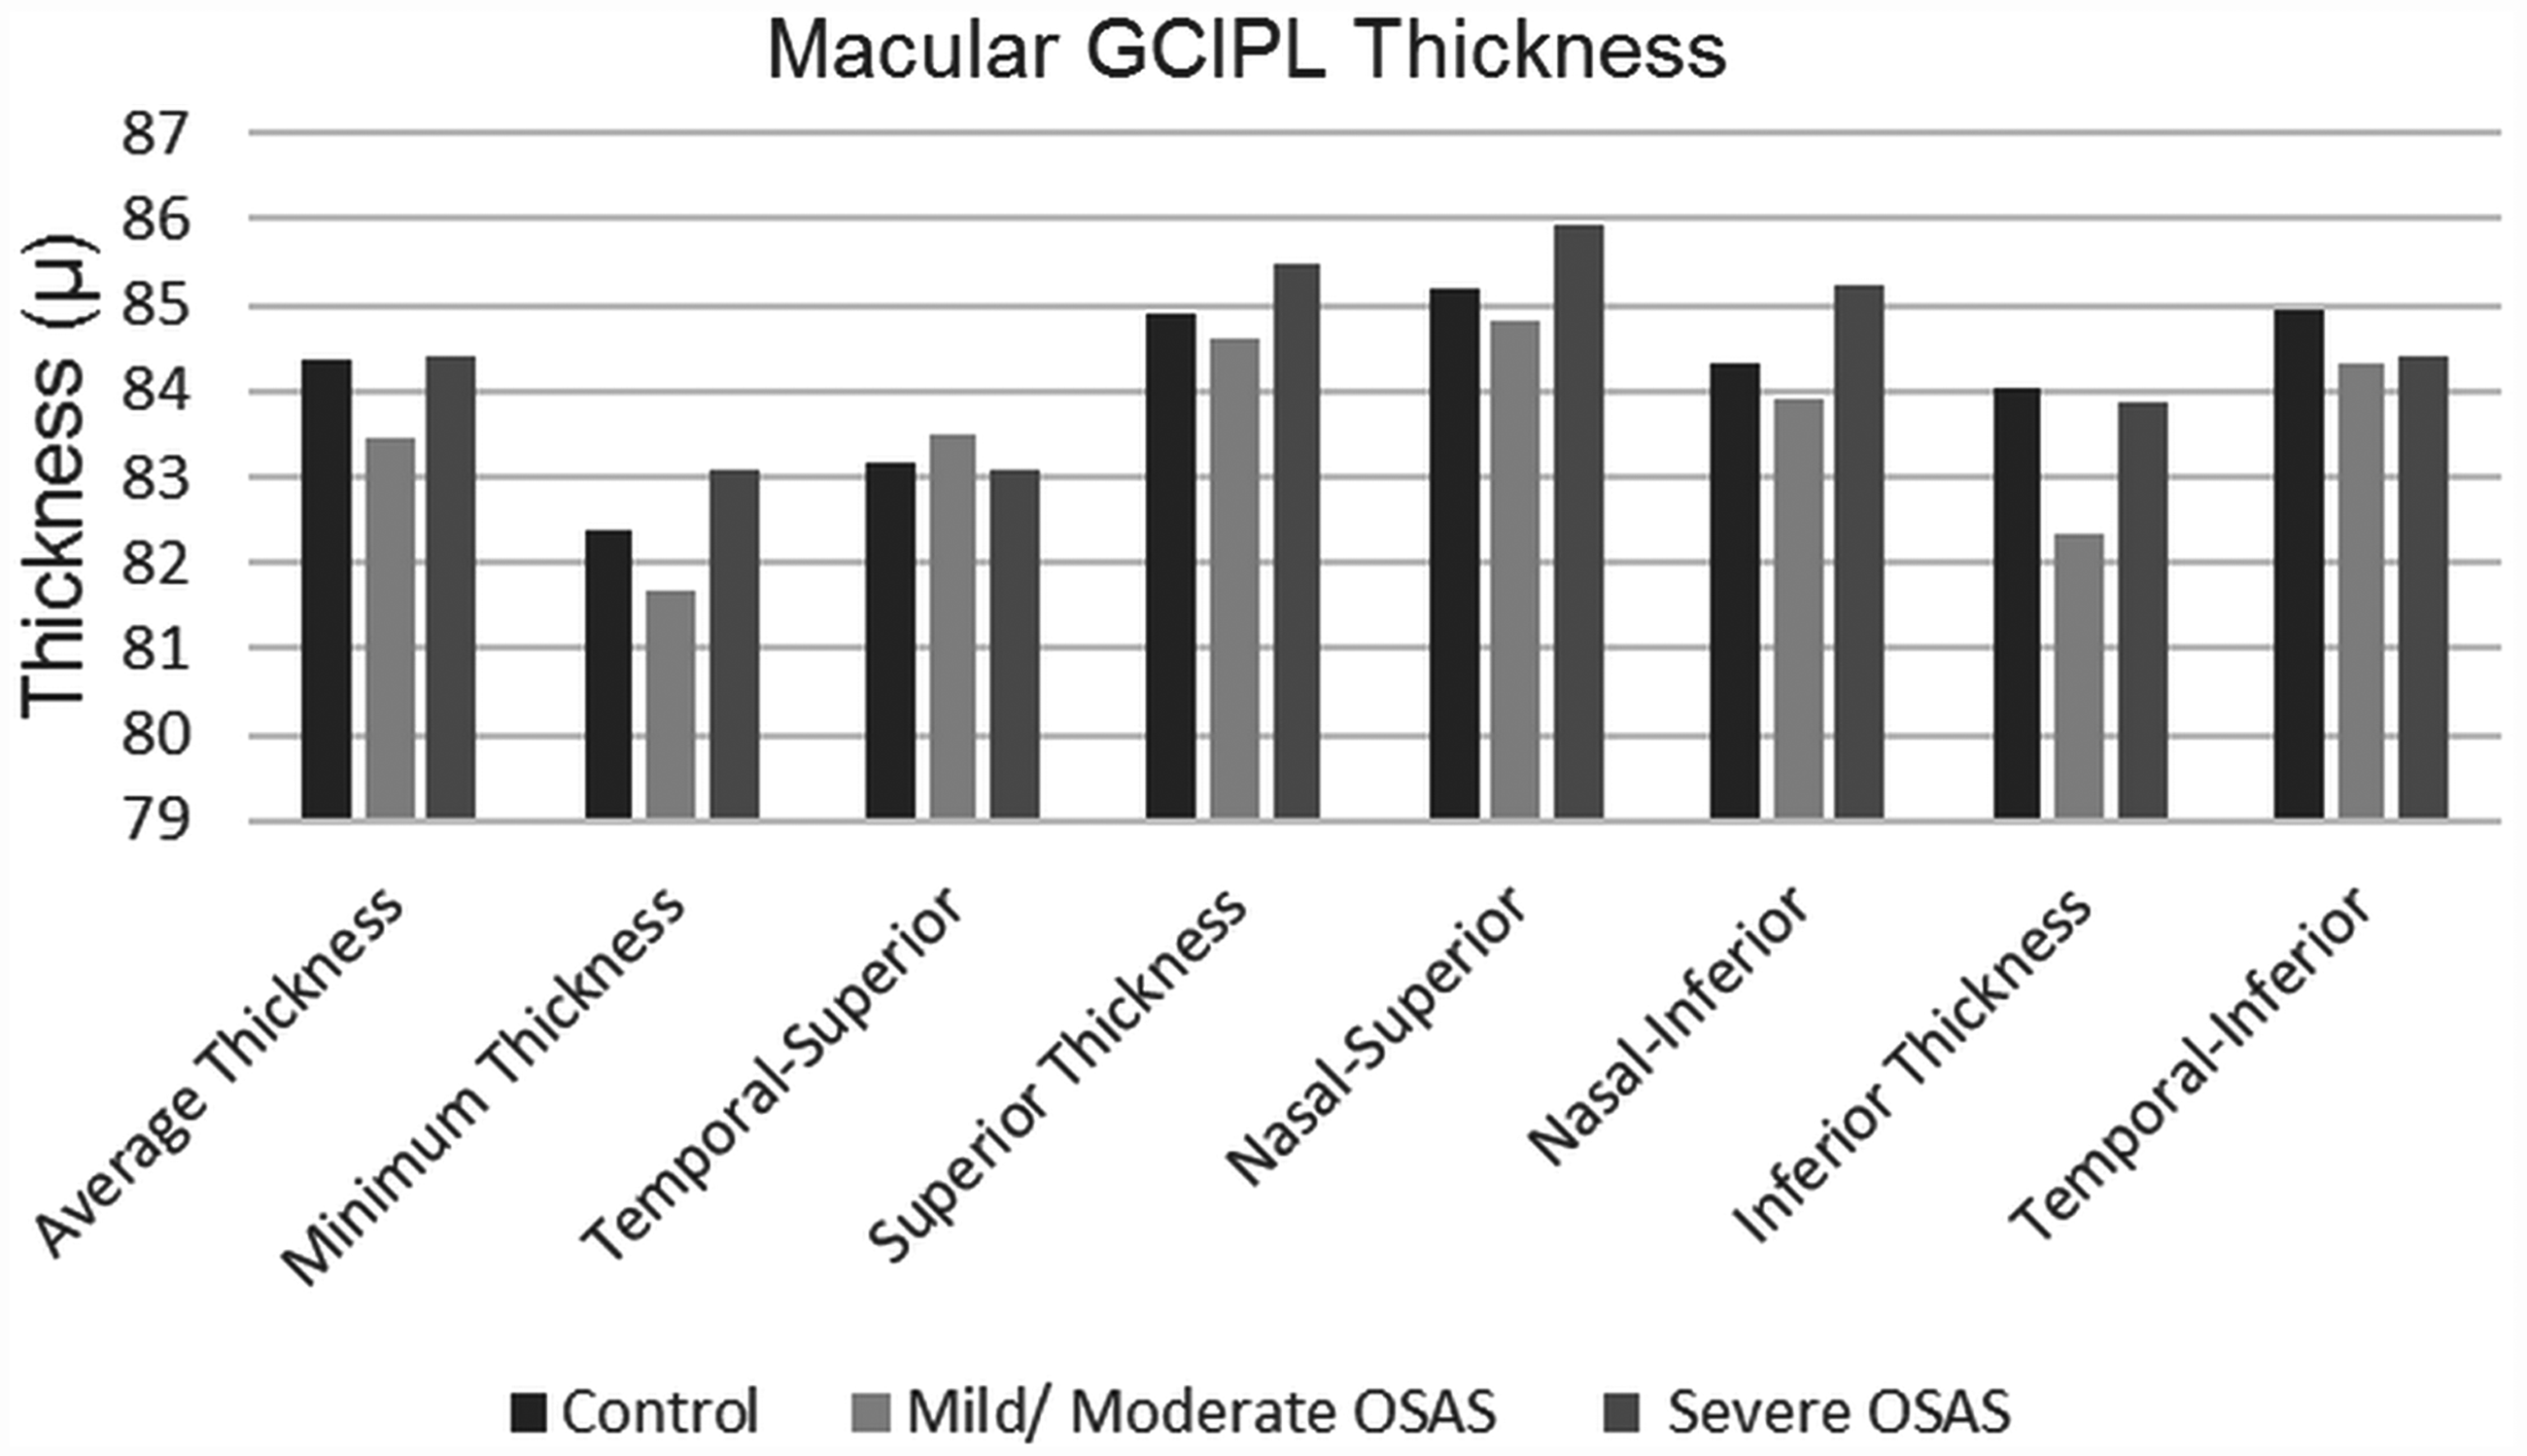
Bar graph represents a comparison of the macular ganglion cell complex thickness values of the patients with mild/moderate, and severe OSAS, and the control subjects.
Discussion
In our study, patients with normal IOP values and no perimetric evidence of glaucomatous neuropathy were included in order to assess the effect on peripapillary RNFL thickness, ONH parameters, and GCIPL in patients with OSAS with effects of OSAS severity. The pathogenesis of ocular complications in OSAS is not fully understood. However, vascular and mechanical factors may play a role in the pathogenesis. These vascular factors may compromise the blood supply to the RNFL and/or optic nerve, ultimately leading to optic neuropathy. 11 The immediate IOP decrease observed during nocturnal sleep in patients with OSAS gives IOP-independent theories more value. 12 Any defect in the autoregulation of the ONH blood flow leads to ischemia and hypoxia, and increased levels of inflammatory cytokines and reactive oxygen species. 13 Several authors reported a higher prevalence of glaucomatous neuropathy in patients with OSAS, characterized by increased size in the optic disk cup and associated thinning of peripapillary RNFL.5,8
In our results, only the average RNFL thickness was significantly lower in patients with OSAS compared with the controls. In addition, there was no significant difference in RNFL thickness between the moderate and severe OSAS groups. Previous published studies demonstrated decreased RNFL thickness in patients with OSAS, in accordance with our results.8,14,15 Casas et al. 14 suggested that there was a significant reduction of the nasal quadrant RNFL thickness in patients with OSAS as compared with controls, but there were no differences in the rest of the peripapillary RNFL and macular parameters. In a previous study, the authors reported that the thickness of the RNFL was reduced in patients with OSAS compared with controls, and they also observed that these changes were correlated with the severity of the disease. 8 Likewise, Lin et al. 15 observed that RNFL thickness measurements were significantly lower in the severe OSAS group than in the control and mild OSAS groups in the average and superior quadrants. Moreover, the decrease in RNFL was found to be positively correlated with the lowest oxygen saturation. In a more recent study, it was concluded that the nasal RNFL thickness in patients with OSAS was significantly thinner compared with that of control individuals. By contrast, Nowak et al. 16 and Kara et al. 17 showed that there was no significant difference in RNFL thickness between patients with OSAS and the control group. Although the superotemporal segments are the regions of the optic disk that are typically first implicated in glaucoma, there were different results for segmental changes in different studies. Moreover, there is even no consensus on RNFL thinning in patient with OSAS compared with the controls.
In our ONH parameters results, the vertical C/D ratio and the average C/D ratio were significantly increased in patients with OSAS when compared with controls. Very few studies have investigated the optic disk topography in patients OSAS and they reported various results. In a study performed with the Stratus OCT, an increase in morphologic ONH parameters was found in patients with OSAS compared with controls, including the vertical integrated rim area, horizontal integrated rim width, and disk area. 12 A significant correlation between AHI and the cup/disk ratio has been previously reported to support the view that OSAS might be an important risk factor for the development of normotensive glaucoma. 16 Mojon et al. 18 found that glaucomatous optic disk changes were associated with a higher respiratory disturbance index, which is used to diagnose and grade OSAS. However, Lin et al. 15 reported that ONH parameters were not significantly different among the mild, moderate, and severe OSAS groups and controls. Further studies are needed to elucidate longitudinal changes in RNFL thickness and ONH parameters in patients with OSAS.
New-generation SD-OCT segmentation algorithms have been developed to calculate a combined thickness of macular GCIPL thickness. The GCA algorithm of Cirrus SD-OCT made possible the measurement of GCIPL thickness parameters, which reflect the thickness of retinal ganglion cell bodies and dendrites located in the macular region.9,19,20 In this study, our secondary aim was to assess the association of OSAS severity with GCIPL thicknesses. We detected no significant difference in macular GCIPL thicknesses and there was no relation between OCT measurements and disease severity. In previous studies, macular GCIPL thickness was reported to be able to detect glaucoma at levels comparable with peripapillary RNFL.9,21–23 Some studies that investigated earlier diagnosis of glaucoma drew attention to the thickness of the macular ganglion cell layer prior to axon loss.24,25 Statistically significant abnormalities in the VF were detected with respect to at least 25%–35% ganglion cell loss. 26 Fernandez et al. 27 suggested that generalized reduction in the threshold values could be explained by diffuse vascular damage to the retinal ganglion cells, causing axonal loss and VF depression. Huseyinoglu et al. 28 found lower mean peripapillary RNFL thickness and ganglion cell complex thickness values in patients with severe OSAS. In addition, the deviation maps were more sensitive in detecting pre-perimetric glaucoma and monitoring progression. 29 In our study, we used only the sectoral maps of the GCA algorithm for GCIPL measurements, and accordingly, possible changes in the deviation maps may have been overlooked. Therefore, further investigation is required to better characterize the structure-function relationship in patients with OSAS.
This study had several limitations. First, is the small number of patients, which was caused by the division into two subgroups according to the severity of OSAS. Second, only patients with OSAS underwent PSG evaluations. Ideally, the control subjects should have also undergone full-night PSG. Instead, we performed a comprehensive questionnaire concerning their sleep disorders to exclude patients with OSAS. We considered that they had no possibility of having OSAS by investigating snoring, daytime sleepiness, and witnessed apnea.
Conclusion
Patients with OSAS showed a decreased peripapillary RNFL thickness and increased C/D ratios. However, the retinal GCIPL thickness revealed no significant difference between the controls and patients with OSAS. The abnormalities of the average peripapillary RNFL and ONH topography seen in patients with OSAS were observed to be similar to glaucomatous changes. These findings might be useful as an indicator of early changes in optic nerve damage in patients with OSAS with normal optic nerves.
Footnotes
Declaration of conflicting interests
The author(s) declared no potential conflicts of interest with respect to the research, authorship, and/or publication of this article.
Funding
The author(s) received no financial support for the research, authorship, and/or publication of this article.