
Abstract
Purpose:
To explore the trend patterns and gender disparity in global burden of age-related macular degeneration (AMD) by year, age, and socioeconomic status using disability-adjusted life-years (DALYs) from Global Burden of Disease (GBD) study 2017.
Methods:
DALYs and impairment data caused by AMD were extracted from GBD Study 2017. World Bank income level (WBIL) and human development index (HDI) in 2017 were cited as indicators of socioeconomic status. The Gini coefficients and the concentration indexes were calculated to unveil trends in between-country inequality. The association between gender inequality and socioeconomic levels was analyzed by Pearson correlation.
Results:
Total age-standardized DALYs of AMD showed a slightly descending pattern in recent years. However, gender disparity has existed since 1990 for almost three decades, with female being more heavily impacted. This pattern became more obvious with aging and varied among different WHO and WBIL regions. Meanwhile, female subjects tended to have higher vision impairments. Gini coefficients of AMD burden increased from 0.423 to 0.448, while the ones of female-to-male ratio fluctuated around 0.11 between 1990 and 2017, with concentration indexes changing from 0.024 to −0.057 and 0.046 to 0.029 respectively. Female-minus-male difference (r = 0.1721, p = 0.0195) and female-to-male ratio (r = 0.2072, p = 0.0048) of age-standardized DALYs rates were positively related to HDI.
Conclusions:
Though global AMD health care is progressing, gender imbalance in disease burden of AMD distribution barely improved. Gender sensitive health policy should be emphasized for the increasing elder population and relieving the higher AMD burden of females.
Keywords
Introduction
Age-related macular degeneration (AMD) causes progressive visual loss, which is challenging for early intervention due to its multifactorial nature. 1 Being the leading cause of irreversible visual impairment in the Western world of individuals aged 65 and older, AMD accounts for 8.7% world’s total blindness, just ranks behind cataract and uncorrected refractive error. 2 Considering the exponential population aging worldwide, the prevalence of AMD is likely to increase to a significantly higher level. The total number of population who suffers from AMD is expected to increase to 196 million by 2020 and 288 million by 2040 with the largest number of cases in Asia and Europe, presumably. 3 There have been remarkable progressions of treatment available for choroidal neovascularization (CNV) but not for geographic atrophy (GA) AMD with the introduction of antibodies against vascular endothelial growth factor (VEGF).4 –7
According to Global Burden of Diseases (GBD) Study, the burden of AMD has been calculated using disability-adjusted life-years (DALYs) to quantify health loss. Ono et al. 8 is the first to attempted to depict global disparity in eye disease by analysis of data from GBD Study 2004. Their study revealed that AMD had uneven distribution among different socioeconomic regions, with median DALYs of 142.7 in high-income countries versus 114.1 in low-income ones. Most recently, Wang et al. demonstrated that the imbalance of age-standardized DALYs of AMD was positively associated with human development index (HDI) and Gross Domestic Production (GDP). Meanwhile, sexual disparity of AMD burden started to be noticed as well. 9
Unfortunately, female is much less likely to have access to proper visual health care, even in some developed countries. For example, women waited longer for cataract surgery than men, 10 and had less chance to seek spectacle correction than men. 11 In terms of AMD, despite of extraordinary effect of anti-angiogenesis therapy, not all patients in many countries could afford it, especially women with poor socioeconomic condition. As gender inequality in AMD burden becoming one of the major concerns in halting progress of blindness, understanding disease burden patterns of AMD as well as gender inequality condition is essential for adequate health care planning and provision. Thus, the aim of this study was to explore the latest trend pattern and compare multiple aspects of gender inequality in global AMD burden by year, age, and socioeconomic status using the recent DALYs data from the GBD 2017 study.
Methods
Total and gender-specific estimates of AMD
AMD was defined by codes H35.3 to H35.389 according to International Statistical Classification of Diseases, Tenth Revision (ICD-10), in the GBD Study 2017. 12 DALYs estimation protocol has been previously described. 13 Moderate and severe visual impairment (MSVI) was presenting visual acuity (VA) < 6/18 but ⩾3/60 based on the Snellen chart, while the blindness definition was VA < 3/60 or visual field around central fixation <10%.2,14,15 Interested AMD DALYs and impairment data were collected from the Global Health Data Exchange, 16 including: (1) global total and gender-specific DALYs numbers, DALYs percent, DALYs per 100,000 population (crude rates) and age-standardized DALYs rates from 1990 to 2017; (2) global gender- and age-specific standardized impairment rates caused by AMD in 1990, 2005 and 2017; (3) World Health Organization (WHO) and GBD super regions’ total and gender-specific age-standardized DALYs rates from 1990 to 2017; (4) national gender-age-specific standardized DALYs rates in 2017. Ethics approval and informed consent were not required for this study because of public accessibility to the data.
Measures of health inequality
The Gini coefficient and the concentration index are two widely adopted measures in terms of health inequality. 17 The Gini coefficient ranges from 0 (perfect equality) to 1 (perfect inequality). Age-standardized DALY rates and female-to-male DALY ratios due to AMD from 195 countries were collected to calculate the Gini coefficients, exploring the trends in between-country health inequality from 1990 to 2017. Concentration index has been extensively used for measuring inequalities in health, which illustrates the association between an individual’s level of health and their relative position in the income distribution. A positive (negative) value of the concentration index means that AMD burden is more concentrated in countries with high (low) levels of socioeconomic development. A value of zero for the concentration index does not mean absence of inequality, but an absence of the socioeconomic gradient in the distribution. 18 National age-standardized DALY rates and gender DALY ratios due to AMD and corresponding HDI were used to explore the concentration indexes.
Global and national socioeconomic status
2017 World Bank divides countries into four categories by Gross National Income (GNI) per capita using the World Bank Atlas method: Low income ⩽ $995; Lower-Middle income $996 to $3, 895; Upper-Middle income $3, 896 to $12, 055; High income ⩾ $12, 056. 19 1990 to 2017 World Bank income level (WBIL) regional total and gender- age-specific standardized DALYs rates were extracted from Global Health Data Exchange. The human development index (HDI) is also widely used as an indicator of socioeconomic status, which covers measurements of health, educational attainment and income. 2017 National HDI was obtained from Human Development Report 2018 20 : very high HDI (⩾0.800), high HDI (<0.800 to ⩾0.701), medium HDI (<0.701 to ⩾0.550), and low HDI (<0.550).
Statistical analysis
The paired Wilcoxon signed rank test was adopted to assess differences in global age-standardized DALY rates, impairment rates and for each HDI-based country group by sex. The Gini coefficient was calculated by the INEQERR module and the concentration index by the CONCINDC module using Stata 14 (StataCorp, College Station, Texas, USA). Association of gender difference (female-minus-male) in age-standardized DALY rates and female-to-male age-standardized DALY rate ratio with HDI were tested via Pearson correlation and Linear regression analyses. All statistical analyses, except otherwise specified, were conducted with Prism software (version 6; GraphPad). A p-value <0.05 was considered statistically significant.
Results
Global trend patterns and gender inequality of AMD disease burden
Global disease burden of AMD has been increasing since 1990, as indicated by total number, percent and crude rates of DALYs. 2017 age-standardized DALYs rates was slightly lower than those of 1990 (6.78 vs 6.85), for the first time during 28 years, which is quite different pattern trend from previous research based on GBD 2015. However, gender inequality has persisted over the past decades. The DALY numbers were 307, 576 among female subjects versus 223, 157 among male subjects in 2017. Similar patterns between gender were presented by DALYs percent (0.000265% of female vs 0.000165% of male) and crude DALYs rates (8.08 of female vs 5.81 of male) after controlling of population size in 2017. Even after further adjusted of age structure, there is an obvious gap of burden between gender, with 7.16 of female versus 6.28 of male (Figure 1).
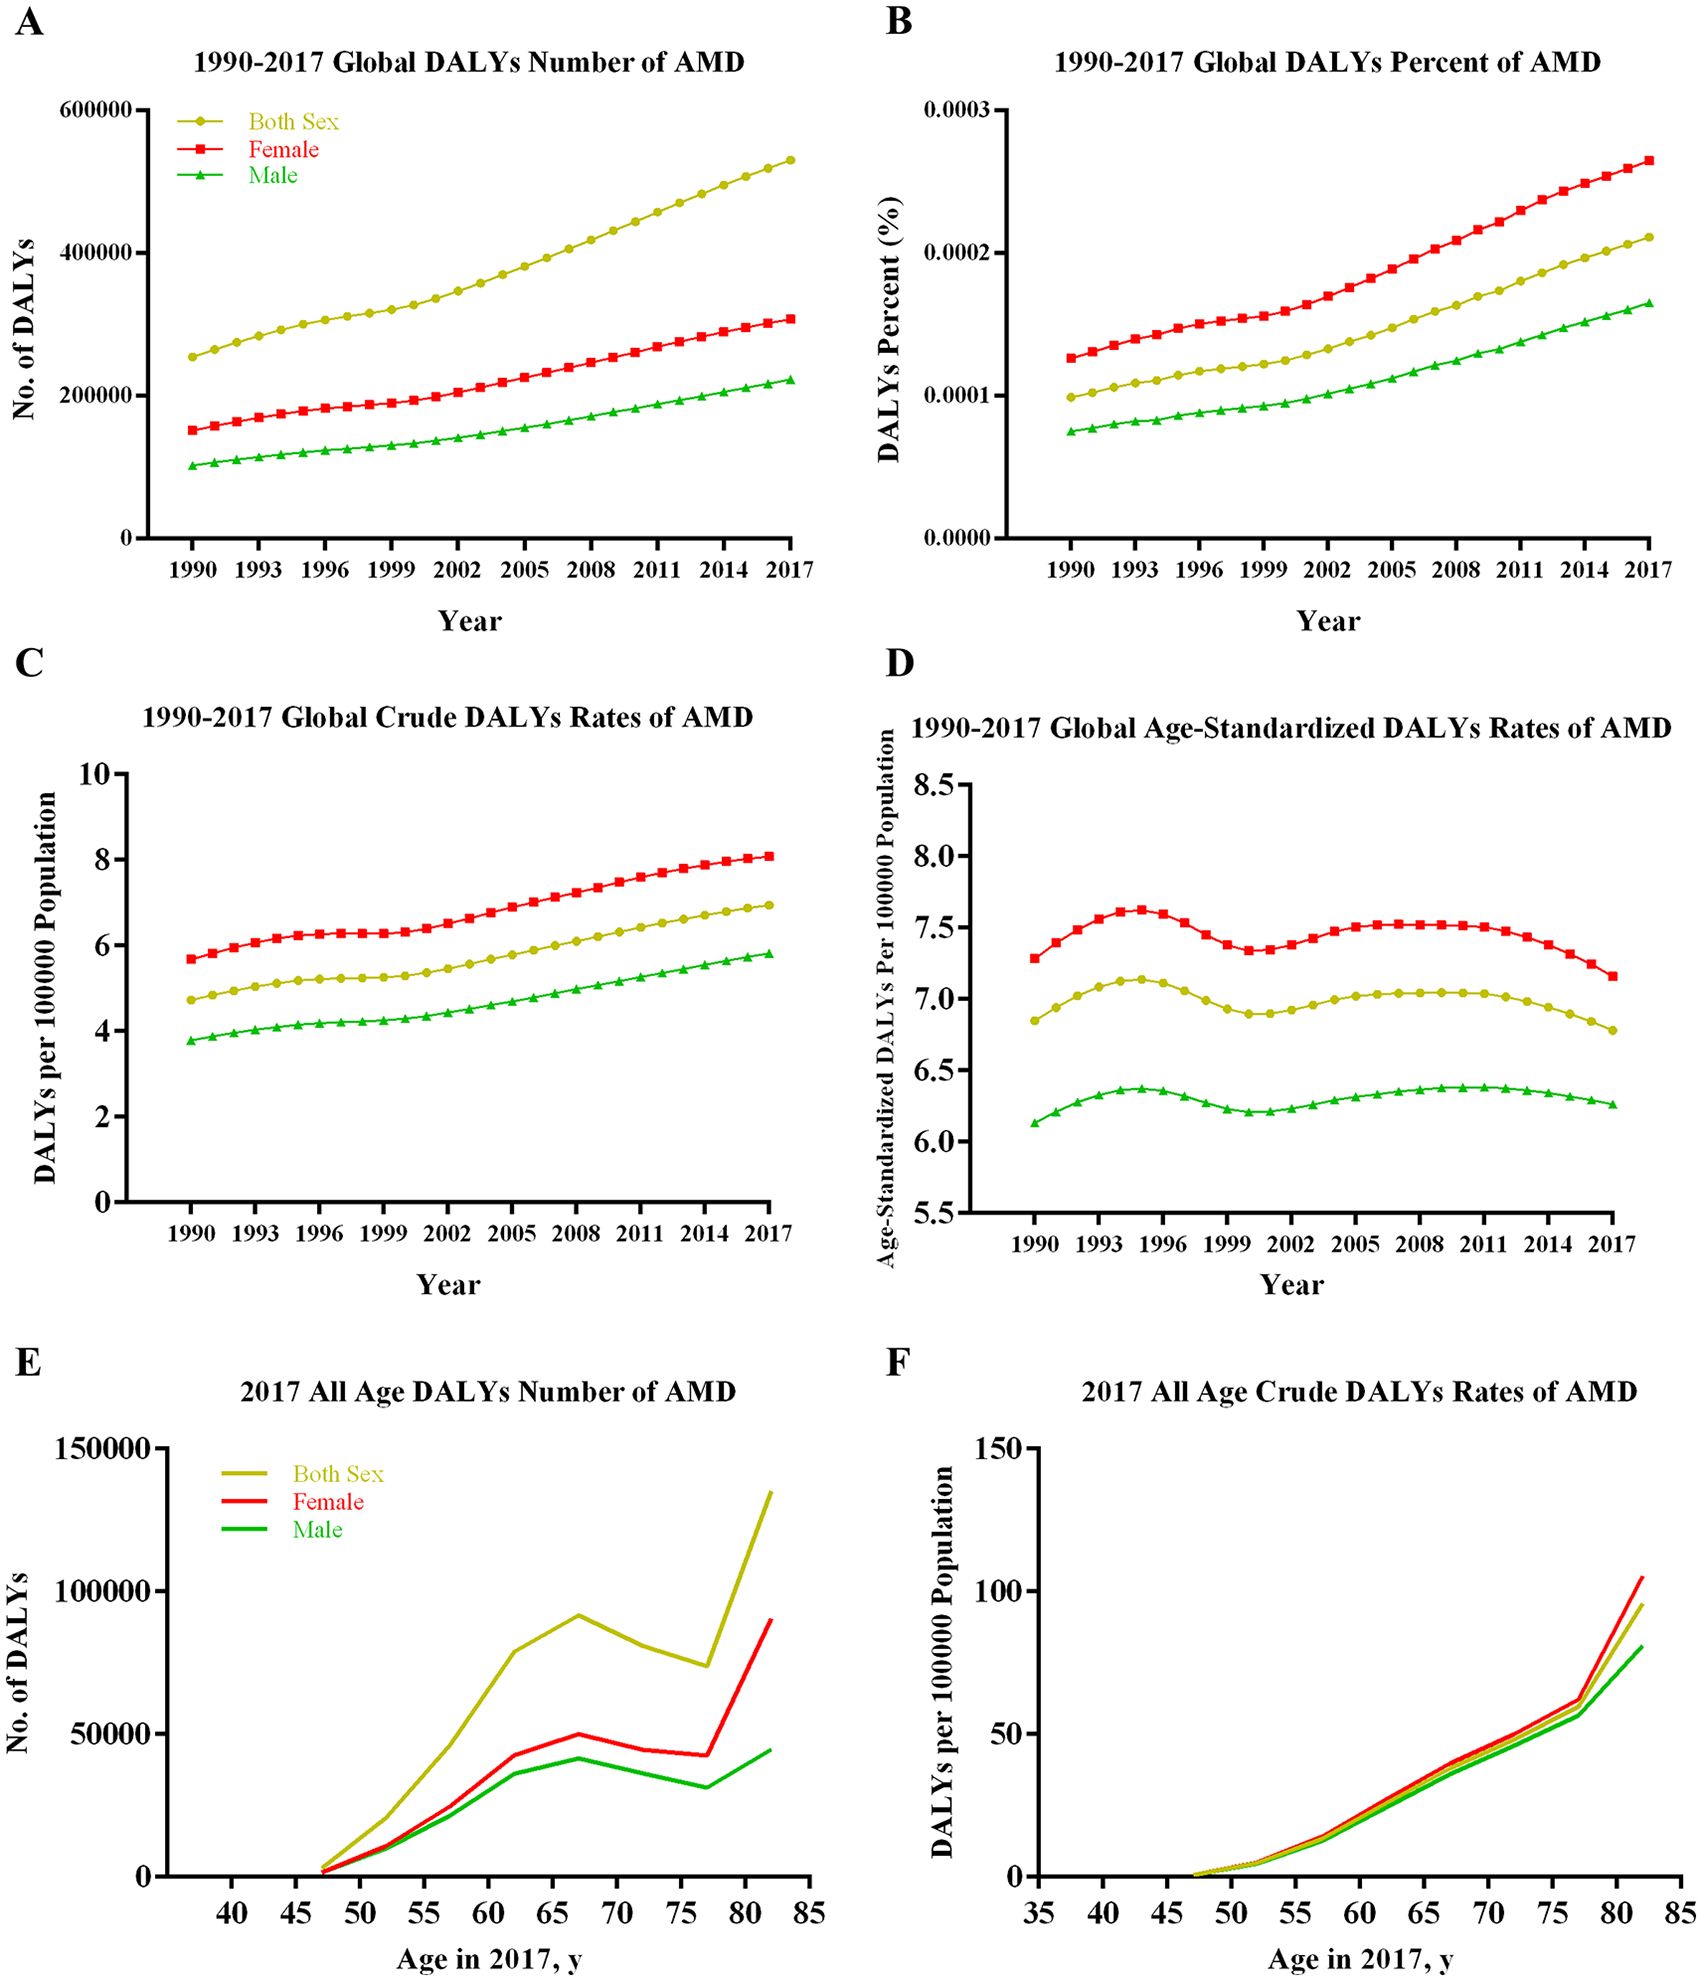
Global Total and Gender-Specific Burden of Age-related Macular Degeneration by Year and by Age in 2017. (A) DALYs number by year; (B) DALYs percent by year; (C) Crude DALYs rates by year; (D) Age-standardized DALYs rates by year; (E) DALYs number by age; (F) Crude DALYs rates by age.
Age-standardized DALYs plots revealed three kinds of gender patterns among WHO regions (Figure S1). Gender-specific DALYs rates of African and Americas regions were close and overlapping for a short period of time, then females’ DALYs were starting outrun males’. To the opposite, sexual inequality persisted until approaching the start and end point of our observation period in Western Pacific regions. As for Eastern Mediterranean, European and South East Asia regions, the gender gaps seemed to persist over time period. As well as shown in Table 1, female subjects borne heavier burden than males in majority parts of GBD super regions.
Age-standardized DALYs rates (per 100,000 population) due to AMD by GBD super-region in 1990, 2005, and 2017.
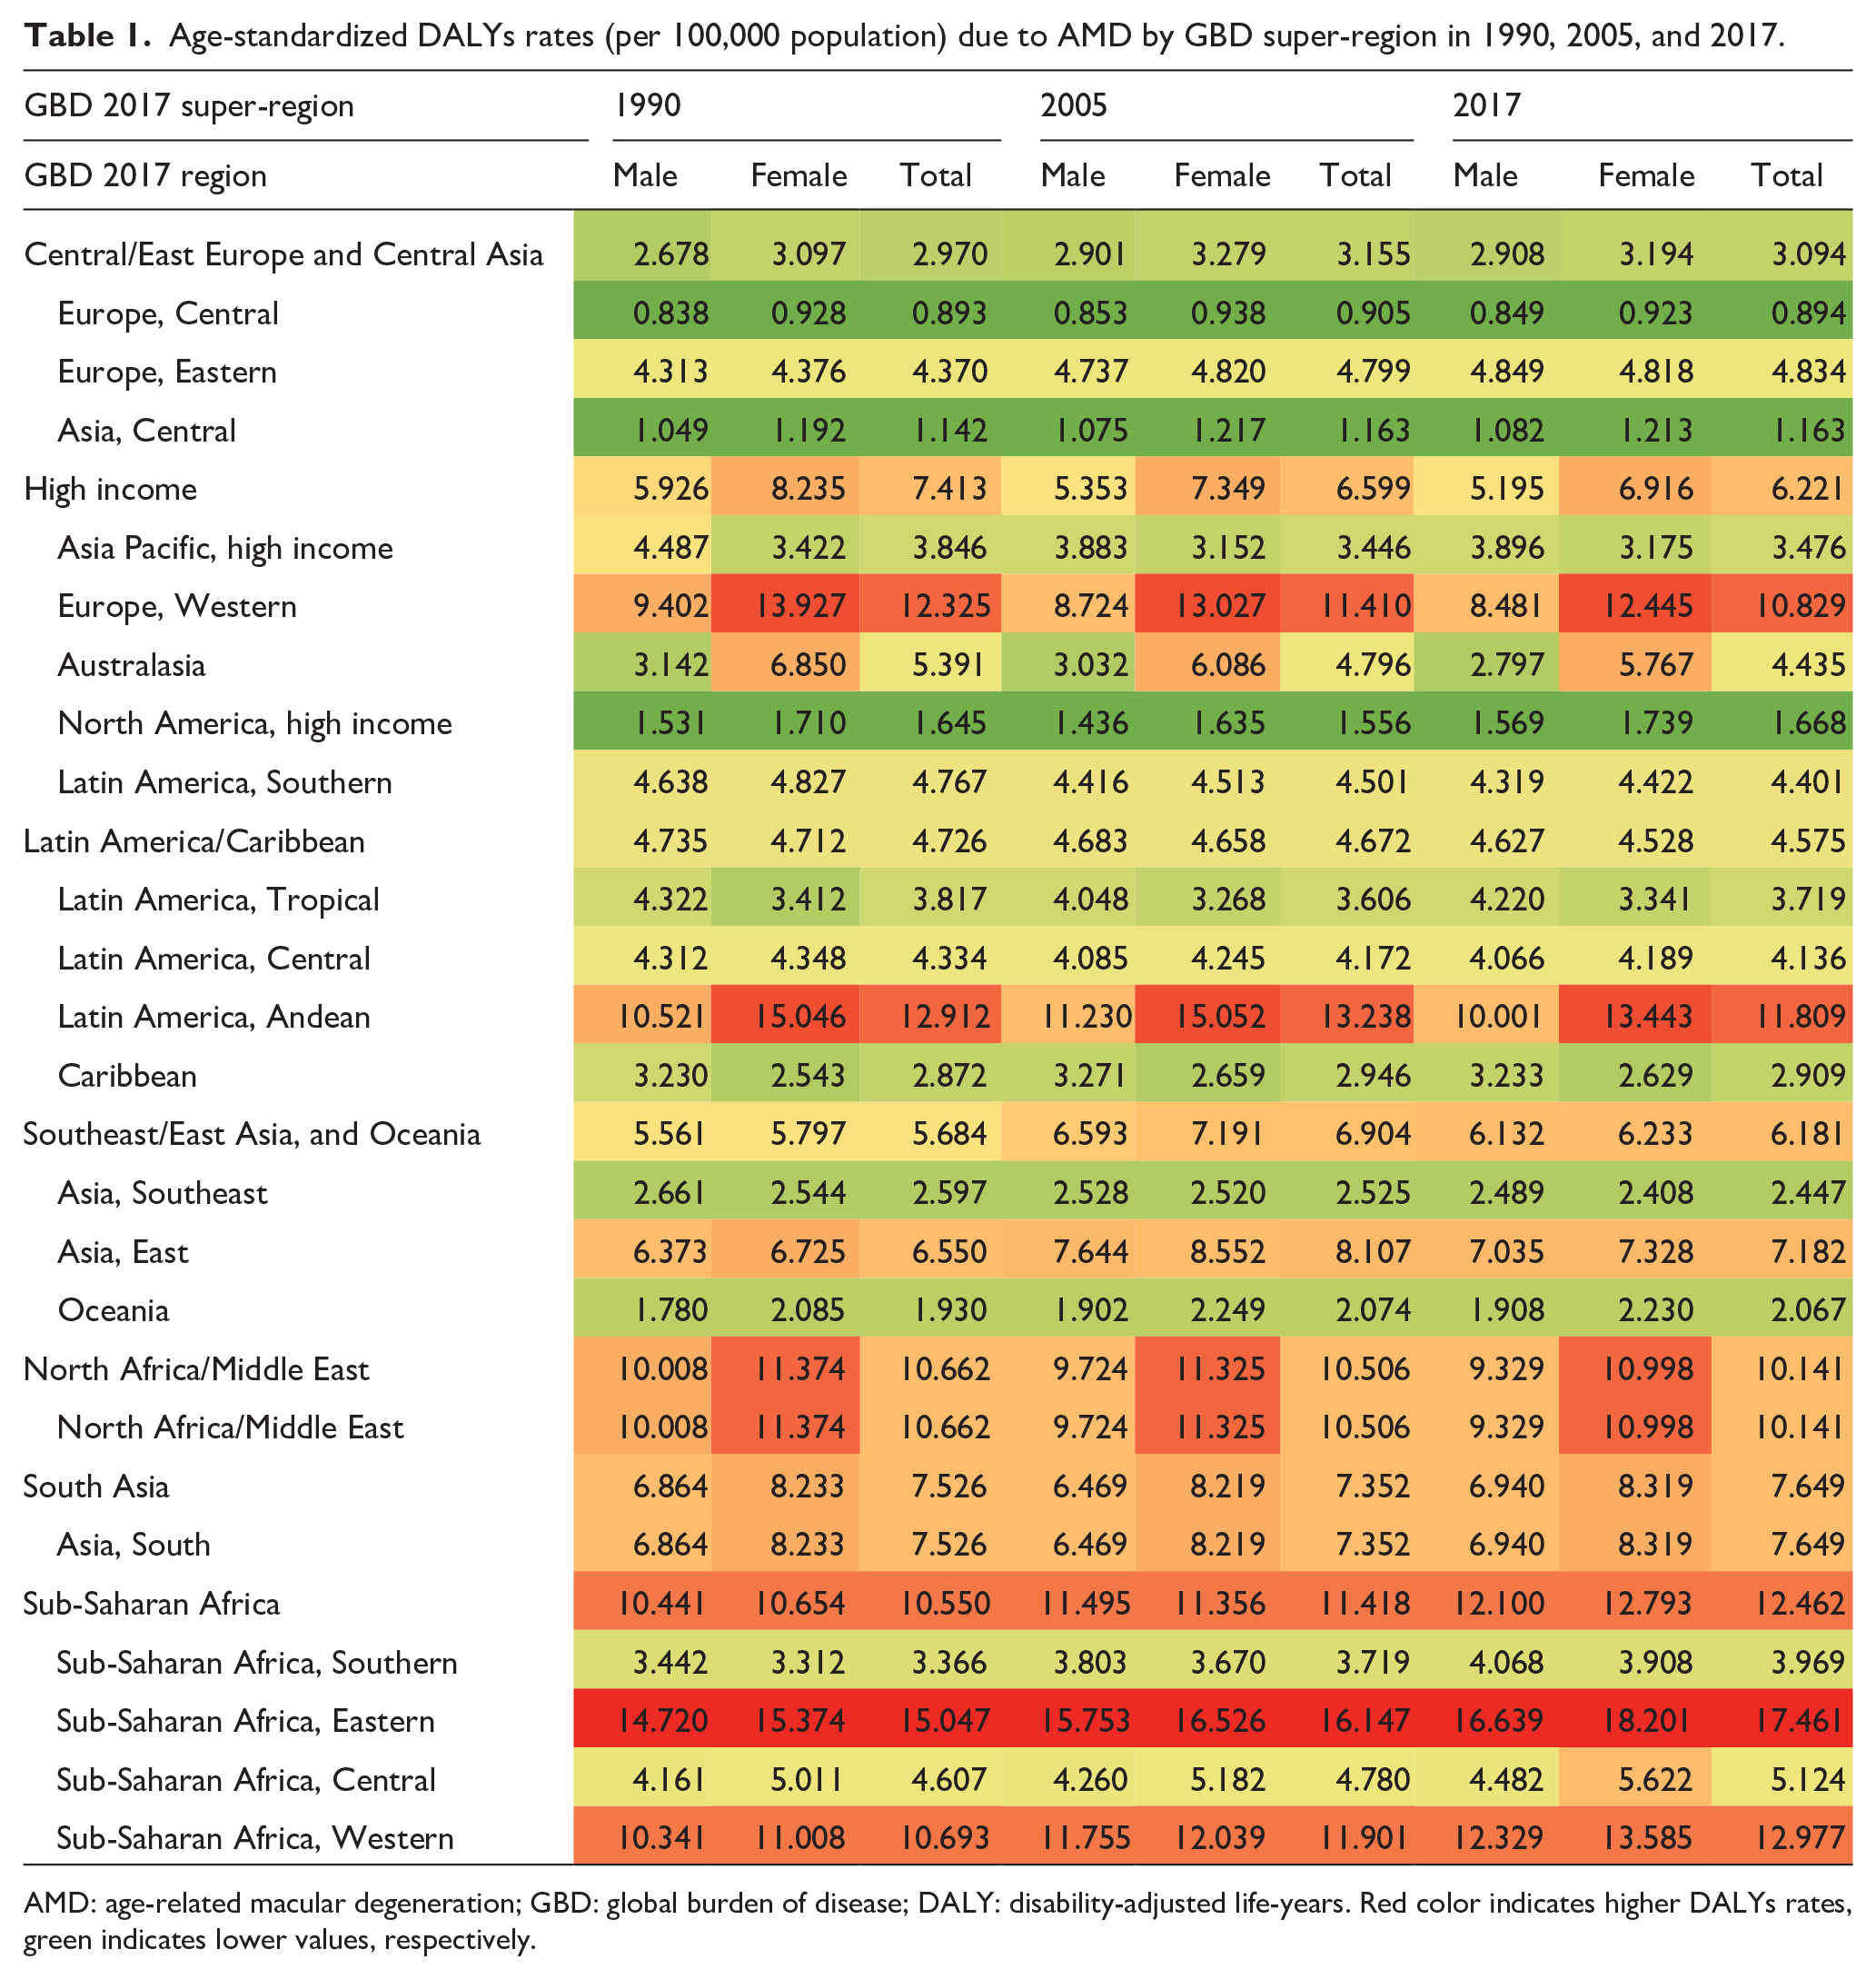
AMD: age-related macular degeneration; GBD: global burden of disease; DALY: disability-adjusted life-years. Red color indicates higher DALYs rates, green indicates lower values, respectively.
The GBD studies collected “Blindness and Vision Impairment” caused by AMD with sub-categories of “Moderate vision loss”, “Severe vision loss” and “Blindness”. As shown in Table 2, Blindness counts for majority part of impairment rates. Female subjects have been suffering from significantly more impairments, with slight fluctuations of each impairment categories of both gender over the past decades.
Global age-standardized impairment rates (YLDs, per 100,000 population) caused by AMD in 1990, 2005 and 2017.
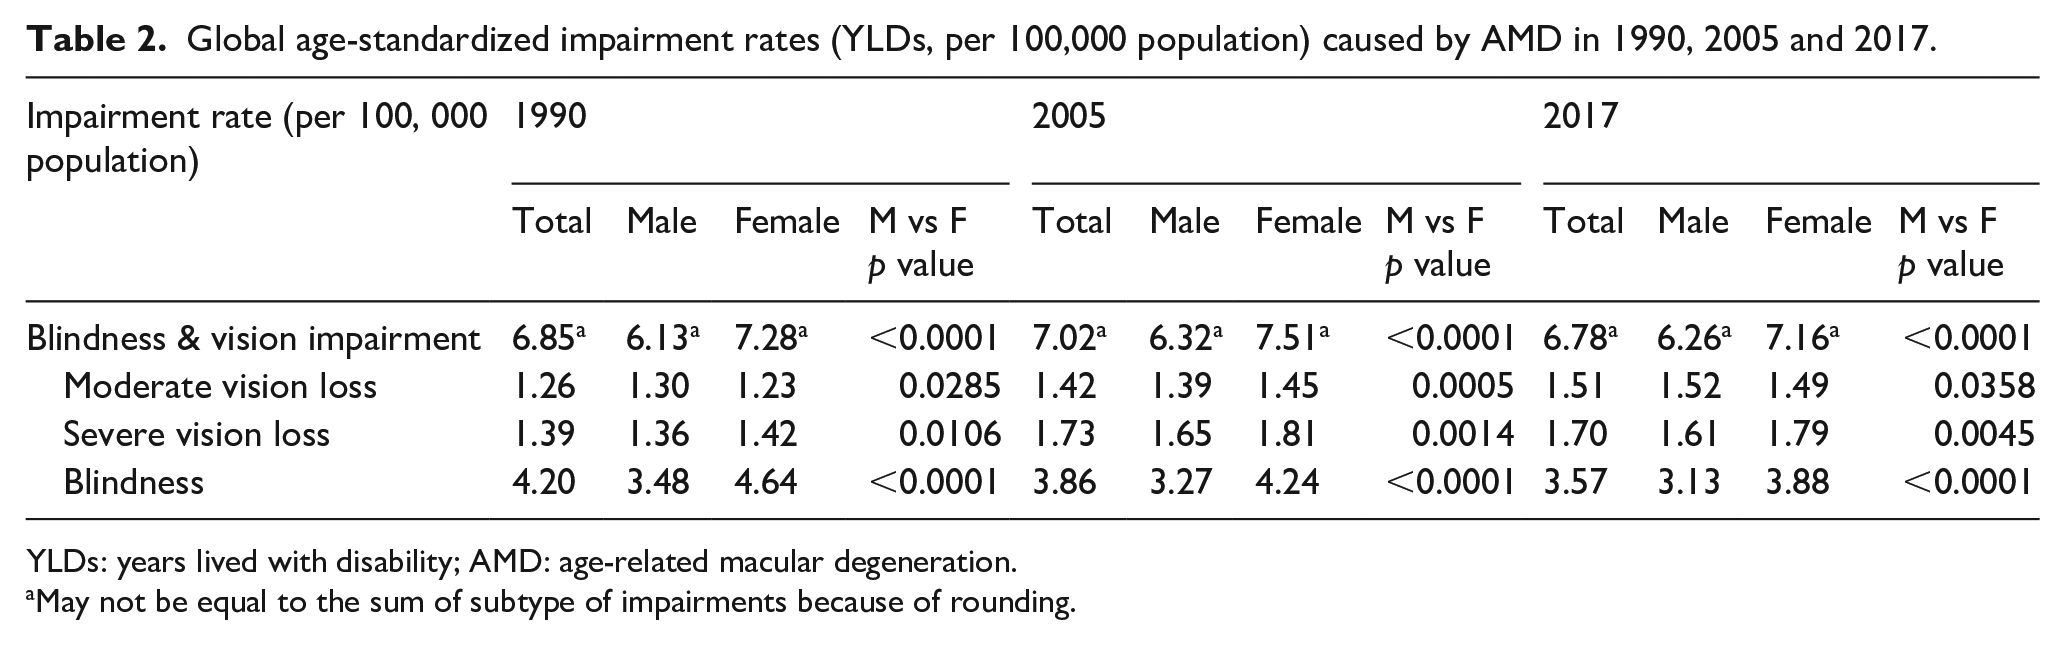
YLDs: years lived with disability; AMD: age-related macular degeneration.
May not be equal to the sum of subtype of impairments because of rounding.
Global gender-specific AMD burden by age
GBD Study 2017 started to capture DALYs estimates for persons between 45 and 49 (Figure 1E, F). In aspect of DALYs number, both total and sex-specific DALYs peaked around age range of 65 to 70, then after a small down shift at 75 to 80, they rocketed with aging. Gender inequality was not noticeable until age of 55. After controlling of population size, burden of AMD kept an increasing trend during all age ranges. Gender gap enlarged along with a steeper slope of elevating trend in population older than 75. Among subjects older than 80, crude DALYs rates were 105.4 and 81.0 per 100,000 persons for female and male, respectively.
Gender-specific AMD burden by socioeconomic status
Paired Wilcoxon signed rank test implicated that female borne significantly higher age-standardized DALYs than male (p < 0.0001), with median rate of 4.487 (interquartile range [IQR], 2.219–9.573) among female and 4.232 (IQR, 2.438–8.650) among male, for the 195 countries included in GBD Study 2017. Figure 2A, B maps the distribution of health burden of AMD by gender difference (female-minus-male) and gender ratio (female-to-male). Leading three countries with the greatest gender difference and gender ratio were Ethiopia, Eritrea, United Kingdom and New Zealand, Australia, Iceland, respectively.
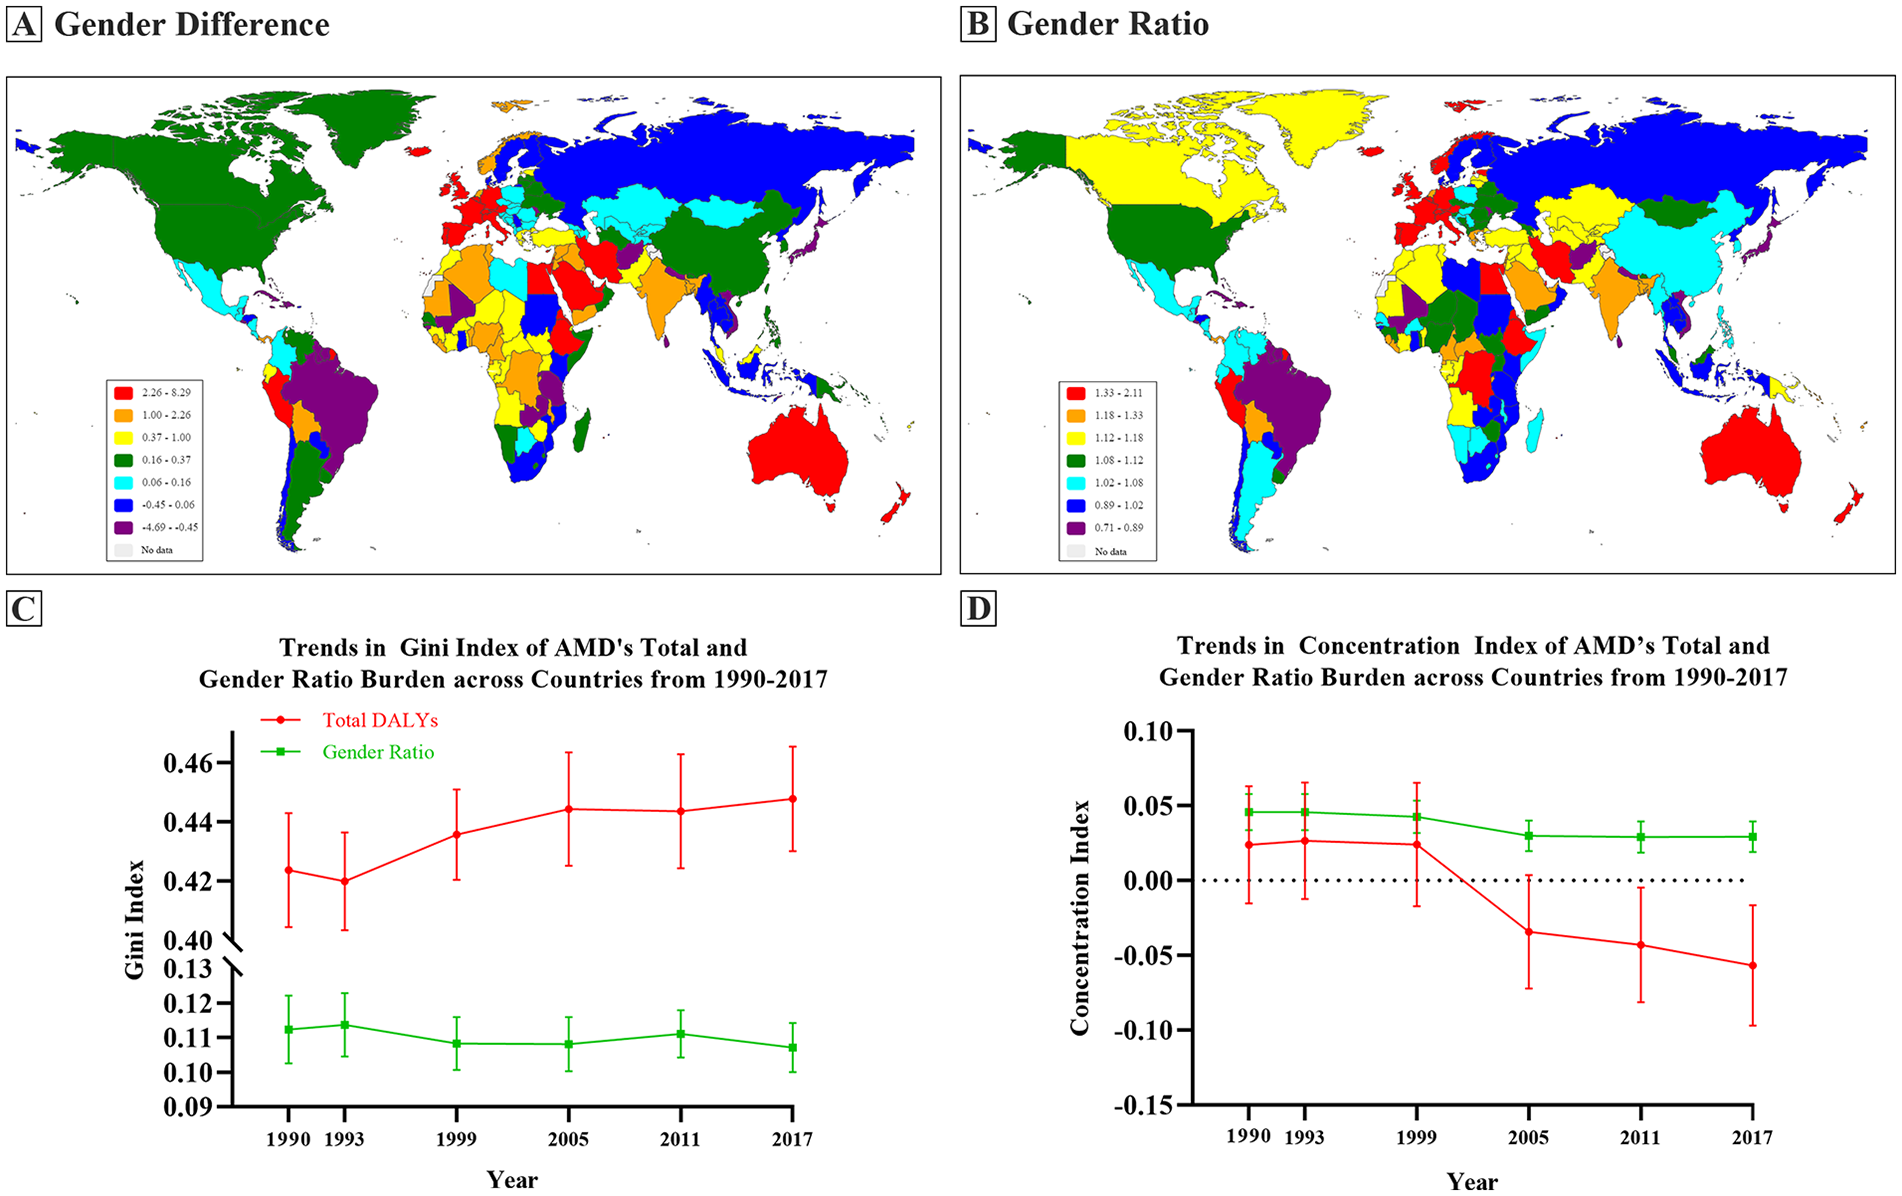
Geographical distribution of Global Burden of Age-related Macular Degeneration by Gender Difference/Ratio and Trends of Health Inequality Measurements. (A) Gender difference maps; (B) Gender ratio maps; (C) Gini index; (D) Concentration coefficients.
Total and sex-specific age-standardized DALYs rates of AMD presented different patterns in WBIL regions (Figure 3). Total rates kept rising in low income region and female rates overpassed male rates at 2013 (10.877 vs 10.856). While gender disparity has persisted among lower middle and high income regions with increasing and decreasing trends of total rates, respectively. Upper-middle income region displayed a pattern like “M” character, where gender imbalance was narrowed at the start and end point of observation period.
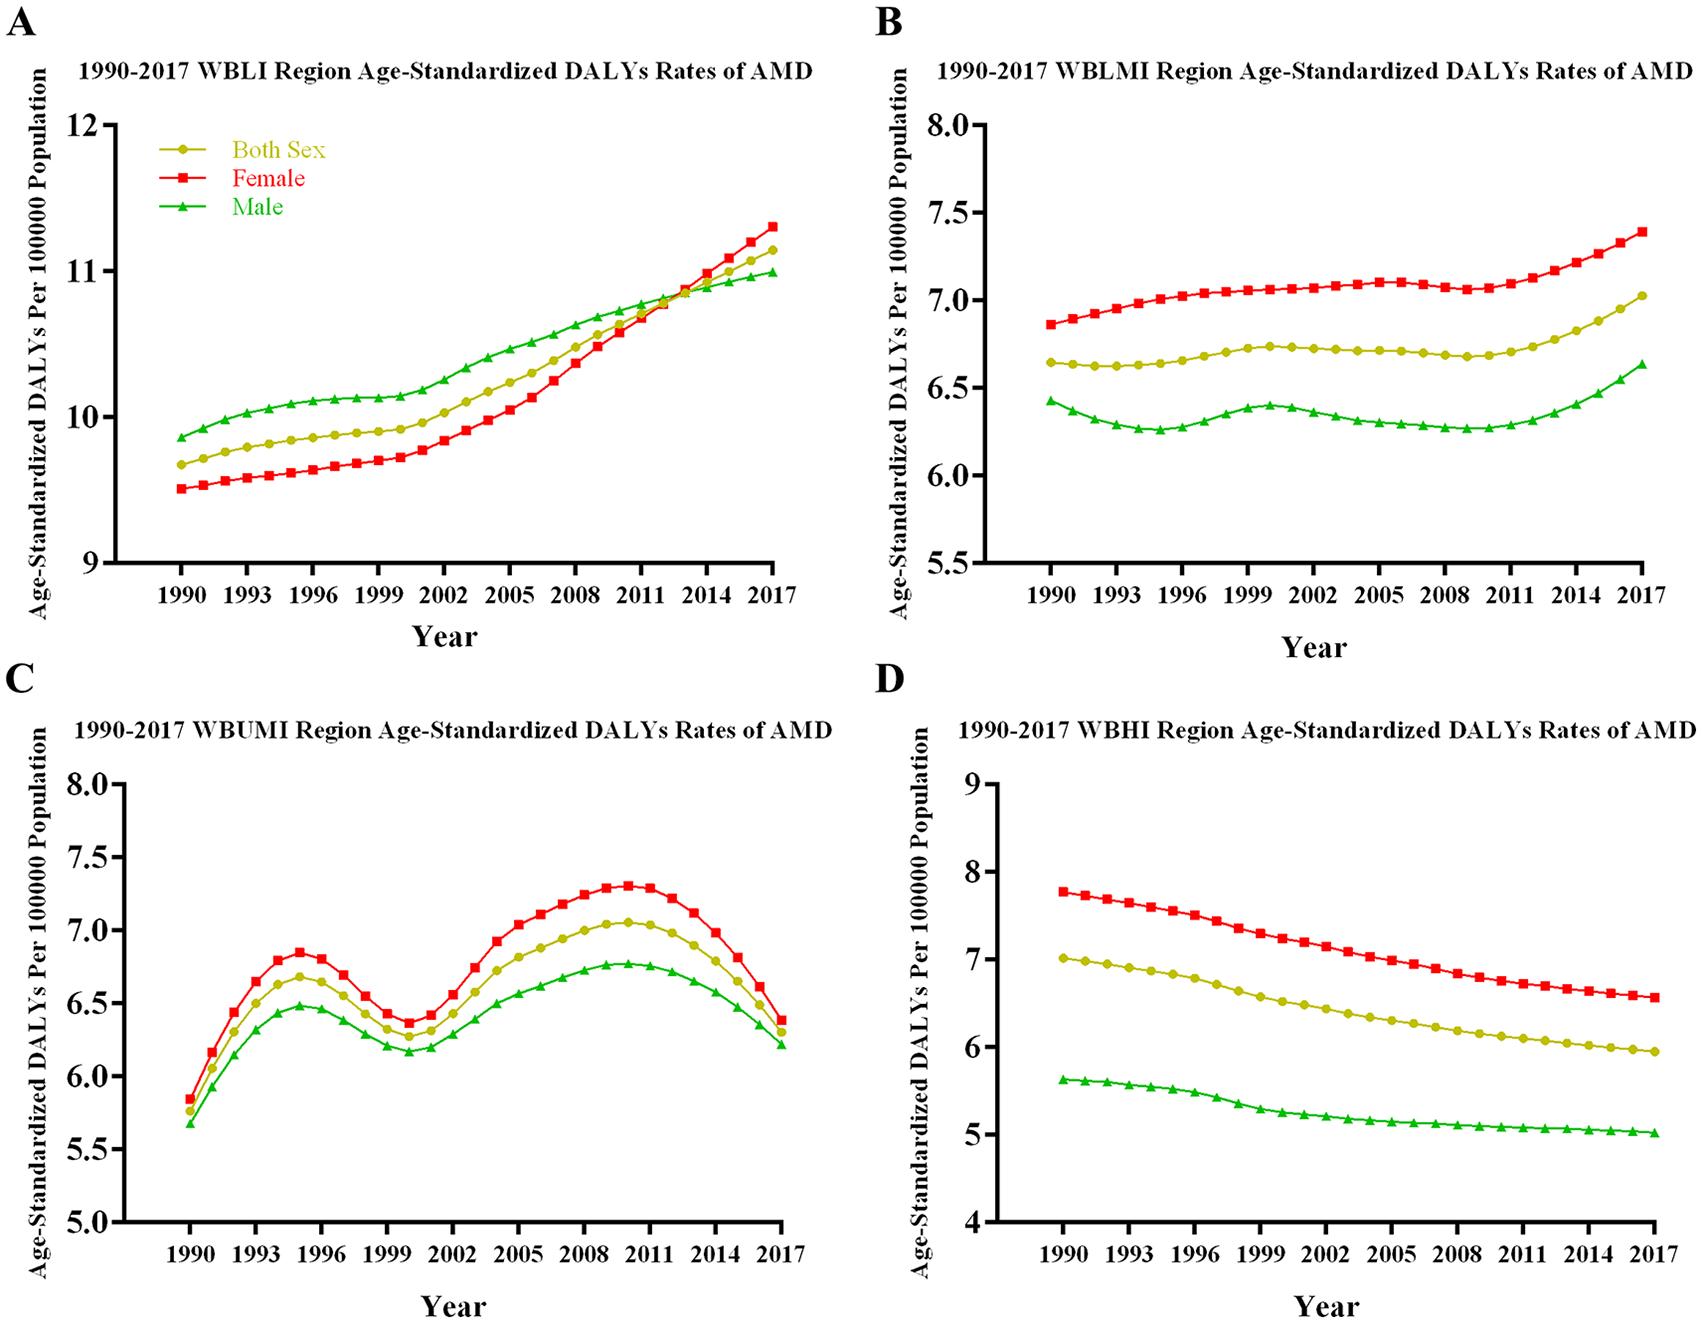
Global Total and Gender-Specific Burden of Age-related Macular Degeneration in Different World Bank Income Level regions from 1990 to 2017. (A) WBLI region; (B) WBLMI region; (C) WBUMI region; (D) WBHI region.
Based on HDI category criteria, there were 184 countries under coverage of 2017 human development report, 57 of which were with very high HDI, 50 high HDI, 39 medium HDI and 38 low HDI. Higher age-standardized DALY rates were observed in low and very high HDI countries in both sexes. Except for high HDI regions, age-standardized DALYs of women were significantly higher than those of men: very high HDI region (median rates, 5.656 vs 4.585, p < 0.0001), medium HDI region (median rates, 4.487 vs 4.288, p = 0.019) and low HDI region (median rates, 8.747 vs 8.091, p = 0.003) (Figure 4A). Despite the declined trends of total AMD age-standardized rates, the Gini index kept rising from 0.424 in 1990 to 0.448 in 2017. While the ones of female-to-male ratio fluctuated around 0.11 between 1990 and 2017, with concentration coefficients changing from 0.024 to −0.057 and 0.046 to 0.029 respectively. Negative value of concentration coefficients might indicate that AMD burden inequality was becoming higher among the poor (Figure 2C, D). Differences by sex in age-standardized DALYs rates were positively associated with HDI in Pearson correlation (r = 0.1721, p = 0.0195) and in Linear regression (equation: Y = 2.007*X−0.5303, p = 0.0195). Similarly, gender ratios were positively associated with HDI in Pearson correlation (r = 0.2072, p = 0.0048) and in Linear regression (equation: Y = 0.3112*X+0.9017, p = 0.0048) (Figure 4B, C).
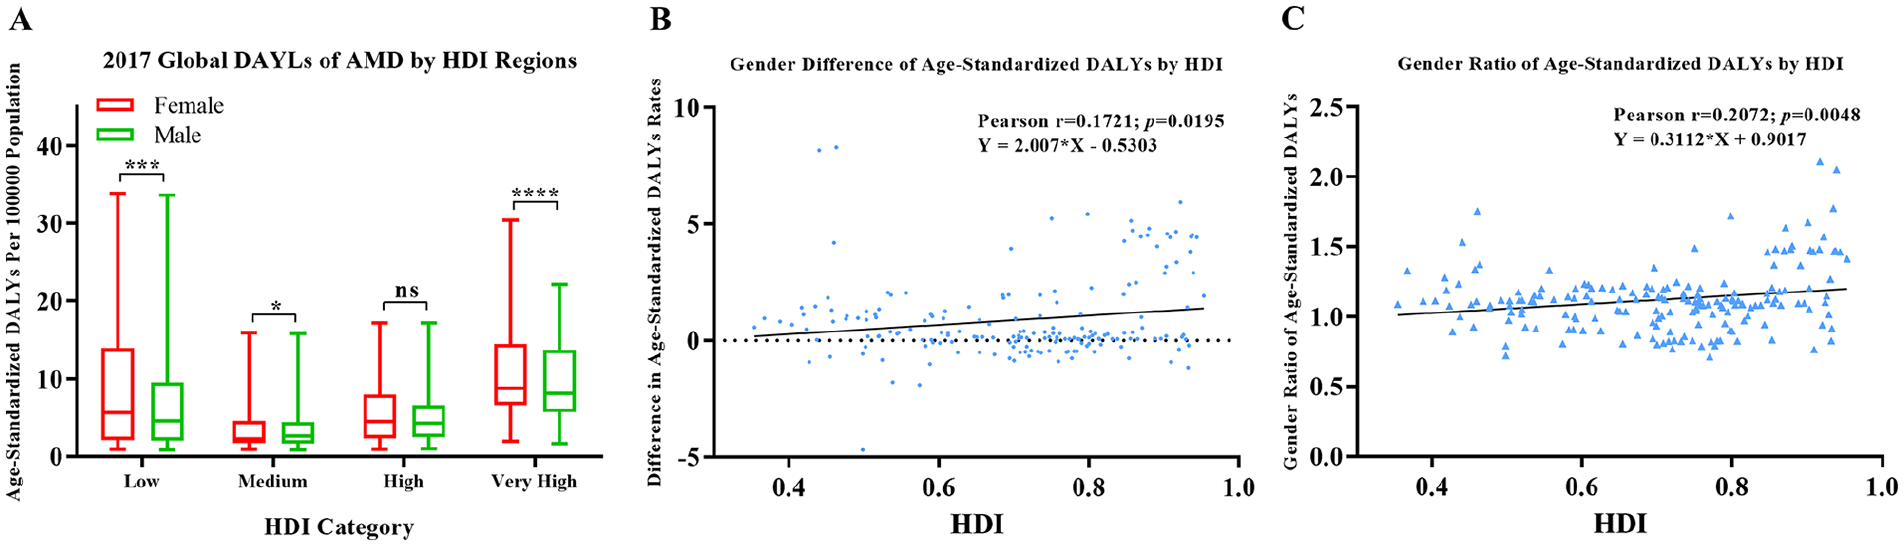
Gender-specific burden of age-related macular degeneration of different human development index regions in 2017. (A) Age-standardized DALYs of AMD in different HDI regions; (B) Association between gender difference with HDI; (C) Association between gender ratio with HDI.
Discussion
This study demonstrated that there was a new time pattern of slightly descending trend in AMD total age-standardized DALYs. However, Gini index of total AMD burden kept rising and gender disparity in the global burden of AMD has persisted since 1990. Women bore significantly higher burdens and suffered notably heavier vision impairments caused by AMD. Globally, sexual inequality gaps widened with aging with unique trend patterns among different income and WHO regions in vertical perspective of the past 27 years. Interestingly, it seemed to be greater in countries with higher socioeconomic status.
Several previous studies indicated continuously increasing trends of visual impairments and global disease burdens caused by AMD. Jonas et al. reported that during the period from 1990 to 2010, the number of blind and visual impaired people rose by 0.6 million or 36% and 2.7 million or 81% respectively, while the global population increased by 30%. 21 More recently, Wang et al. had demonstrated that DALYs rate increased from 6.17 per 100, 000 at 1990 to 7.36 at 2015 based on data in GBD Study 2015, even after accounting for population and age structure. The constant increase may be explained by population growth, aging structure and longer life expectancies. 9 However, our study, which was based on the latest data from GBD Study 2017, revealed a quite different trend pattern that Wang et al.’s study had shown. Age-standardized global burden of AMD fluctuated through past decades, with a slight drop in recent years. At same time, health inequality kept enlarging (shown as Gini index increase, Figure 2C) and the concentration of disease burden seemed to be shifting from the rich to the poor (shown as change of concentration coefficients, Figure 2D). These discrepancies might be attributed to the following reasons: (1) GBD Study re-evaluates representative population-based studies annually, resulting in recruiting or excluding data sources. (2) anti-VEGF agents has revolutionized the treatment strategies against CNV AMD,22,23 which can improve and prolong visual function of millions of patients, leading to alleviation of AMD global burden. (3) Continuous updating of laser source and versatile lens (like super wide field lens) facilitates the procedure of photocoagulation and improves the outcome of treatments. Progress and new surgical techniques (such as CNV extraction, macular translocation and RPE-choroid sheet transplantation) of vitrectomy also contribute to AMD prognosis.24 –27
However, this trend pattern needs to be confirmed by future studies. AMD is still the third leading cause of blindness worldwide, just ranks after cataract and uncorrected refractive error. Moreover, anti-VEGF treatments are expensive and not available to all patients in many countries.16,28 –30 Controlling and reducing AMD burden should always be one of the priorities in public vision health policy making.
In addition to the findings of higher AMD burden in females that increased with aging in 2015 by Wang et al., 9 we further discovered that gender disparity had persisted since 1990 in different WHO, WBIL as well as HDI regions. As indicated by Gini and concentration indexes of AMD by gender ratio, the health inequality hasn’t improved much. Interestingly, gender difference seemed to be positively correlated with higher socioeconomic status. Though total AMD burden started to present a slowing pattern in terms of age-standardized DALYs, gender inequality should not be ignored. In the last decade, there has been increasing evidence that women are affected by blindness and visual impairment to a much greater degree than men. Women account for about 64% of the total number of blind persons globally. 31 And a meta-analysis showed that two out of three blind people are women, a gender discrepancy that holds true for both developed and developing countries. 15
There might be several factors to explain sexual difference. Women tend to live longer than men, in all parts of the world and at all time periods. Life expectancy for women is 5 years longer than men averagely, which may be smaller in countries with high pediatric mortality and more pronounced in countries with a high overall longevity. 32 As increased age is a consistent independent risk factor responsible for AMD, longevity of women partially contributes to relatively more AMD patients and heavier disease burden. 33 It is still conflicting whether gender is significantly associated with risk of AMD. Data from three major population-based studies, the Beaver Dam Eye Study, the Blue Mountain Eye Study and the Rotterdam Study, yielded a pooled odds ratio (OR) of 1.15 (95% confidential interval, 1.10–1.21) with increased risk for AMD in women. 34 A meta-analysis suggested that there were higher risks of CNV in women compared with men (OR, 1.2; 95% credible intervals, 1.0–1.5) among population with European ancestry. 35 While some researches indicated elevated risk of different degrees of drusen in women.33,36 Potential factors like reproductive period, lactation duration as well as estrogen exposure might be associated AMD prevalence, yet other studies have failed to confirm that.37,38 However, based on GBD 2017, we retrieved higher prevalence of AMD among female in the past decades (Figure S2), which might also cause gender disparity of AMD burden.
In addition to those above-mentioned biological explanations, some social, cultural and economic difference between genders might also lead to higher AMD burden in female. For example, women were likely to be restrained by daily homework and children-raising responsibilities, thus having less freedom to seek for eye care. Moreover, women’s visual medical needs could be underestimated compared those of men. Female usually does not have financial decision-making authority, leading to their incapability of paying for visual health bills.31,39 Besides, lower education level and literacy prevent women from obtaining and understanding information about vision loss diagnosis and treatments. 39 Even in developed countries such as Sweden, female patients generally have poorer vision preoperatively and longer waiting times for surgery the men. 40
Through linking age-standardized DALYs to HDI, positive associations between HDI and both female-minus-male and female-to-male ratio were observed in our study. As an indicator of national socioeconomic status, HDI is a composite measure of health, educational attainment, and income. Several studies have indicated lower socioeconomic level is significantly associated with higher female burden of disease, such as cataract and uncorrected refractive error.41,42 Low and middle-income countries usually bear heavier burden of reversible eye disease. However, our finding of gender disparity in higher socioeconomic countries should be paid attention to. Relatively longer life expectancy of women in developed countries might partially scale up the gender gap of AMD burden. It also could be attributed to health insurance policy and coverage, anti-angiogenesis agent and intravitreal injection pricing, accessibility of eye care education and medical performance among different districts in developed countries.43,44 Behavioral factors like cigarette consumption 45 and excessive nutrients intake and/or obesity46,47 lead to increasing inflammatory mediators accumulation and generate reactive oxygen species, which probably exacerbate AMD and pile up disease burdens in developed regions. Thus, it is as important as in developing countries to emphasize the priority of narrowing the gender gap of AMD burden in developed counties during health policy making.
The limitation of this study could not be ignored. Firstly, our research was subject to the methodological defect of the GBD Study 2017. For incidence, DALYs data was calculated by estimating through hierarchical models from representative population-based studies, whose original data sources and statistical hypothesis may introduce bias, as detailed in the study reports.12,13 Secondly, sampling error was likely to occur when using pooled data at a national level instead of district, due to geographic variations such as disease burden, socioeconomic status and lifestyles. Meanwhile, inconsistent AMD diagnostic criteria and developing image technologies should also be taken into account, which might enlarge detection rates and prognosis evaluation gaps between different HDI regions. Subnational (where applicable) location category was introduced from GBD 2015, besides global, super-region, region and country levels. However, AMD researches were still limited on country level, which restricted study ability to do deeper analysis. Although global sexual inequality of AMD disease burden had been unveiled in our study, it should be cautious to interpret this conclusion at a specific district. As GBD study updates annually, further exploration of AMD burden pattern and gender difference is required to cover a longer term. This study was mainly an epidemiological descriptive research, which focused on re-digging GBD database, using multiple statistical analyses, correlating to associated databases and revealing some objective phenomena of AMD disease burden. As to underlying mechanisms for those findings, we could only appeal to relevant literatures and hypothesis deduction. There must be other possibilities left unmentioned.
Conclusion
This international, comparative burden of disease study updated and discovered a descending trend pattern of total AMD burden globally, in aspect of age-standardized DALYs. Nevertheless, little improvement has been achieved toward gender disparity. Especially elder female in highly developed countries seemed to be more likely to bear heavier burden of AMD. These findings might draw more public attention to global AMD burden as well as the sexual inequality. Hopefully, it could serve as an incentive for continued international and national consultation and targeting of efforts to improving AMD burden and narrowing gender gap.
Supplemental Material
Figure_S1_WHO_regions – Supplemental material for The pattern and gender disparity in global burden of age-related macular degeneration
Supplemental material, Figure_S1_WHO_regions for The pattern and gender disparity in global burden of age-related macular degeneration by Xiling Lin, Lixia Lou, Qi Miao, Yijie Wang, Kai Jin, Pengfei Shan and Yufeng Xu in European Journal of Ophthalmology
Supplemental Material
Figure_S2_Age_adjusted_AMD_prev – Supplemental material for The pattern and gender disparity in global burden of age-related macular degeneration
Supplemental material, Figure_S2_Age_adjusted_AMD_prev for The pattern and gender disparity in global burden of age-related macular degeneration by Xiling Lin, Lixia Lou, Qi Miao, Yijie Wang, Kai Jin, Pengfei Shan and Yufeng Xu in European Journal of Ophthalmology
Footnotes
Declaration of conflicting interests
The author(s) declared no potential conflicts of interest with respect to the research, authorship, and/or publication of this article.
Funding
The author(s) disclosed receipt of the following financial support for the research, authorship, and/or publication of this article: This work was supported by National Natural Science Foundation of China (81900853, 81670744, 81870564), Science Technology Department of Zhejiang Province of China (2017C33037) and China Postdoctoral Science Fund (2019M652107).
Supplemental material
Supplemental material for this article is available online.
References
Supplementary Material
Please find the following supplemental material available below.
For Open Access articles published under a Creative Commons License, all supplemental material carries the same license as the article it is associated with.
For non-Open Access articles published, all supplemental material carries a non-exclusive license, and permission requests for re-use of supplemental material or any part of supplemental material shall be sent directly to the copyright owner as specified in the copyright notice associated with the article.