
Abstract
Purpose
To explore the optimized concentration of AAV2-GFP for sparse transfection of retinal ganglion cells (RGCs) and optic nerve (ON), and to examine the changes of microglial morphology and distribution in the retina, optic nerve and chiasm after injection.
Methods
We defined the optimal concentration of AAV2-GFP for sparse labeling of RGCs and axons in WT mice. We further explored the changes of microglial morphology and distribution in the retina, optic nerve and chiasm after intravitreal injection in CX3CR1+/GFP mice.
Results
14 days after intravitreal injection of AAV2-GFP, live imaging of the retina showed that fundus fluorescence was very strong and dense at 2.16 × 10¹¹ VG/retina, 2.16 × 10¹⁰ VG/retina, 2.16 × 10⁹ VG/retina. RGCs were sparsely marked at a concentration 1:1000 (2.16 × 10⁸ VG/retina) and fundus fluorescence was weak. The transfected RGCs and axons were unevenly distributed in the retina and significantly more RGCs were transfected near the injection site of AAV2-GFP compared to the other sites of the flat-mounted retina. Microglia density increased significantly in the retina and part of optic nerve, but not in the optic chiasm. The morphology of microglia was largely unchanged.
Conclusions
AAV2-GFP was highly efficient and the optimal concentration of sparsely labeled RGCs was 1:1000 (2.16 × 10⁸ VG/retina). After intravitreal injection of AAV2-GFP, the number of microglia increased partly. The morphology of microglia was comparable.
Introduction
Our understanding of neural tissue has progressed due to sequential advances in our ability to image individual neurons using techniques including Golgi staining, electron microscopy, antero- and retrograde marking methods and immuno-histochemical labeling 1 . Transgenic mice, Cholera Toxin B subunit (CTB) and Adeno-associated viruses (AAVs) are commonly used for axon labeling2–4. Transgenic mice have been used extensively to study the development and regeneration of neurons1,2, 5–7. However, the breeding of transgenic mice is a time-consuming process and reports have suggested that the expression of fluorescent proteins may be cytotoxic 8 . CTB is a reliable tracer that has been widely used to analyze the mechanisms of communication between the retina and its synaptic targets9–12. Intravitreal injection of CTB is highly efficient labeling process which often results in the labeling of so many axons within the nerve that it can be challenging to resolve individual axons. AAVs are members of the Parvovirus family that have high specificity and infection efficiency making them effective vehicles for engineering of gene delivery systems13, 14. AAV2 preferentially transfects RGCs and generates sustained transgene expression following intravitreal injection13, 15, 16. Sparse labeling of axons is an advantageous approach that allows visualizing the relationship between axons and glial cells, and can be achieved using an optimum AAV2-GFP concentration.
Within the central nervous system (CNS), microglia cells are the main resident innate immune cells and have important roles in the development, homeostasis and the development of disease17, 18. Under normal conditions, microglia have a small rod-shaped soma from which numerous thin and highly ramified processes extend19, 20. Following injury, activation of microglia is accompanied by morphological changes including increases in cell body size, decreases in the number of cell processes. Other alterations include the retraction and thickening of cell processes and changes in orientation towards the direction of the injury site21, 22. Based on these observations, changes in the morphology and distribution of microglia have been identified as cellular endpoints that can be used to assess the efficiency of AAV2-GFP transduction 23 .
In order to study the interaction between optic nerve fiber and microglia, we labelled RGCs and axons by intravitreal injection of AAV2-GFP in CX3CR1-/GFP transgenic mice in which all the microglia expressing CX3CR1 are GFP positive. We explored the optimal dose of AAV2-GFP for sparse transduction of RGCs and ON axons, and characterized the changes of microglial distribution in the retina, optic nerve and optic chiasm two weeks after injection.
Materials and methods
Experimental animals
Experiments were conducted in strict accordance with the Association for Research in Vision and Ophthalmology statement for the use of animals in ophthalmic and vision research. Experimental protocols were approved by the Institutional Animal Care and Use Committee in the Wenzhou Medical University (WMU). 8 to 16 weeks old male mice (CX3CR1+/GFP and C57BL/6J WT) were used in the experiments. Heterozygous CX3CR1−/GFP transgenic animals were generated in house by breeding CX3CR1GFP/GFP mice (The Jackson Laboratory, catalog no. 005582) with C57BL/6J mice obtained from Charles River laboratories. All animals were housed in the WMU animal facility under a 12-hour light/12-hour dark cycle with food and water ad libitum.
AAV production
The AAV2 vector was produced as previously described24, 25. The serotype of the AAV vector was AAV2 which contained the gamma-synuclein (mSncg) promoter. AAV2-mSncg-GFP preferentially infected RGCs and produced sustained transgene expression after intravitreal injection. The AAV2-GFP titer was 1.44×10¹⁴ VG/ml. Therefore, we used 1.5 μl for intravitreal injection of each eye, and diluted to 1:1, 1:10, 1:100, 1:1000, which represented titer of 2.16 × 10¹¹ VG/retina, 2.16 × 10¹⁰ VG/retina, 2.16 × 10⁹ VG/retina, 2.16 × 10⁸ VG/retina, respectively.
Intravitreal injection of AAV2-GFP
Mice were anesthetized by chloral hydrate according to their body weight (500mg/kg, wabcan, catalog no. ST1002). Proparacaine (0.5%, Alcaine; Alcon Laboratories, Belgium) was topically administered for local anesthesia. Intravitreal injection was performed as described previously26, 27. For each AAV2-GFP intravitreal injection, a 30-G micropipette (Hamilton, catalog no. 7653-01) was inserted 1 mm behind the ora serrata into the vitreous cavity to avoid lens damage. Approximately 1.5 μl of the vitreous fluid was removed before injection of 1.5 μl AAV2-GFP into the vitreous chamber. Injections are given slowly to allow diffusion of the virus stock. Ofloxacin eye ointment (Shenyang Xingqi Pharmaceutical Co., Ltd, China) was applied to protect the cornea following surgery.
Live retina fundus imaging
After the mice were anesthetized, pupils were dilated with 0.5% tropicamide phenylephrine eye drops (SANTEN Co., Ltd, China). Before the examination, ofloxacin eye ointment was applied on the surface of the cornea to improve the connection with the machine (Micron IV, Phoenix Research Labs), and then live retina fundus imaging was performed.
Transcardial Perfusion
The perfusion device was assembled with a peristaltic pump (Longer Precision Pump Co., Ltd, China) using 25 gauge butterfly needle and tube. Animals were deeply anesthetized and the lung and heart exposed. The inferior body and pulmonary circulations were then block using curved hemostatic forceps. For histological experiments, animals were perfused with 2 ml of PBS and 10 ml of 4% paraformaldehyde (Sigma, catalog no. 441244) at a flow rate of approximately 1.5 ml/min.
Immunohistochemistry of the whole-mount retina
Mice were euthanized by perfusion and the eyes were removed. Enucleated eyes were dissected to form posterior segment eyecups that were fixed in 4% paraformaldehyde (PFA) in PBS for 1 hour at room temperature. Retinal flat mounts were preincubated in blocking buffer consisting of 10% normal donkey serum (Jackson; catalog no. 017-000-121) and 0.5% PBST for 6 hours at room temperature. Primary antibodies, which included Anti-GFP (1:400; Aves Labs, catalog no. GFP-1020), were diluted in blocking buffer and incubated for 24 hours at room temperature on a shaker. After washing in 0.5% PBST, retinas were incubated for 12 hours with secondary antibodies which included Alexa Fluor 488 conjugated anti-chicken immunoglobulin Y (1:400; Jackson; catalog no. 703-545-155).
Frozen sectioning of the optic nerve and optic chiasm
After trans-cardiac perfusion with 4% paraformaldehyde in PBS, the optic nerve and optic chiasm were dissected out and immediately post-fixed with 4% PFA for 24 hours at 4°C. Samples were then cryoprotected by incubating in 30% sucrose overnight at 4°C and embedded in O.C.T. compound (SAKURA; catalog no. 4583). Frozen sections (30 μm) were cut using a Leica cryostat (Leica RM2235) and collected on SuperFrost Plus Slides. Sections were washed three times for 5 minutes in PBS before a cover slip was attached with Fluoromount Aqueous Mounting Medium (Sigma, catalog no. SLBX8500).
Image analysis
Confocal images were taken by Zeiss LSM880 system (Carl Zeiss Meditec). Microglia densities were obtained by manually counting cells at 20× magnification through a multiplane z-series of the flat-mounted retina, optic nerves and optic chiasm in frozen sections using computer-assisted software (ImageJ, NIH). Image analyses were performed within four regions (the middle of the retina) which measured 425.1×425.1 μm and extended the entire thickness of the retina. As microglia and RGCs were labeled green, and had many long branches, cells were manually counted in each layer (1 μm) of the images. Three frozen sections were taken from each optic nerve and optic chiasm. For optic nerve, three images were taken from each section at 500 μm from optic disk (proximal segment), between optic disk and optic chiasm (middle segment), and 500 μm from the optic chiasm (distal segment). Image analyzed measured 200 by 300 μm. For the optic chiasm, three pictures were taken from each section at the middle, and left and right posterior leg regions. The field size used for analyses was 200 by 200 μm in each case. Microglia morphology was analyzed at 63× magnification for individual cells located in each location.
Statistical analysis
All data were expressed as the mean ± S.E.M and analyzed using statistical software (GraphPad Prism Software, Version 7). A Student's t-test was used for two-group comparison. For 3-way comparisons, a one-way ANOVA was used. Correlation analysis was performed using the Pearson correlation calculation. A P-value < 0.05 was considered to be statistically significant and represented as follows; *: p<0.05, **: p<0.01, ***: p<0.001, ****: p<0.0001.
Results
Determining the optimum concentration of AAV2-GFP
RGCs are the only projection neurons in the retina that transmit visual information from the retina to the brain. The optic nerve and optic chiasm are formed by the projection axons sent exclusively from RGCs and have a simple unidirectional pathway. AAV vectors have been extensively used as gene-delivery systems for basic experimental research and human gene therapy28–30. AAV is directly injected into the vitreous chamber of the eye and specifically and efficiently expresses transgenes in adult RGCs. AAV preferentially infects RGCs and produces continuous transgene expression after intravitreal injection13, 15, 16, 27, 31, 32. This spatially and temporally controlled genetic manipulation allows the sparse labeling of RGCs and axons to allow the investigation of test interventions that can potentially be translated to therapies 33 . AAV-mediated gene expression in RGCs has been shown to generally peak 2 weeks after infection4, 31. Therefore, we intravitreally injected AAV2-GFP into WT and GFP mice 2 weeks prior to perfusion.
To determine the optimum concentration of AAV2-GFP to sparsely label RGCs and axons, AAV2-GFP was injected at a range of concentrations (1:1, 1:10, 1:100, 1:1000 diluted in PBS). After 14 days, mouse fundus images were taken with the micron IV and found that fundus fluorescence was very strong and dense at 1:1, 1:10, 1:100 concentrations (Fig. 1A-C). RGCs were sparsely marked at a concentration 1:1000 (2.16 × 10⁸ VG/retina) and fundus fluorescence was weak (Fig. 1D). As a result, the optimum concentration of AAV2-GFP was 1:1000 (2.16 × 10⁸ VG/retina) at which RGCs were sparsely labeled. The distribution of RGCs transduced with GFP mainly perivascular (Fig. 1C and D).
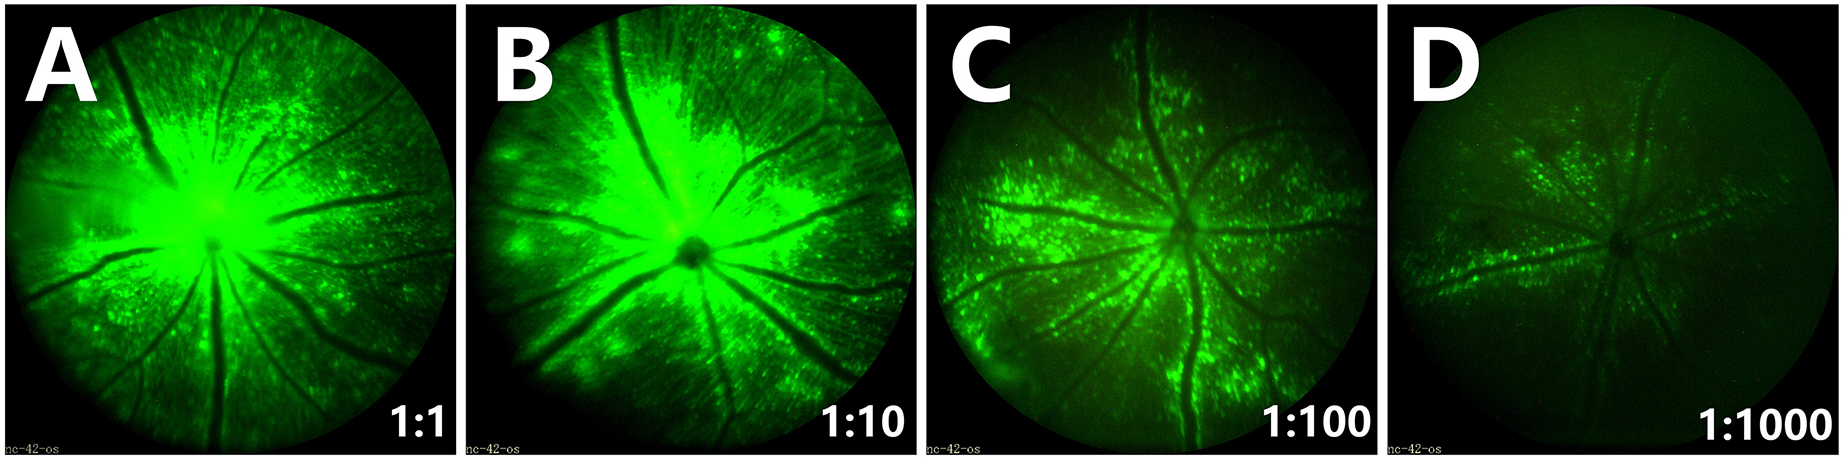
Fundus fluorescence observed following injection of different concentrations of AAV2-GFP. (A-D) Representative fundus fluorescence images of micron IV at different AAV2-GFP concentrations; (A) 1:1 (2.16 × 10¹¹ VG/retina), (B) 1:10 (2.16 × 10¹⁰ VG/retina), (C) 1:100 (2.16 × 10⁹ VG/retina), (D) 1:1000 (2.16 × 10⁸ VG/retina). (A-C) High concentrations of AAV2-GFP showed strong and dense hyper-fluorescence. (D) Low concentrations of AAV2-GFP showed a small number of weakly fluorescent RGCs (n = 5 mice for each concentration).
Transduction of the retina, optic nerve and optic chiasm with AAV2-GFP
AAV2-GFP can be injected directly into the vitreous cavity of the eye to introduce specific and efficient genes in adult RGCs and axons. CX3CR1+/GFP mice were intravitreally injected in both eyes with AAV2-GFP at the optimum concentration (1:1000, 2.16 × 10⁸ VG/retina). After 14 days, the eyeball, optic nerve and optic chiasm were dissected out (Fig. 2A). The whole-mount retina was evenly divided into four quadrants. Image analyses were performed within four retina regions (Fig. 2B). Fig. 2C showed that some of the AAV2-GFP transfected RGCs appeared green. Fig. 2D,E and F showed that GFP-expressing RGCs and microglia in all the fields. The transfected RGCs were unevenly distributed in the retina and significantly more RGCs were transfected near the injection site of AAV2-GFP compared to the other sites. Similarly, the sparsely transfected axons in the optic nerve and optic chiasm were unevenly distributed.
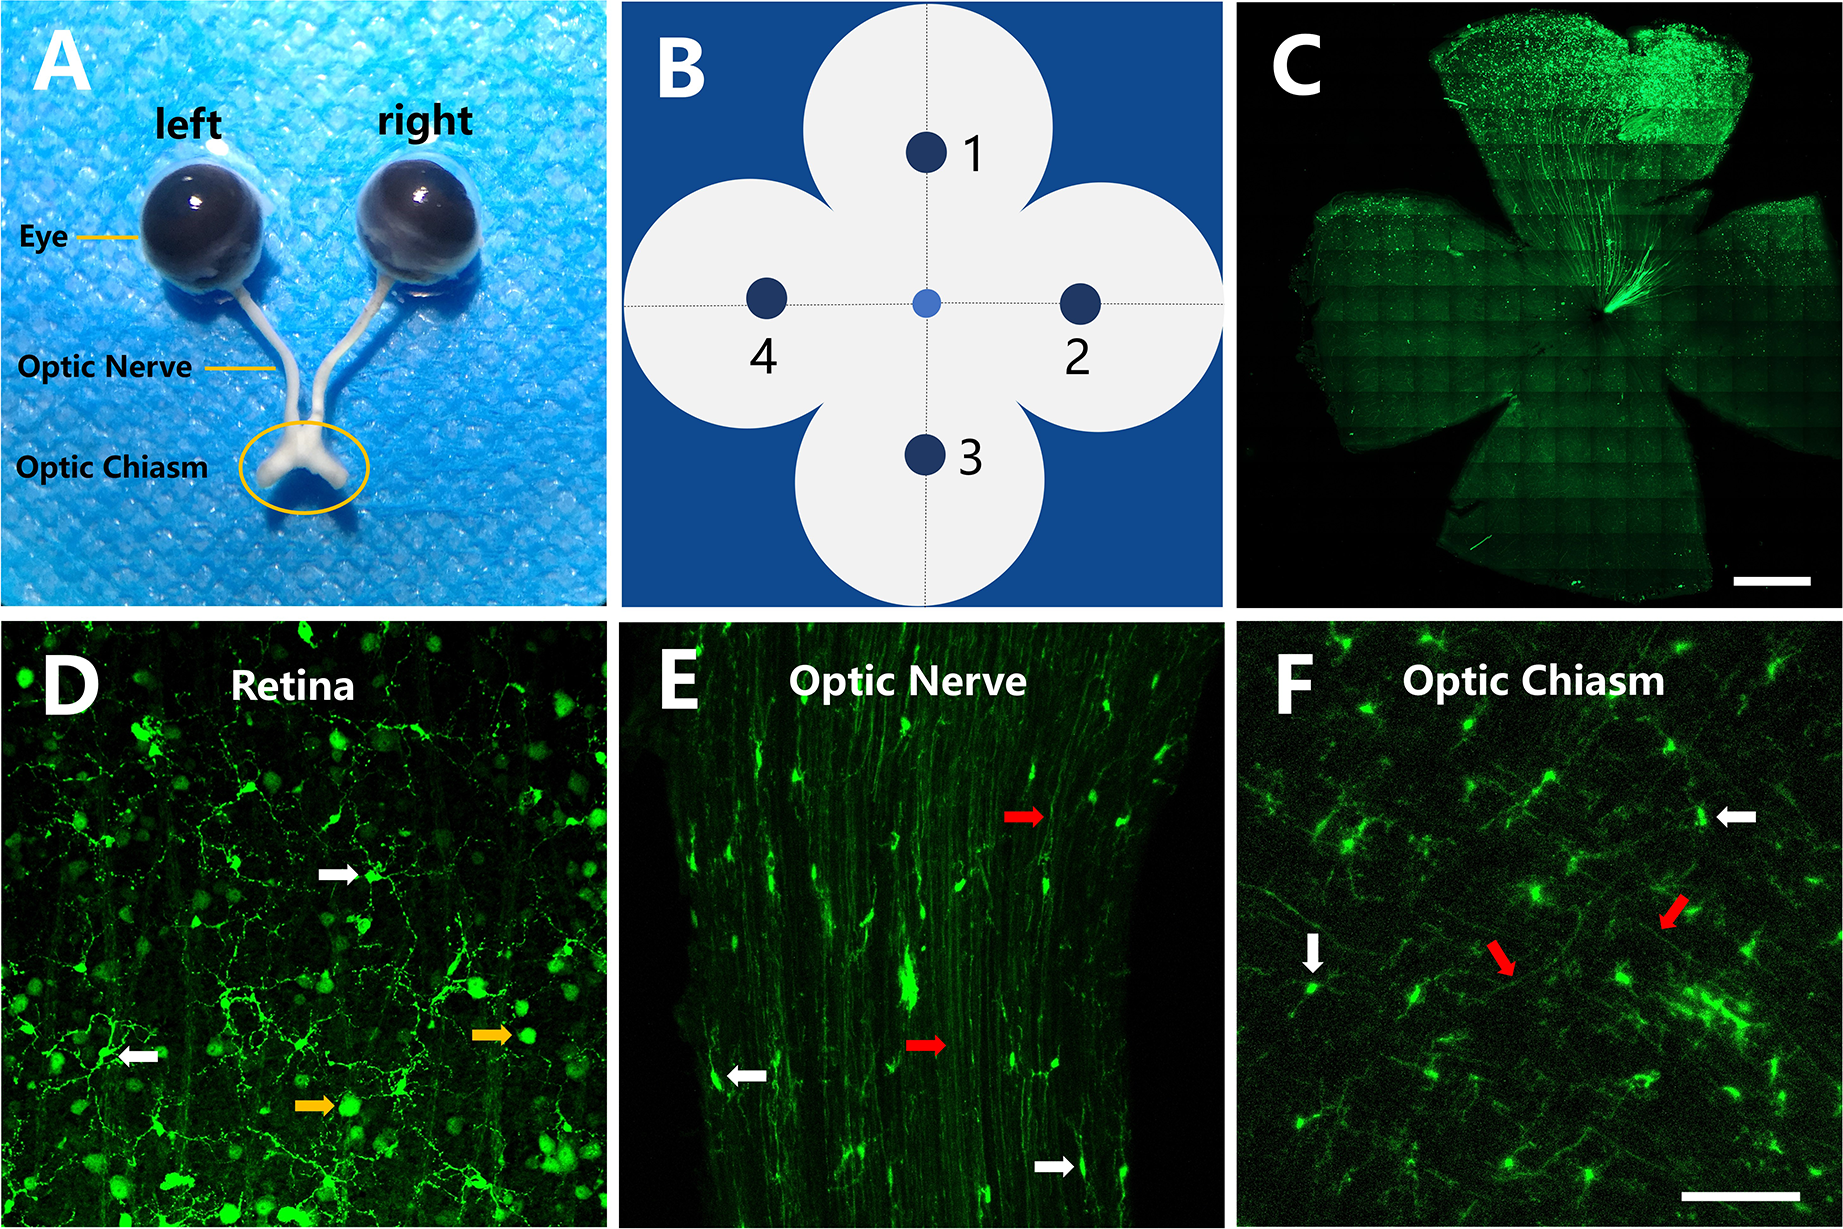
AAV2-GFP (1:1000, 2.16 × 10⁸ VG/retina) transduction studies. (A) Photograph of the intact eyeball, optic nerve and optic chiasm from a CX3CR1+/GFP mouse. (B) Picture of the whole-mount retina. 1-4 show the sites of image analysis at the middle of the retina. (C) The overall distribution of RGCs transfected by AAV2-GFP was analyzed in the flat-mounted retinal preparations from a C57BL/6J mouse. Images showed that the transfected RGCs were not evenly distributed in the retina and that significantly more RGCs were transfected near the injection site of AAV2-GFP compared to other sites. Scale bar = 1000 μm. (D) Transfected RGCs were sparsely distributed in the retina from a CX3CR1+/GFP mouse. (E and F) Transfected axons were sparsely distributed in the optic nerve and optic chiasm from CX3CR1+/GFP mice. (D, E and F) Scale bar = 100 μm. White arrow, microglia; yellow arrow, RGCs; red arrow, axons.
Morphology and distribution analysis of microglia in the retina after AAV2-GFP injection
Microglia are professional immune cell type in the CNS that have a regulatory role in CNS environment. To study the interaction between microglia and RGCs, we analyzed the morphology and distribution of microglia in the retina. CX3CR1+/GFP mice were intravitreally injected in both eyes with AAV2-GFP at 1:1000 (2.16 × 10⁸ VG/retina). After 14 days, the whole-mount retina was evenly divided into four quadrants. Image analyses were performed within the four regions of the imaging fields (the middle of the optic disk and the edge). Untreated CX3CR1+/GFP mice were used as controls. Microglia and RGCs were labeled green. The microglia had multiple long branches and so were manually observed and counted in each layer of the image.
In the uninjected or intact retina, microglia nuclei were typically oval-shaped and had slender processes projecting out from the cell bodies that enable the cells to move through chemotaxis (Fig. 3A and C). In the retina injected with AAV2-GFP, the morphology of microglia showed no major apparent changes (Fig. 3B and D), however, the number of microglia was significantly higher than that of the control group (Fig. 3E). These data indicated that AAV2-GFP increased the number of microglia in the retina but had no obvious impact on morphology.
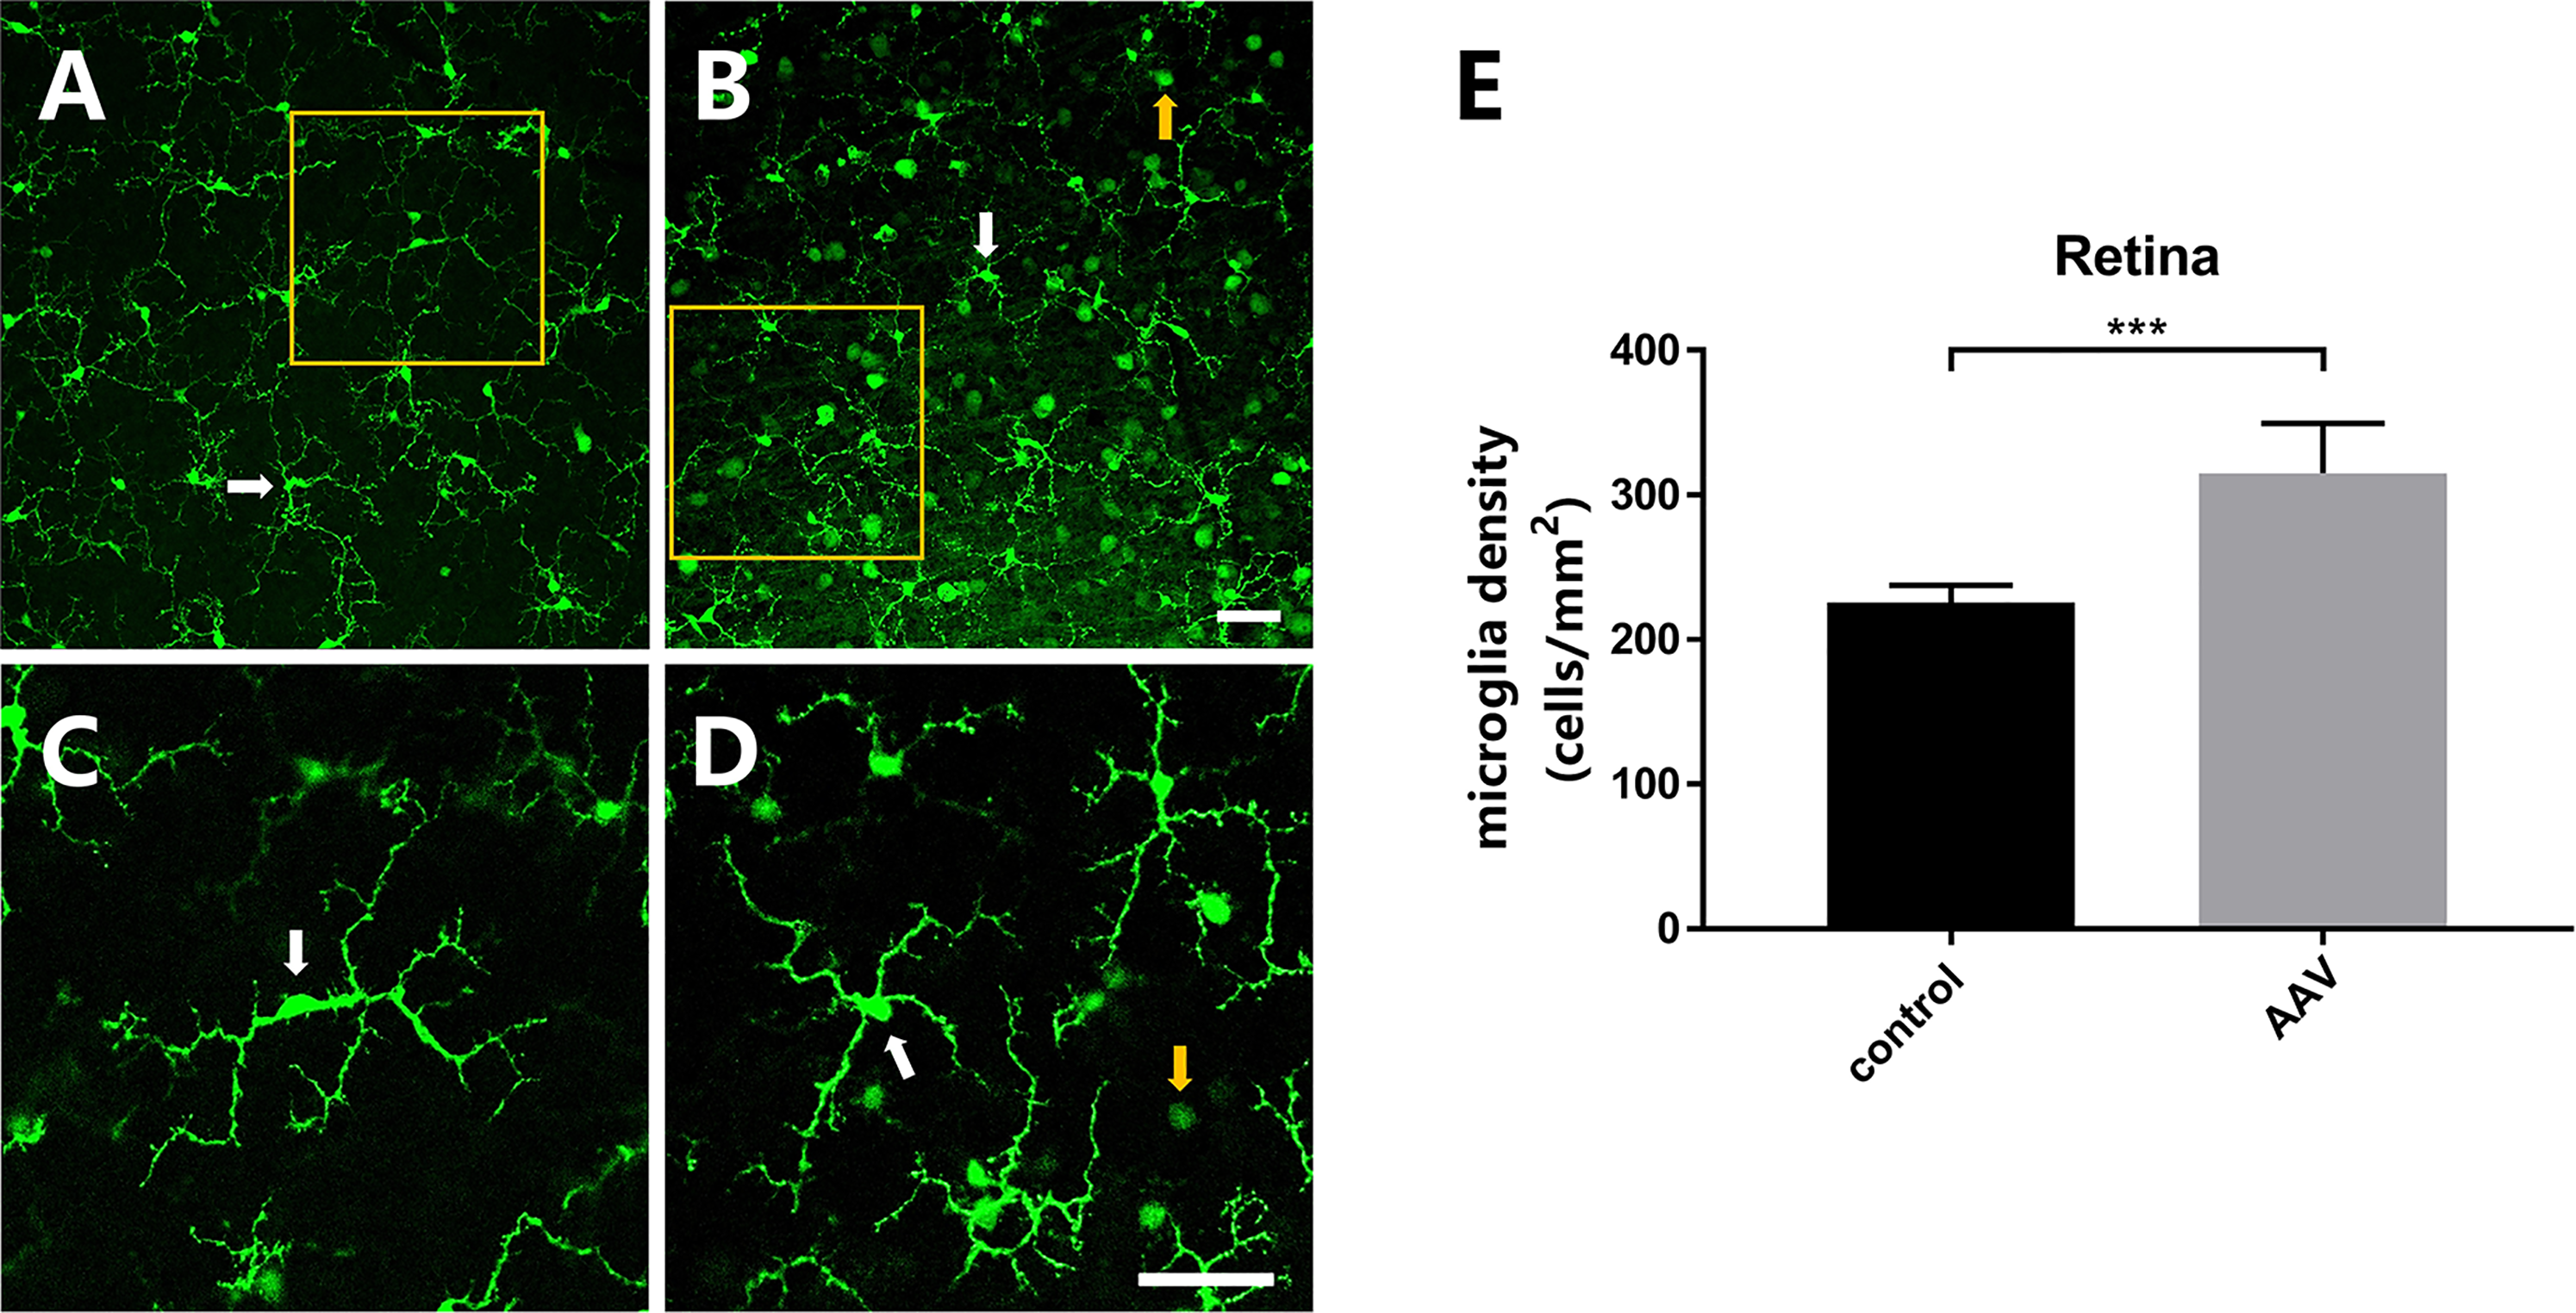
Morphology and distribution analysis of microglia in the retina after AAV2-GFP (1:1000, 2.16 × 10⁸ VG/retina) injection. (A) Confocal micrograph of a control whole-mounted retina from a CX3CR1+/GFP mouse. (B) Confocal micrograph of AAV2-GFP transfected flat-mounted retina from a CX3CR1+/GFP mouse. (C, D) High magnification view of microglia in the control and AAV2-GFP transfected flat-mounted retinas showing the unchanged morphology. (E) Quantification of microglia density in the control and AAV2-GFP injected retinas. Compared to the control retinal, the microglia density in the middle of the retina was significantly higher in the AAV2-GFP injected retina, indicating that AAV2-GFP increased the number of microglia (*** indicates 0.0001<p<0.001, Student's t-test, n = 4 imaging retinal fields analyzed per retinal location from each of 5 mice). (A to D) Scale bars = 50 μm. White arrow, microglia; yellow arrow, RGCs.
Morphology and distribution analysis of microglia in the optic nerve after AAV2-GFP injection
Intravitreal injection of AAV2-GFP could transfect not only RGCs but also axons. To investigate the interaction between microglia and optic nerve fiber, we also examined the morphology and distribution of microglia in the optic nerve. Three frozen sections were taken from each optic nerve and fluorescent images obtained proximal, middle and distal to the nerve (Fig. 4A). In the control optic nerve, the shape of microglia in the proximal segment was almost round. In the proximal and distal segments, the microglia were oval that the long axis was parallel to the axons. In the AAV2-GFP injected optic nerve, axons were sparsely labeled. The morphology of the microglia in three segments of the optic nerve were similar to the control (Fig. 4B). Fig. 4C shows a high magnification view of the microglia in the control and AAV2-GFP transfected optic nerve. Compared with the control group, microglia soma and processes were largely unchanged in the test group. Microglia density of optic nerve was counted for each slice and the location determined in the control and AAV2-GFP injected mice. We found that the number of microglia was significantly higher following AAV injection compared to the control. These data indicated that AAV slightly increased the number of microglia in the AAV2-GFP injected optic nerve (Fig. 4D).

Morphology and distribution analysis of microglia in the optic nerve after AAV2-GFP Injection. (A) Confocal micrograph of a frozen section of the entire optic nerve after AAV2-GFP transduction from a CX3CR1+/GFP mouse. The white wireframes represented three confocal regions: 500 μm from the optic disk (proximal segment), at the mid-point between the optic disk and the optic chiasm (middle segment), and 500 μm from the optic chiasm (distal segment). Scale bars = 500 μm. (B) Morphology of microglia in the control and AAV2-GFP transfected optic nerve were also analyzed in the optic nerve frozen sections using confocal microscopy at proximal, middle and distal segments. Scale bars = 50 μm. (C) High-magnification view of microglia in the control and AAV2-GFP transfected optic nerves. Scale bars = 50 μm. (D) Quantitative analysis of microglial density in the control and AAV2 injected optic nerve, indicating the number of microglia after AAV2-GFP injection was higher than that of the control in the proximal and distal segments (* indicates 0.01<p<0.05, one-way ANOVA, n=3 imaging fields analyzed per optic nerve from each of 5 animals). White arrow, microglia; red arrow, axons.
Morphology and distribution analysis of microglia in the optic chiasm after AAV2-GFP injection
The optic chiasm is part of the CNS where RGC axons from each eye meet. Most axons in mice project into the contralateral optic tract in the optic chiasm. The trajectory of axons in the optic chiasm was observed by intravitreal injection of AAV2-GFP. Three frozen sections were taken from each optic chiasm and fluorescent images obtained at the middle, left and right of each slice (Fig. 5A). In control samples, some of the microglia branches in the optic chiasm along the direction of axons and showed similar morphology. Following AAV2-GFP transduction, it was obvious that the axons were labeled in green and the microglia nuclei were small and had branched extensions in all directions (Fig. 5B). Fig. 5C shows a high magnification view of the microglia in the control and AAV2-GFP transfected optic chiasm. From the confocal micrographs, at both magnifications showed similar branching (Fig. 5B and C). Statistical analysis on the number of microglia cells in the control and AAV2-GFP injected optic chiasm showed no statistical difference suggesting that AAV2-GFP injection had no effect on microglia density (Fig. 5D).
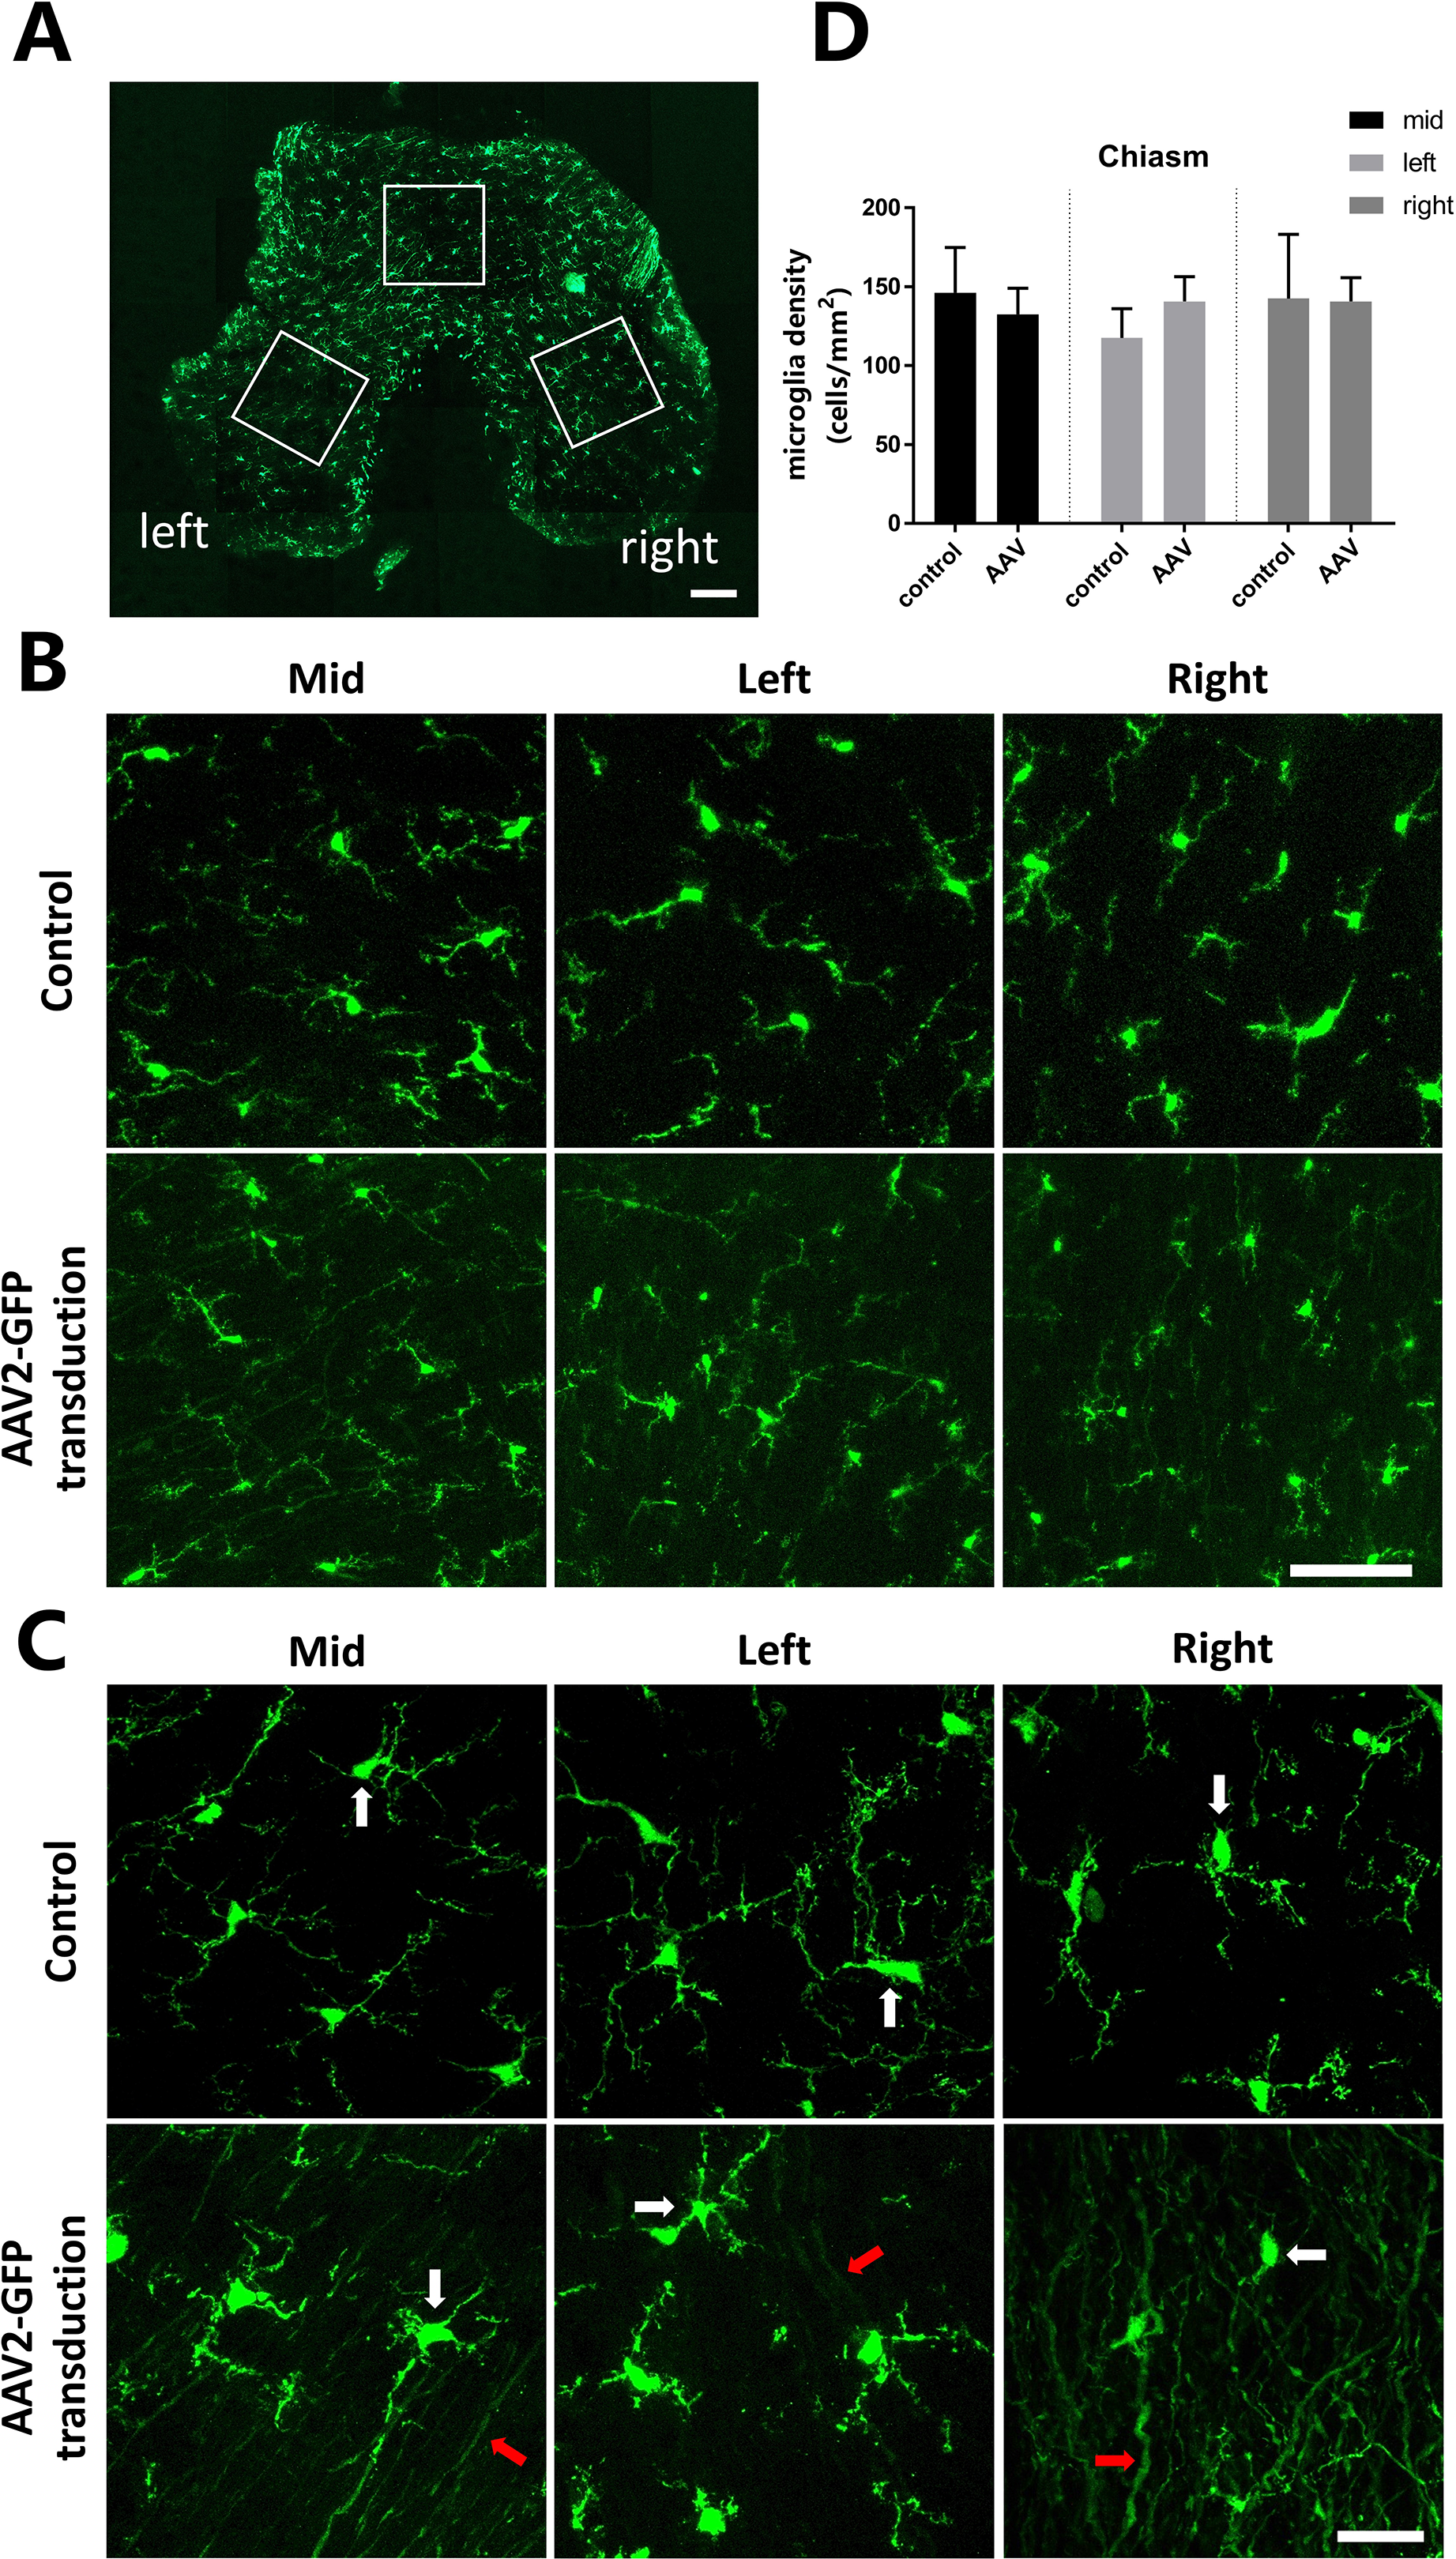
Morphology and distribution analysis of microglia in the optic chiasm after AAV2-GFP Injection. (A) Confocal micrograph of a frozen section of the entire optic chiasm after AAV2-GFP transduction from a CX3CR1+/GFP mouse. The white wireframes represent three confocal regions: the middle, left posterior leg and right posterior leg sections. Scale bars = 200 μm. (B) Morphology of microglia in the control and AAV2-GFP transfected optic chiasm was also analyzed in the optic nerve frozen sections using confocal microscopy at the middle, left and right segments. Scale bars = 50 μm. (C) High-magnification view of microglia in the control and AAV2-GFP transfected optic chiasm. Scale bars = 50 μm. (D) Quantitative analysis of microglial density in the control and AAV2-GFP injected optic chiasm, indicating that no significant differences in the number of microglia in the control and AAV2-GFP injected optic chiasm (one-way ANOVA, n=3 imaging fields analyzed per optic chiasm from each of 5 animals). White arrow, microglia; red arrow, axons.
Discussion
The optic nerve contains the axons of RGCs, carrying visual signals from the retina to the brain. There are many methods to study the optic nerve fiber by labelling RGC and axon. Transgenic mice are extensively used to study neuronal development and regeneration and often used with CTB and AAV for axon tracing. However, breeding transgenic mice is time-consuming and they may show different physiology compared to wild type mice. CTB is a reliable tracer that has been widely used to analyze the regeneration of axons following optic nerve injury. The application of CTB is limited by its efficiency as the label of so many axons makes the identification of individual nerves challenging. AAV has been generally used as gene-delivery vectors for basic experimental research and human gene therapy. AAV vectors produced by conventional transient transduction have been investigated in clinical trials for their specificity, stability and effectiveness34–36. AAV2-GFP preferentially infects RGCs and sustains transgene expression after intravitreal injection.
To explore the ability of AAV2-GFP to sparsely and effectively label RGCs and study the interaction between microglia and optic nerve fiber, we performed intravitreous injections at different concentrations into WT and CX3CR1+/GFP mice two weeks before RGCs and axons transduction. These data were used to determine the optimum concentration of AAV2-GFP for sparse labeling which was then used to compare the morphology and distribution of microglia in the retina, optic nerve and chiasm in control and AAV injected CX3CR1+/GFP mice.
Microglia are an inherent macrophage of the CNS which constitute up to 12% of the total glial cell population and have various function roles 37 . Microglia in the optic nerve may potentially play an important role in the maintenance of the optic nerve microenvironment. Under normal physiological conditions, microglia promote synapse formation 38 , synapse pruning 39 and regulate programmed cell apoptosis 40 . In pathological conditions, microglia cells are activated and display from ramified to amoeboid shapes 41 can phagocytose cell debris and exacerbate disease processes 42 . In the current study, by characterizing the distribution of microglia in the retina, optic nerve and chiasm after AAV2-GFP injection, the efficiency of AAV2-GFP were confirmed.
Our data showed that high concentrations of AAV2-GFP produced strong fundus fluorescence, whilst a concentration of 1:1000 (2.16 × 10⁸ VG/retina) resulted in sparse labeling of RGCs. The transfected RGCs were not evenly distributed in the flat-mounted retina and significantly more RGCs were transfected near the injection site of AAV2-GFP compared to other sites. These particular observations indicate that the AAV2-GFP concentration remains higher at the injection site.
Microglia is a type of inflammatory cell in the CNS. When homeostasis is lost, microglia can be immediately activated resulting in changes in morphology and distribution43–45. By observing the morphology and density of microglia in the retina, we found that AAV2-GFP injection partly increased the number of microglia, but the shape of cells seemed unchanged. After intravitreal injection of AAV2-GFP, the retina was slightly affected by this operation and might increase microglia density.
By studying microglia of optic nerve and optic chiasm, we found that microglia in the AAV2-GFP injected group seem to have similar processes compared to the control group Changing the fluorescent staining color of microglia would distinguish from axons more clearly. However, the number of microglia in the proximal and distal optic nerve segments of the AAV2-GFP injected group were higher than in the control group. Overall, intravitreally injected AAV2-GFP somewhat changed the optic nerve microenvironment and increased the number of microglia. The morphological features of microglia can be determined by their local environment and reflect their physiological functions on surrounding cells 46 . In the optic chiasm, the number of microglia cells did not increase in AAV2-GFP injected mice, and the morphology was largely unchanged. Our evaluation of AAV2-GFP effects was limited to qualitative assessment of microglia morphological changes and should be extended to quantitative assessment of microglia morphology in future studies. In addition, it would be beneficial to show any differences in inflammatory markers vis qRT-PCR and staining to compare microglia activation to characterizing any effects of the AAV transfection47, 48.
In conclusion, AAV2-GFP transduction was highly efficient and the optimal concentration of sparsely labeled RGCs was found to be 1:1000 (2.16 × 10⁸ VG/retina). After intravitreal injection of AAV2-GFP, the number of microglia in the retina and part of optic nerve significantly increased, but not in the optic chiasm.
Footnotes
Disclosures
Financial support
This study was supported by National Key R&D Program of China (2016YFC1101200); National Natural Science Foundation of China (81770926;81800842); Key R&D Program of Zhejiang Province (2018C03G2090634), Key R&D Program of Wenzhou Eye Hospital (YNZD1201902); Wenzhou Science and Technology Bureau Program (Y2020362).
Conflict of interest
None of the authors has conflict of interest with this submission.