
Abstract
Purpose
This article proposes a simple model that describes the quantitative relationship between visual acuity and defocus (as in defocus curves) in the presence of higher-order aberrations (HOA).
Methods
The basis model for describing the relationship between visual acuity and blur was taken from Blendowske as a starting point to develop an extended model applicable to defocus curves. The basis of Blendowskes’s data is extended by incorporating effects induced by HOA. Aberrometric refractive errors are transformed into a single blur quantity b, also termed dioptric distance, which serves as an input in both models. The possible influence of the axes of asymmetric aberrations and the pupil size is not included.
Results
The extended model has been used to generate reference data for a bi-aspheric multifocal correction profile for presbyopia. It provides reference data similar to what has been reported in the literature for that particular profile.
Conclusions
The model proposed in this article can be used to determine depth-of-focus effects associated with the presence of HOA. The extended model seems to provide a valid description for defocus curves. Actual uncertainties in experimental data on unaided visual acuity, especially the frequent lack of information on pupil diameter, prevent meaningful numerical comparison and the refinement of both models. However, theoretical arguments are provided in support of the extended model.
Keywords
Introduction
Visual acuity for different vergences is a frequently used indicator of the depth-of-focus of the spatial vision that is applied in clinical setting, e.g., in the form of defocus curves. 1 The impact of refractive errors on visual acuity has been of interest for a long time. 2 In recent times, also the impact of higher-order-aberrations (HOA) on visual acuity, 3 and in particular on extended focus ranges (depth-of-focus) has become very important. 4 Here, an extended model (based upon the work by Blendowske) 5 has been implemented to determine visual acuity for monocular (and to provide estimates for binocular), central vision for different vergences (levels of defocus as it occurs in defocus curves) in the presence of HOA. Because of the many factors influencing visual acuity, it is quite a challenge to provide a quantitative description of these relationships.
Among others, it mainly depends on the type and quantity of the refractive error in the eye, for example, spherical and cylindrical refractive errors and HOA, 6 whereas pupil size plays an important role in all cases. 7 The model is confined to the impact of ordinary refractive errors, sphere, and astigmatism along with higher-order aberrations (in particular spherical aberrations). The effect of the axes of cylinder or asymmetric HOA on visual acuity is neglected. Nevertheless, the simple equation to describe unaided visual acuity as a function of the refractive error presented by Blendowske, 5 can be easily extended for this task.
A similar merit function can also help in the design process for progressive addition lenses or multifocal (aspheric) contact lenses. 8
This article proposes an extension of the simple equation that describes the influence of refractive errors on uncorrected visual acuity and provides reference values derived from a bi-aspheric multifocal profile for presbyopia correction.
Methods
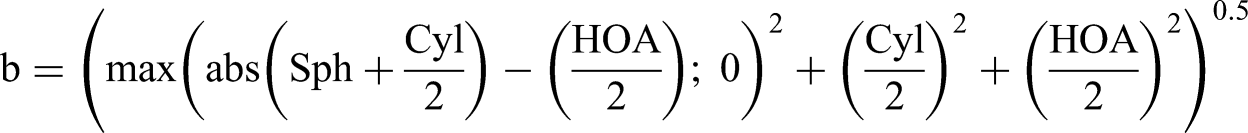
The approach proposed here uses the same blur quantity as defined by Raasch
9
and used by Blendowske,
5
extended by the contribution of HOA in the form:
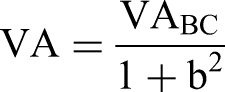
And simply, following Blendowske,
5
we calculate visual acuity as

Using this simple equation, the required blur to render the clinically measured visual acuity (CDVA; on average −0.1logMAR for normal eyes) 10 based on the potential visual acuity provided by the retina (−0.25logMAR for normal eyes) 11 would account to 0.64D, of which 0.31D would be uncorrected refractive cylinder, 12 and 0.62D HOA (typically presented as ±0.31D in the reports). 13 These values are plausible, and comparable to the values provided by the literature.
Bi-aspheric multifocal profile for presbyopia correction
The SCHWIND PresbyMAX is an increased Range-of-Focus profile for presbyopia correction, 14 which works by creating a prolate corneal shape and the controlled induction of negative spherical aberration combined with the induction of a low amount of myopia. 15 The individual (distance) refractive correction is applied over the entire optical zone progressively becoming hyperprolate towards the center. This shape is influenced by the amount of addition, i.e., the higher the addition the more powerful the centre becomes. 16
This presbyopic concept incorporates a residual myopic defocus in the near eye, 17 which can be altered to induce more or less myopia combined with lower or higher adds (less or more induction of negative spherical aberrations). 18
It is then the combination of both eyes contributing to providing visual acuity at all distances by actively participating in the visual process for creating binocular vision impressions. 19
Different versions of the profile are depicted in Figure 1 assuming underlying emmetropia (i.e., for distance vision in the distance only aspheric optimization takes place plus a hyperpositive central aspheric region; whereas for near eyes a residual myopic defocus is targeted).
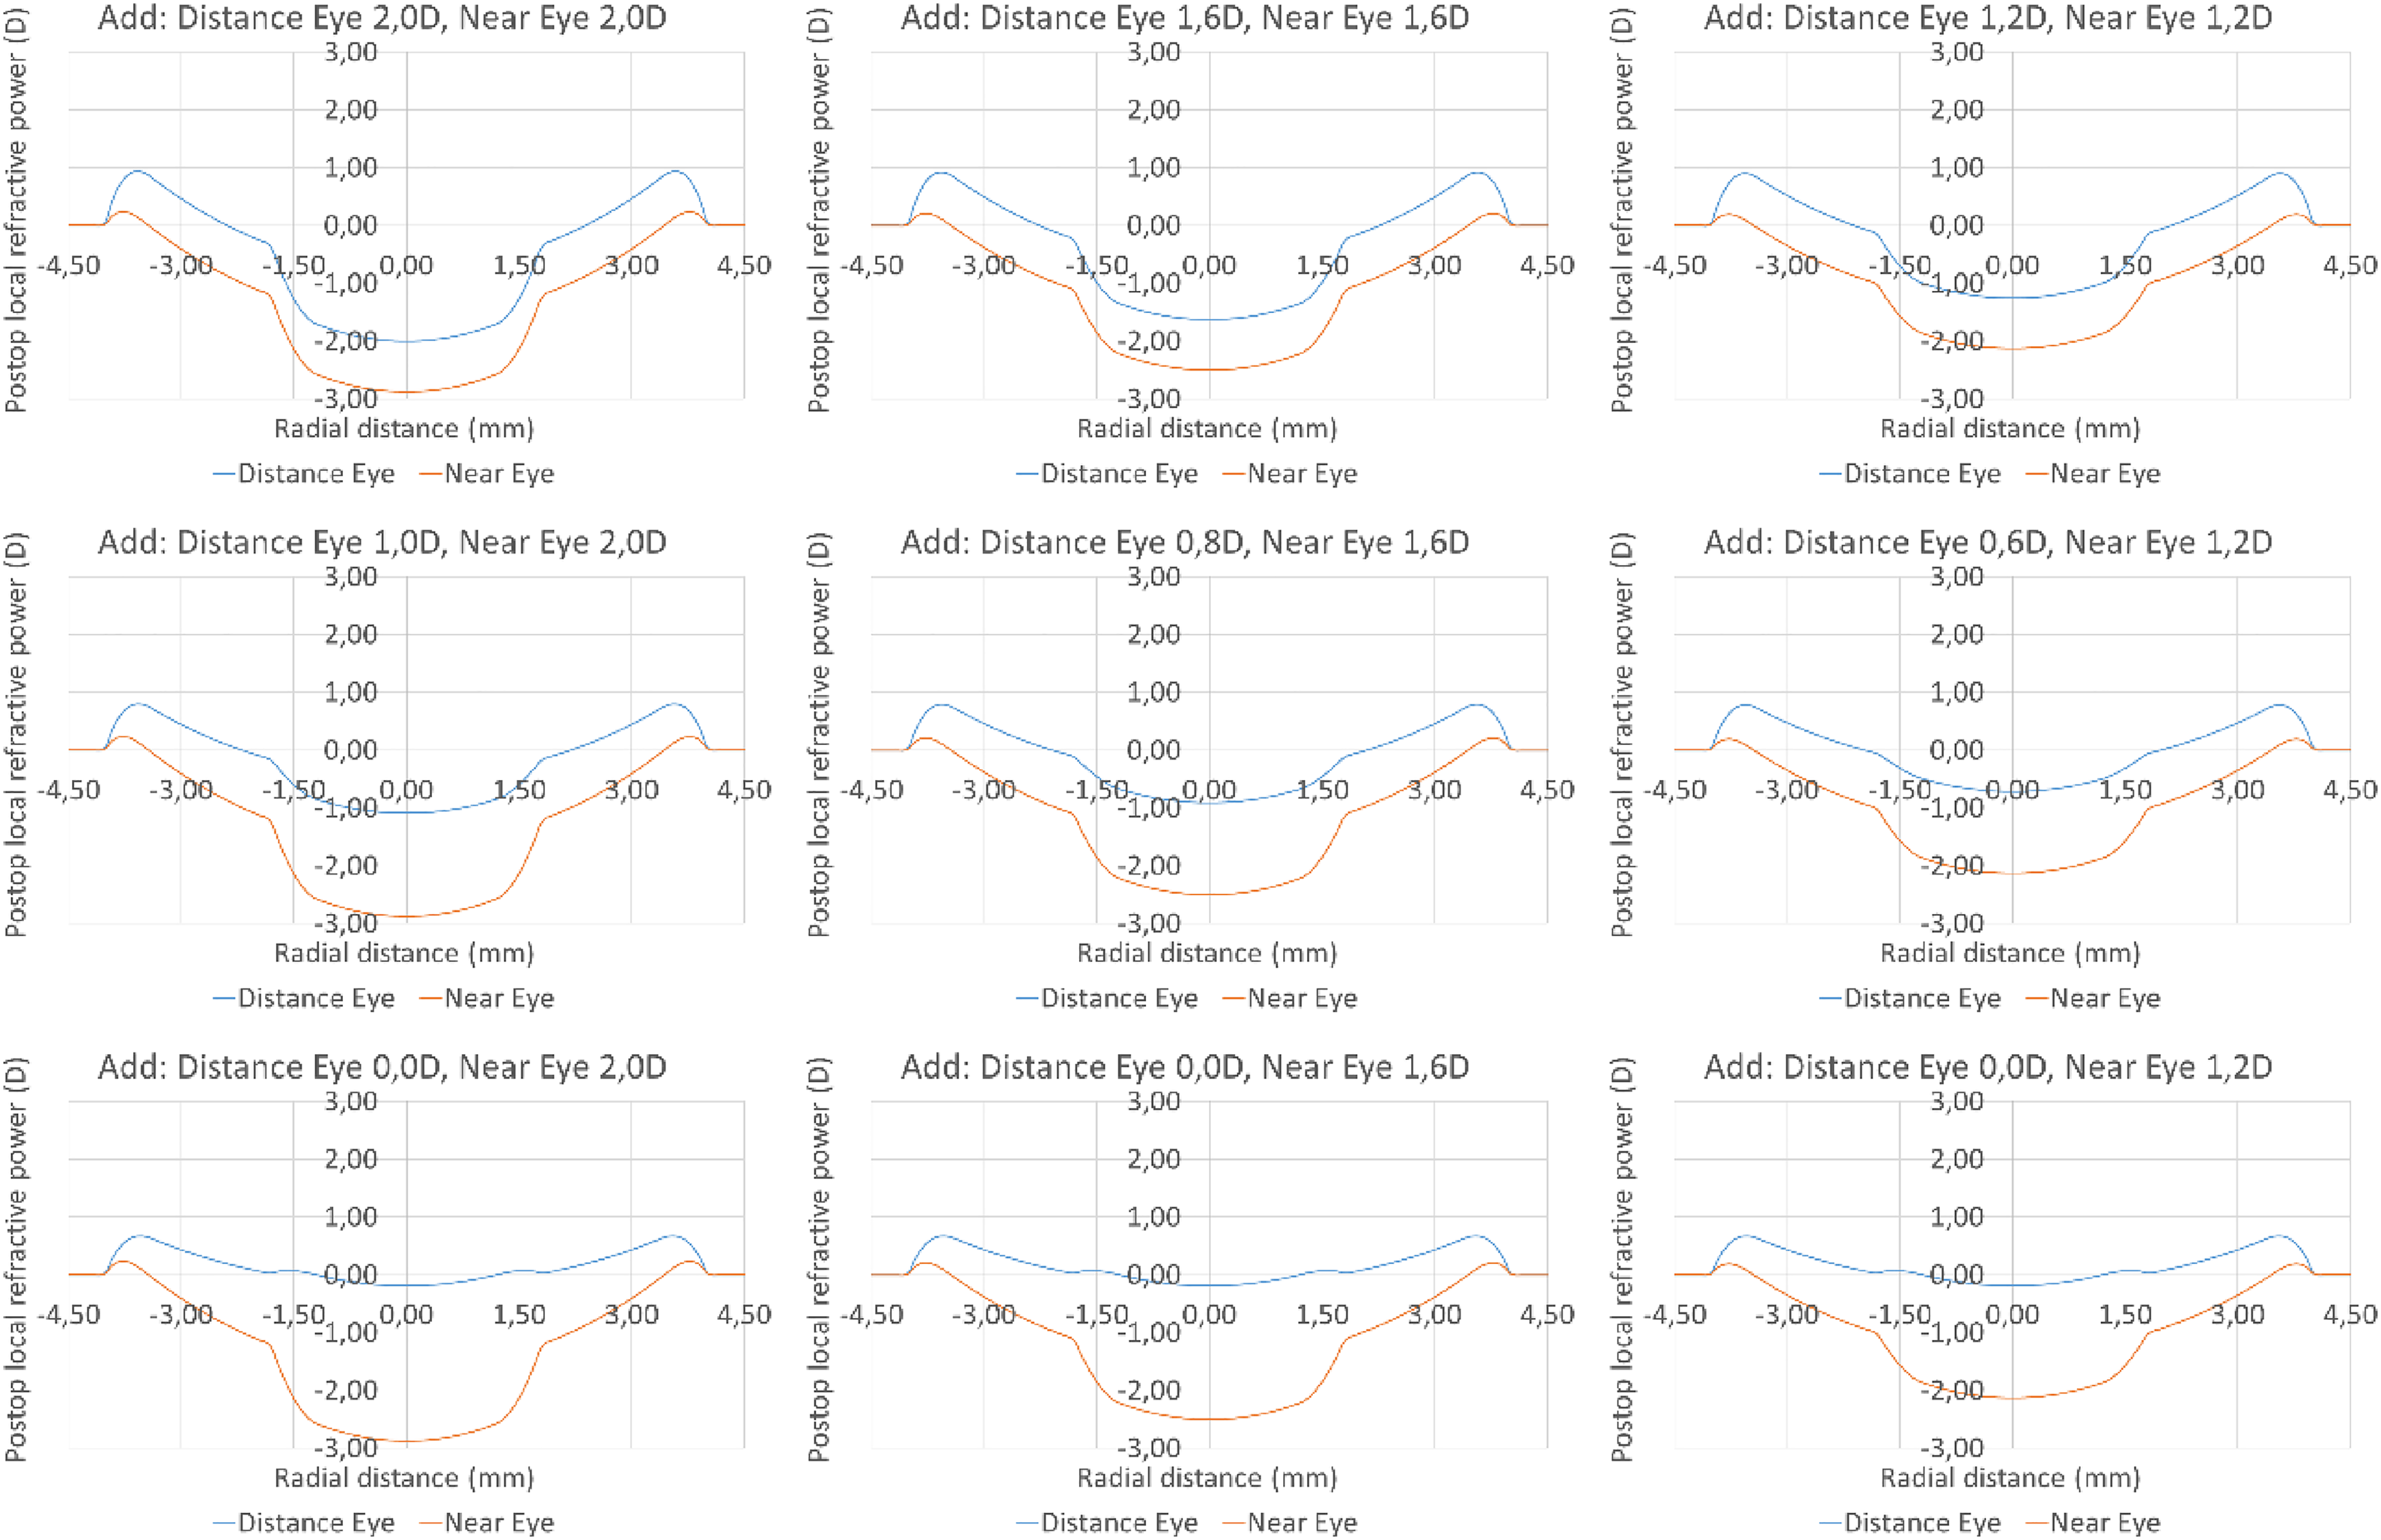
Different versions of the bi-aspheric multifocal profile for presbyopia correction, combining two focus-shifted aspheric profiles with different asphericities. A bi-aspheric multifocal corneal profile is created over the optical zone size that is used (6.8mm diameter in the figure) with an automatically adjusted central treatment zone (∼3 mm) for near vision influenced by the amount of addition, i.e., the higher the addition the more dominant the central area. A circumferential transition zone of gradually changing power connects the region of the cornea corrected for distance with the portion corrected for near. Another circumferential transition zone of gradually changing power connects the region of the cornea corrected for distance with the untreated cornea. The term “bi-aspheric” refers to the aspherical optimisation of the central corneal area for near vision and the pericentral cornea for far vision. In the figure, the presbyopic concept incorporates a residual defocus of −0.88D in the near eye. From left to right (columnwise) the addition is reduced from 2.0D to 1.6D and 1.2D for the near eye, whereas from top to bottom (rowwise) the relative addition in the near eye is reduced from 100% to 50% and 0% respect to the near eye.
In a commonly used notation in optics and ophthalmology, this bi-aspheric profile can be easily expressed as a combination of Zernike terms, 20 in particular 4th and 6th order spherical aberration 21 (adding further spherical aberration terms of 8th and 10th order would further improve the correspondence between the theoretical profile and its Zernike expansion). 22
Estimation of the visual acuity for different vergences: simulation of defocus curves
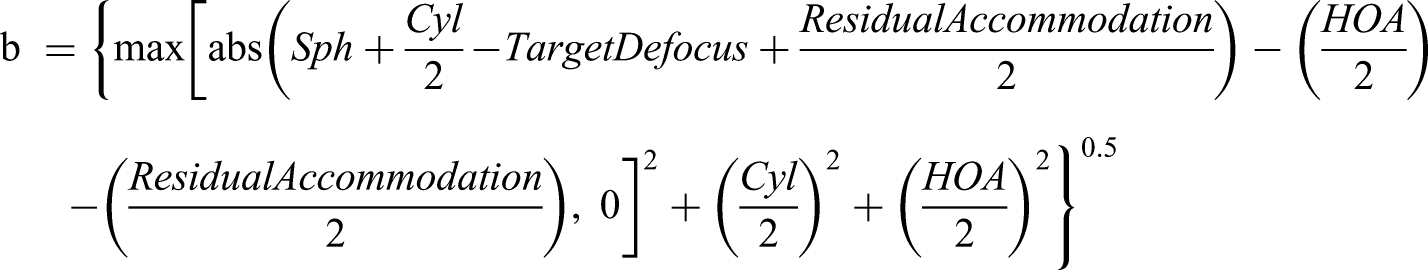
The approach proposed here extends the blur equation to:
To estimate VA, VABC was taken as 20/11 (−0.25logMAR) along with an uncorrected cylinder of 0.25D and a baseline HOA RMS of 0.25D. Further, as simple binocular estimate, the envelope (i.e., the VA of the better eye for that vergence) of the overlaid monocular defocus curves was considered.
Results
Using this methodology, the non-accomodative VA response of a normal eye is shown in Figure 2 compared to that of a diffraction limited eye and that of a normal eye with an accommodation range of 1.9D, whereas Figure 3 shows the non-accomodative monocular defocus curves of a monovision setting.
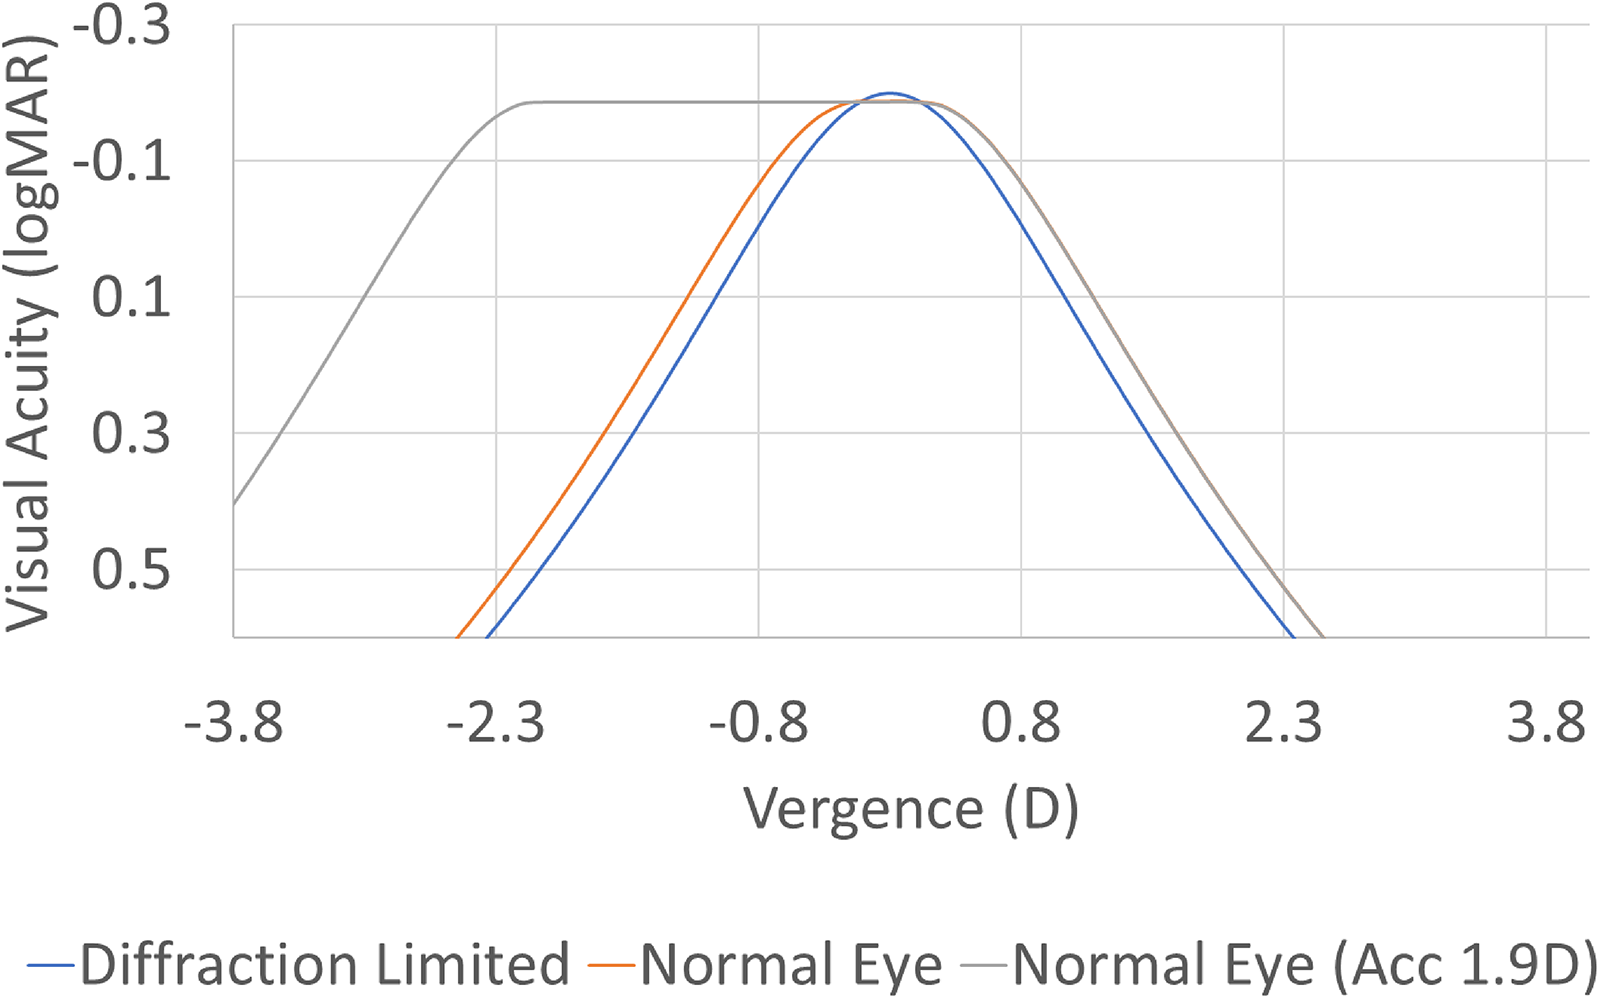
Non-accomodative VA response of a normal eye (in orange) compared to that of a diffraction limited eye (in blue), and that of a normal eye with an accommodation range of 1.9D (in grey).
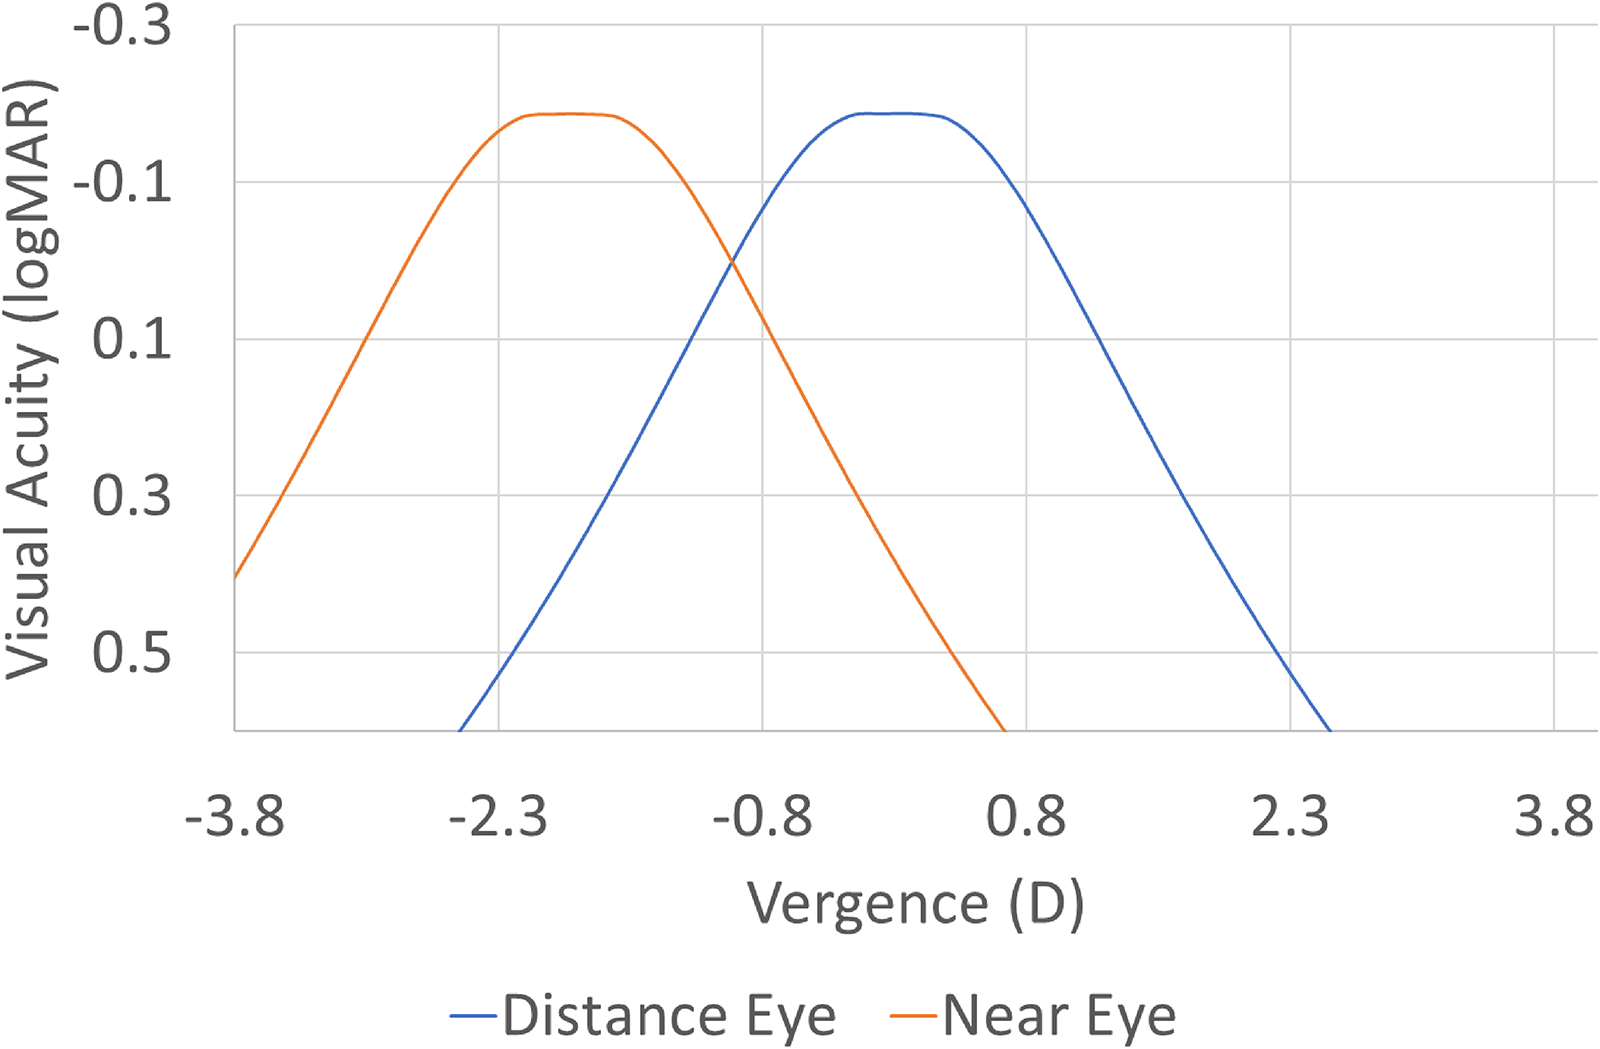
Non-accomodative monocular defocus curves of a monovision setting in normal eyes with emmetropia for distance eye (in blue) and −1.9D for near eye (in orange) representing 54cm of best focusing distance.
As seen in the PresbyMAX software, the spherical aberration additions of the 9 showed examples are described in the following table:
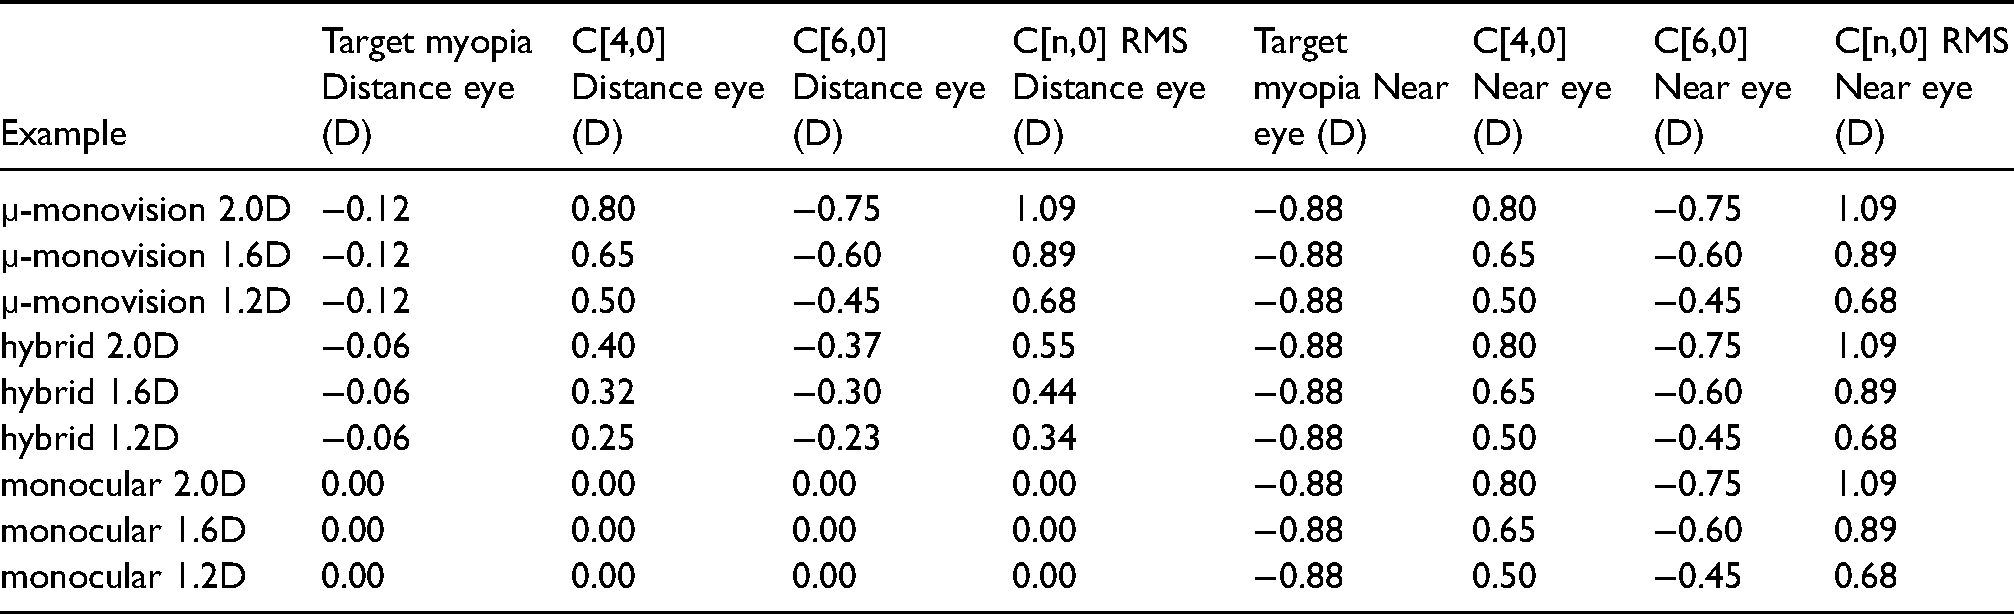
Combining these values with the baseline described in the methods, the monocular defocus curves presented in Figure 4 can be obtained.
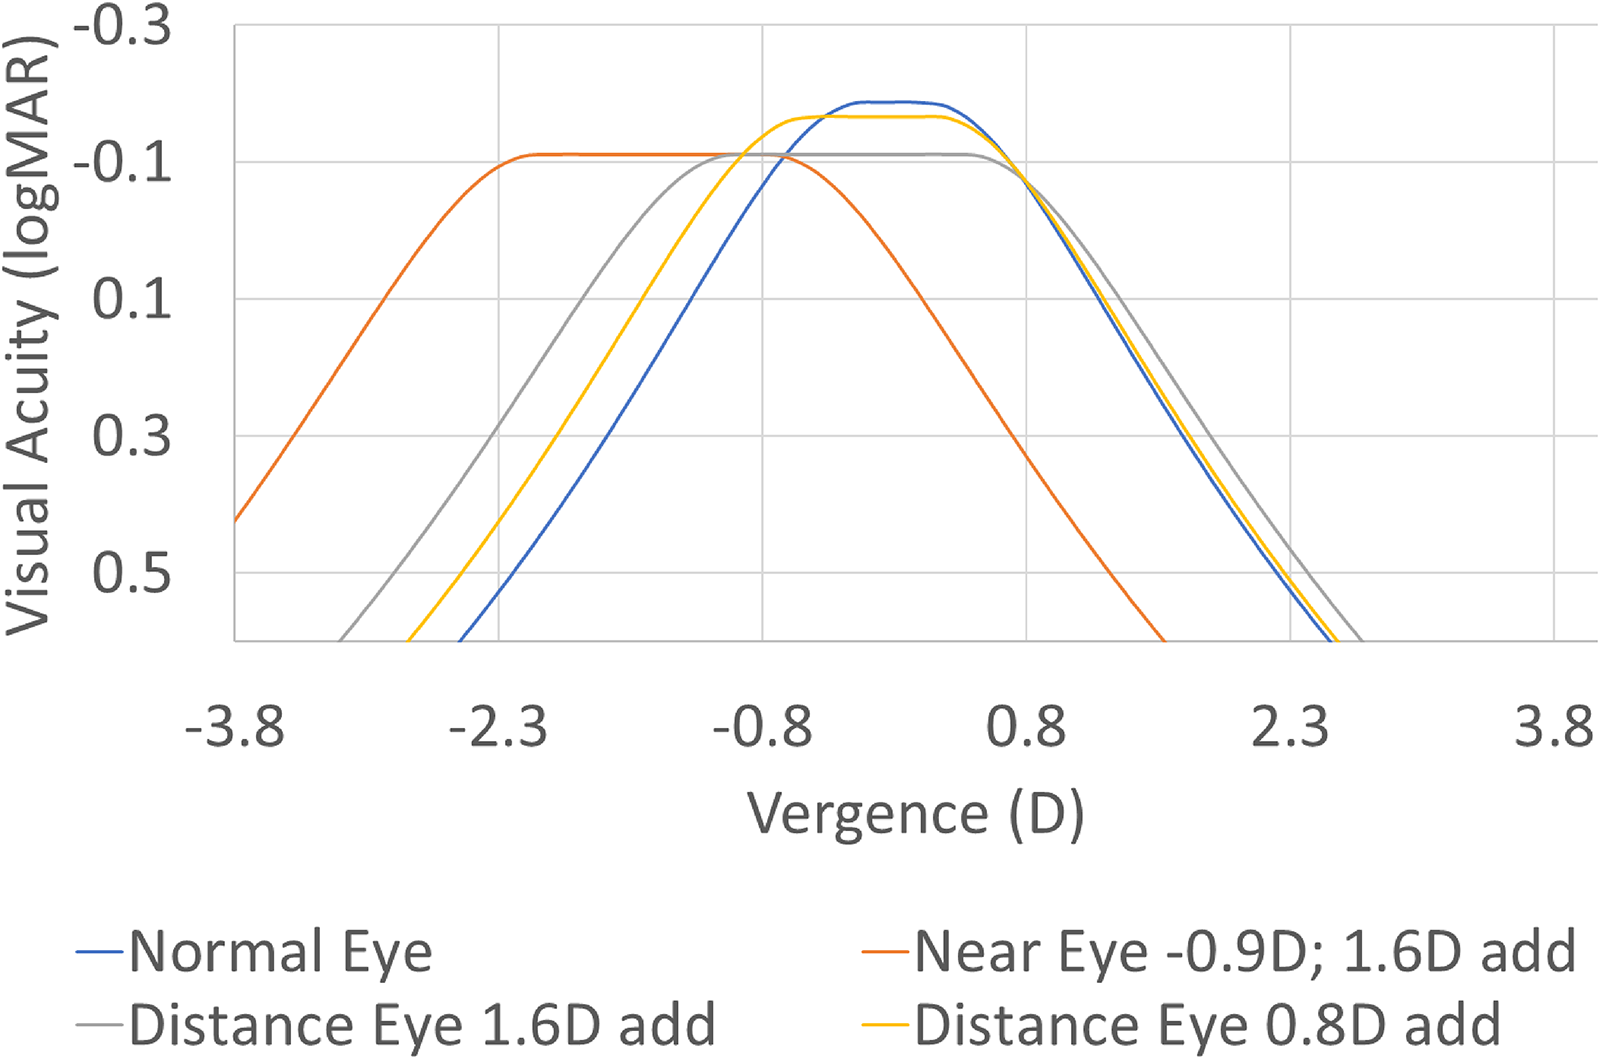
Monocular defocus curves of the examples provided in the table: non-accommodated emmetropic normal eye (in blue), a near eye set to −0.9D of target myopia with 1.6D of multifocal add (in orange), distance eye set to emmetropia with either 1.6D (in grey) or 0.8D (in yellow) of multifocal add.
The corresponding non-accomodative binocular defocus curves are presented in Figures 5 and 6, compared to that of a normal eye having 1.9D of active accommodation range; whereas Figure 7 shows the expected difference in lines between the binocular defocus curves after bi-aspheric multifocal profile vs 3 different baselines (a non-accommodative normal eye, a normal eye with residual accommodation of 1.9D, and a non-accommodative binocular defocus curves of an optimized minimonovision setting).
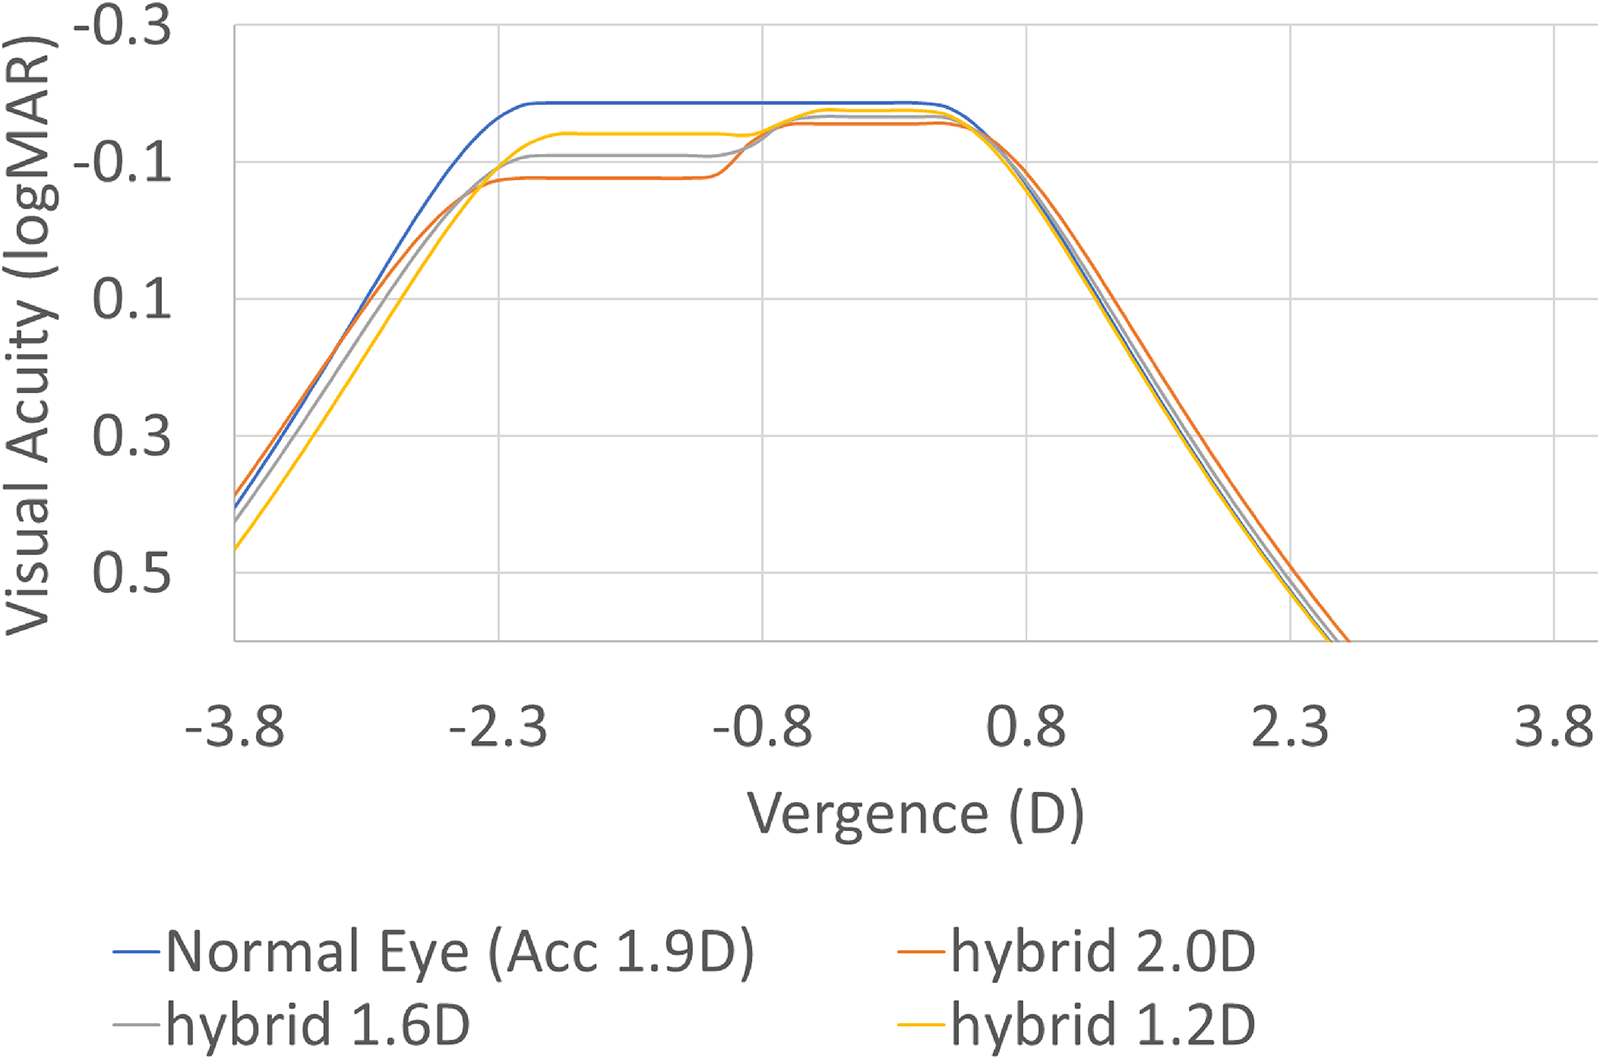
Non-accomodative binocular defocus curves for 3 different multifocal adds (taken from the table): 1.0D add in the emmetropic distance eye combined with 2.0D add in the −0.9D myopic near eye (in orange), 0.8D add in the emmetropic distance eye combined with 1.6D add in the −0.9D myopic near eye (in grey), and 0.6D add in the emmetropic distance eye combined with 1.2D add in the −0.9D myopic near eye (in yellow); compared to that of a normal eye having 1.9D of active accommodation range (in blue).
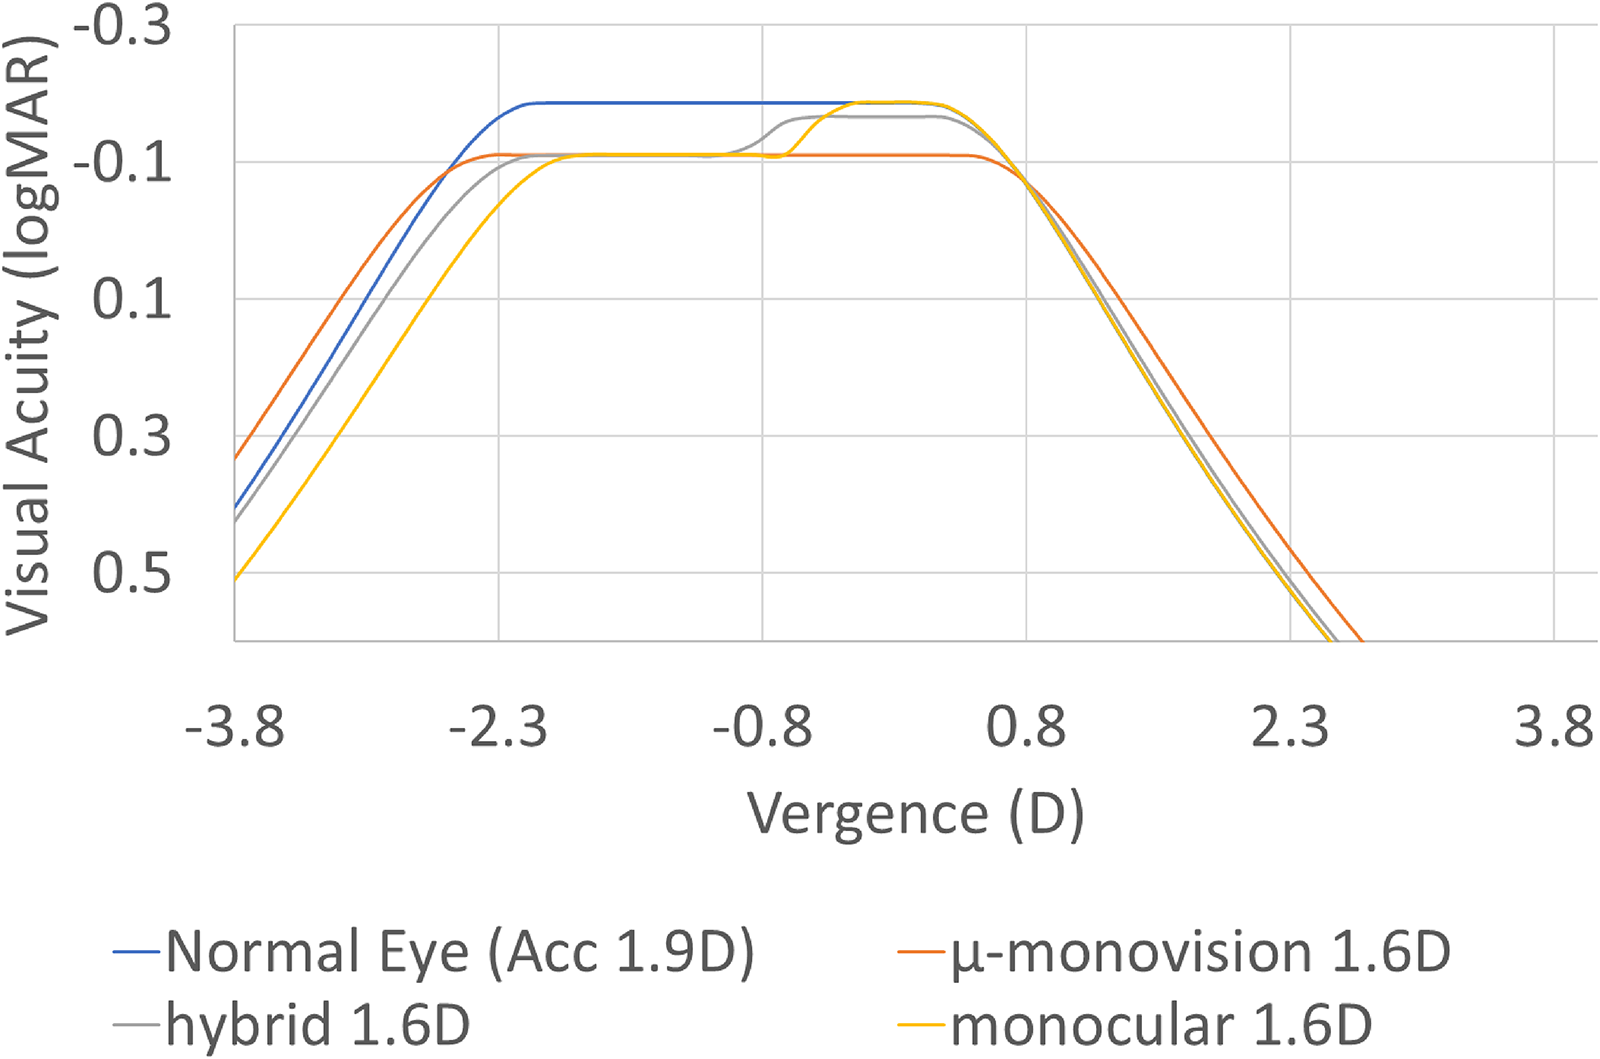
Non-accomodative binocular defocus curves for 1.6D add in the −0.9D myopic near eye combined with 3 different multifocal adds in the distance eye (taken from the table): 1.6D add in the emmetropic distance eye (in orange), 0.8D add in the emmetropic distance eye (in grey), and 0D add in the emmetropic distance eye (in yellow); compared to that of a normal eye having 1.9D of active accommodation range (in blue).
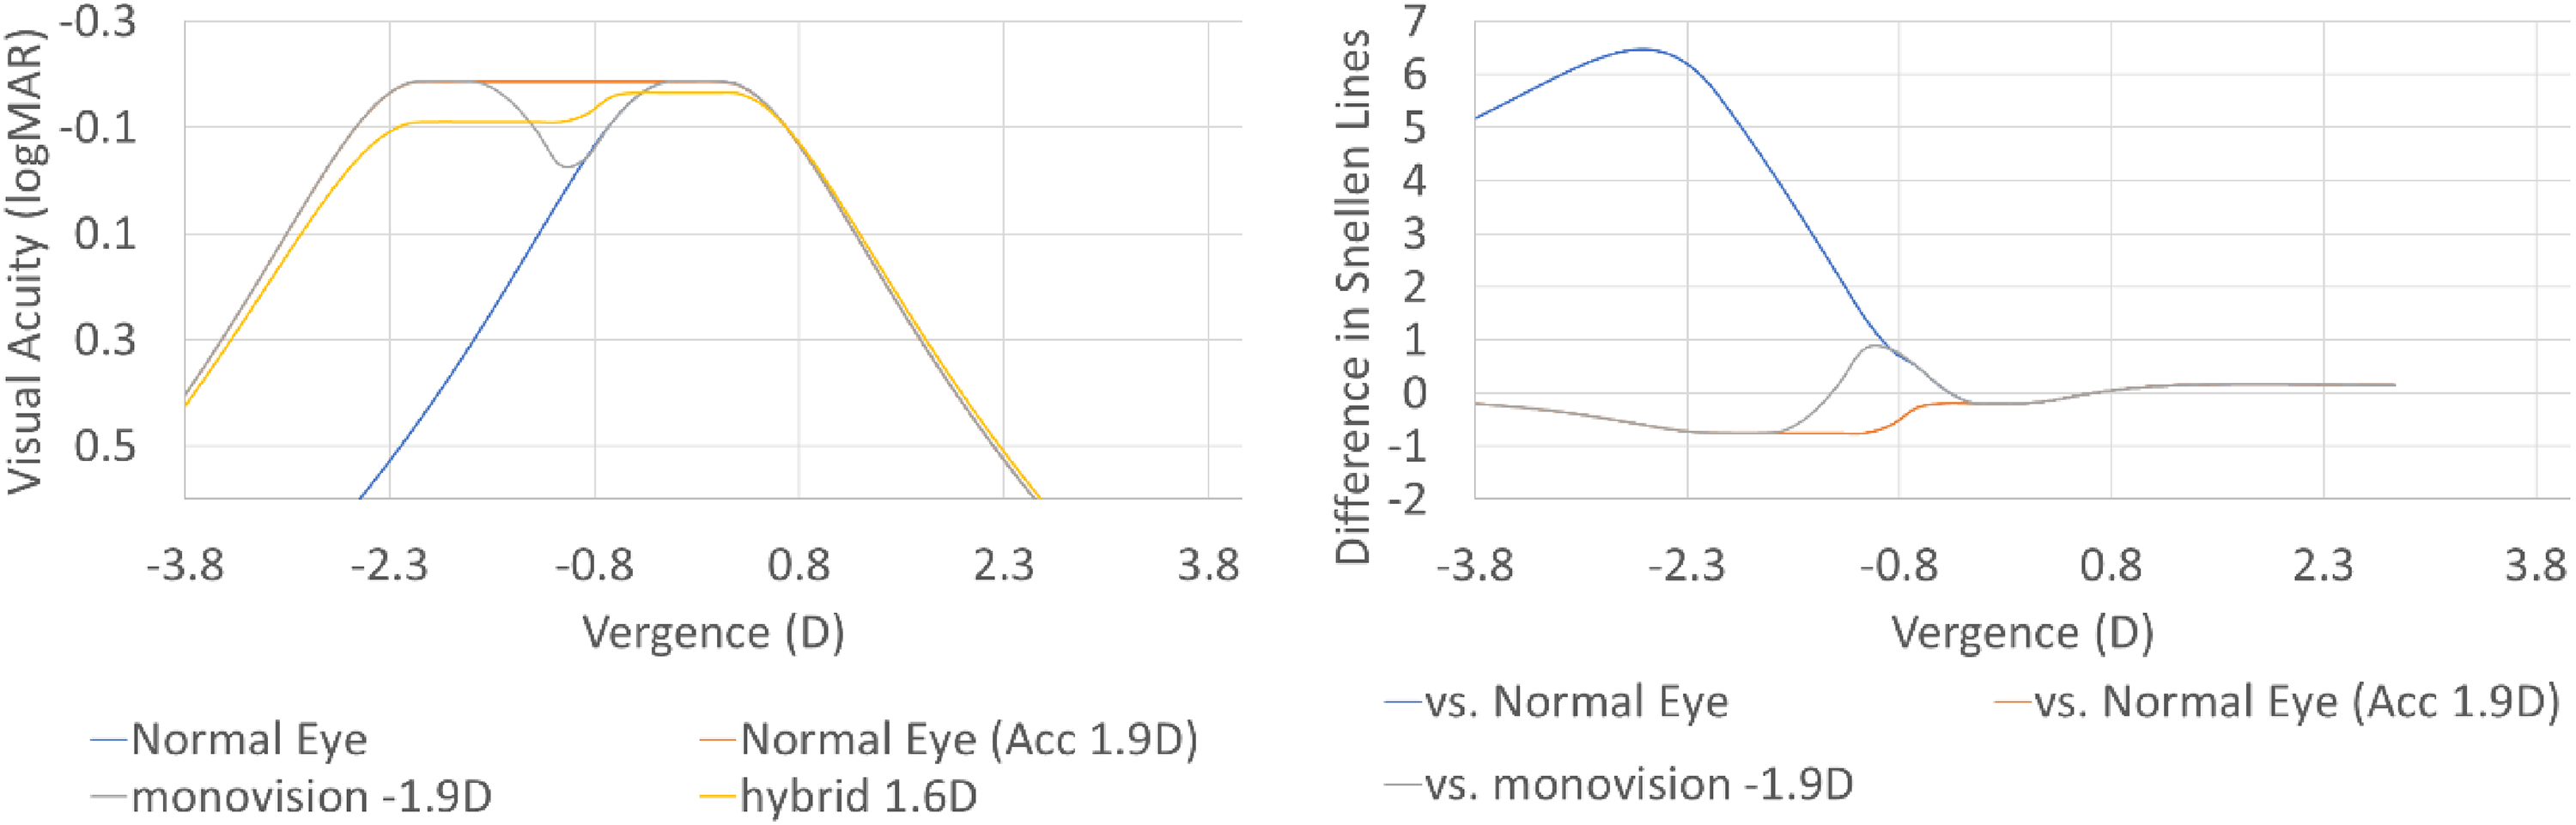
Left: non-accomodative binocular defocus curves for 0.8D add in the emmetropic distance eye combined with 1.6D add in the −0.9D myopic near eye (in yellow) compared to that of a non-accommodating normal eye (in blue), that of a normal eye having 1.9D of active accommodation range (in orange), and that of a monovision setting in normal eyes with emmetropia for distance eye and −1.9D for near eye (in grey). Right: Difference in Snellen Lines of the hybrid setting (0.8D add in the emmetropic distance eye combined with 1.6D add in the −0.9D myopic near eye) compared to that of a non-accommodating normal eye (in blue), that of a normal eye having 1.9D of active accommodation range (in orange), and that of a monovision setting in normal eyes with emmetropia for distance eye and −1.9D for near eye (in grey).
Discussion
This work presents a model of the relationship between the visual acuity and retinal image blur caused by factors including the higher order aberrations. This work provides an amendment to the method first proposed by Raasch 9 and then Blendowske 5 to estimate visual acuity from dioptric blur. This method has provided a useful approximation of predicted depth of focus of the eye in the presence of spherical and astigmatic blur. The extension to the method suggested in this paper is the incorporation of the predicted impact of HOA.
Visual acuity for different vergences is a frequently used indicator of the depth-of-focus of the spatial vision that is applied in clinical setting, e.g., in the form of defocus curves. 23 In recent times, the impact of higher-order-aberrations (HOA) on extended focus ranges (depth-of-focus) has become very important. 24 Here, an extended model (based upon the work by Blendowske) 5 has been implemented to determine visual acuity for monocular, central vision for different vergences (levels of defocus as it occurs in defocus curves) in the presence of HOA. Because the simple model assumes maximum relative visual acuity, the slope of the function decreases toward zero, until vanishing for the emmetropic eye.
The best correction should maximize visual acuity. Up until now, at least, there has been widespread agreement on this point, although maximization of a different merit quantity, like contrast at intermediate spatial frequencies, could be a goal as well.
Nevertheless, every maximum has the property that small variations in parameters (like refractive error) have no effect (at least in a linear approximation). In other words, the tangent to an extremal point is horizontal and the slope vanishes at the maximum. The relative visual acuity (or its logarithm) changes quadratically as it approaches its best value. This might appear to be quite a gradual decline. When normal HOA (∼0.25D) is considered, there is actually only a slow response to defocus. From the model, we have a drop-off of 3 lines (0.3 log units) at a refractive error of 1 D. 25
The model is confined to the impact of ordinary refractive errors, sphere, and astigmatism along with higher-order aberrations (in particular spherical aberrations), all in magnitude. The effect of the axes of cylinder or asymmetric HOA on visual acuity is neglected 26 ; similarly merely the HOA RMS has been considered, and not the detailed optical effects of the reconstructed wavefront. 27
The approach proposed here uses the same blur quantity as defined by Raasch 9 and used by Blendowske, 5 extended by a contribution of the HOA. For large values of ordinary refractive errors, the blur quantity is dominated by those and the effect of HOA is negligible. This may be a “too crude” approach (merely assuming that the blur region flattens as a plateau in the range of dioptres provided by the HOA, at the cost of diminishing the attainable VA by the blur effect of the HOA). But the estimates provided by the model seem to match very good with the values provided in the literature (in particular but not only for the bi-aspheric multifocal profile). 28
The proposed method for accounting for the effects of HOA on VA uses HOA/2 as relevant value. Cylinder is also used as ½ and there is a good logic for this since the orthogonal image planes are equidistant from the circle of least confusion. In the case of a two-zone “bifocal” corneal profile, the argument for the factor ½ is using the mean of the distance/near powers (ie ½ of the add, expressed as HOAs) to derive a blur value. In this work, it is assumed the HOA to be primary and secondary SA, although a two-zone bifocal can’t be accurately estimated with these wavefront terms.
Using this simple model, the required blur to render the clinically measured visual acuity (CDVA; on average −0.1logMAR for normal eyes) based on the potential visual acuity provided by the retina (−0.25logMAR for normal eyes) would account to 0.64D, of which 0.31D would be uncorrected refractive cylinder, and 0.62D HOA (typically presented as ±0.31D in the reports). These values are plausible, and comparable to the values provided by the literature. 29
The proper interpretation of this cylinder value is not meant as cylinder values below 0.3D shall not be corrected, 12 but rather that currently there is an inherent uncertainty of some 0.3D in the determination of the refractive astigmatism, 30 i.e., regardless of the corrective means (spectacles, contact lenses, laser vision correction) it is likely that an uncorrected (hardly measurable) refractive astigmatism of ∼0.3D is “left uncorrected”. 31
For a binocular defocus curve (extending the natural depth-of-focus of the visual system), it is the combination of at least 4 components what makes the difference: the spherical refraction of both eyes (which may be different to provide better vision in two different ranges of distances), and the multifocality of both eyes (which extends the range around the nominal vergence, and it may be different between eyes to provide sharper vision in a narrow range of distances or more functional vision in a wider range).
It is then the combination of both eyes contributing to providing visual acuity at all distances by actively participating in the visual process for creating binocular vision impressions.
The used binocular estimate, the envelope (i.e., the VA of the better eye for that vergence) of the overlaid monocular defocus curves, does not consider any binocular summation or suppression, 32 or tolerance to the induced anisometropia. 33 This together with the effects of the pupil size (and its dynamics) are aspects which may provide a better refinement of the otherwise simple model (and as such as acknowledged as limitations of the presented work). 34
Although the best-corrected visual acuity is remarkably stable over the range of natural daylight pupil diameters, the unaided visual acuity depends heavily on pupil size in the case of blurred images. When a pinhole is placed in front of an ametropic eye, visual acuity can be increased drastically even for considerable refractive errors if the cause of ametropia lies in the optical pathway. With arguments from geometrical optics, this fact can be explained by the reduction of the blur circle area, which is proportional to the area of the pupil (drastically reduced by a small pinhole). 35 However, the maximal visual acuity achieved with a pinhole is bounded by diffraction effects and clearly falls short of the visual acuity rendered by the best correction with natural pupil diameters. 36
The data of Kamiya et al. 37 describe the effect of artificial pupil sizes from 1 to 5 mm on the unaided visual acuity while astigmatism of 1, 2, and 3DC is induced. When the eye suffers from an astigmatic refractive error, the wavefront reaching the retina renders a blur ellipse instead of a blur circle. The area of this blur ellipse might be a proxy for the blurring effect, which reduces visual acuity. Clearly, the area of a cross section in the Sturm conoid degenerates to zero when the cross section contains the tangential or sagittal focus. This means that the area of the ellipse is useful only far from the regions of focus. Thus, asymptotically, the unaided visual acuity is inversely proportional to the area of the blur ellipse. The argument that the increase in the area, rather than the linear dimension, is responsible for decreasing visual acuity is quite unusual. This approach might be supported by the fact that the number of photons decreases in proportion to the area over which they are spread, leading to a lower signal-to-noise ratio.
Using this methodology, the non-accomodative VA response of a normal eye is shown in Figure 2 compared to that of a diffraction limited eye and that of a normal eye with an accommodation range of 1.9D, whereas Figure 3 shows the non-accomodative monocular defocus curves of a monovision setting. Both figures properly retrieve the findings otherwise reported in the literature. 38
While this, together with Figure 8, does not represent a formal validation of the model, it provides at least “a sense” of the reasonable estimates derived from the model (despite its simplcity and acknowledged limitations).
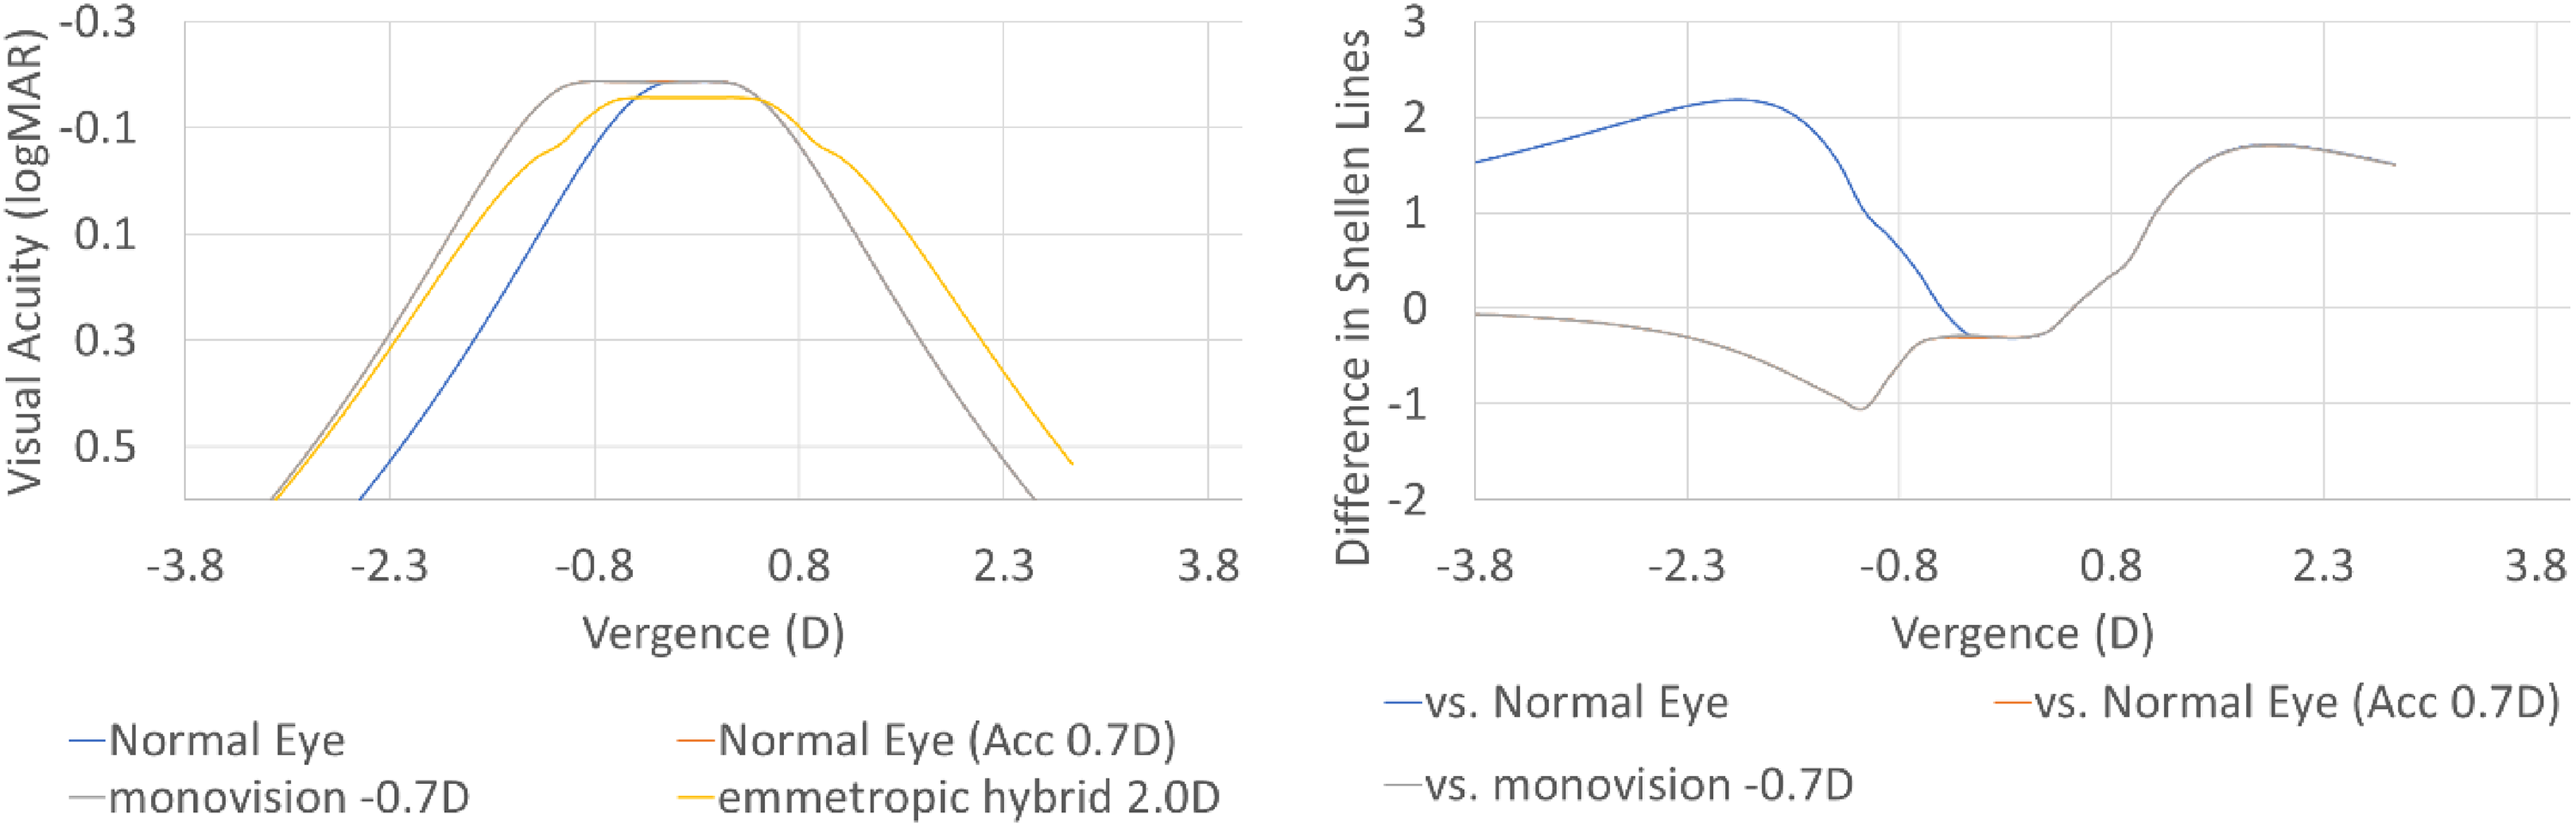
Left: non-accomodative binocular defocus curves for 0.8D add in the emmetropic distance eye combined with 1.6D add in the emmetropic near eye (as reported in the work by Luger et al.) (in yellow) compared to that of a non-accommodating normal eye (in blue), that of a normal eye having 0.7D of active accommodation range (in orange), and that of a monovision setting in normal eyes with emmetropia for distance eye and −0.7D for near eye (in grey). Right: Difference in Snellen Lines of the hybrid setting (0.8D add in the emmetropic distance eye combined with 1.6D add in the emmetropic near eye) compared to that of a non-accommodating normal eye (in blue), that of a normal eye having 0.7D of active accommodation range (in orange), and that of a monovision setting in normal eyes with emmetropia for distance eye and −0.7D for near eye (in grey).
Figure 4 shows that the model clearly determines a shift of the VA for different vergences (orange vs. grey series) and a widening of the VA plateau (along with a reduction of the attainable VA) for higher adds (grey vs. yellow vs. blue series).
Figure 5 shows that the effect of 0.8D add in the emmetropic distance eye combined with 1.6D add in the −0.9D myopic near eye (grey series) matches rather well to that of a normal eye having 1.9D of active accommodation range (blue series). Potentially indicating that a lower anisometropia combined with certain level of multifocality may be better tolerated than a classical monovision approach. 19 This is confirmed in Figure 7, in which, also the expected benefit of the multifocal approach for the intermediate region (from 83cm to 2.5m) is noticeable. 39
Figure 6 shows that by adjusting the target sphere and add of the distance eye, the distance vision (which may be more relevant for the subject) can be prioritized (i.e., the potential loss of VA for distance vision can be modulated/minimized). 40
In general, it seems that the induced add actually extends the depth-of-focus by half its value (when compared to an active accommodative range), the target sphere of the distance eye can be set as negative as to maintain maximum VA for distance vision, and the anisometropia (thus the target sphere of the near eye) as high as the intermediate vision dent does not become noticeable.
This work is basically a model of the depth of the focus in the cases with higher order spherical aberrations presented, and then the effect of spherical aberrations on image blur is linked to visual acuity. Only higher order spherical aberrations were included in the model, but not other (non-rotationally symmetric) higher order aberration terms. It's a limitation of this model to be an extension applying for cases with general HOAs.
This simple model with a minimal number of parameters offers a sufficient “primal sketch” for the relationship between unaided visual acuity and refractive error, in the presence of HOA or residual accommodation. The simple model presented here can be refined by introducing parameters like pupil size, axis orientation of a cylinder, or different dependencies for different HOA terms. 41
Footnotes
Acknowledgements
The article has not been presented at any meeting. The author did not receive any financial support from any public or private sources. The article represents the personal view of the Author, and was not written as a work for hire within the terms of the Author’s employment. The work described in the article itself (as opposed to the work done writing the article) was conducted as part of the Author’s work. Content attributed to the Author was vetted by a standard approval process for third-party publications.
Declaration of conflicting interests
The author(s) declared the following potential conflicts of interest with respect to the research, authorship, and/or publication of this article: The author is employee for SCHWIND eye-tech-solutions, manufacturer of the PresbyMAX Software and the AMARIS excimer laser platform.
Funding
The author(s) received no other financial support for the research, authorship, and/or publication of this article.