
Abstract
Purpose
To assess the influence of inflammatory plasma biomarkers on choroidal thickness (CT) in patients with type 2 diabetes (T2D).
Methods
Cross-sectional study enrolling T2D patients and age-matched healthy controls (>55 years of age, Caucasian, axial length <26 mm, no macular edema, and naïve). Patients were examined with swept-source OCT Triton, obtaining automatic measurements. CT was analyzed using the ETDRS grid and the recently proposed choroidal division. A blood analysis was commanded: general biochemical profile, liver status, T2D status, thyroid and parathyroid activity, coagulation, general immunological profile, and inflammatory biomarkers.
Results
124 eyes of 124 patients with a mean age between 66 and 68 years were examined. The new choroidal division showed differences between groups (p < 0.05) in more sectors than the ETDRS grid, and more biomarkers influenced these new sectors. T2D patients had higher levels of IL-8, TNF-α, MCP1, adiponectin and L-selectin. CT was influenced by TNF-α, IL-17, leukocytes and erythrocyte sedimentation rate, as well as by HDL cholesterol, albumin, liver function biomarkers, and TSH. HbA1c showed little influence on CT.
Conclusions
T2D patients present increased plasma inflammatory biomarkers, exhibiting an influence on CT. IL-17 is related to a thicker choroid but TNF-α is related to a thinner choroid. HbA1c has little influence on CT. The recently proposed choroidal division is more sensitive to CT changes than the ETDRS grid. Some sectors are more sensitive to plasma biomarkers.
Keywords
Introduction
Type 2 diabetes mellitus (T2D) is characterized by peripheral insulin resistance and is caused by genetic and environmental factors such as aging, sedentary lifestyle, and obesity. As a result, enzymatic glycosylation, polyol pathways, and nonenzymatic glycosylation occur. 1 In addition, expansion of adipose tissue is associated with the accumulation of activated macrophages expressing a number of proinflammatory genes. 2 Thus, T2D is a disease with multisystemic affection and various pro-inflammatory and angiogenic mediators related to its pathogenesis. 3 This low-grade systemic inflammation implies an increase in plasma concentrations of cytokines. 4
Diabetic retinopathy (DR) is a microvascular affection of T2D and the role of inflammation and angiogenesis has been verified in its pathogenesis. Mediators have been detected in serum, aqueous humor, vitreous, retina, and tears. 5 This chronic inflammation is responsible for not only the progression of the different stages of DR, but also for major complications such as diabetic macular edema (DME) and neovascularization. 6 These mediators include: C-reactive protein (CRP), tumor necrosis factor (TNF)-α, interleukin (IL)-1β, IL-6, IL-8, vascular endothelial growth factor (VEGF), intracellular adhesion molecule-1 (ICAM-1), vascular cell adhesion molecule-1 (VCAM-1), insulin-like growth factor-1 (IGF-1), monocyte chemotactic protein-1 (MCP-1), and chemokine ligand-5 (CCL5).
Swept-source optical coherence tomography (SS-OCT) allows better definition of choroidal boundaries and a deep analysis of choroidal thickness (CT). It can be measured manually in linear OCT slabs or automatically in the ETDRS grid. There was also a recent attempt to create a choroidal pattern using automatic measurements. 7 Previous studies have reported decreased CT accross the entire macula in patients with DR.7–9 A recent meta-analysis suggested that CT is already reduced prior to development of DR, and that decreased CT could be a risk factor in its development. 10 Nevertheless, its pathophysiological role in DME is not yet clear, and both thickening and thinning may be observed.11–13 The choroid also varies with other pathologies and conditions, such as age, 14 glaucoma, 15 high myopia, 16 age-related macular degeneration 17 and pathologies classified within the pachychoroid spectrum. 18
Variations in CT associated with inflammatory and angiogenic mediators in T2D patients have not yet been studied extensively. They would be expected to have an influence on CT because the choroid is mainly composed of blood vessels, and vascular dysfunction has been verified in T2D. Thus, the aim of this study is to assess the possible influence of plasma inflammatory and angiogenic biomarkers on CT in patients with T2D without DME.
Methods
A cross-sectional study approved by the Ethics Committee (PI15/0102) was performed at the Miguel Servet University Hospital, Zaragoza (Spain) between December 2015 and July 2016. Patients were informed about the study and written informed consent was obtained from all of them.
Two study groups were enrolled. The first group comprised diabetic patients fulfilling the ADA (American Diabetes Association) diagnostic criteria for T2D. 19 The second group comprised age-matched healthy control subjects. The inclusion criteria for both groups were: age ≥ 55 years, Caucasian, and axial length (AL) < 26 mm. Systemic exclusion criteria were the presence of autoantibodies, other types of diabetes, pregnancy or puerperium, history of cancer, any other endocrine disease, other syndromes with multisystemic affection, and systemic treatment with corticosteroids, immunosuppressive drugs, or biopharmaceuticals. Ocular exclusion criteria were: DME, glaucoma and ocular hypertension, history of anterior, intermediate or posterior uveitis, retinal inflammation and dystrophies, any other ophthalmological pathology, cataract surgery in the last three months, hazy media that could interfere with image quality, and history of previous laser photocoagulation, intravitreal injection, or any other ophthalmological treatment.
Patients underwent through a deep ophthalmological examination comprising slit-lamp examination, measurement of intraocular pressure (IOP) using Goldmann tonometry, and funduscopy. All these examinations were performed between 16:00 and 19:00 h by the same experienced ophthalmologist (FBP). AL was measured using IOLmaster 500 (Carl Zeiss, Jena, Germany). CT values were obtained using Deep Range Imaging (DRI) SS-OCT Triton (software version 1.1.4, Topcon Corp., Tokyo, Japan) through dilated pupils and under scotopic lighting conditions. Color fundus pictures were also acquired with this OCT to determine the severity of DR. Fovea-centered 6 × 6 mm macular cube analysis was performed and choroidal boundaries were automatically delimited by the internal algorithm. The retina was thus measured between the internal limiting membrane (ILM) and the outer segments/retinal pigment epithelium (OS/RPE), the retinal nerve fiber layer (RNFL) was measured between the ILM and the RNFL–ganglion cell layer (GCL), and the GCL was measured between the RNFL/GCL and the internal plexiform layer/internal nuclear layer (IPL/INL), RNFL + GCL thickness was also measured, and the choroid was delimited between the Bruch membrane (BM) and the choroid–scleral interface (CSI). Three OCT examinations were performed but only one was selected for analysis.
CT measurements were given in both the ETDRS grid and in a grid of 30 × 30 macular cubes of 200 × 200 μm each. Based on this 30 × 30-cube grid, CT values were transformed into the 10 CT zones of the choroidal division introduced by Bartol-Puyal et al. 7
Blood samples were analyzed to determine plasma biomarkers for general biochemical profile, liver status, T2D status, thyroid and parathyroid activity, general immunological profile, coagulation, and inflammatory and angiogenic biomarkers. The first six test measures: glucose, glycated hemoglobin (HbA1c), urea, creatinine, glomerular filtration rate (GFR), Chronic Kidney Disease Epidemiology Collaboration (CKD-EPI), uric acid, sodium, potassium, chlorine, cholesterol (CL), high-density lipoprotein-cholesterol (HDL-c), low density lipoprotein-cholesterol (LDL-c), triglycerides (TG), apolipoprotein A1 (ApoA1), apolipoprotein B (ApoB), lipoprotein(a) (Lp(a)), homocysteine, pro-brain natriuretic peptide (ProBNP), albumin, aspartate transaminase (AST), alanine transaminase (ALT), alkaline phosphatase (ALP), gamma-glutamyltransferase (GGT), lactate dehydrogenase (LDH), C-peptide, insulin, homeostatic model assessment of insulin resistance (HOMA-IR), homeostatic model assessment of beta-cell function (HOMA-β), thyroid-stimulating hormone (TSH), free thyroxine 4 (free T4), sex hormone-binding globulin (SHBG), prostaglandin E2 (PgE2), somatostatin, leptin, iron, ferritin, calcifediol, calcium, phosphorus, parathyroid hormone (PTH), insulin-like growth factor 1 (IGF1), erythrocyte sedimentation rate (ESR), leukocytes, lymphocytes, neutrophils, hemoglobin, hematocrit, prothrombin time (PT), prothrombin activity, fibrinogen, and microalbumin/creatinine ratio. The latter tests measure: CRP, IL-1β, IL-6, IL-8, IL-17, TNF-α, VCAM-1, ICAM-1, epidermal growth factor (EGF), monocyte chemoattractant protein 1 (MCP1), stromal-cell derived factor 1 (SDF1), VEGF-A, CCL5, adiponectin, and L-selectin. All blood analyses were performed the day following the ophthalmological examination after an eight-hour fast.
Four study groups were established: 33 healthy individuals (group 1), 34 T2D patients without DR (group 2), 26 T2D patients with mild DR (group 3), and 31 T2D patients with severer DR (group 4). This last group comprised patients with moderate, severe and proliferative diabetic retinopathy (PDR).
Statistical analysis was performed using the Statistical Package for the Social Sciences (SPSS) software for Windows (software version 20, IBM Corporation, Somers, NY, USA). Mean and standard deviations were calculated for all studied parameters. Comparisons were performed using the Kruskal-Wallis test, and the Mann-Whitney U test was used for post hoc analysis in the case of statistically significant differences. Multiple regression analyses (successive steps) were also performed including all plasma biomarkers and the stage of DR. In the case of a non-statistically significant constant, regression analysis was repeated while excluding the constant. Only T2D patients were included in regression analysis. Statistical significance was considered as p < 0.05 for all analyses.
Pictures were created using Photoshop CS6 (version 13.0, Adobe Inc., San Jose, CA, USA).
Results
124 eyes of 124 patients (mean age between 66 and 68 years) were included in the study. Demographic data are displayed in Table 1. There were no differences between groups in age, IOP or AL. There were only differences in VA between groups 1 (healthy individuals) and 4 (T2D patients with moderate or severer DR).
Demographic data.
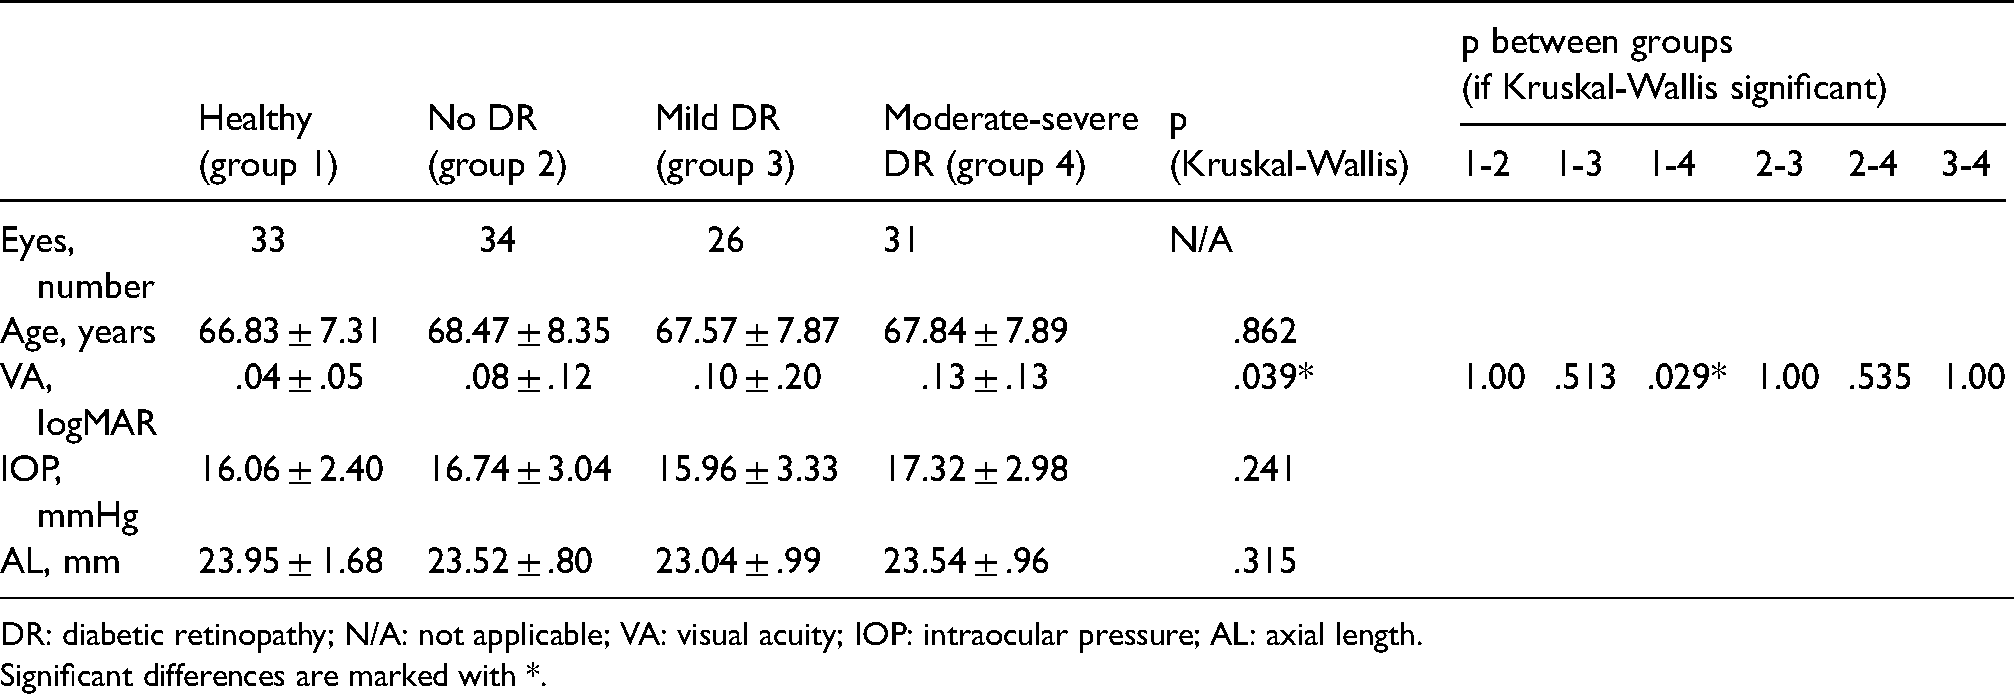
DR: diabetic retinopathy; N/A: not applicable; VA: visual acuity; IOP: intraocular pressure; AL: axial length.
Significant differences are marked with *.
Retinal and choroidal thicknesses of each layer are displayed in Table 2. Mean image quality was greater than 47 and there were no differences between groups. When using the ETDRS grid to compare retinal thickness, we only found differences between group 2 (T2D patients without DR) and group 4 in the outer superior sector of the RNFL. Meanwhile, we found differences between group 1 (healthy individuals) and group 4 in nearly all the sectors, with group 4 presenting thinner measurements. The only ETDRS sector not to exhibit differences was the outer nasal.
Retinal and choroidal thicknesses by layer.
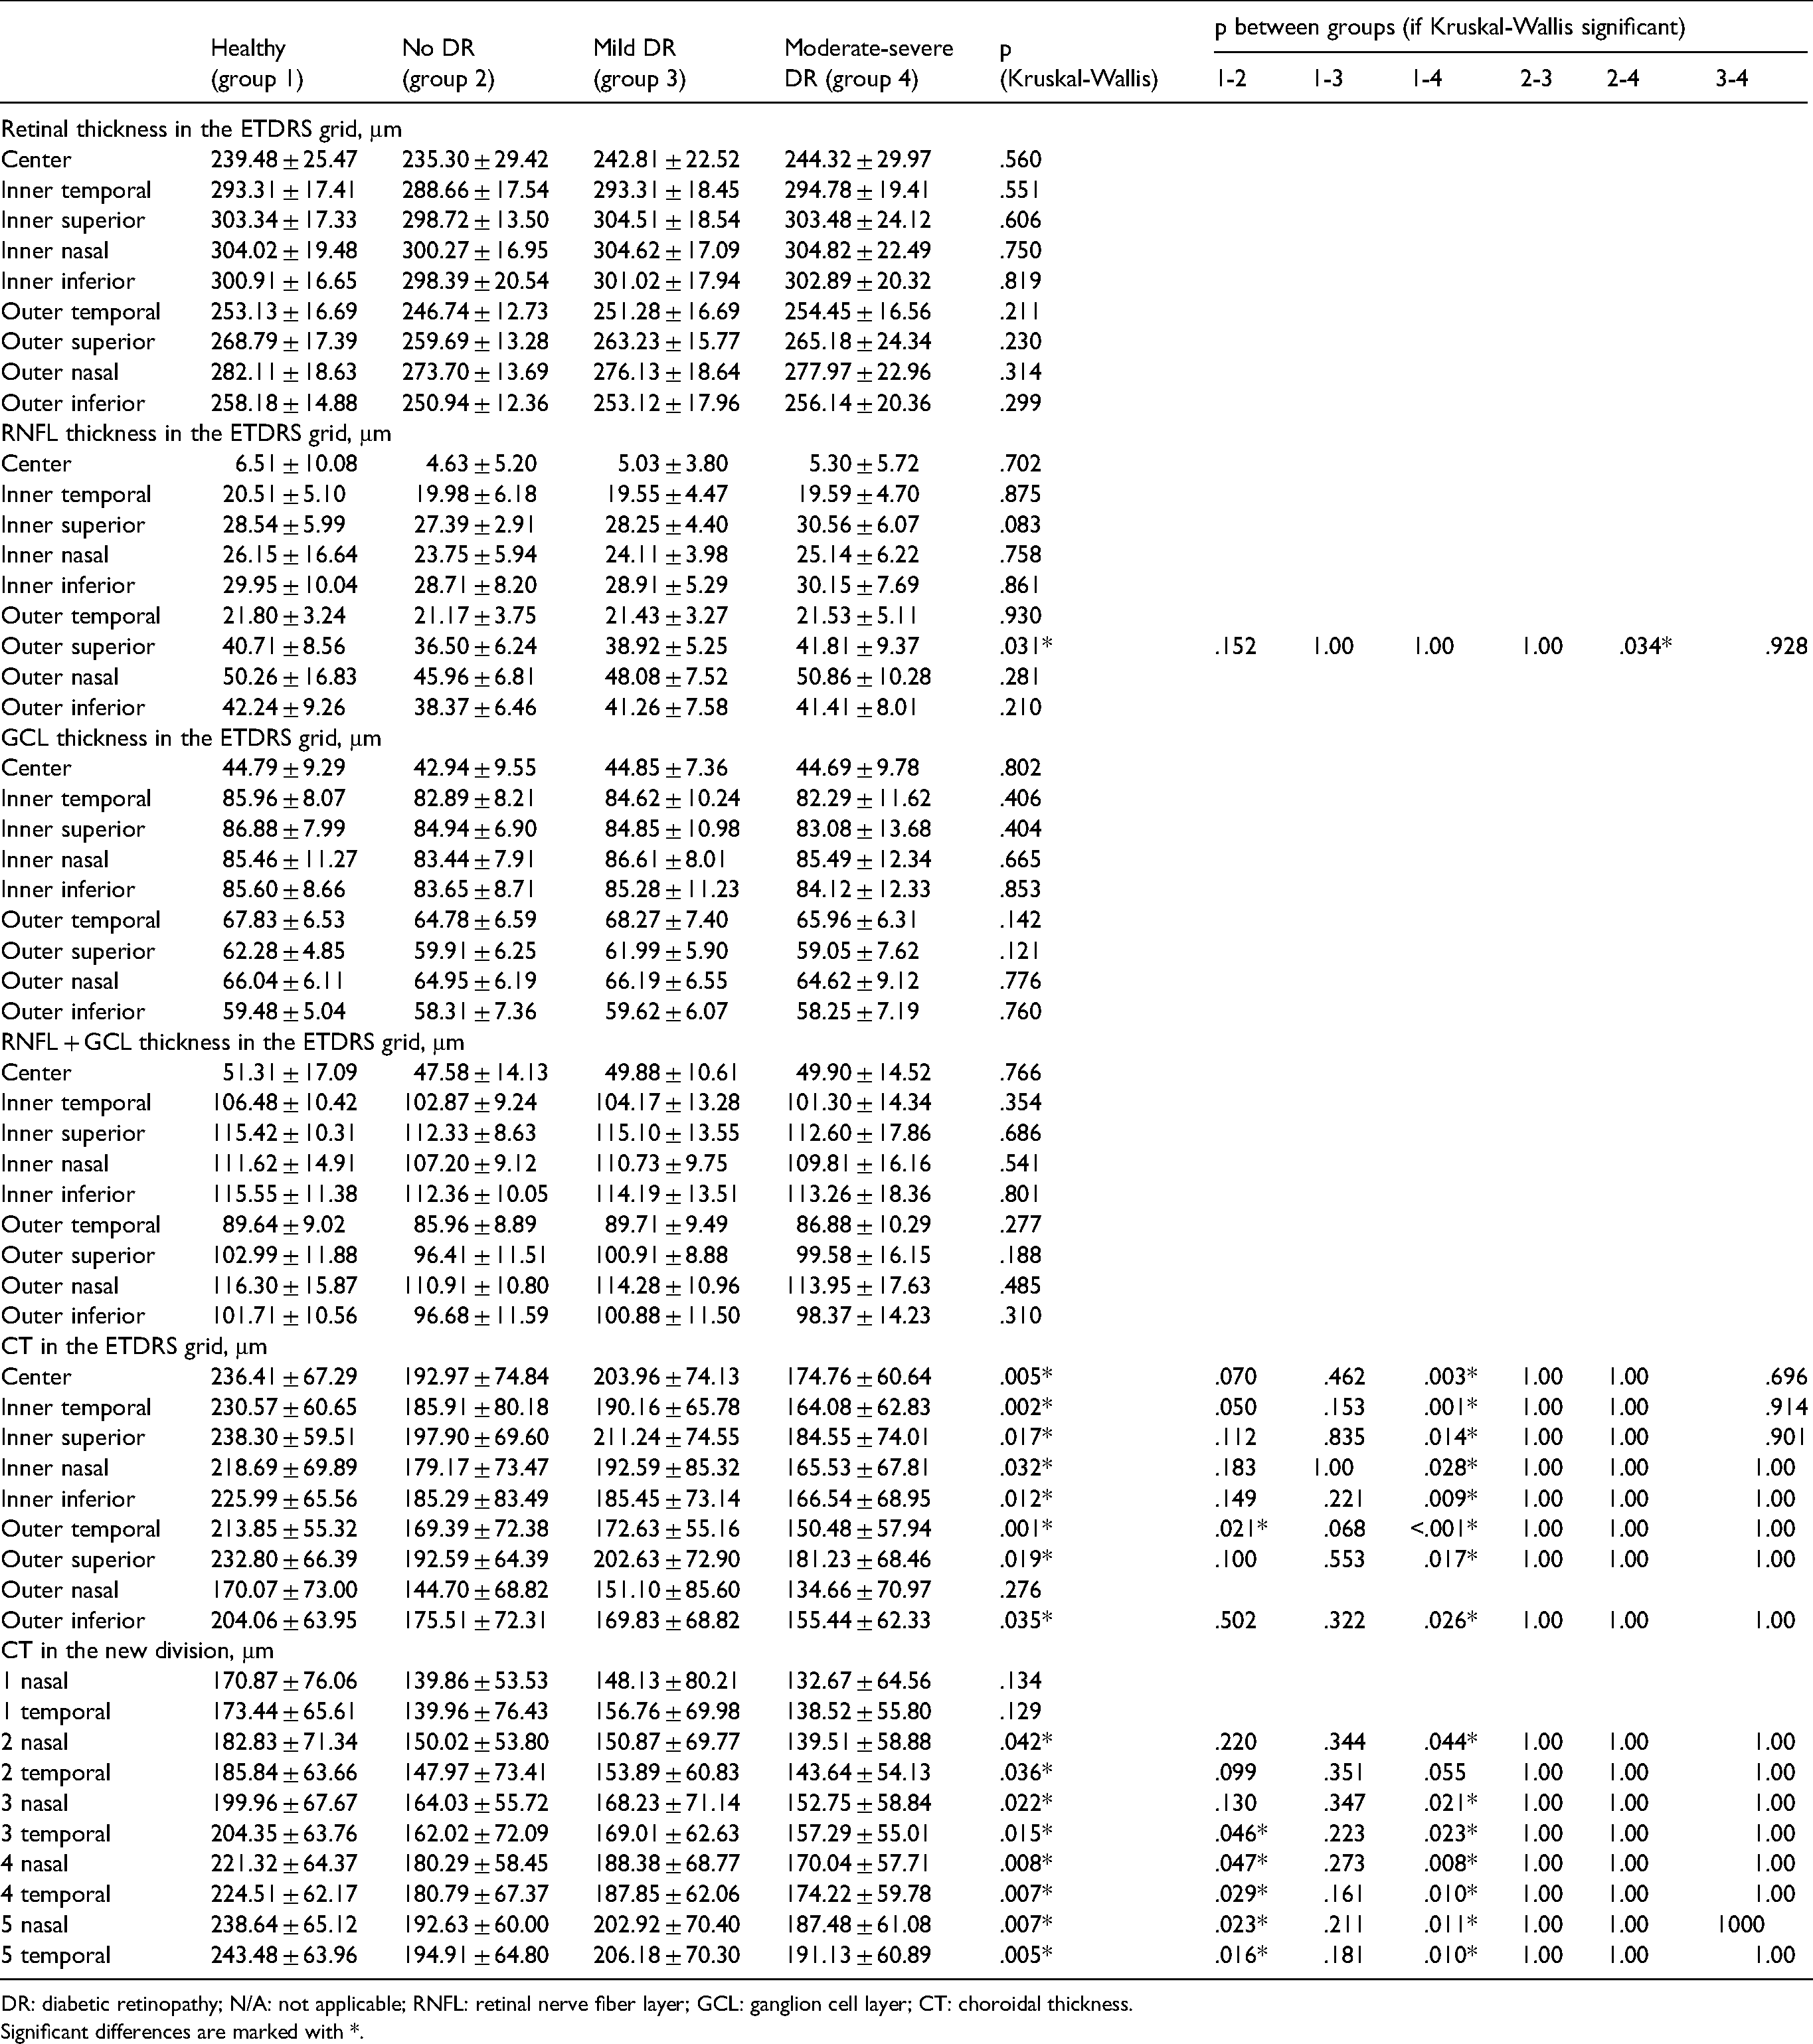
DR: diabetic retinopathy; N/A: not applicable; RNFL: retinal nerve fiber layer; GCL: ganglion cell layer; CT: choroidal thickness.
Significant differences are marked with *.
Analysis using the new choroidal division revealed several differences in comparison with the previous analysis. We found differences between groups 1 and 4 in nearly all sectors, with group 4 presenting thinner measurements. There were also differences between groups 1 and 2 in the central sectors, with group 2 presenting thinner choroid measurements. There were no differences between groups in sectors 1 nasal and 1 temporal, i.e. the choroid located most nasally and temporally.
Table 3 shows plasma biomarkers for general biochemical profile, liver status, T2D status, thyroid and parathyroid activity, general immunological profile, and coagulation. As expected, glucose and HbA1c levels were significantly lower in healthy individuals, as were HOMA-IR and HOMA-β. Renal biomarkers (urea, creatinine, GFR, and CKD-EPI) indicated poorer kidney function in group 4 than in group 1. All CL values were higher in healthy individuals and there were no clinically significant differences regarding liver status, coagulation, or thyroid and parathyroid activity, despite calcium being slightly higher in group 1 than in group 2. Neutrophils were significantly lower in group 1.
Plasma biomarkers for general biochemical profile, liver status, T2D status, thyroid and parathyroid activity, general immunological profile, and coagulation.
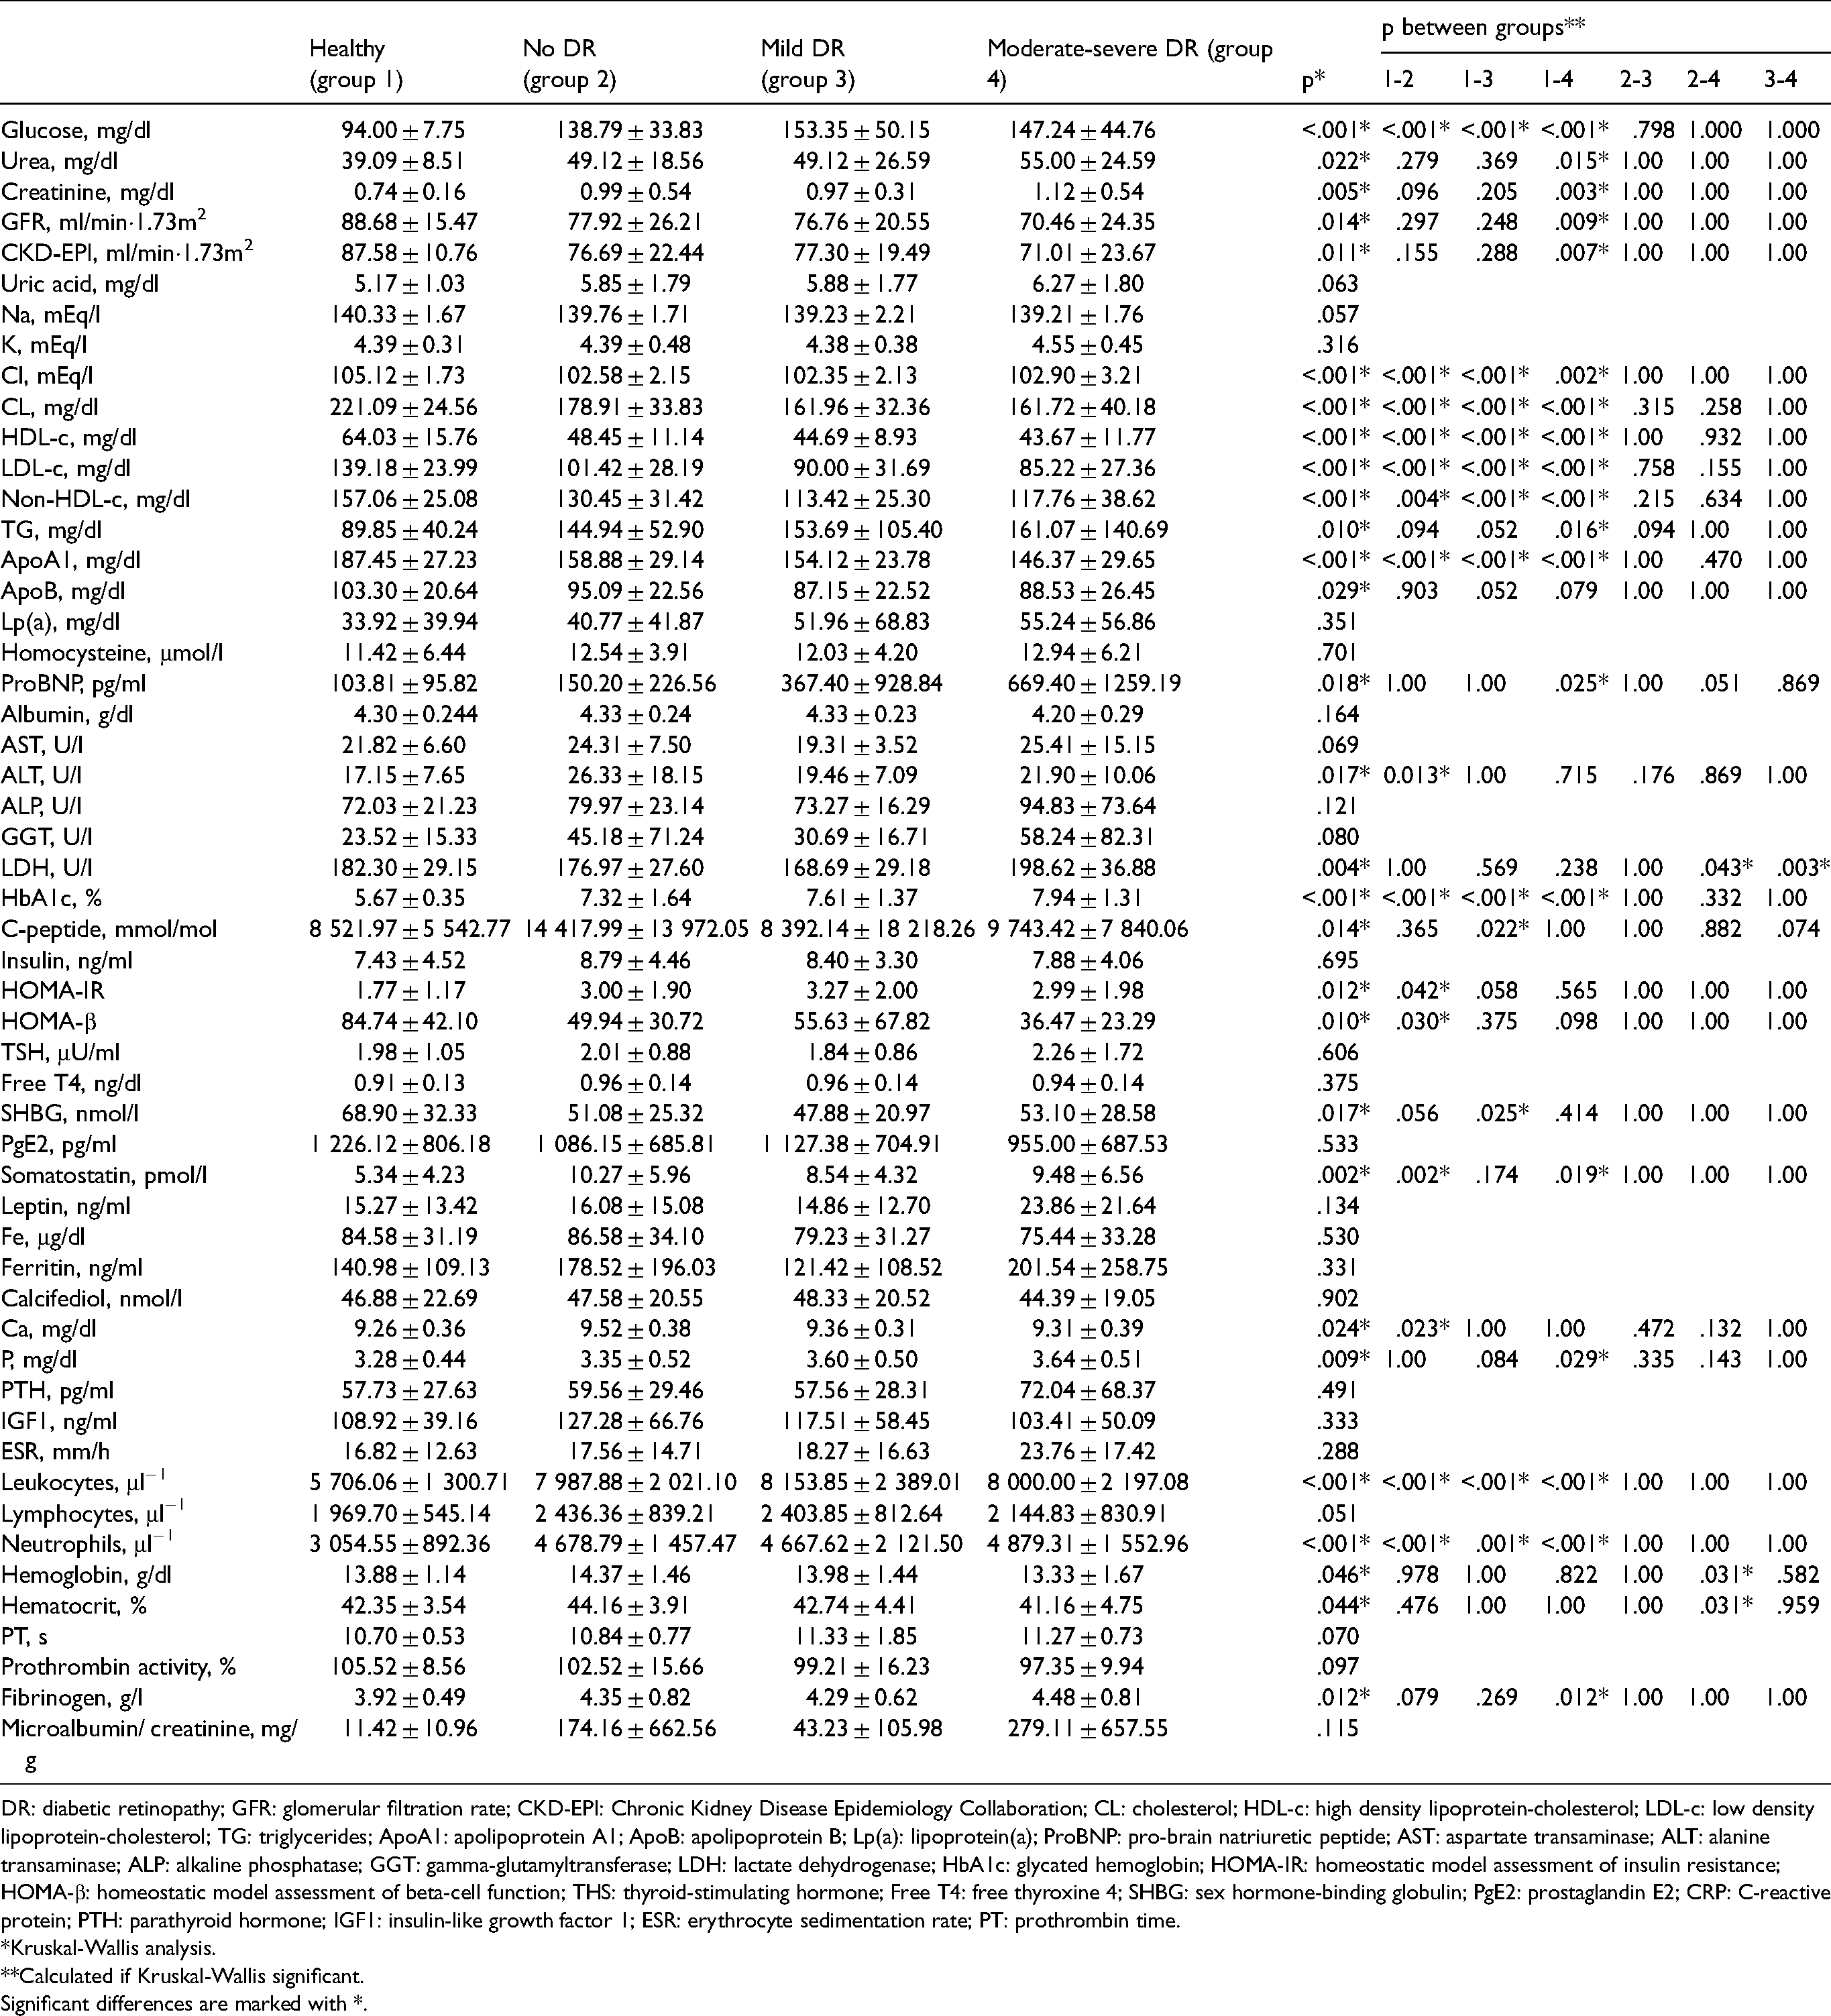
DR: diabetic retinopathy; GFR: glomerular filtration rate; CKD-EPI: Chronic Kidney Disease Epidemiology Collaboration; CL: cholesterol; HDL-c: high density lipoprotein-cholesterol; LDL-c: low density lipoprotein-cholesterol; TG: triglycerides; ApoA1: apolipoprotein A1; ApoB: apolipoprotein B; Lp(a): lipoprotein(a); ProBNP: pro-brain natriuretic peptide; AST: aspartate transaminase; ALT: alanine transaminase; ALP: alkaline phosphatase; GGT: gamma-glutamyltransferase; LDH: lactate dehydrogenase; HbA1c: glycated hemoglobin; HOMA-IR: homeostatic model assessment of insulin resistance; HOMA-β: homeostatic model assessment of beta-cell function; THS: thyroid-stimulating hormone; Free T4: free thyroxine 4; SHBG: sex hormone-binding globulin; PgE2: prostaglandin E2; CRP: C-reactive protein; PTH: parathyroid hormone; IGF1: insulin-like growth factor 1; ESR: erythrocyte sedimentation rate; PT: prothrombin time.
*Kruskal-Wallis analysis.
**Calculated if Kruskal-Wallis significant.
Significant differences are marked with *.
Plasma inflammatory and angiogenic biomarkers are displayed in Table 4. We only found differences in IL 8, TNF-α, MCP1, adiponectin and L-selectin.
Inflammatory and angiogenic biomarkers in the four study groups.
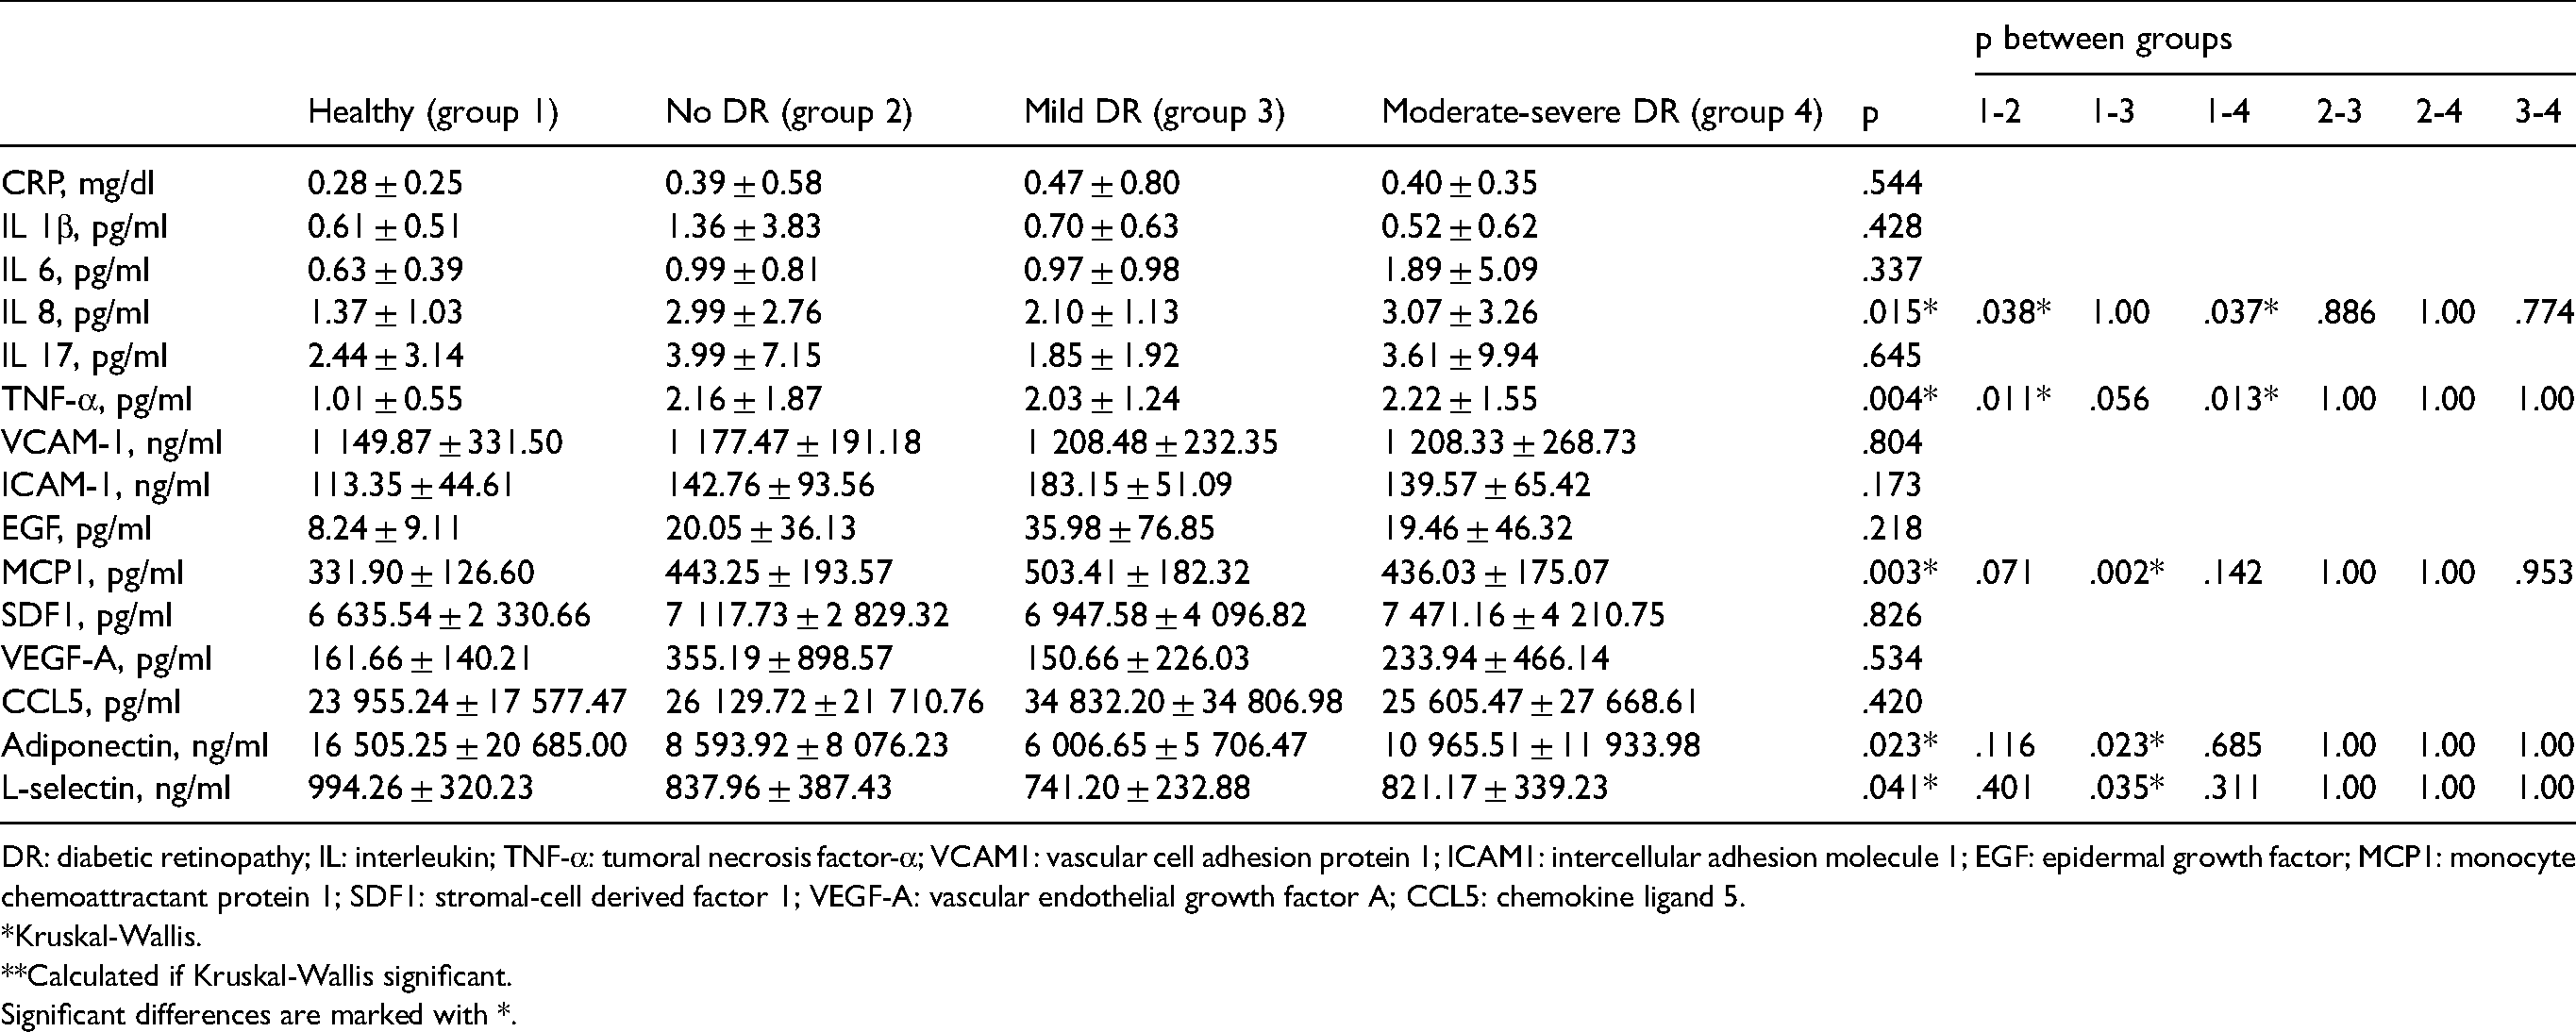
DR: diabetic retinopathy; IL: interleukin; TNF-α: tumoral necrosis factor-α; VCAM1: vascular cell adhesion protein 1; ICAM1: intercellular adhesion molecule 1; EGF: epidermal growth factor; MCP1: monocyte chemoattractant protein 1; SDF1: stromal-cell derived factor 1; VEGF-A: vascular endothelial growth factor A; CCL5: chemokine ligand 5.
*Kruskal-Wallis.
**Calculated if Kruskal-Wallis significant.
Significant differences are marked with *.
Multiple regression analyses showed that not all plasma biomarkers had an influence on CT, and not all choroidal regions were influenced by the same plasma biomarkers. TNF-α was the biomarker that influenced the highest number of choroidal sectors in the ETDRS grid (central, inner temporal, inner inferior and outer inferior). Meanwhile, the outer nasal ETDRS sector was the one influenced by the highest number of biomarkers (ApoA1, ApoB, ALP, C-peptide, leukocytes, prothrombin time, IL1 7, ICAM1 and VEGFA). These findings are displayed in Table 5.
Multiple regression analyses between plasma biomarkers and choroidal thickness in the ETDRS grid.
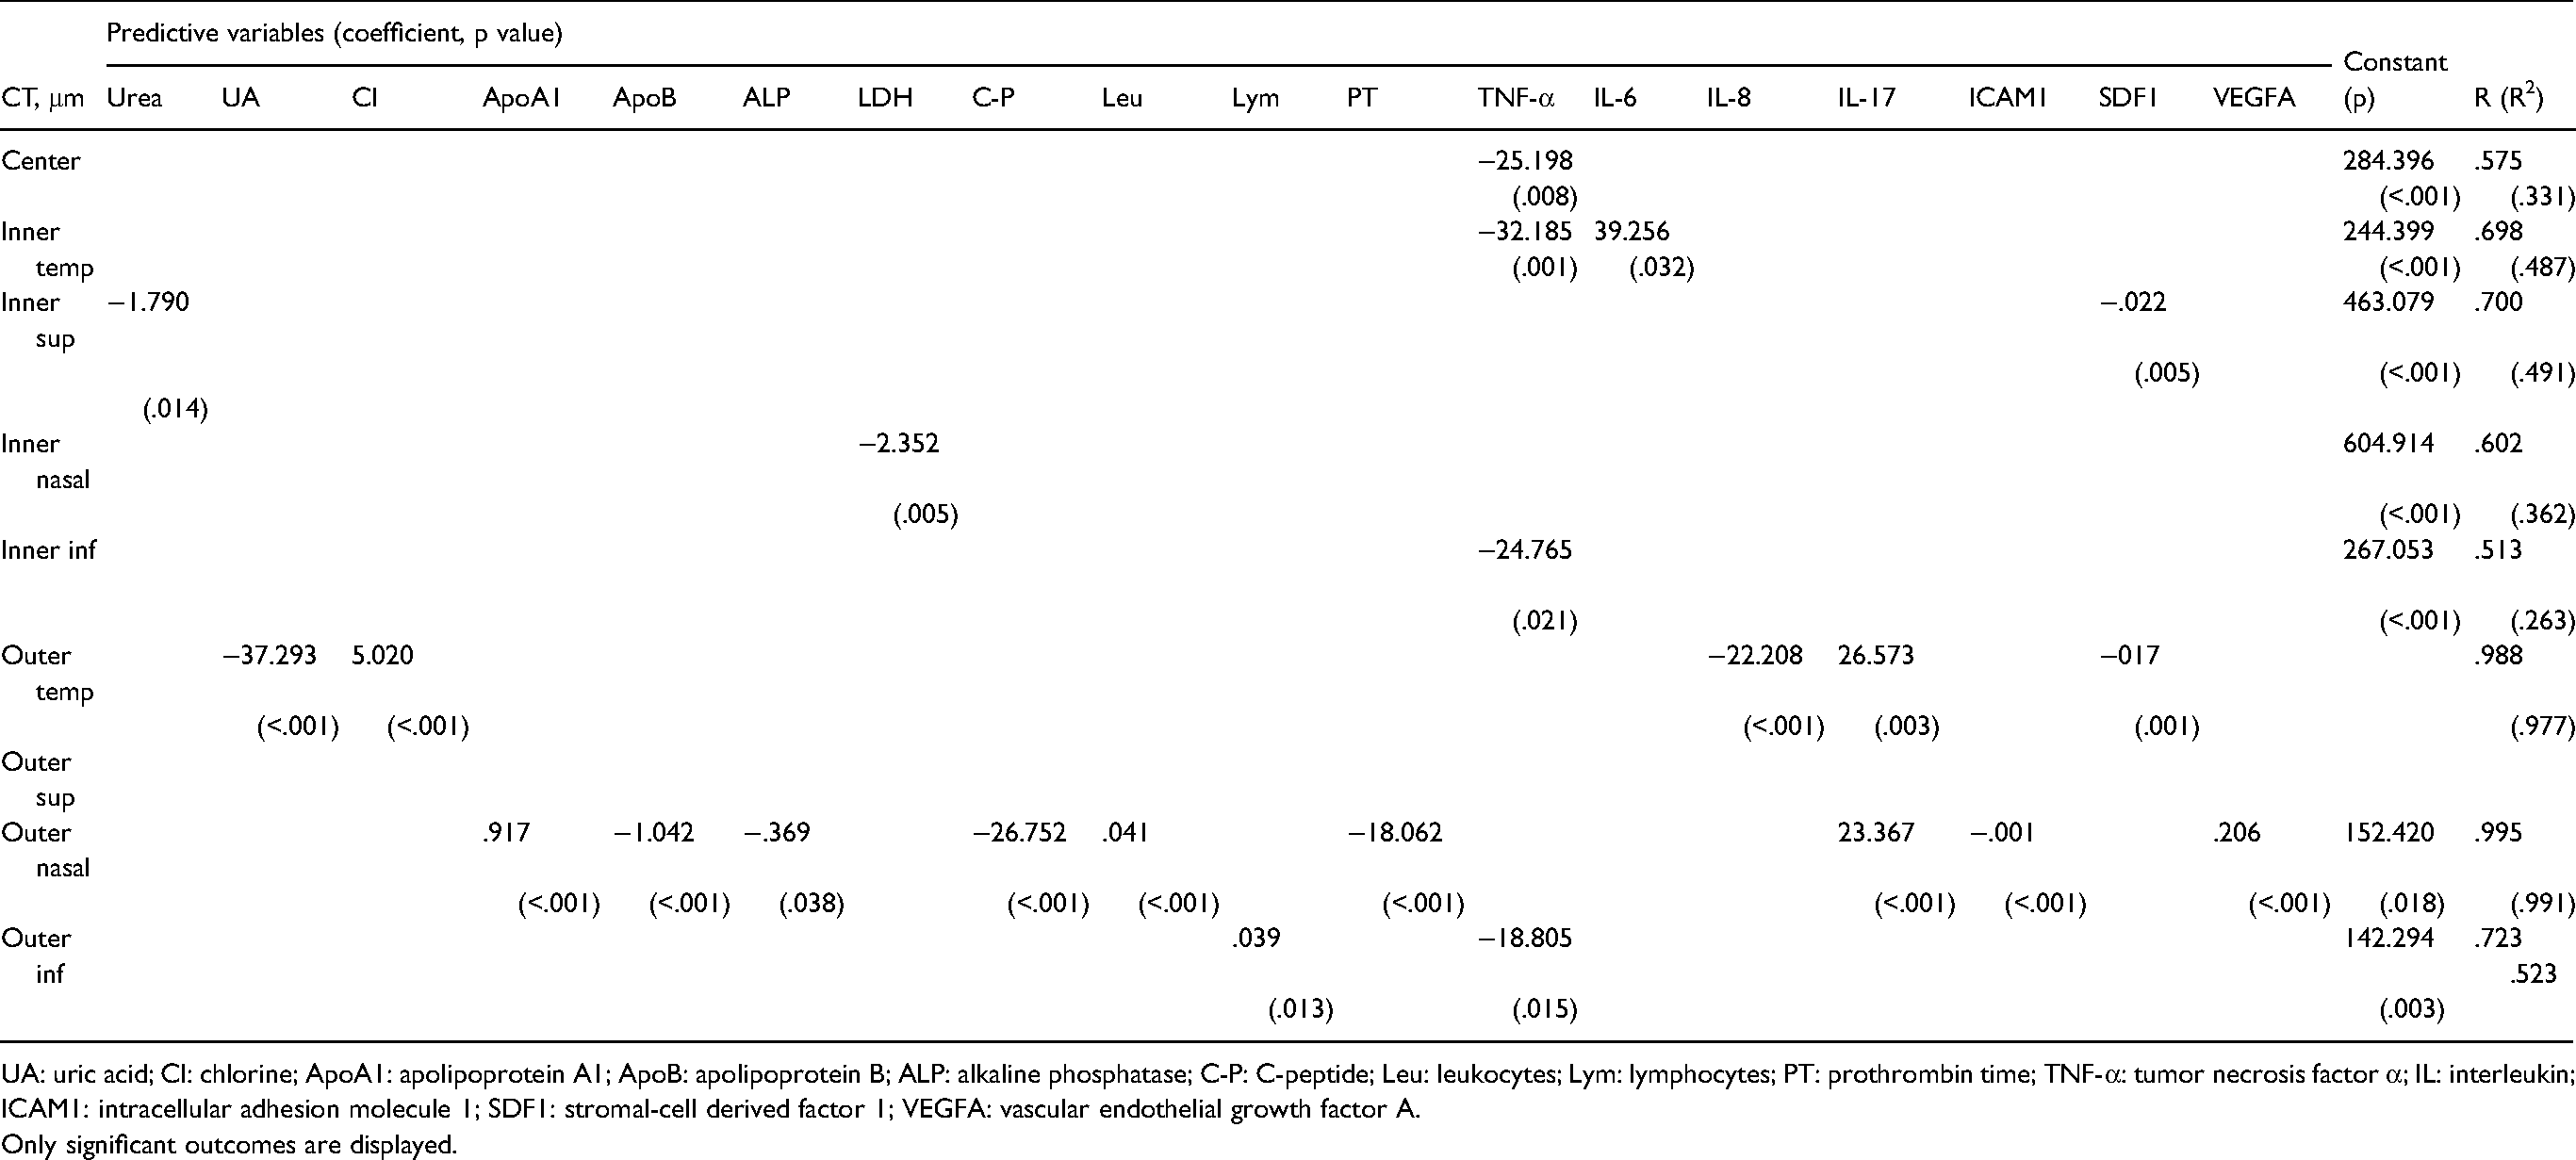
UA: uric acid; Cl: chlorine; ApoA1: apolipoprotein A1; ApoB: apolipoprotein B; ALP: alkaline phosphatase; C-P: C-peptide; Leu: leukocytes; Lym: lymphocytes; PT: prothrombin time; TNF-α: tumor necrosis factor α; IL: interleukin; ICAM1: intracellular adhesion molecule 1; SDF1: stromal-cell derived factor 1; VEGFA: vascular endothelial growth factor A.
Only significant outcomes are displayed.
Tables 6 and 7 display the findings of the multiple regression analyses between plasma biomarkers and the new choroidal division. As found in the ETDRS grid, not all plasma biomarkers had an influence on CT, nor were all choroidal regions influenced by the same plasma biomarkers. Additionally, the number of biomarkers influencing CT was considerably higher. The central choroidal sectors (5N and 5T), together with T1, were influenced by the fewest biomarkers. Based on this choroidal division, the biomarkers that influenced the highest number of choroidal sectors were HDL, albumin and IL 17.
Multiple regression analyses between plasma biomarkers and choroidal thickness in the new choroidal division (part 1).
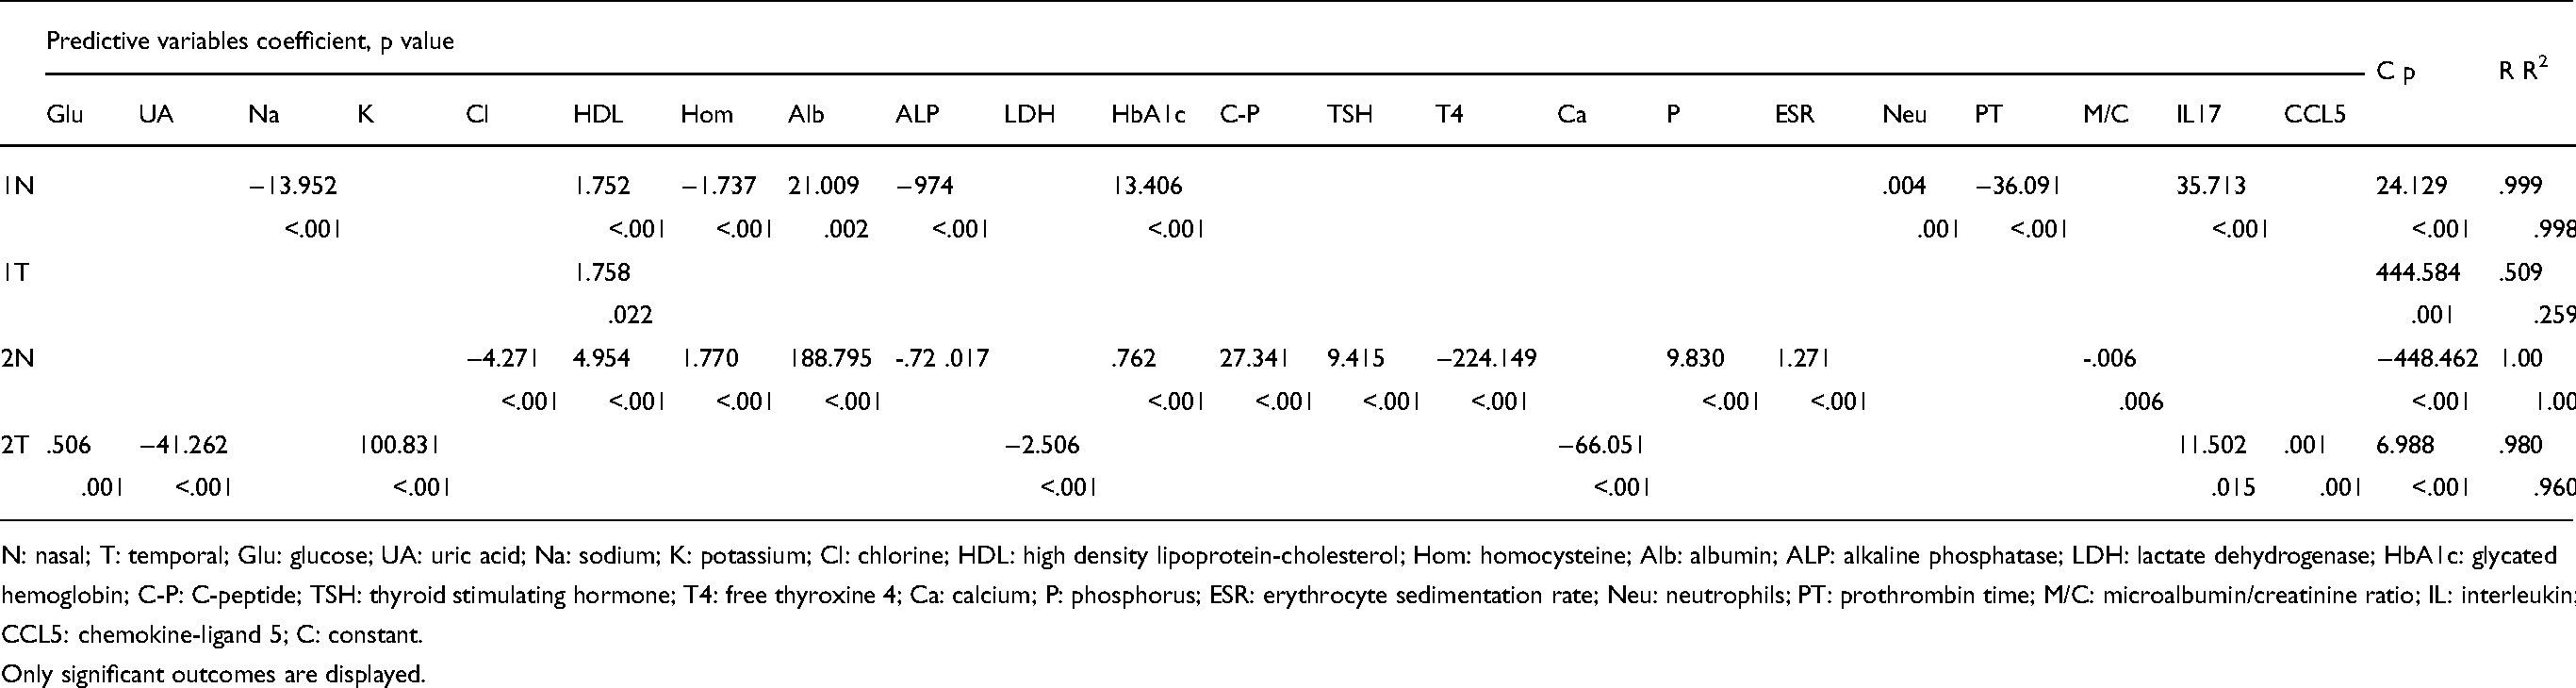
N: nasal; T: temporal; Glu: glucose; UA: uric acid; Na: sodium; K: potassium; Cl: chlorine; HDL: high density lipoprotein-cholesterol; Hom: homocysteine; Alb: albumin; ALP: alkaline phosphatase; LDH: lactate dehydrogenase; HbA1c: glycated hemoglobin; C-P: C-peptide; TSH: thyroid stimulating hormone; T4: free thyroxine 4; Ca: calcium; P: phosphorus; ESR: erythrocyte sedimentation rate; Neu: neutrophils; PT: prothrombin time; M/C: microalbumin/creatinine ratio; IL: interleukin; CCL5: chemokine-ligand 5; C: constant.
Only significant outcomes are displayed.
Multiple regression analyses between plasma biomarkers and choroidal thickness in the new choroidal division (part 2).
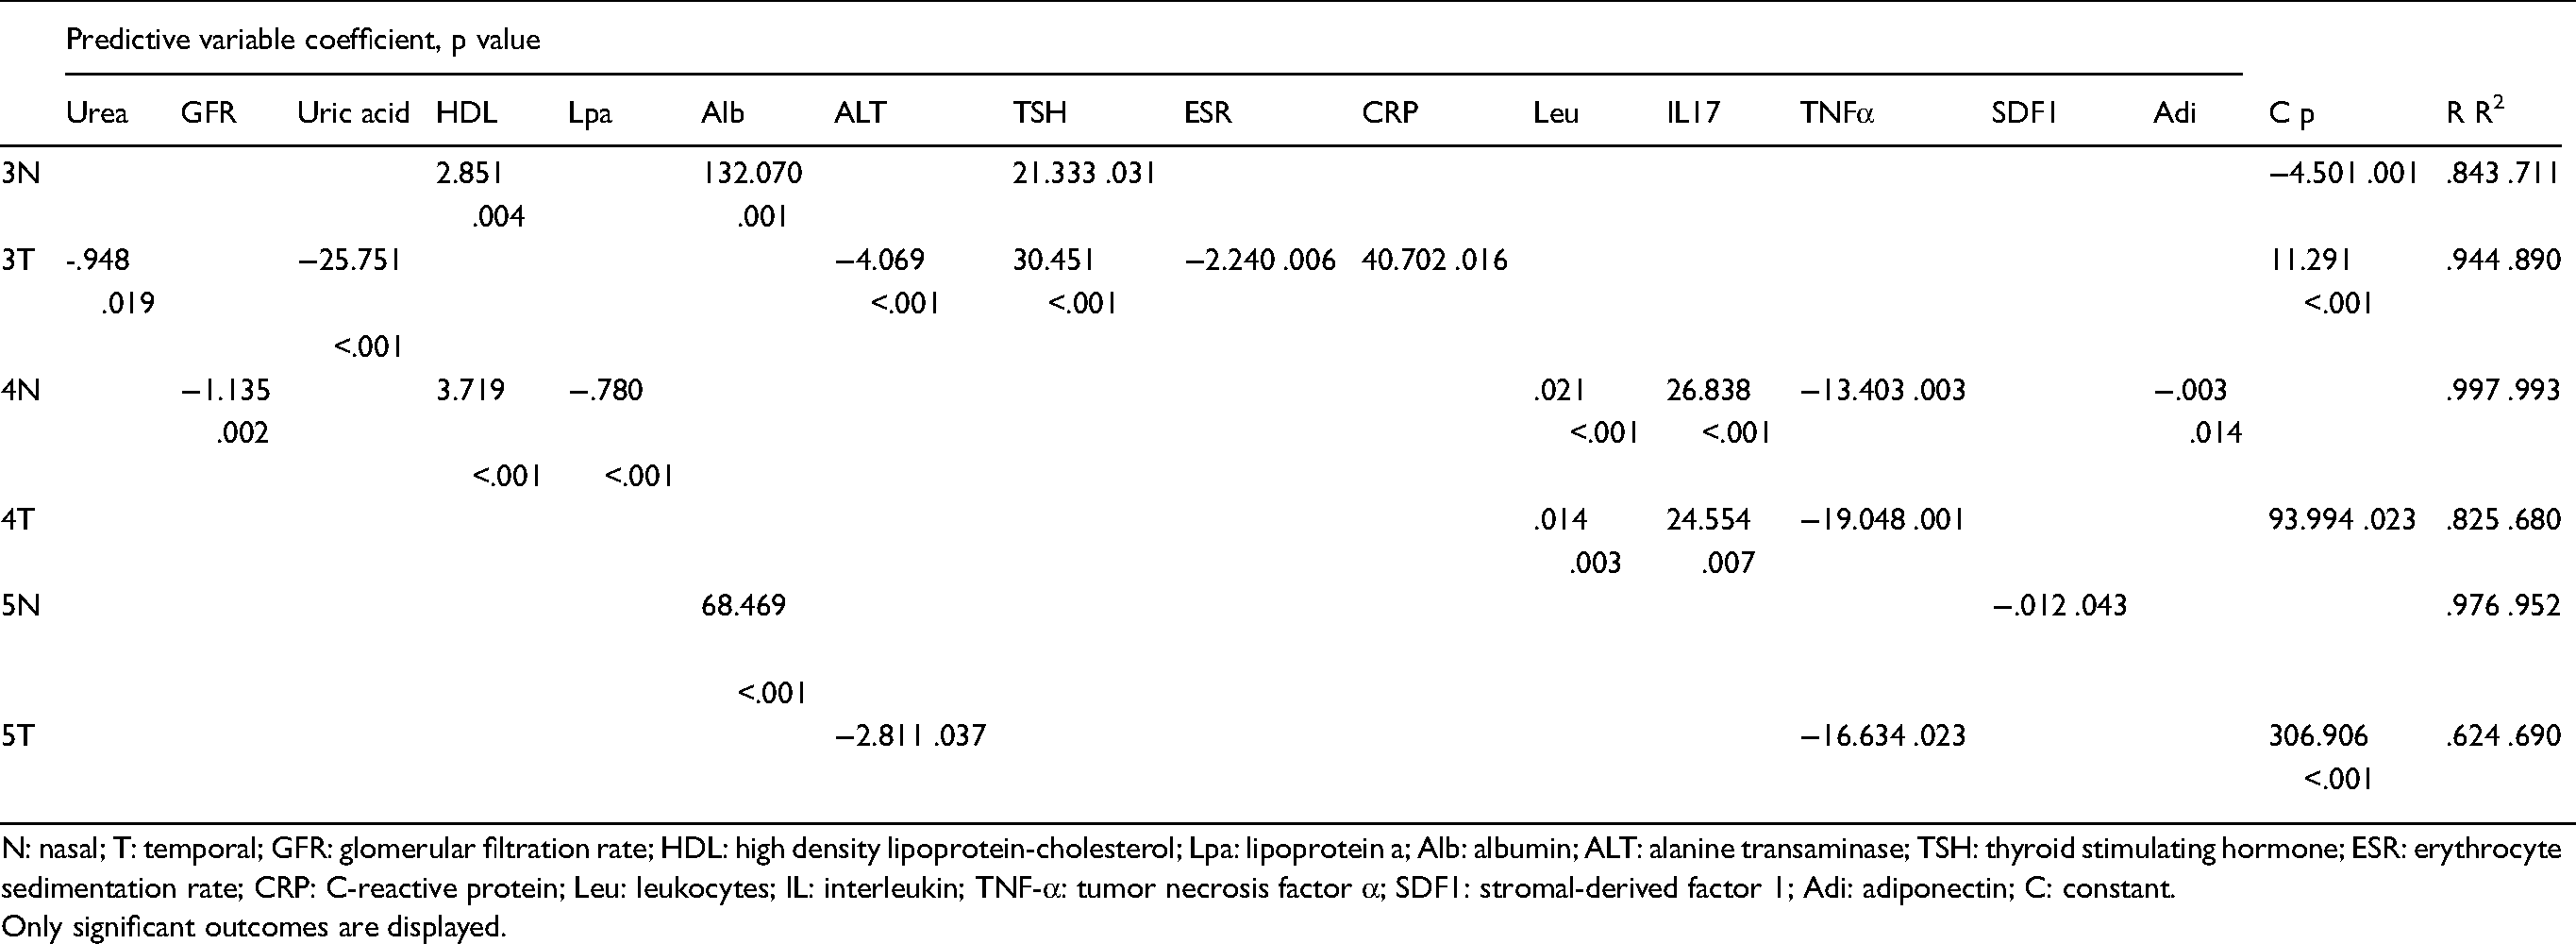
N: nasal; T: temporal; GFR: glomerular filtration rate; HDL: high density lipoprotein-cholesterol; Lpa: lipoprotein a; Alb: albumin; ALT: alanine transaminase; TSH: thyroid stimulating hormone; ESR: erythrocyte sedimentation rate; CRP: C-reactive protein; Leu: leukocytes; IL: interleukin; TNF-α: tumor necrosis factor α; SDF1: stromal-derived factor 1; Adi: adiponectin; C: constant.
Only significant outcomes are displayed.
Figure 1 displays the findings of several regression analyses in both the ETDRS grid and the recently proposed choroid-specific grid. Choroidal sectors with a significant association with a plasma biomarker are colored in gray.
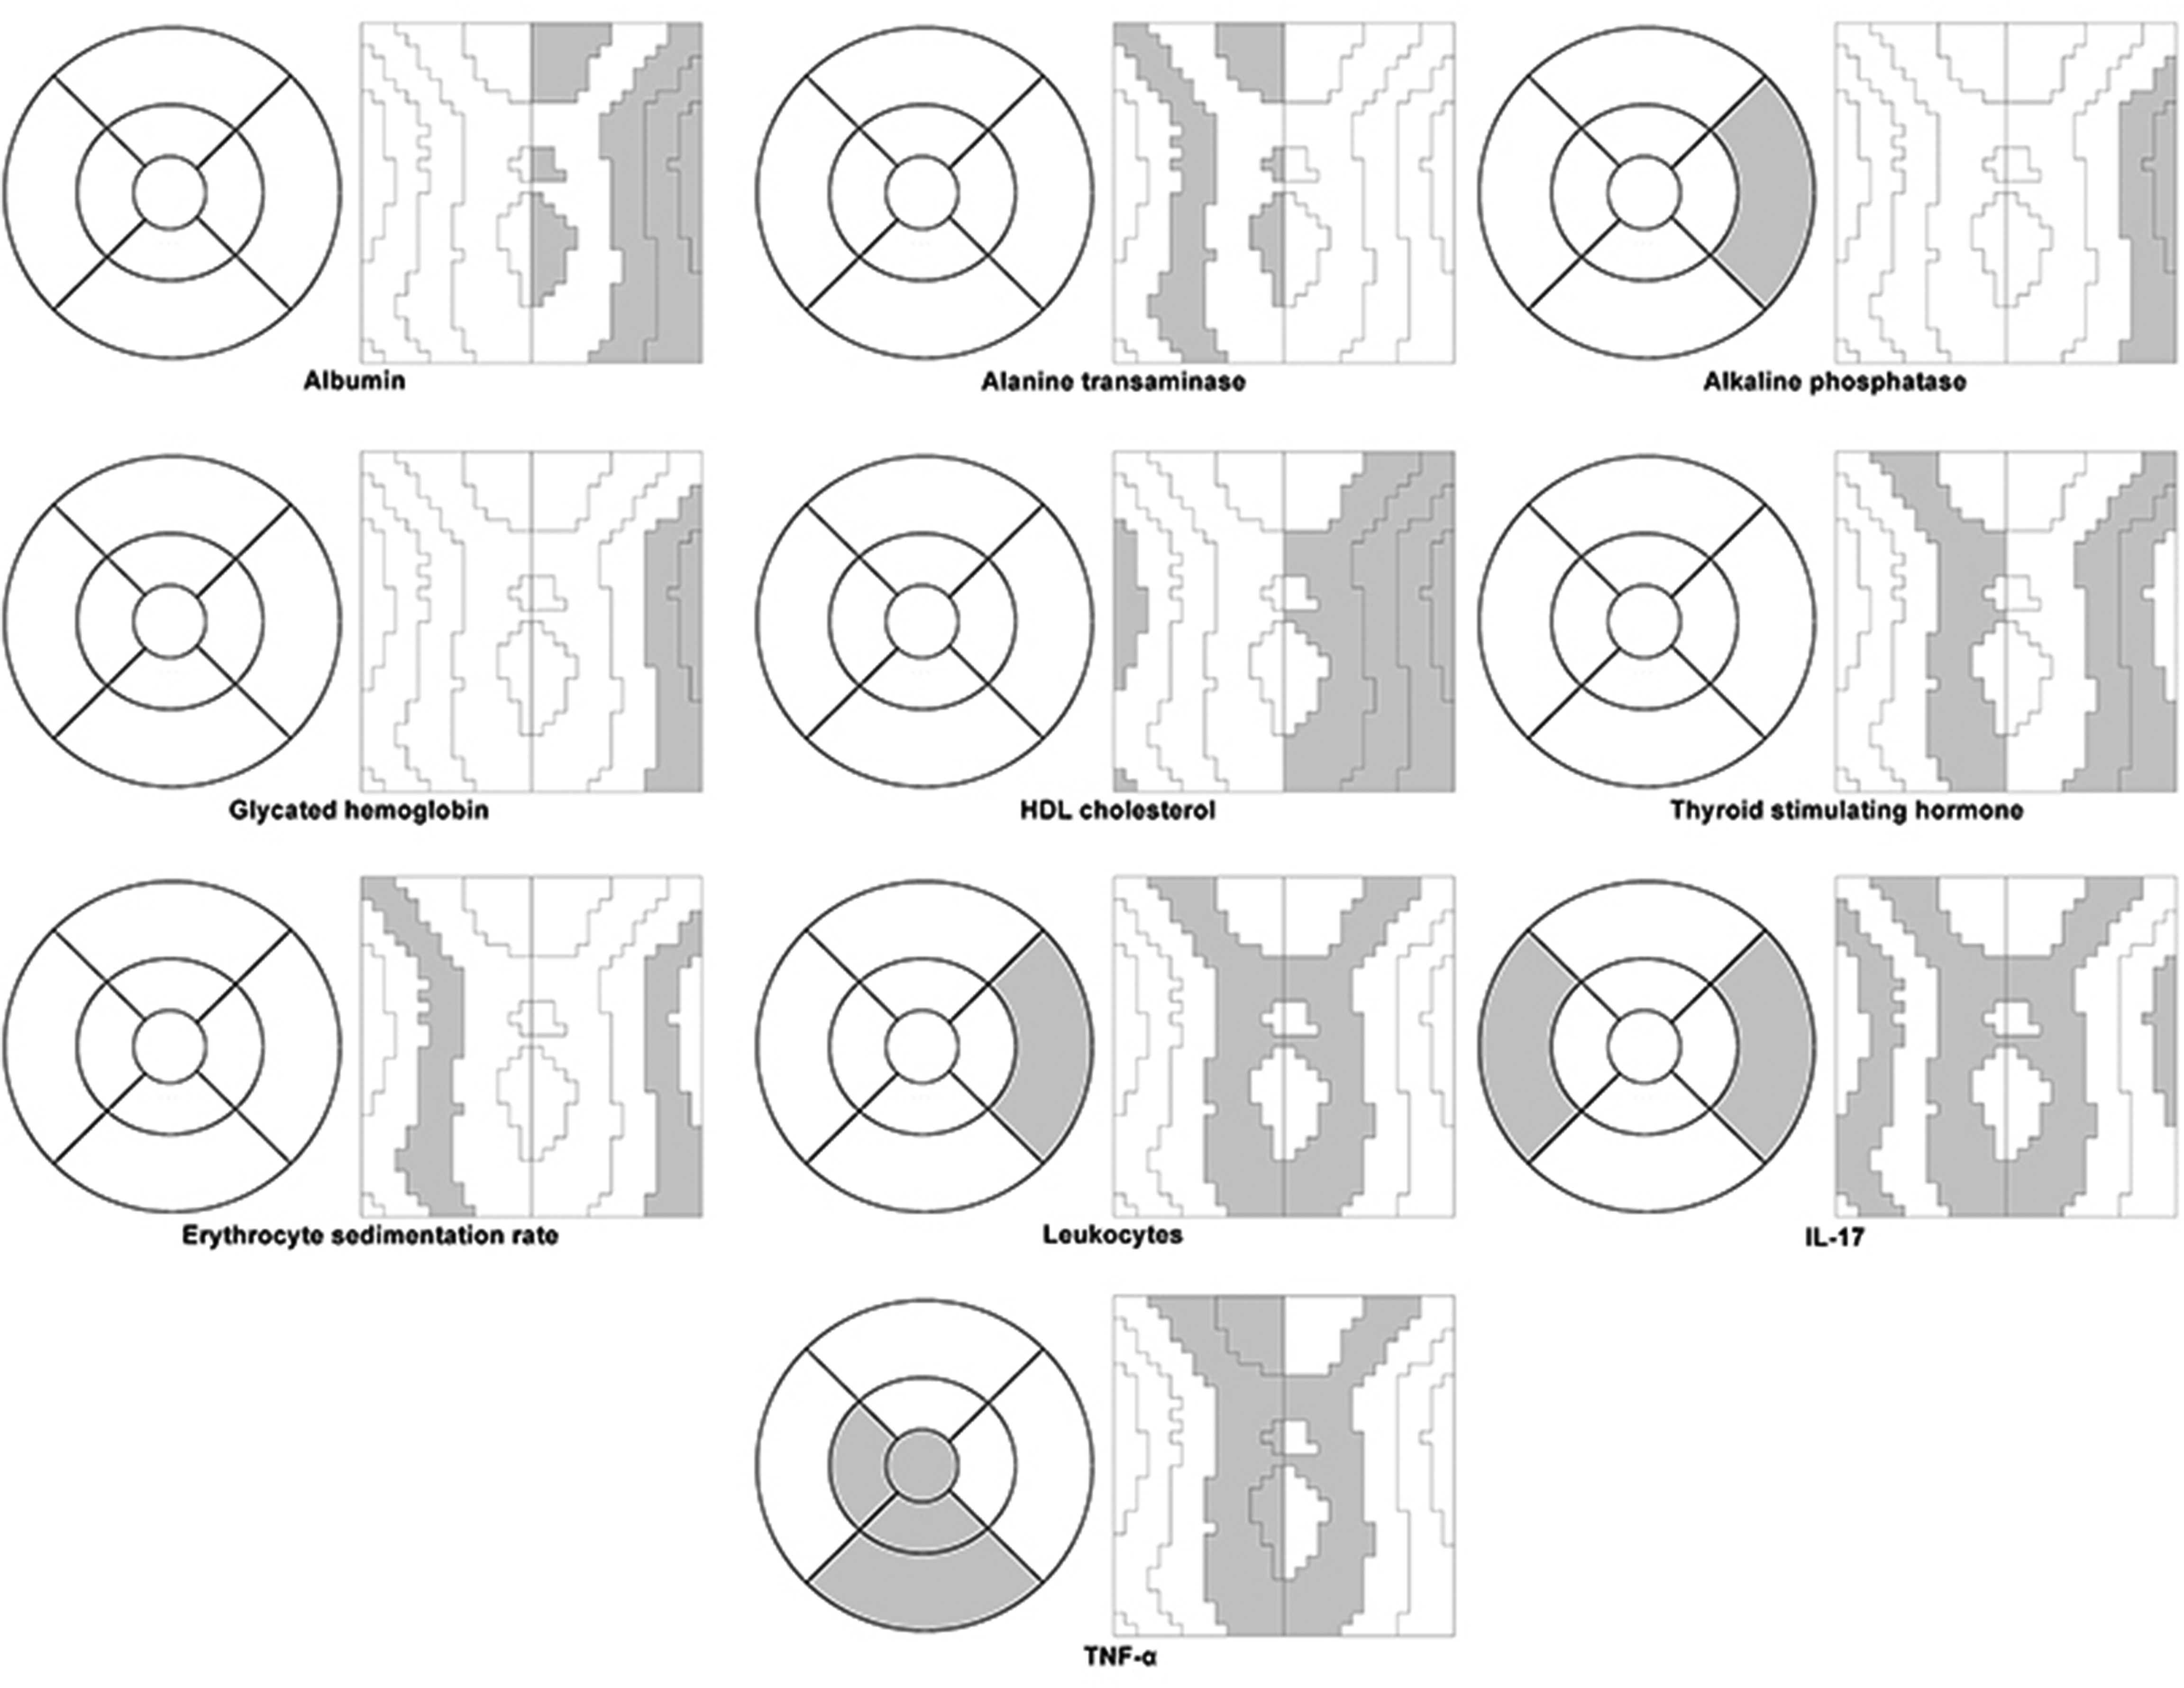
Plasma biomarkers influencing choroidal thickness in the ETDRS grid and the recently proposed choroidal division in a right-eye model. Choroidal sectors in which regression analysis revealed significant influence (p < 0.05) are highlighted in gray.
Discussion
Inflammation plays an important role in the pathophysiology of T2D and this low-grade inflammation contributes to microvascular damage, which encompasses DR. As the choroid is mainly composed of blood vessels, diabetic choroidopathy could be a risk factor in development of DR, 10 although no direct correlation between the two entities has been established yet. This may be attributed to the different characteristics of retinal and choroidal blood vessels.
CT is difficult to measure with spectral-domain (SD)-OCT. However, the development of enhanced-depth-imaging (EDI) technology and SS-OCT has made CT measurement much easier and more accurate. The repeatability and reliability of the Triton DRI OCT device have been demonstrated both in healthy individuals 20 and in T2D patients. 21 Automatic measurements also reduce variability due to their predictability and minimal scan artifacts. 22
Some authors have found some level of retinal neurodegeneration, 23 although this may not always be detectable in the early stages of the disease. 24 Our study did not find any statistical differences between groups.
In our study, comparison using the ETDRS grid found differences in CT between healthy individuals and patients with moderate or severer DR. Previous studies had already confirmed decreased CT in diabetic patients, even prior to the development of DR.7–9 It is possible that we did not find differences in the other study groups because of the reduced sample size. Meanwhile, comparison using the choroidal division introduced by Bartol-Puyal et al. 7 showed differences in CT between healthy and T2D subjetctswithout DR in more choroidal sectors than the ETDRS grid. The most nasal and temporal zones showed no differences, while the central zones were the most sensitive to CT reduction. The distribution of choroidal sectors along the vertical axis instead of in a circular pattern may be the underlying reason why some differences could not be found using the ETDRS grid.
As expected, healthy individuals presented lower levels of glucose, HbA1c, HOMA-IR, and HOMA-β in plasma, and as well as presenting better kidney function. Kidney function is well known to be related to the degree of DR.25,26 Nevertheless, we found lower CL, ApoA1 and ApoB levels in T2D patients, maybe due to the effect of the lipid-lowering medication that T2D patients are recommended to take in order to reduce the risk of cardio-vascular disease (CVD). In fact, pro-BNP is a biomarker for heart failure, whose levels were higher in those patients with severer DR. C-peptide has been proposed to be a biomarker of CVD, too. 27 Healthy individuals in our study presented lower plasma levels of C-peptide than patients with mild DR. There were no clinical differences regarding liver function, thyroid function, serum iron and ferritin, serum calcifediol, parathyroid function, or coagulation activity.
As part of the inflammatory pathogenesis, leukocytes 28 and neutrophils 29 were significantly higher in diabetic patients than in healthy individuals. As a result of dysregulated innate immunity, these produce higher levels of proinflammatory cytokines and adhesion molecules, despite reduced phagocytosis and bactericidal activity. 29 Hence, we found high serum levels of IL-8, TNF-α, and MCP1 in T2D patients. Some authors have found high levels of these cytokines both in serum and in aqueous and vitreous humors, 5 while others have not. 30 In our study we only found higher serum levels of proinflammatory cytokines, but not of others such as CRP, IL-1β, IL-6, IL-17, VCAM-1, ICAM-1, EGF, SDF1, VEGFA, or CCL5. It may be that some cytokines only increase locally in retina or choroid while others do so in the entire body.
Adiponectin has been proposed as a protection factor against the development of DR, with anti-inflammatory effects. 31 Although we did not find differences between groups, healthy controls presented higher plasma levels.
Multiple regression analysis produced different outcomes depending on the choroidal division. In the case of the ETDRS grid, the outer superior sector was the only one that was not influenced by any biomarker. TNF-α was the biomarker that influenced most choroidal sectors, followed by IL-17 and SDF1. Several others had some influence as well, but only in one sector. TNF-α and SDF1 were negatively related to CT, whereas higher levels of IL-17 implied a thicker choroid.
Regression analysis performed using the new choroidal division revealed a higher number of plasma biomarkers with some influence on CT. We could therefore posit that this division is more sensitive to variations in CT than the ETDRS grid. HDL cholesterol had a direct influence on nasal choroid (sectors 1N, 1T, 2N, 3N and 4N), as did homocysteine (sectors 1N and 2N) and albumin (1N, 2N, 3N and 5N). Poor liver function –higher levels of ALT and ALP– would imply a thinner choroid. High levels of TSH were associated with a thicker choroid, but T4 had little influence and could even imply thinning. Given that the quantity of leukocytes, neutrophils and IL-17 was associated with greater CT, inflammation would cause thickening. These findings remain in line with current knowledge about inflammation and the choroid. Pathologies with an inflammatory pathogenesis such as uveitis present a thicker CT. 32 However, high serum levels of IL-17 have also been reported in patients with choroidal neovascularization (CNV), 33 in which choroidal thinning occurs. Conversely, a thinner choroid is associated with higher plasma levels of TNF-α. This is an inflammatory cytokine that contributes to angiogenesis and also stimulates the expression of VEGF and ICAM1 on the vascular endothelium. 34 However, to date, its role in CT has not been studied.
In our study we found that HbA1c has little influence on CT. Some previous authors did not detect any influence, 35 while others did. 36
The strength of this study is that including only naïve T2D patients eliminates possible bias due to retinal and choroidal changes secondary to previous treatment, such as photocoagulation 37 or antiVEGF. 38 Patients with DME were also excluded because of the potential interference with choroidal measurements. Excluding other pathologies associated with choroidal thinning or thickening also makes our results more reliable. Possible individual variations were minimized because all measurements were taken at the same day time and by the same operator. 39 As far as we know, this is the first study to analyze the influence of serum inflammatory biomarkers on CT in T2D patients.
A possible wWeakness is that it is possible that some differences could not be found due to the reduced sample size. Further studies with larger sample sizes should be performed in order to confirm these results.
T2D is characterized by an increase in plasma pro-inflammatory cytokines (IL-8, TNF-α, MCP1, adiponectin and L-selectin), and some of them have an influence on CT. IL-17 is related to a thicker choroid while TNF-α is related to a thinner choroid. HbA1c has little influence on CT. The recently proposed choroidal division is more sensitive to CT changes than the ETDRS grid when applied to the choroid. Some choroidal sectors are more sensitive to serum inflammatory biomarkers than others.
Footnotes
Declaration of conflicting interests
The author(s) declared no potential conflicts of interest with respect to the research, authorship, and/or publication of this article.
Funding
The author(s) received no financial support for the research, authorship, and/or publication of this article.