
Abstract
Purpose
To evaluate and compare the retinal and choroidal spectral-domain optic coherence tomography (SD-OCT) findings of treatment-naïve diabetic macular edema (DME) secondary to non-proliferative and proliferative diabetic retinopathy (NPDR-PDR).
Material and methods
A hundred and thirty-eight eyes of 138 patients with DME were evaluated. Best-corrected visual acuity was recorded, biomicroscopic anterior and posterior segment examination, SD-OCT imaging, and fundus fluorescein angiography (FFA) were performed. Demographic features, OCT characteristics, FFA, and visual acuity measurements were evaluated and compared between the two groups.
Results
Sixteen eyes were excluded from the study due to the lack of FFA images. Data of 122 eyes were analyzed for the study. Sixty-five eyes with NPDR (Group 1) and 57 eyes with PDR (Group 2) were enrolled in the study. There was no significant difference in central macular thicknesses (CMT) between the two groups. The eyes with DME + PDR showed a higher rate of the diffuse type of macular edema with more para and peri-foveal extension accompanied by larger cysts than the eyes with DME + NPDR. Disorganization of retinal inner layers, disrupted ellipsoid zone, and the epiretinal membrane were more prominent in the eyes with PDR. Also, there were more prominent macular ischemia on FFA and worse initial visual acuity measurements in the eyes with PDR than those with NPDR. Choroidal thickness (CT) was significantly reduced in the PDR group.
Conclusion
SD-OCT features of treatment-naïve DME in patients with NPDR and PDR presented some differences. These variations may be related to diabetic retinopathy severity and may provide information about prognosis.
Keywords
Introduction
Diabetic retinopathy (DR) is the leading cause of visual impairment in the middle-aged working population. The reasons for the severe visual loss are mainly intravitreal hemorrhage and tractional retinal detachment which are presented in PDR. Macular edema may occur in the course of both non-proliferative and proliferative DR and can cause moderate to severe visual loss. The macular edema prevalence increases with the severity and the duration of DR. 1
Before the introduction of optical coherence tomography (OCT), diabetic macular edema was monitored by using fundus fluorescein angiography (FFA). Recently, OCT has become a standard diagnostic tool for macular edema as it is non-invasive and safer. 2 Moreover, SD-OCT images provide cross-sectional images of the entire macula in a detailed manner. Besides morphological characteristics of macular edema such as the size and location of intraretinal cysts and the presence of subretinal fluid; it also allows detailed visualization of the integrity of retinal layers such as the ellipsoid zone and external limiting membrane.3–5
In clinical practice, the severity of DR is assessed by indirect ophthalmoscopy and FFA. However, as FFA is an invasive, non-quantitative, and time-consuming procedure, it may not be performed in all patients with DR. This may cause to underestimate the severity of DR in some patients at presentation. It raises the question of whether OCT morphologic characteristics of DME might give an idea about the severity of DR. Numerous studies evaluated OCT biomarkers to help in determining functional outcomes of DME.6–8 However, very little data was shared about OCT characteristics of macular edema at different stages of DR. OCT characteristics may give an idea about the severity of retinopathy. In the present study, we evaluated and compared the OCT biomarkers of DME in patients with NPDR and PDR.
Materials and methods
The medical records of 138 patients with diabetic macular edema who applied to our retina department were retrospectively evaluated. All patients provided written consent to participate according to the tenets of the Declaration of Helsinki and informed consent was obtained from all participants before the diagnostic and therapeutic interventions. The study was approved by the Institutional Review Board of Haydarpasa Numune Training and Research Hospital.
Patients with type 2 diabetes mellitus with macular edema were evaluated in the study. All participants were treatment naïve. Central macular thickness (CMT) of more than 300 µm was accepted as macular edema. Only one eye (the right one) of the patients was included in the case of bilateral retinopathy with macular edema. Patients with high refractive errors (greater than −5.00 and +3.00 diopters), corneal pathologies, cataract, retinal pathologies such as retinal vein occlusion, central serous chorioretinopathy, age-related macular degeneration, ocular pathologies such as uveitis, glaucoma, associated vitreous opacity, the history of vitreoretinal surgery, cataract operation within the last 6 months were excluded from the study.
All patients underwent a complete ophthalmologic examination. Best-corrected visual acuity (BCVA) measured by Snellen chart. The anterior and dilated posterior segment biomicroscopic examinations were performed. The macula was screened by SD-OCT (OCT; Heidelberg Engineering, Heidelberg, Germany) and FFA (VISUCAM 500; Carl Zeiss Meditec) was performed at the time of diagnosis.
All patients were screened by SD-OCT (OCT; Heidelberg Engineering, Heidelberg, Germany) with an EDI system. All measurements were performed between 9.00 and 11.00 am. The macula was screened by taking 19 horizontal lines centered on the fovea, each with 9 averaged OCT B-scans_1024 A-scans per line at 240 µm intervals covering (a 6 × 6-mm area). The average macular thicknesses were evaluated by using an ETDRS grid map. Thicknesses were examined at 5 points: central 1 mm (central foveal), 1–3 mm (parafoveal), and 3–6 mm (perifoveal) both nasally and temporally. The choroidal thicknesses (CT) were measured manually from the outer portion of the hyper-reflective line corresponding to the retinal pigment epithelium to the inner surface of the sclera by using the digital caliper tool in the Heidelberg Eye Explorer software, just beneath the fovea (subfoveal), 1 mm from the center of the fovea (parafoveal) and 3 mm from the center of the fovea (perifoveal) both nasally and temporally.
Evaluation of the OCT images
OCT images were evaluated by two independent observers who were masked as to the severity of DR and other clinical characteristics (TK.E and E.NY). In cases of disagreement on readings, the third observer evaluated and made the final decision (Y.NM).
OCT image grading
The macular edema was classified into 3 types: cystoid, diffuse, and cystoid degeneration. Increased retinal thickening with low reflectivity with expanded retinal areas with lower reflectivity was named as diffuse, cystoid spaces with low reflectivity that were separated by septa were named as cystoid macular edema (CME). Cystoid spaces larger than 600 µm in diameter horizontally were classified as cystoid degeneration.9–11 Presence and height of serous macular detachment, cyst height, the integrity of outer retinal layers (ellipsoid zone (EZ) and external limiting membrane (ELM)), presence of disorganization of retinal inner layers (DRIL), epiretinal membrane (ERM), posterior vitreous detachment (PVD) and vitreomacular traction (VMT) were noted. The EZ and ELM were evaluated in the region within a radius of 500 µm from the center of the fovea. The eyes with continuous and visible EZ or ELM were categorized as intact, and the others were categorized as disrupted. The presence of DRIL was evaluated within the 1 mm area from the center of the fovea.
FFA evaluation
Eyes with optic disc neovascularization (NVD) or retinal neovascularization (NVE) were classified as PDR. FFA images were also evaluated for the assessment of nonperfusion areas at the foveal region (macular ischemia). Macular ischemia was defined as foveal avascular zone (FAZ) enlargement larger than 1000 µm or the presence of a nonperfusion area within one disc diameter from the center of the fovea. 12 Although peripheral retinal ischemia was not evaluated properly because of the low image quality, the presence of retinal neovascularization indirectly pointed out peripheral retinal ischemia.
Statistical analysis
Data were analyzed with IBM Statistical Package for the Social Sciences (SPSS) software (version 23.0; IBM Corporation, Armonk, NY, USA). The demographic characteristics of the patients were compared by using Mann-Whitney U, Student’s t, Fischer’s exact, and Chi-square tests. The variables were investigated using visual (histograms) and analytical methods (Kolmogorov-Smirnov) to determine whether or not they are normally distributed. Descriptive analyses were presented using means, standard deviations, or median, minimum and maximum values. The proportions were presented using percentages. Levene test was used to assess the homogeneity of the variances. The Chi-square test was used to compare categorical variables. The Mann-Whitney U test was used the compare the nonparametric data between the groups. Pearson correlation test was applied to evaluate the correlation for any observed difference between the sets that arose by chance. A p-value of less than 0.05 was considered to show a statistically significant result.
Results
The medical records of 138 patients were evaluated retrospectively. Sixteen patients were excluded from the study due to a lack of FFA images. Thus, the data for 122 eyes were evaluated. Patients with DME secondary to NPDR were labeled as Group 1 (n = 65) and PDR as Group 2 (n = 57). The mean age of the participants was 61.23 ± 6.24 and 58.87 ± 7.22 years in Groups 1 and 2, respectively. Twenty nine (44.6%) patients were female and 36 (55.4%) patients were male in Group 1, 22 (38.6%) were female and 35 (61.4%) were male in Group 2. Both groups had no difference regarding age and sex. The duration of diabetes was significantly longer in Group 2 (15.78 ± 4.96) than in Group 1 (11.56 ± 5.02) (p = 0.000). No difference was found between the groups concerning co-morbidities such as hypertension and hyperlipidemia (Table 1).
Demographic findings and clinical characteristics of the groups.
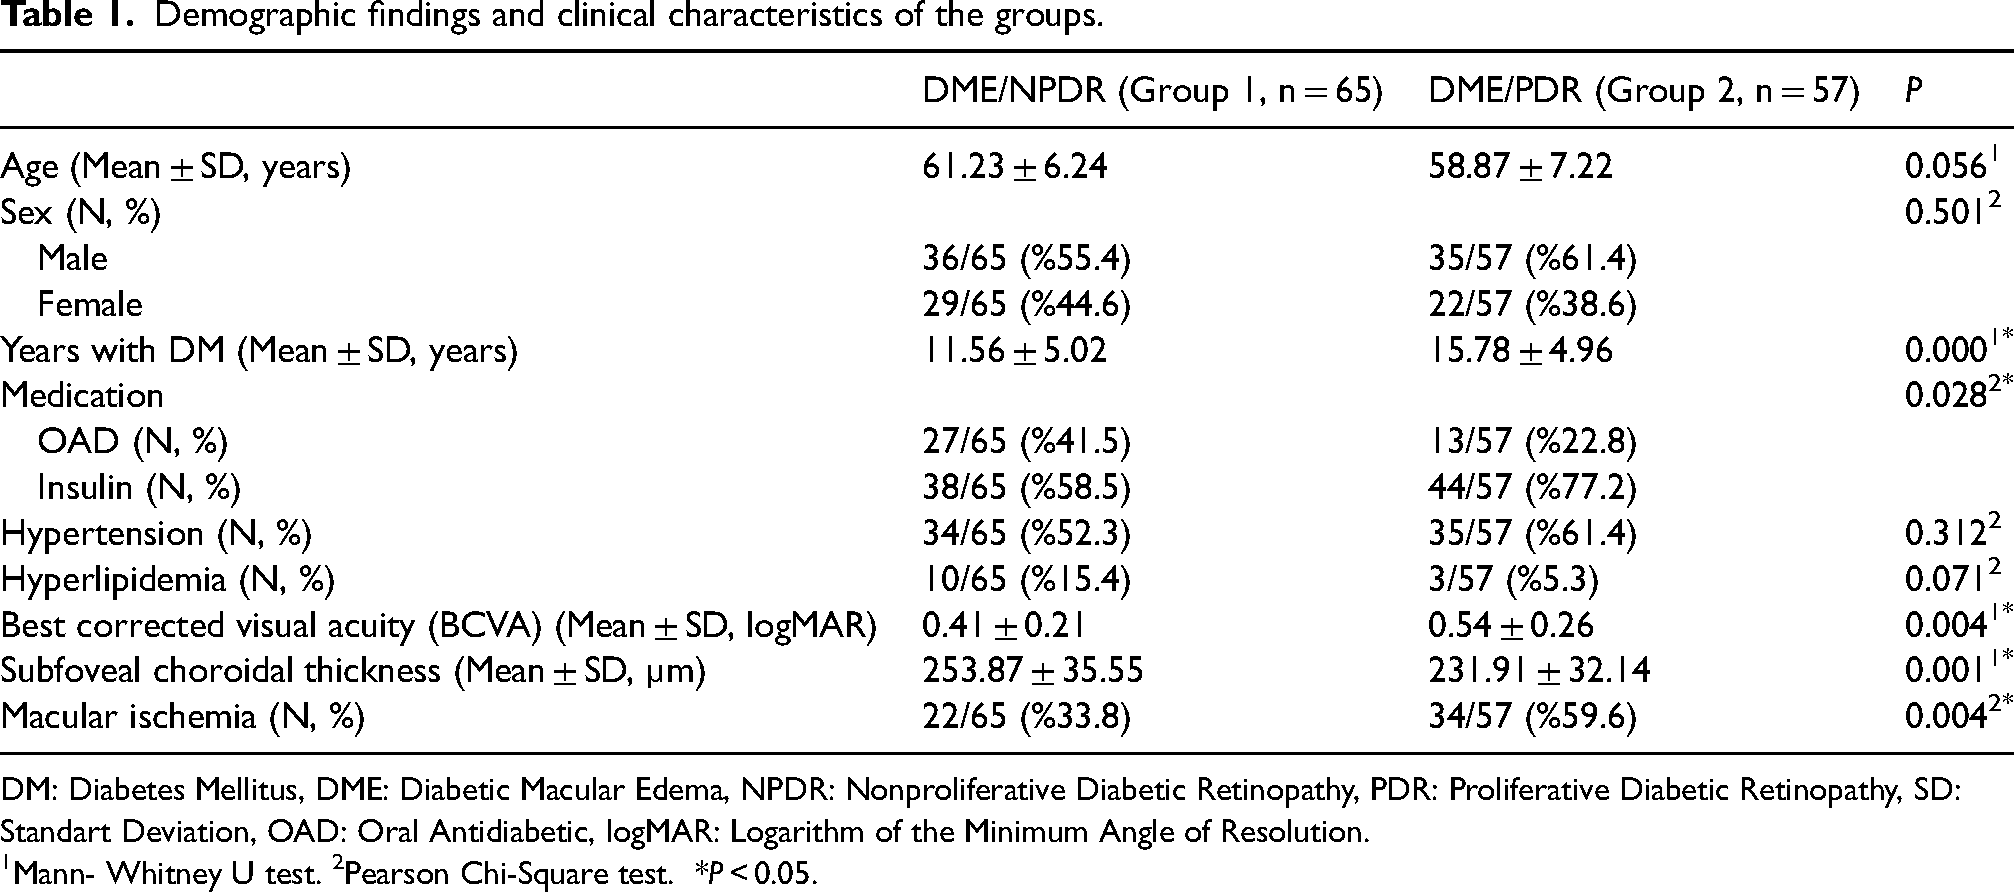
DM: Diabetes Mellitus, DME: Diabetic Macular Edema, NPDR: Nonproliferative Diabetic Retinopathy, PDR: Proliferative Diabetic Retinopathy, SD: Standart Deviation, OAD: Oral Antidiabetic, logMAR: Logarithm of the Minimum Angle of Resolution.
Mann- Whitney U test. 2Pearson Chi-Square test. *P < 0.05.
The mean BCVA of patients with PDR (0.54 ± 0.26 logMAR) was significantly lower than patients with NPDR (0.41 ± 0.21 logMAR) (p = 0.004) (Table 1).
OCT characteristics
OCT characteristics of both groups were presented in Tables 2 and 3. There was no significant difference between the groups regarding CMT (p = 0.594). While the patients with PDR presented with a diffuse type of macular edema (32/57, 56.1%), the patients with NPDR presented with a cystoid type of macular edema (51/65, 78.5%) more evidently. However, the cysts present in patients with PDR were larger than those with NPDR (p = 0.037) (Table 2). Macular edema extended more peripherally, and choroidal thicknesses were lower in central, para, and perifoveal regions in patients with PDR compared to patients with NPDR (Table 3). No difference was found between the two groups in terms of serous macular detachment and the height of the detachment. Patients with PDR had a higher rate of DRIL (p = 0.000), disruption of EZ (0.004) and ERM (p = 0.011) (Table 2).
OCT characteristics of the groups.
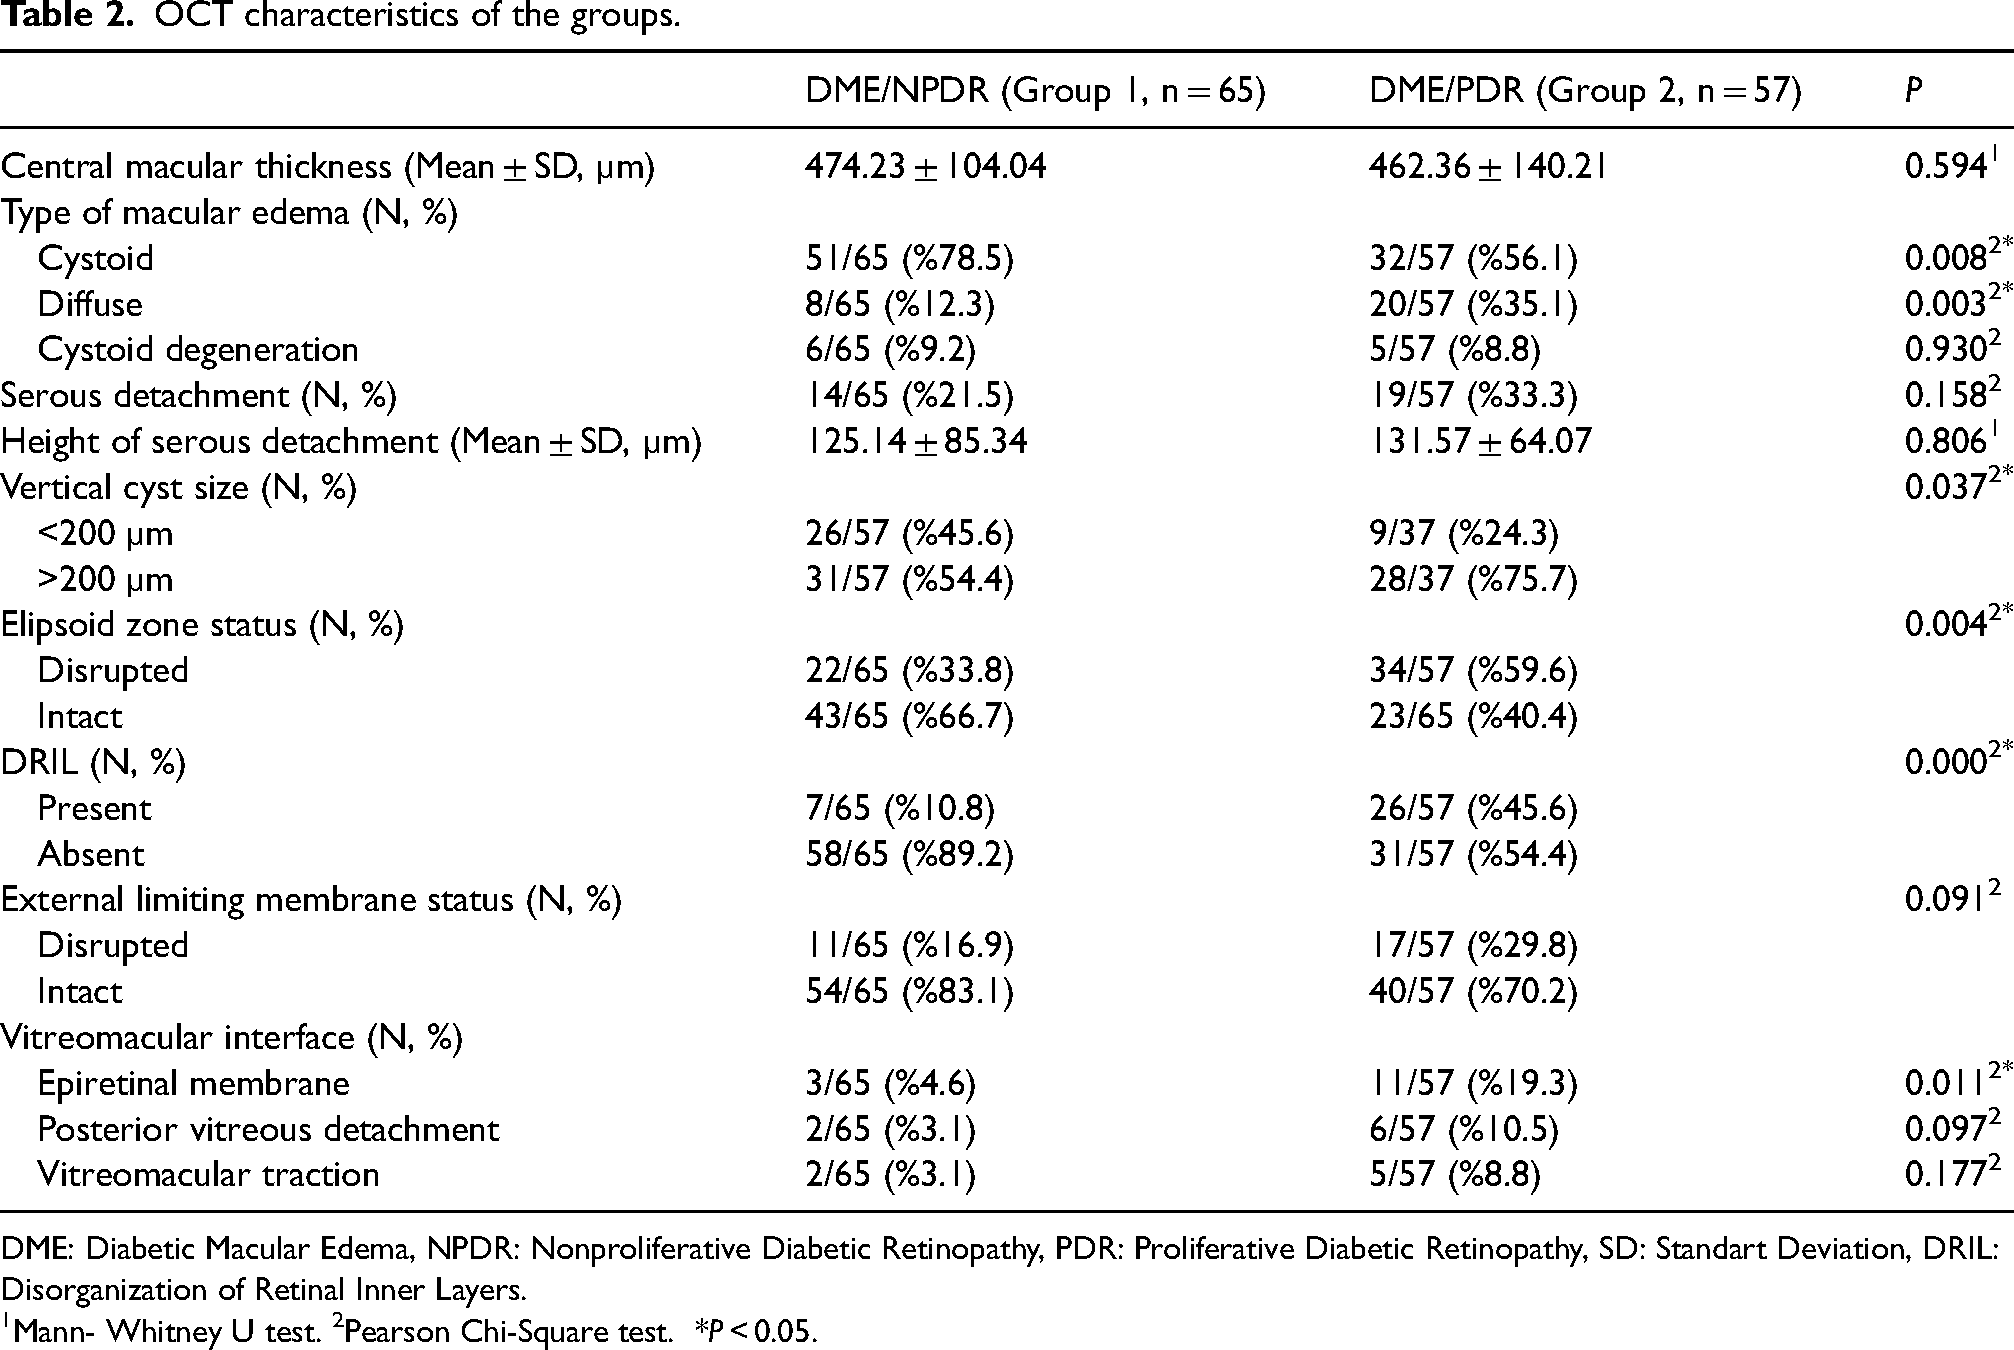
DME: Diabetic Macular Edema, NPDR: Nonproliferative Diabetic Retinopathy, PDR: Proliferative Diabetic Retinopathy, SD: Standart Deviation, DRIL: Disorganization of Retinal Inner Layers.
Mann- Whitney U test. 2Pearson Chi-Square test. *P < 0.05.
Mean retinal and choroidal thickness of the groups (ETDRS grid cells).
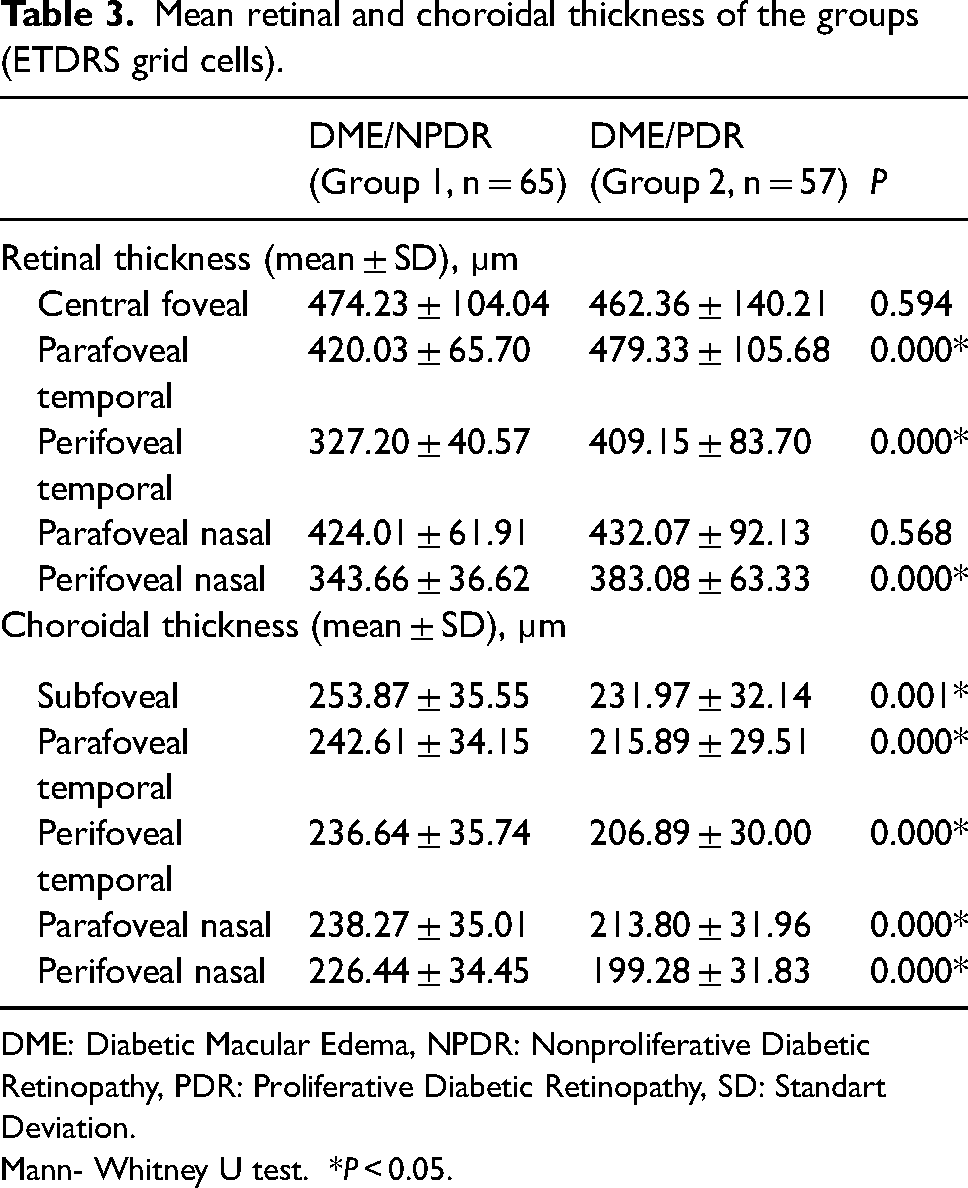
DME: Diabetic Macular Edema, NPDR: Nonproliferative Diabetic Retinopathy, PDR: Proliferative Diabetic Retinopathy, SD: Standart Deviation.
Mann- Whitney U test. *P < 0.05.
FFA and ischemia
Macular ischemia was more prominent in FFA’s of patients with PDR (%59.6) than those with NPDR (%33.8) (p = 0.004). There was a very strong correlation between the presence of ischemia on FFA and EZ disruption (r(122) = 0.802, p < 0.000), and a strong correlation between the presence of ischemia on FFA and DRIL (r(122) = 0.661, p < 0.000).
Discussion
FFA has been widely used for the diagnosis and staging of diabetic retinopathy, as well as for the detection of macular and peripheral leakage and non-perfusion areas. However, it is restrictive in evaluating the morphological characteristics of the macula in detail. It only allows the determination of the type of macular leakage (diffuse or focal), and the status of the foveal avascular zone (presence of macular ischemia).13–15 On the other hand, OCT is a non-invasive imaging modality that is used for the detailed examination of the retina and choroid in vivo. Recently, the development of new OCT devices, such as spectral-domain and swept-source OCT, has allowed better visualization of the macular anatomy. For this reason, OCT has become a novel imaging modality to assess macula both quantitatively and qualitatively in DME. 16
DME can develop at any stage of DR. The prevalence increases with the duration and severity of DR. 1 Previous studies claimed that the severity of macular edema was associated with the extent of macular and peripheral ischemia and that the severity of macular edema increases with the severity of DR.17,18 On the other hand, Sim et al. investigated retinal ischemia with ultra-widefield fluorescein angiography and reported that there was no relationship between peripheral retinal ischemia and CMT. 19 Rabiolo et al. studied the correlation between FAZ area measured by OCTA and peripheral ischemic index measured by UWF fluorescein angiography and reported a positive correlation between the two entities. However, they also reported that the FAZ area did not correlate to CMT. 20 Chatziralli et al. evaluated OCT findings of macular edema secondary to NPDR and PDR and found that patients with DME and PDR had higher central retinal thicknesses than patients with DME and NPDR. While patients with DME and PDR presented with the diffuse type of macular edema, patients with NPDR presented with cystoid type more predominantly with more peripheral extension outside the fovea. 21 In our study, CMT did not differ between the patients with PDR (an indirect indicator of increased peripheral ischemia) and NPDR but we observed that the diffuse type of macular edema with more peripheral extension was more prominent in eyes with PDR. Similarly, Yalcın et al. showed that diffuse thickening of the retina and extrafoveal extension increased with the presence and severity of peripheral retinal ischemia. Advanced retinopathy was responsible for the development and progression of diffuse diabetic macular edema. 22 The link between macular edema and peripheral ischemia has not been clarified due to conflicting results. However, diffuse thickening with para and perifoveal extension may be explained by increased anti-vascular endothelial factor levels due to the presence of larger peripheral ischemic areas in patients with PDR.
Besides CMT and type of macular edema, our study focused on other OCT biomarkers such as intraretinal cyst characteristics, the integrity of outer retinal membranes, choroidal thicknesses, and their relationships with macular ischemia. Patients with PDR showed an increased size of the cysts, higher rate of impairment of EZ, more prominent DRIL, and decreased choroidal thickness correlated with macular ischemia on FFA, which were accompanied by lower visual acuity at presentation than patients with NPDR. ERM was also more common in patients with PDR.
Elevated VEGF levels in DR lead to extravasation of fluid into the extracellular space and consequently, cyst formation occurs. The size of the cysts increases with the severity of macular ischemia and large cysts (>200 µm) have a negative impact on visual acuity.22,23 Larger cysts seen in patients with PDR in our study could be related to the presence of a higher rate of macular ischemia and longer duration of diabetes mellitus in patients with PDR. As the disease progresses, in the advanced stages of diabetic macular edema, larger cystoid spaces are formed as a result of the degeneration of Müller cells. 24 By the death of Müller cells, vertical septa disappear and cystoid spaces coalesce to form larger cystoid cavities called cystoid degeneration, which has a horizontal diameter greater than 600 µm. In our study, we evaluated only the vertical diameter of the cysts because the horizontal diameter is affected at the very late stages of macular edema, and we thought that patients presenting with macular edema either with PDR or NPDR may not have long-term macular edema. 25 Only 8.3% of patients with NPDR and 9.1% of patients with PDR presented with cystoid degeneration.
The inability to distinguish inner retinal layers is defined as DRIL. DRIL was found to be associated with a poor visual prognosis. 26 It has been correlated with macular ischemia, and the incidence of DRIL increases with the severity of DR. A higher rate of DRIL was seen in patients with PDR. Furthermore, DRIL was also found to be associated with the EZ and ELM disruption.27,28 In concordance with previous studies, patients with PDR presented with a higher rate of DRIL and EZ disruption associated with a higher rate of macular ischemia and poorer visual acuity than patients with NPDR. However, no difference was found by the means of the presence of ELM disruption between patients with PDR and NPDR. This finding may be related to a more difficult evaluation of ELM layer integrity than the EZ layer, especially in eyes with serous retinal detachment and larger cysts.
A previous study evaluated OCT findings of macular edema secondary to NPDR and PDR but did not analyze CT. 21 In our study, we also focused on CT changes in patients with treatment naïve diabetic macular edema secondary to both NPDR and PDR. There have been various and conflicting results regarding CT at different stages of DR. Kim et al. claimed that the subfoveal CT increased with the severity of DR. 29 However, Lains et al. evaluated CT of patients with no DRP, with NPDR, NPDR + DME, and PDR. Their results showed that macular CT was decreased in the proliferative stages of DR. 30 Ouerques et al. presented a reduced CT at the subfoveal, para, and perifoveal nasal, temporal, superior, and inferior quadrants in patients with DME compared to a healthy control group. 31 Wang et al. found that DR progression led to a reduction in CT and CT did not differ in patients with or without macular edema. 32 Similarly, in our study, patients with DME and PDR had lower CT than patients with DME and NPDR. We suggested that perfusion of the choriocapillaris could be decreased with an increase in DR severity along with higher choriocapillaris drop-out. Bartsch et al. showed in their study with indocyanine green angiography that greater delays in the choroidal vascular filling were associated with DR severity. 33
There are some limitations to the study. We used conventional FFA for the staging of DR. We created two groups, PDR, and NPDR, according to the presence or absence of neovascularization (an indirect indicator of retinal ischemia). Because these angiograms explore only 30°_50° at once, more periphery of the retina cannot be visualized properly, and evaluation of peripheral ischemia is more difficult. It would be more accurate to use ultra-widefield angiography so that we could stage DR as mild, moderate, severe NPDR, and PDR and show their relation between OCT parameters and ischemia in a detailed manner. Another limitation was the lack of knowledge about the duration of macular edema because they were not followed-up patients, and OCT measurements were performed at the first presentation due to the evaluation of the macula before any treatment. Assessment of outer retinal layers, especially ELM, was difficult because of some large cysts and serous retinal detachments.
It was also difficult to determine that these biomarkers were solely associated with diabetic retinopathy stage. However, a correlation would be expected between peripheral and macular ischemia as they share a common pathogenic mechanism which is capillary non-perfusion. 34 So macular ischemia could be a conclusive factor for the differences in OCT biomarkers in patients with NPDR and PDR. Previous studies showed the relation between OCT characteristics and macular ischemia.35,36 In our study, macular ischemia was more prominent in patients with PDR. Therefore the morphologic differences in OCT might have been related to macular ischemia. These OCT biomarkers might give an idea about the severity of diabetic retinopathy indirectly and guide the physician for more detailed investigation of diabetic retinopathy.
In conclusion, our study focused on the difference in OCT biomarkers of DME in patients with NPDR and PDR. CMT did not differ according to the severity of retinopathy. Diffuse macular edema was more prominent in patients with macular edema and PDR. Larger cysts, disruption of the ellipsoid zone, DRIL, and ERM were present in DME with PDR in a higher percentage than in DME with NPDR along with a higher percentage of macular ischemia and lower visual acuity. OCT characteristics at presentation may be a guide for evaluating diabetic retinopathy severity.
Footnotes
Author’s contributions
Esra Turkseven Kumral: definition of intellectual content, design, literature search, data acquisition, data analysis, manuscript preparation, manuscript editing, and manuscript review. Nimet Yesim Ercalik: data acquisition, statistical analysis, manuscript preparation. Oksan Alpogan: literature search, data acquisition. Nursal Melda Yenerel: manuscript editing and manuscript review. Alev Ozcelik Kose: literature search, data acquisition. Yucel Ozturk: data acquisition, statistical analysis. Zeynep Ayse Acar: data acquisition, data analysis
Consent to participate
Informed consent was obtained from all individual participants included in the study.
Consent to publish
Patients signed informed consent regarding publishing their data and photographs.
Declaration of conflicting interests
The author(s) declared no potential conflicts of interest with respect to the research, authorship, and/or publication of this article.
Funding
The author(s) received no financial support for the research, authorship, and/or publication of this article.
Ethics approval
All procedures performed in studies involving human participants were under the ethical standards of the institutional and/or national research committee and in concordance with the 1964 Helsinki Declaration and its later amendments or comparable ethical standards. The study was approved by the Institutional Review Board of Haydarpasa Numune Training and Research Hospital.