
Abstract
Objective
To evaluate the macular microvascular changes using optical coherence tomographic angiography (OCT-A) in children with unilateral amblyopia and their reversibility during treatment.
Methods
Patients with unilateral strabismic or anisometropic amblyopia or residual amblyopia from early congenital cataract surgery, examined between October 2019 and March 2021, were included. Vessel density and perfusion density in the superficial capillary plexus and area, perimeter and circularity of the foveal avascular zone (FAZ) were analysed using OCT-A in amblyopic eyes, contralateral eyes and control group healthy eyes. Correlation analyses between the microvascular parameters and the visual acuity were performed. In a pilot study on a few patients from the amblyopic cohort, longitudinal follow-up during treatment was also performed.
Results
A total of 128 eyes of 64 patients were included: 32 amblyopic eyes compared with 32 contralateral eyes and 64 control eyes. Vessel density and perfusion density in the superficial capillary plexus were significantly lower in amblyopic eyes compared to control eyes in 6 × 6 mm (p < 0.02) and 3 × 3 mm (p < 0.01) scans. Correlation analyses showed a linear decrease in vessel density and perfusion density with decreasing visual acuity. The microvascular changes observed were reversible with the occlusion treatment of amblyopia (p < 0.001).
Conclusions
The study found a decrease in vessel density and perfusion density in the macula of children with unilateral functional amblyopia. These microvascular changes were correlated with visual acuity and appeared to be reversible with treatment of amblyopia. On the whole, OCT-A appears to be a relevant complementary examination when it comes to diagnosing and monitoring functional amblyopia.
Introduction
Amblyopia can be defined as a uni- or bilateral deficiency of certain visual skills, leading to a disorder affecting the maturation of the cerebral structures involved in the various vision-related functions in children. Amblyopia is the most common cause of unilateral visual impairment in children. 1 It is irreversible unless treated.2,3
OCT-A is a non-invasive imaging method for in vivo analysis of retinal microvascularisation. To date, the link between retinal microvascularisation and amblyopia has not been clearly established. Some studies have found a decrease in the area of the foveal avascular zone4,5 and a decrease in macular vascular density4,6–8 in amblyopic patients. Others have not revealed any significant difference.8–10 Furthermore, the monitoring of retinal microvascularisation evolution over the course of treatment for amblyopia has not yet been evaluated.
The purpose of the present study was to compare the OCT-A macular microvascular parameters in children with unilateral functional amblyopia with those of healthy patients and to study the reversibility of any abnormalities identified, during the treatment of amblyopia by occlusion.
Materials and methods
This observational, comparative, single-centre study was conducted at the Ophthalmology Department of Strasbourg University Hospital Centre between October 2019 and March 2021 in accordance with the tenets of the Declaration of Helsinki. It was approved by the local ethics committee. All patients, or their legal representatives, signed a consent form prior to inclusion in the study.
Study population
Patients with unilateral strabismic or anisometropic amblyopia or residual amblyopia from early congenital cataract surgery were included. Unilateral amblyopia was defined by a difference in best-corrected visual acuity (BCVA) between the two eyes that was strictly greater than one logarithmic VA line. 11
The control group consisted of patients presenting for a routine eye examination with no ocular or systemic diseases, no refractive spherical or cylindrical error >1 D, a BCVA of 0 LogMAR in both eyes, and normal anterior and posterior segment on clinical examination.
Exclusion criteria for all groups were the presence of an anterior or posterior segment pathology with altered media transparency (corneal damage, cataract, intraocular inflammation, retinal pathologies, etc.). Patients with a history of prematurity or a neurological or systemic pathology (diabetes, hypertension, cardiovascular or renal diseases) that could damage the vascular system were also excluded, along with patients who were unable to maintain the appropriate position or fixation on a specific target (poor vision, nystagmus or lack of cooperation).
Study criteria
Demographic data including age at the time of inclusion, sex, and medical history were collected for all the patients included in the study.
A bilateral comparative ophthalmologic examination was performed on all patients at the point of inclusion. This included BCVA, cycloplegic refraction (0.5% cyclopentolate or atropine), ocular motility tests, anterior and posterior segment examination and axial length measurement (Optical Biometer, OA-2000, Tomey).
OCT-A: recording of microvascular parameters
An OCT-A was performed on all patients using the CIRRUS™ HD-OCT 5000 AngioPlex (Carl Zeiss, Meditec Inc., California). Macular 3 × 3-mm and 6 × 6-mm scans were obtained for each eye. Each scan was automatically segmented by the software to visualize the superficial capillary plexus (SCP), with an inner boundary at the level of the inner limiting membrane and an outer boundary at the level of the inner plexiform layer (Figure 1).
The OCT-A signal was systematically compared with the en face OCT reconstruction and the acquisition process repeated if there were significant artefacts that might affect the signal. All scans were examined for segmentation and signal quality and any poor-quality images, as determined by a signal strength of <8, or any containing motion artefacts or segmentation errors excluded from the analysis.
Quantification of retinal microvascularisation
Two indices of vascular density were analysed in the SCP for each eye, based on whether or not they were dependent upon vessel thickness: vessel density (VD, mm−1) and perfusion density (PD, unitless). These macular scan parameters were calculated by the Angioplex Metrix separately for the fovea and the parafovea, in nine subfields in a 6 × 6-mm window and five subfields in a 3 × 3 mm window, based on the Early Treatment Diabetic Retinopathy Study (ETDRS) grid (Figure 2). The foveal region is a disk-shaped region of 1 mm diameter centered on the fovea (C). The inner parafoveal region is an annulus centered on the fovea with inner 1 mm diameter and outer 3 mm diameter. It is divided in 4 inner quadrants: superior (S1), inferior (I1), temporal (T1 in right eye), nasal (I1 in right eye). The outer parafoveal region is an annulus centered on the fovea with inner 3 mm diameter and outer 6 mm diameter. It is divided in 4 outer quadrants: superior (S2), inferior (I2), temporal (T2 in right eye), nasal (I2 in right eye).
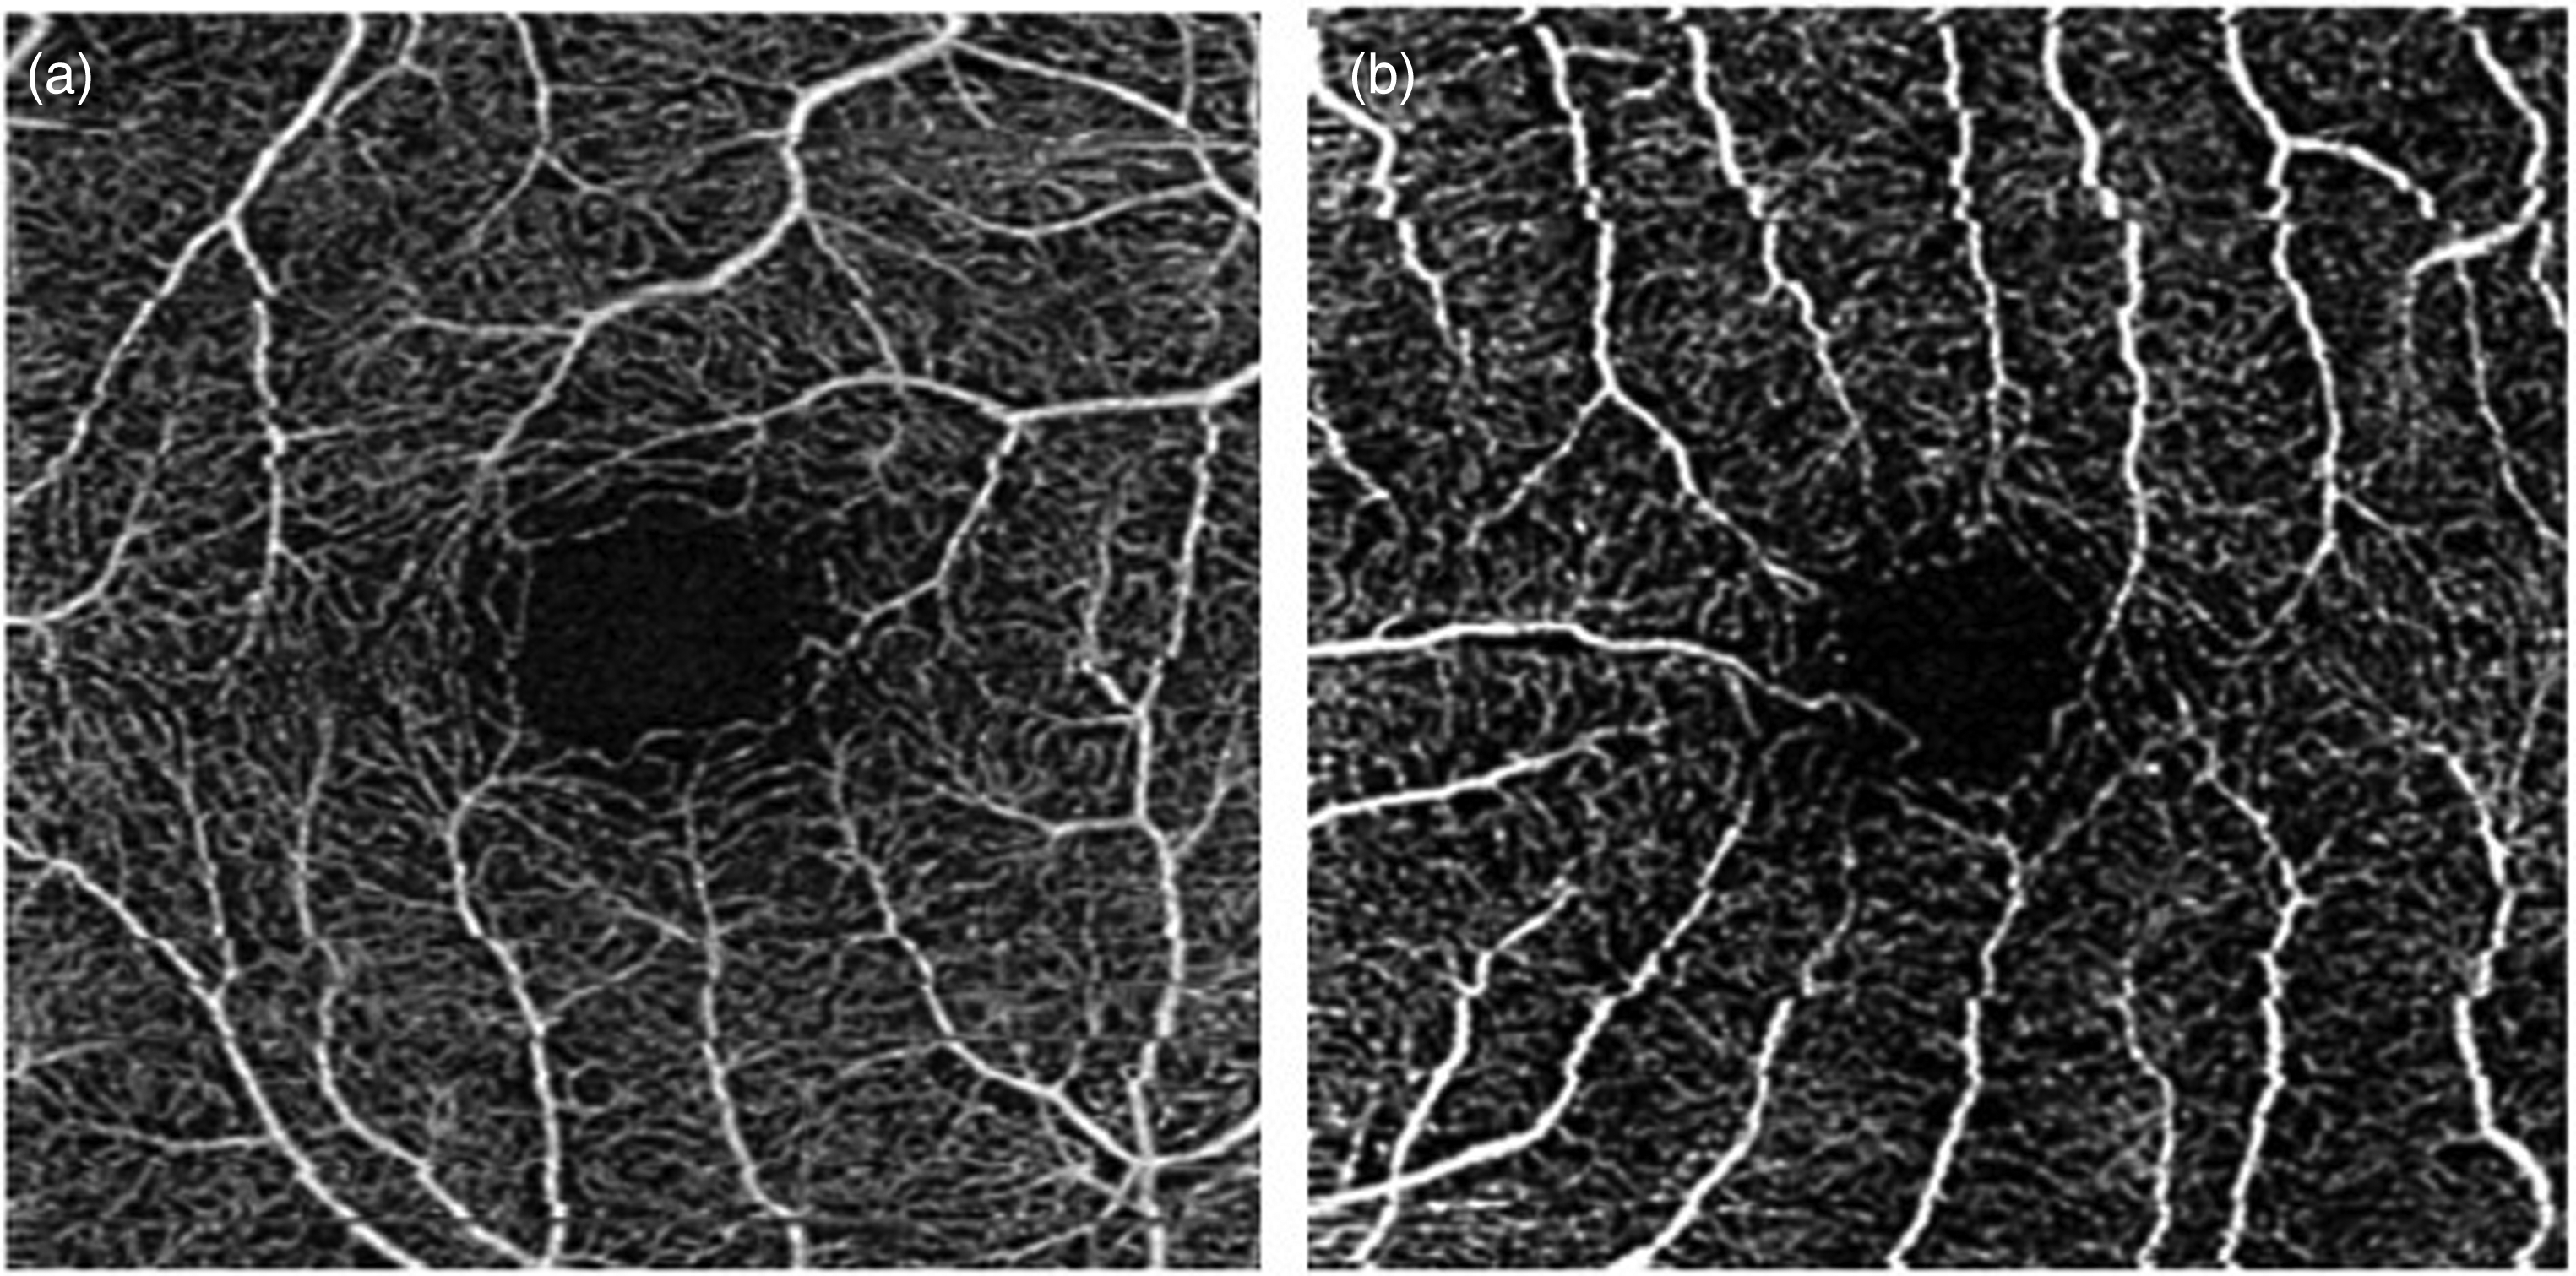
Example of Coherence Tomography Angiography (OCT-A) 3 × 3 mm macular scans of the superficial capillary plexus from a control eye (a) and an amblyopic eye (b).
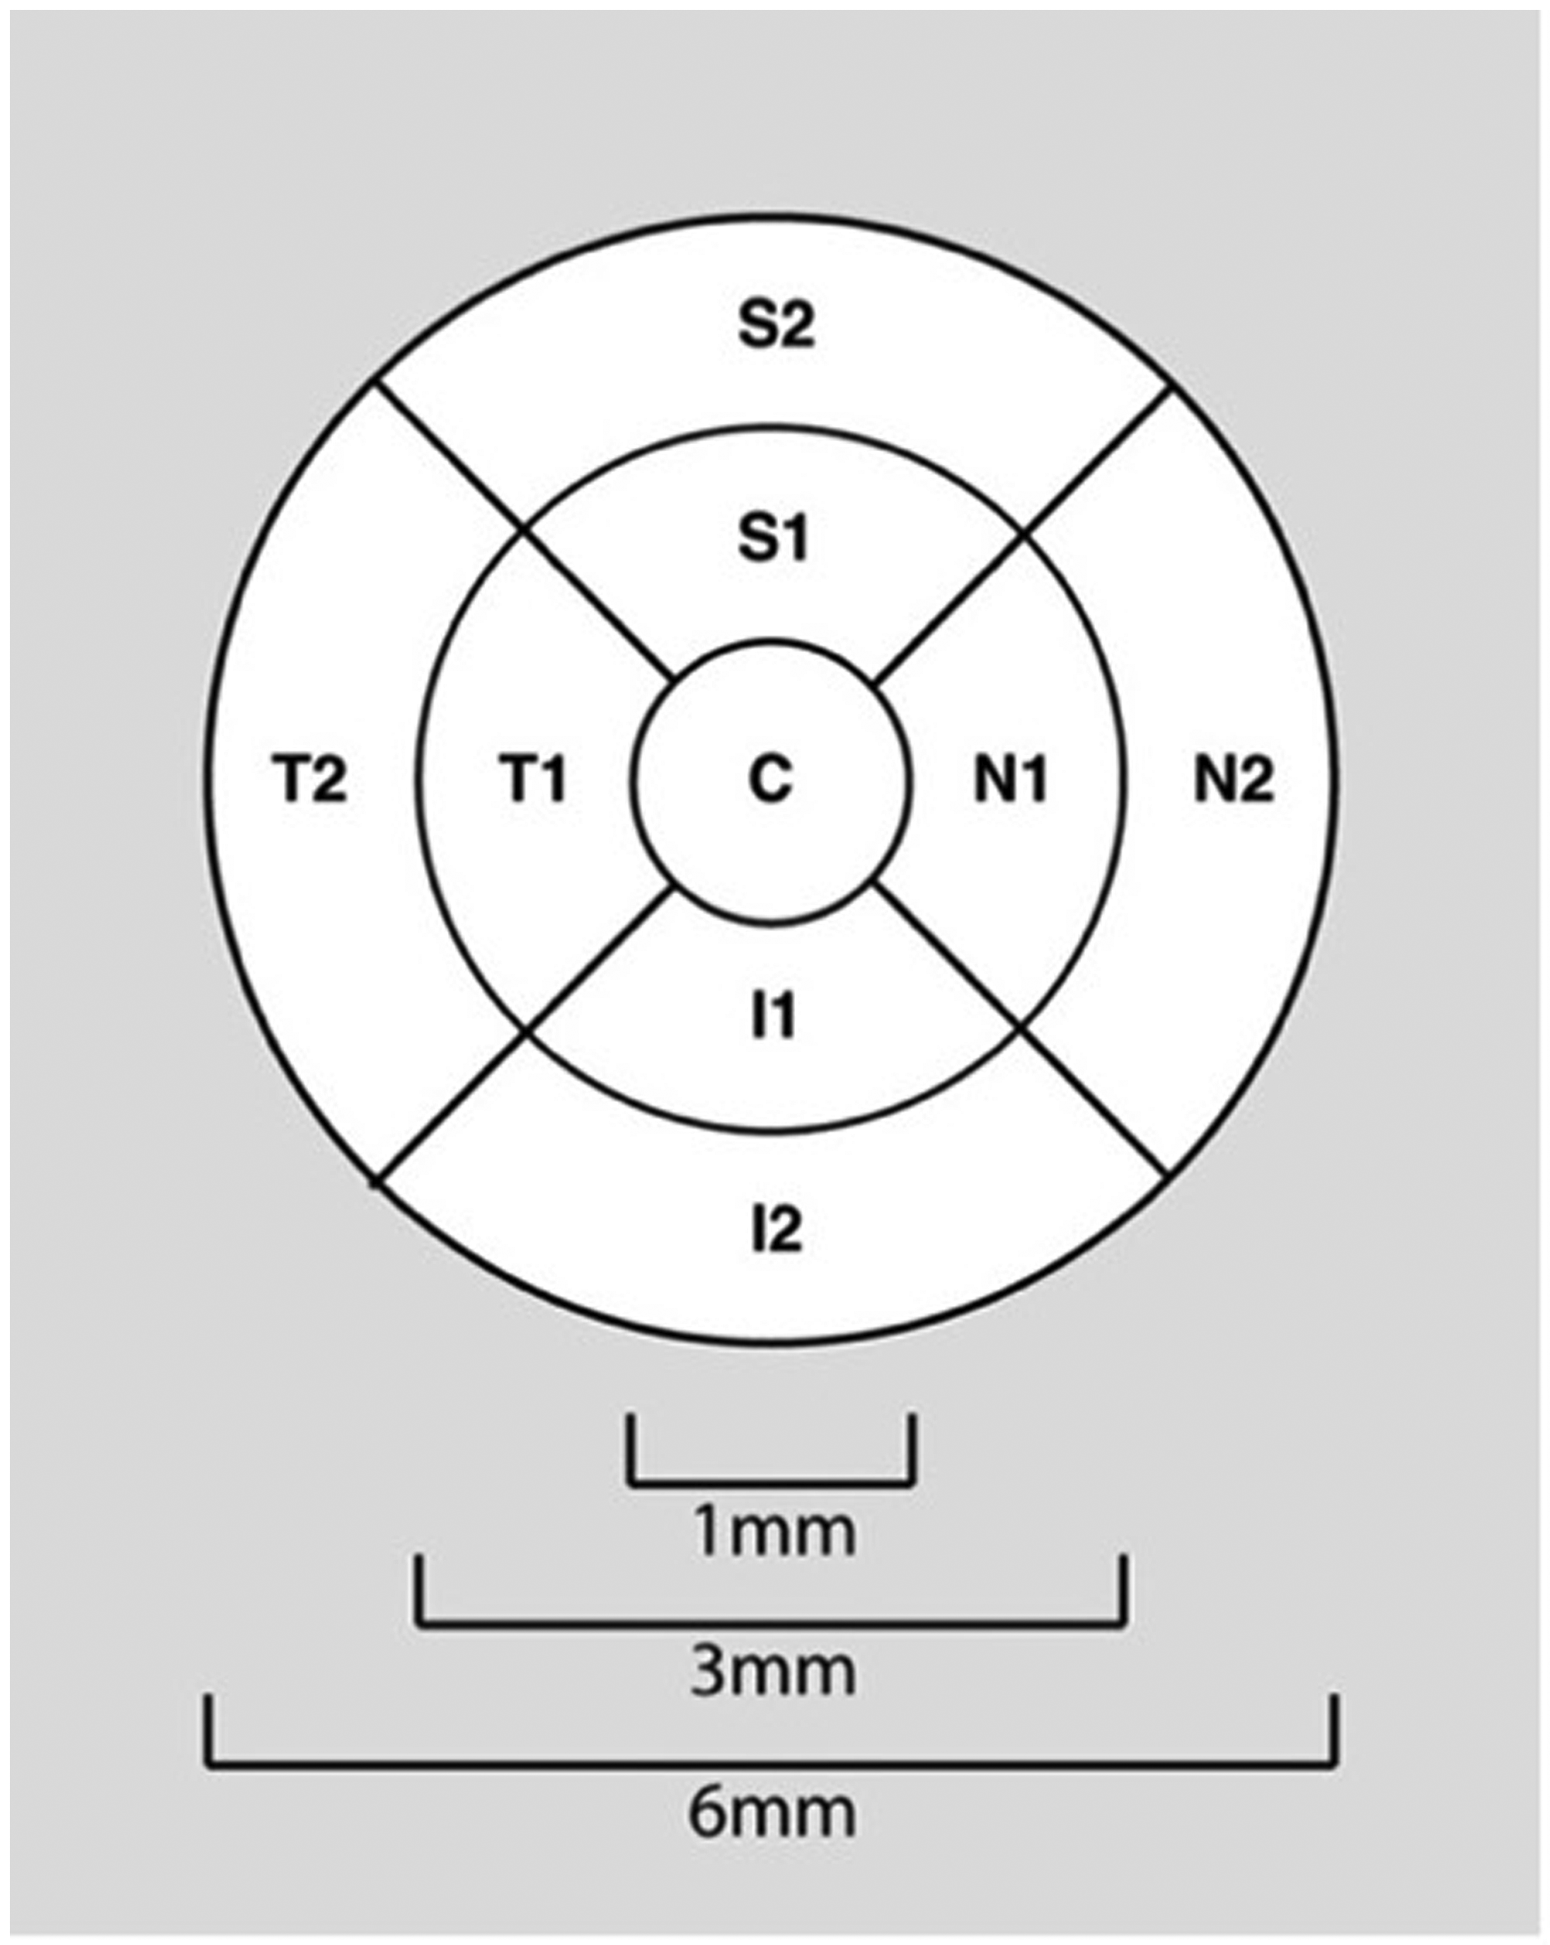
ETDRS grid.
Three foveal avascular zone (FAZ) parameters were also studied: area (mm2), perimeter (mm) and circularity (unitless).
Three comparisons were performed: amblyopic eye versus control eye, amblyopic eye versus contralateral eye, and contralateral eye versus control eye.
Given that the Angioplex Metrix is not currently able to analyse microvascular parameters in the deep capillary plexus (DCP), these data were not evaluated.
Patients from the amblyopic group who were undergoing occlusion therapy were longitudinally followed-up.
Statistical analysis
Statistical analyses were performed using the SPSS software (version 26.0; SPSS Inc, Chicago, IL, USA). Quantitative variables were expressed as means and standard deviations and categorical variables as percentages. The decimal VA was converted to LogMAR for analysis. t- and χ2 tests were used to compare age, sex, VA, spherical equivalent (SE) and axial length (AL) between groups. Unpaired t-tests were used to compare microvascular parameters between the amblyopic patient group and the healthy subject group, with adjustments for age, sex, SE and AL. Wilcoxon signed-rank tests were performed to compare the microvascular parameters of the amblyopic eye and the contralateral eye in the amblyopic group. Correlation analyses between the different microvascular parameters (VD, PD, FAZ) and the VA were performed by calculating Pearson correlation coefficients (r). Changes in microvascular parameters over the course of occlusion therapy were assessed by means of paired t-tests. An assessment of interobserver reproducibility was performed by two experienced operators based on 112 microvascular parameters (vascularisation, perfusion, FAZ) in 2 patients at random. For each analysis, a p-value <0.05 was considered statistically significant.
Results
Demographic data, visual acuity, refraction and axial length
A total of 128 eyes of 64 patients were included (32 patients with unilateral amblyopia and 32 control subjects). The amblyopic group consisted of 16 patients with strabismic amblyopia, 14 patients with anisometropic amblyopia and 2 patients with residual amblyopia from early congenital cataract surgery.
Patient data on age, sex, VA, SE and AL are shown in Table 1. The mean age was 9.8 ± 6.5 years in the amblyopic group and 10.9 ± 4.9 years in the control group. No significant difference in age (p = 0.45) and sex (p = 0.41) were detected among groups. BCVA was significantly lower for amblyopic eyes (AEs) compared to contralateral eyes (CEs) and control group (CG) eyes (p < 0.001). SE was significantly higher in the amblyopic group (AEs and CEs) compared to the control group (AEs vs. CG, p = 0.003; CEs vs. CG, p = 0.01). Eyes in the amblyopic group had significantly lower ALs than those in the control group (AEs vs. CG, p < 0.001; CEs vs. CG, p = 0.002). There was no significant difference in terms of SE (p = 0.22) or AL (p = 0.43) between AEs and CEs.
Demographics, visual acuity, refraction, and axial lengths.
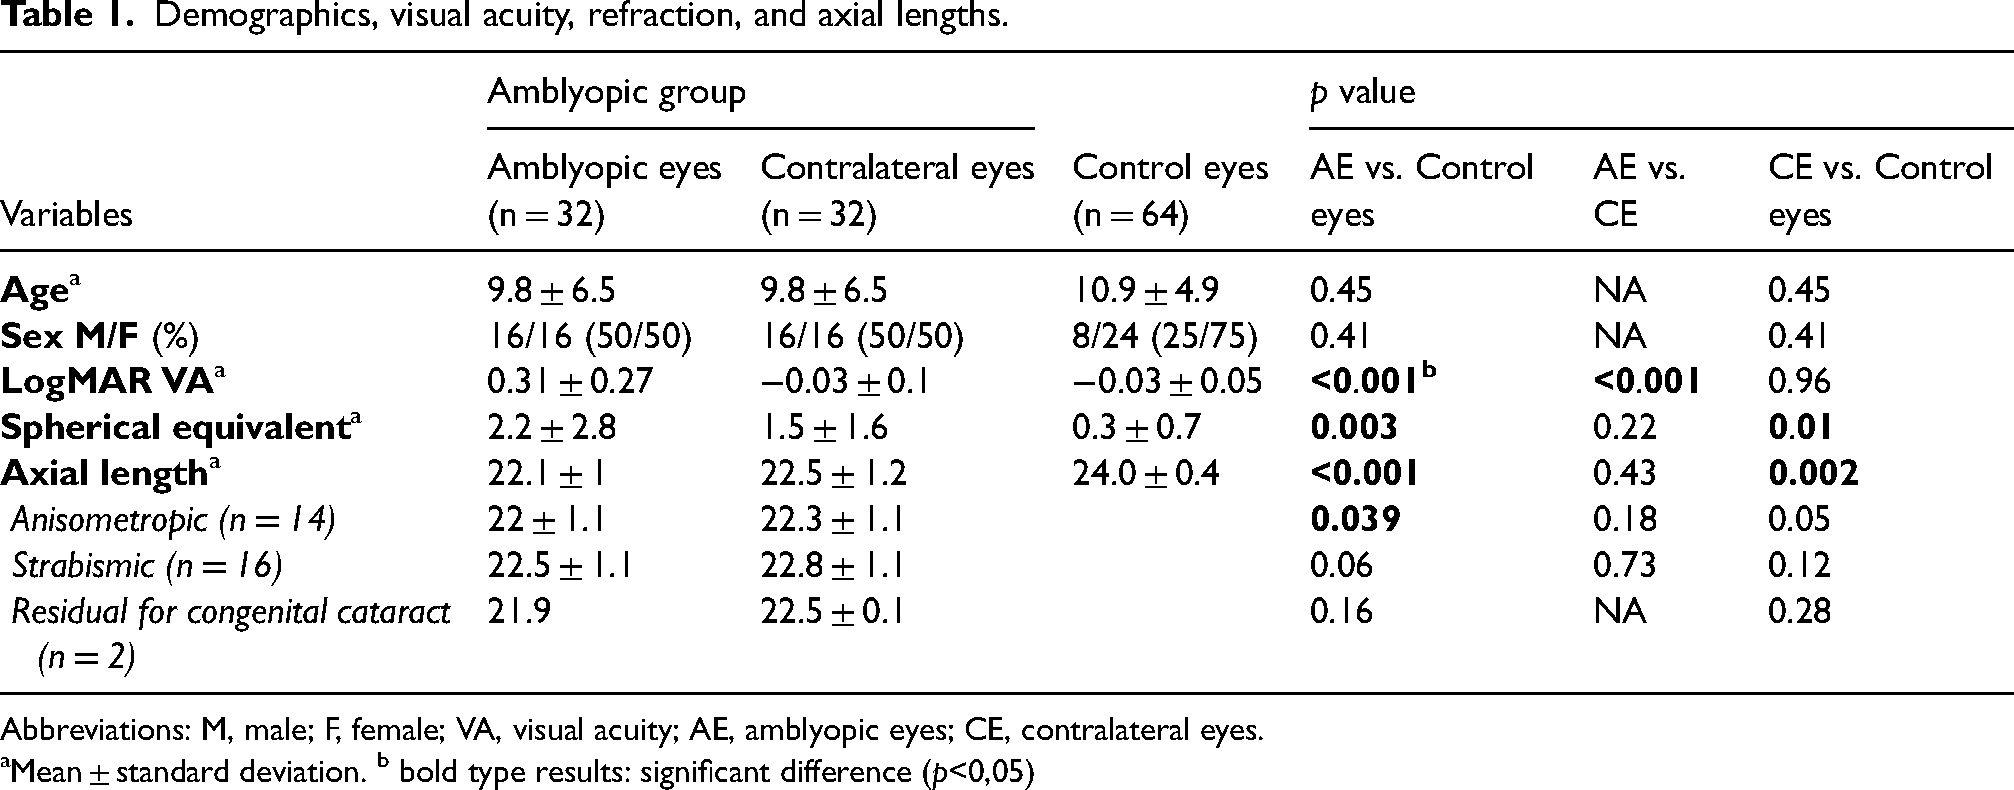
Abbreviations: M, male; F, female; VA, visual acuity; AE, amblyopic eyes; CE, contralateral eyes.
Mean ± standard deviation. b bold type results: significant difference (p<0,05)
Amblyopia and microvascular parameters
A comparison of the 6 × 6 mm OCT-A values showed that VD (p: 0.001 to 0.04 for inner, outer and total densities and in all quadrants except for T) and PD (p: 0.004 to 0.02 for inner, outer and total densities and in all quadrants except for T) were significantly lower in AEs compared to CG eyes (Table 2). No stastitically significant differences were observed for VD or PD in the central zone (p: 0.20 to 0.25). With regard to the FAZ, circularity was significantly lower in the amblyopic group (0.66 ± 0.1 vs 0.72 ± 0.1; p = 0.01). However, there was no significant difference in terms of perimeter (p = 0.75) or area (p = 0.82). A comparison of the AEs with the CEs revealed lower values for all vascular parameters (CD, PD and FAZ), but these results did not appear to be statistically significant. Regarding the comparison between the CEs of the amblyopic patients and the CG, most parameters were not significant. The 3 × 3-mm OCT-A results were superposable on the whole (Table 3).
Microvascular parameters in 6 × 6 mm OCT-A macular scans.
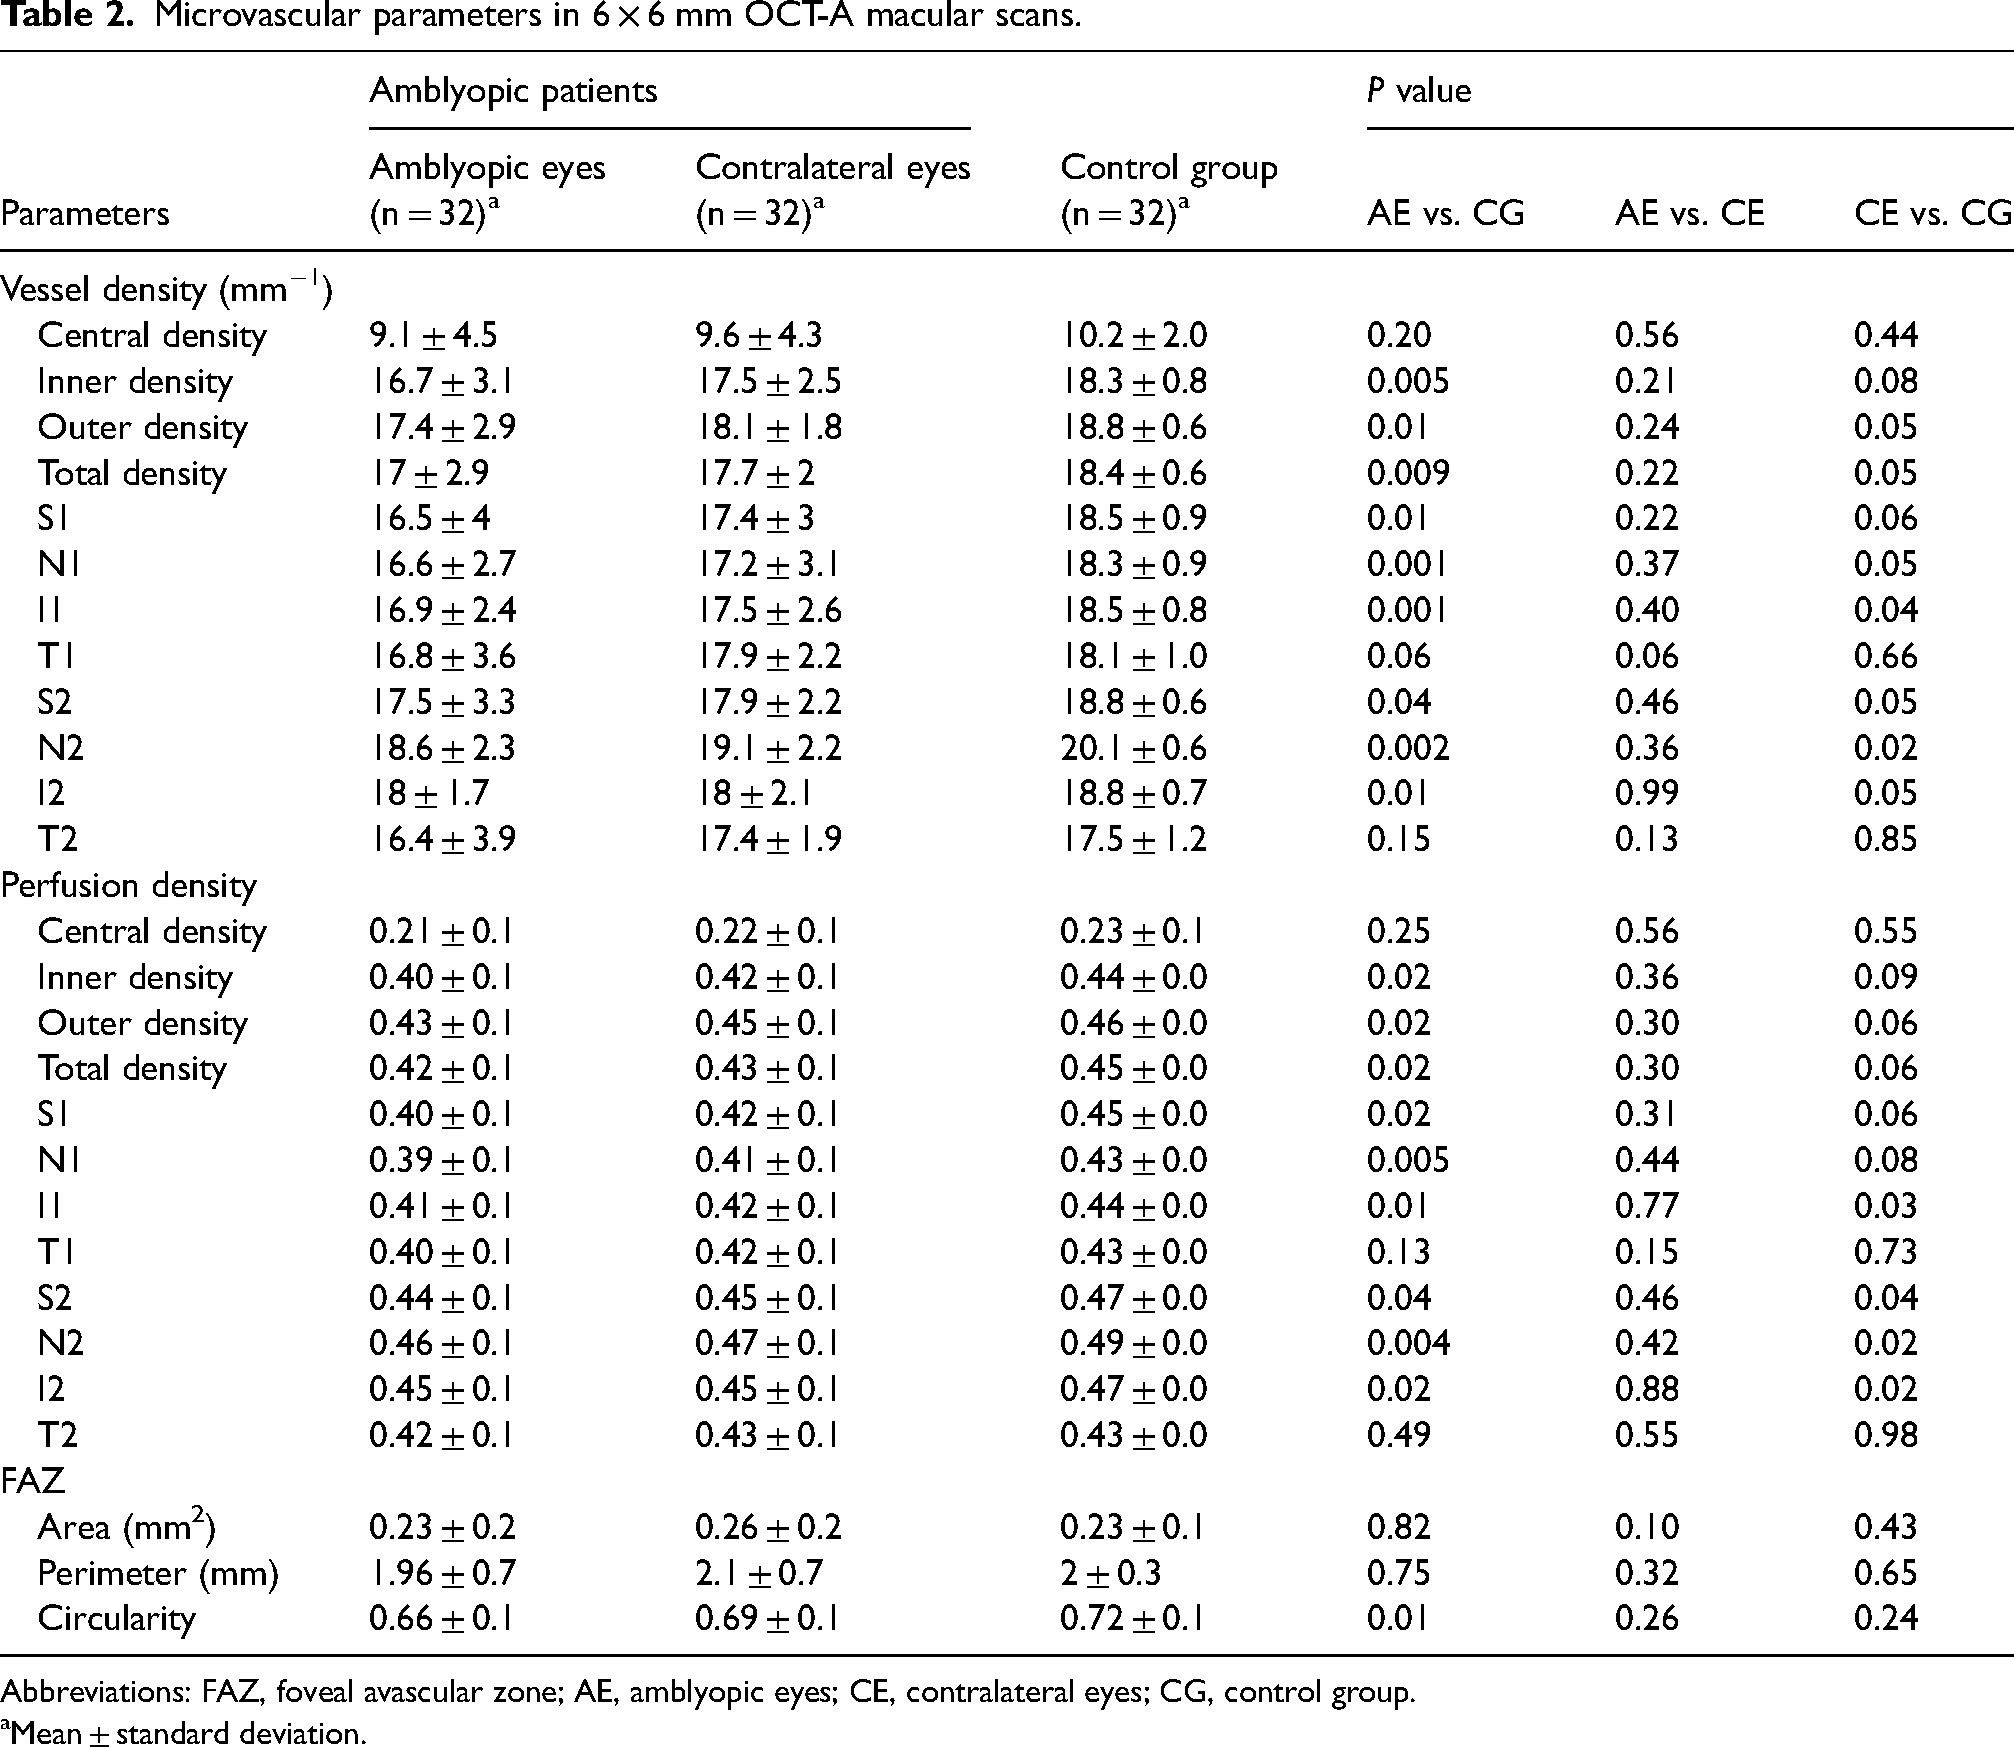
Abbreviations: FAZ, foveal avascular zone; AE, amblyopic eyes; CE, contralateral eyes; CG, control group.
Mean ± standard deviation.
Microvascular parameters in 3 × 3 mm OCT-A macular scans.
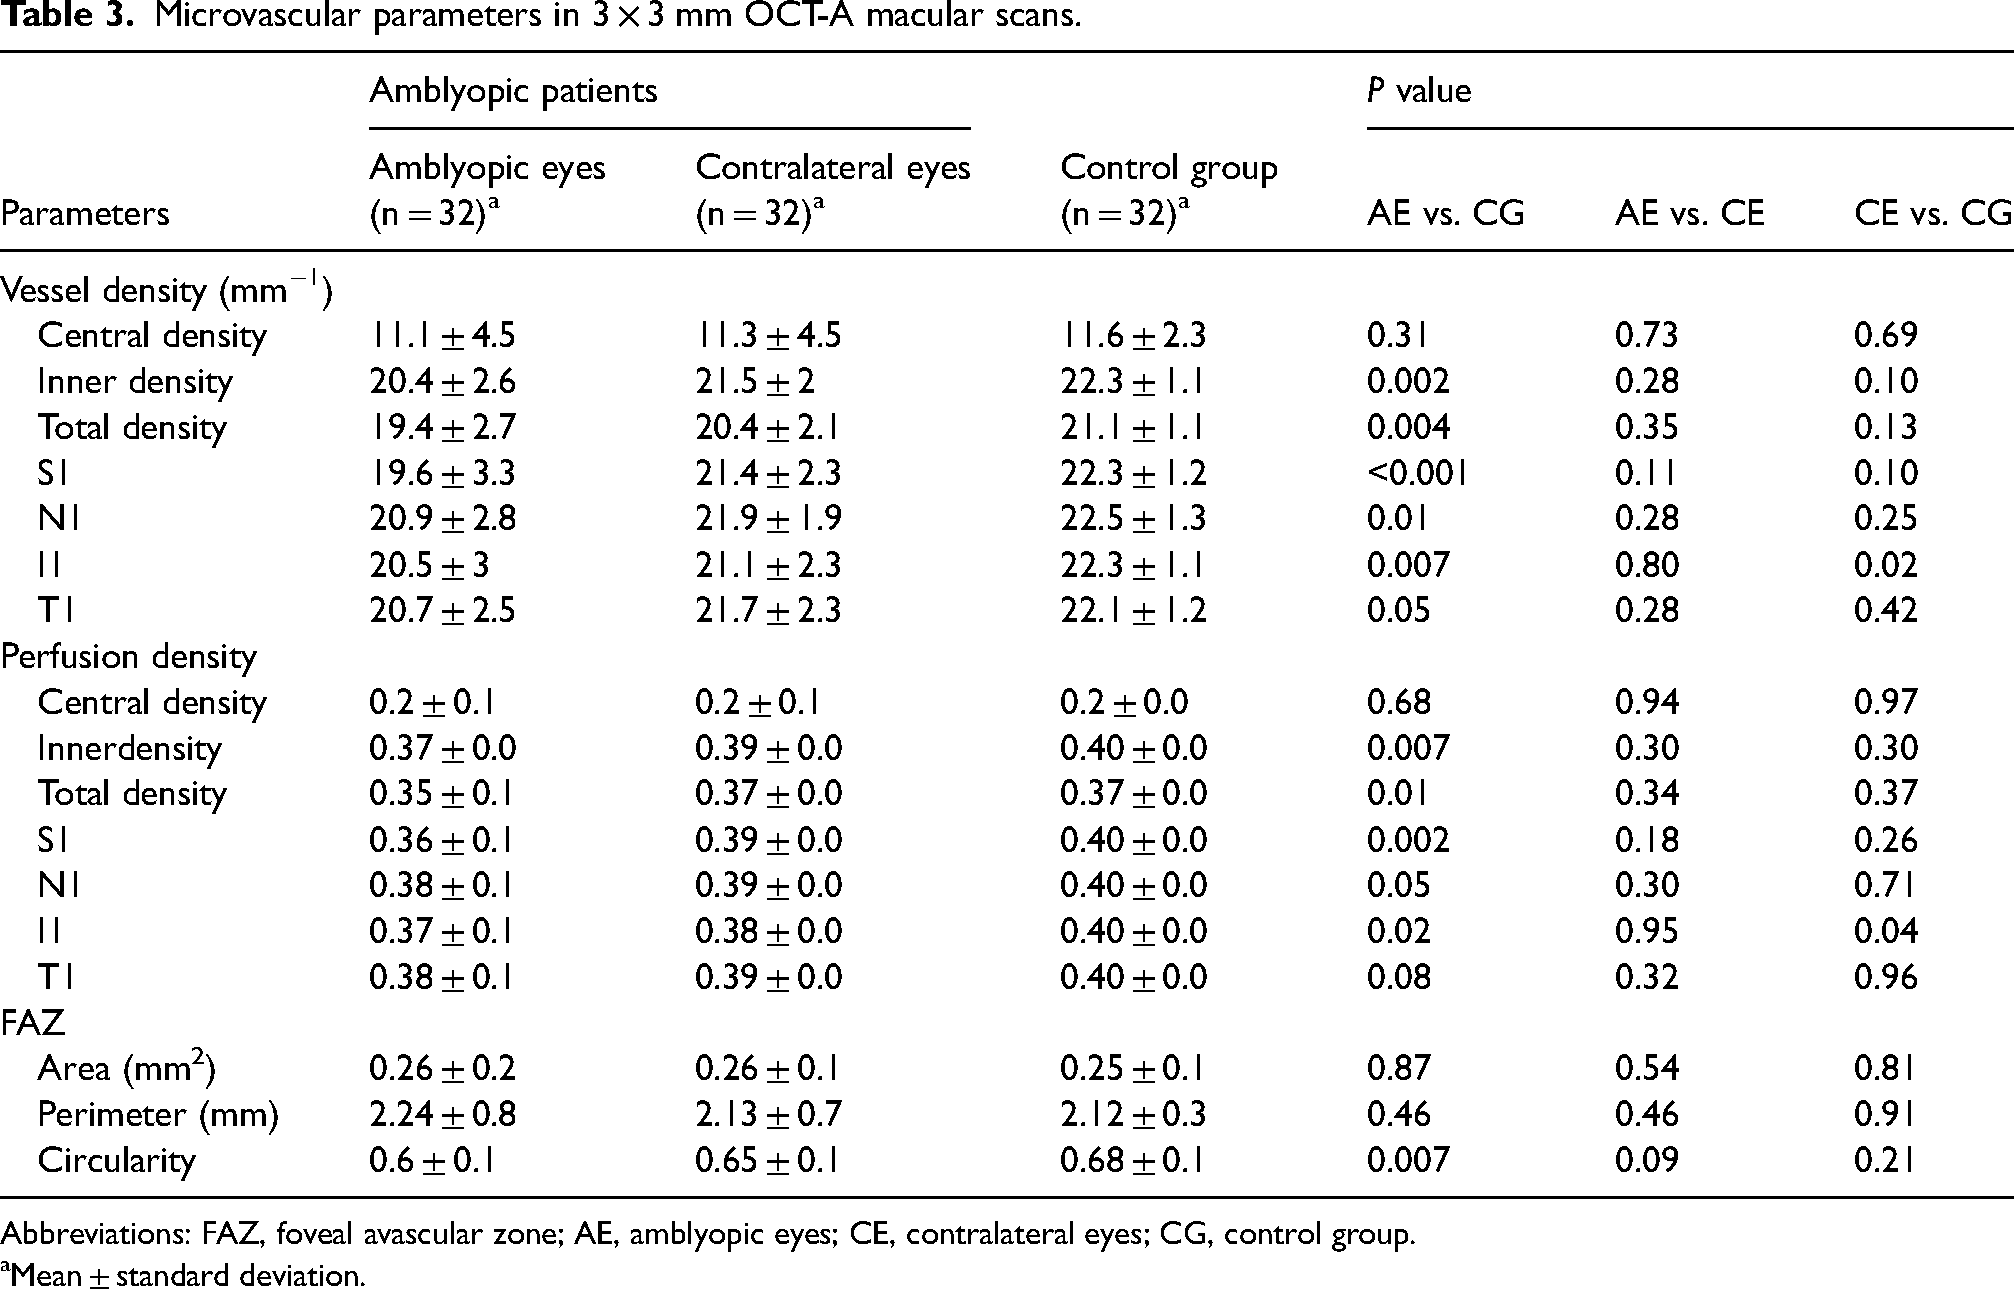
Abbreviations: FAZ, foveal avascular zone; AE, amblyopic eyes; CE, contralateral eyes; CG, control group.
Mean ± standard deviation.
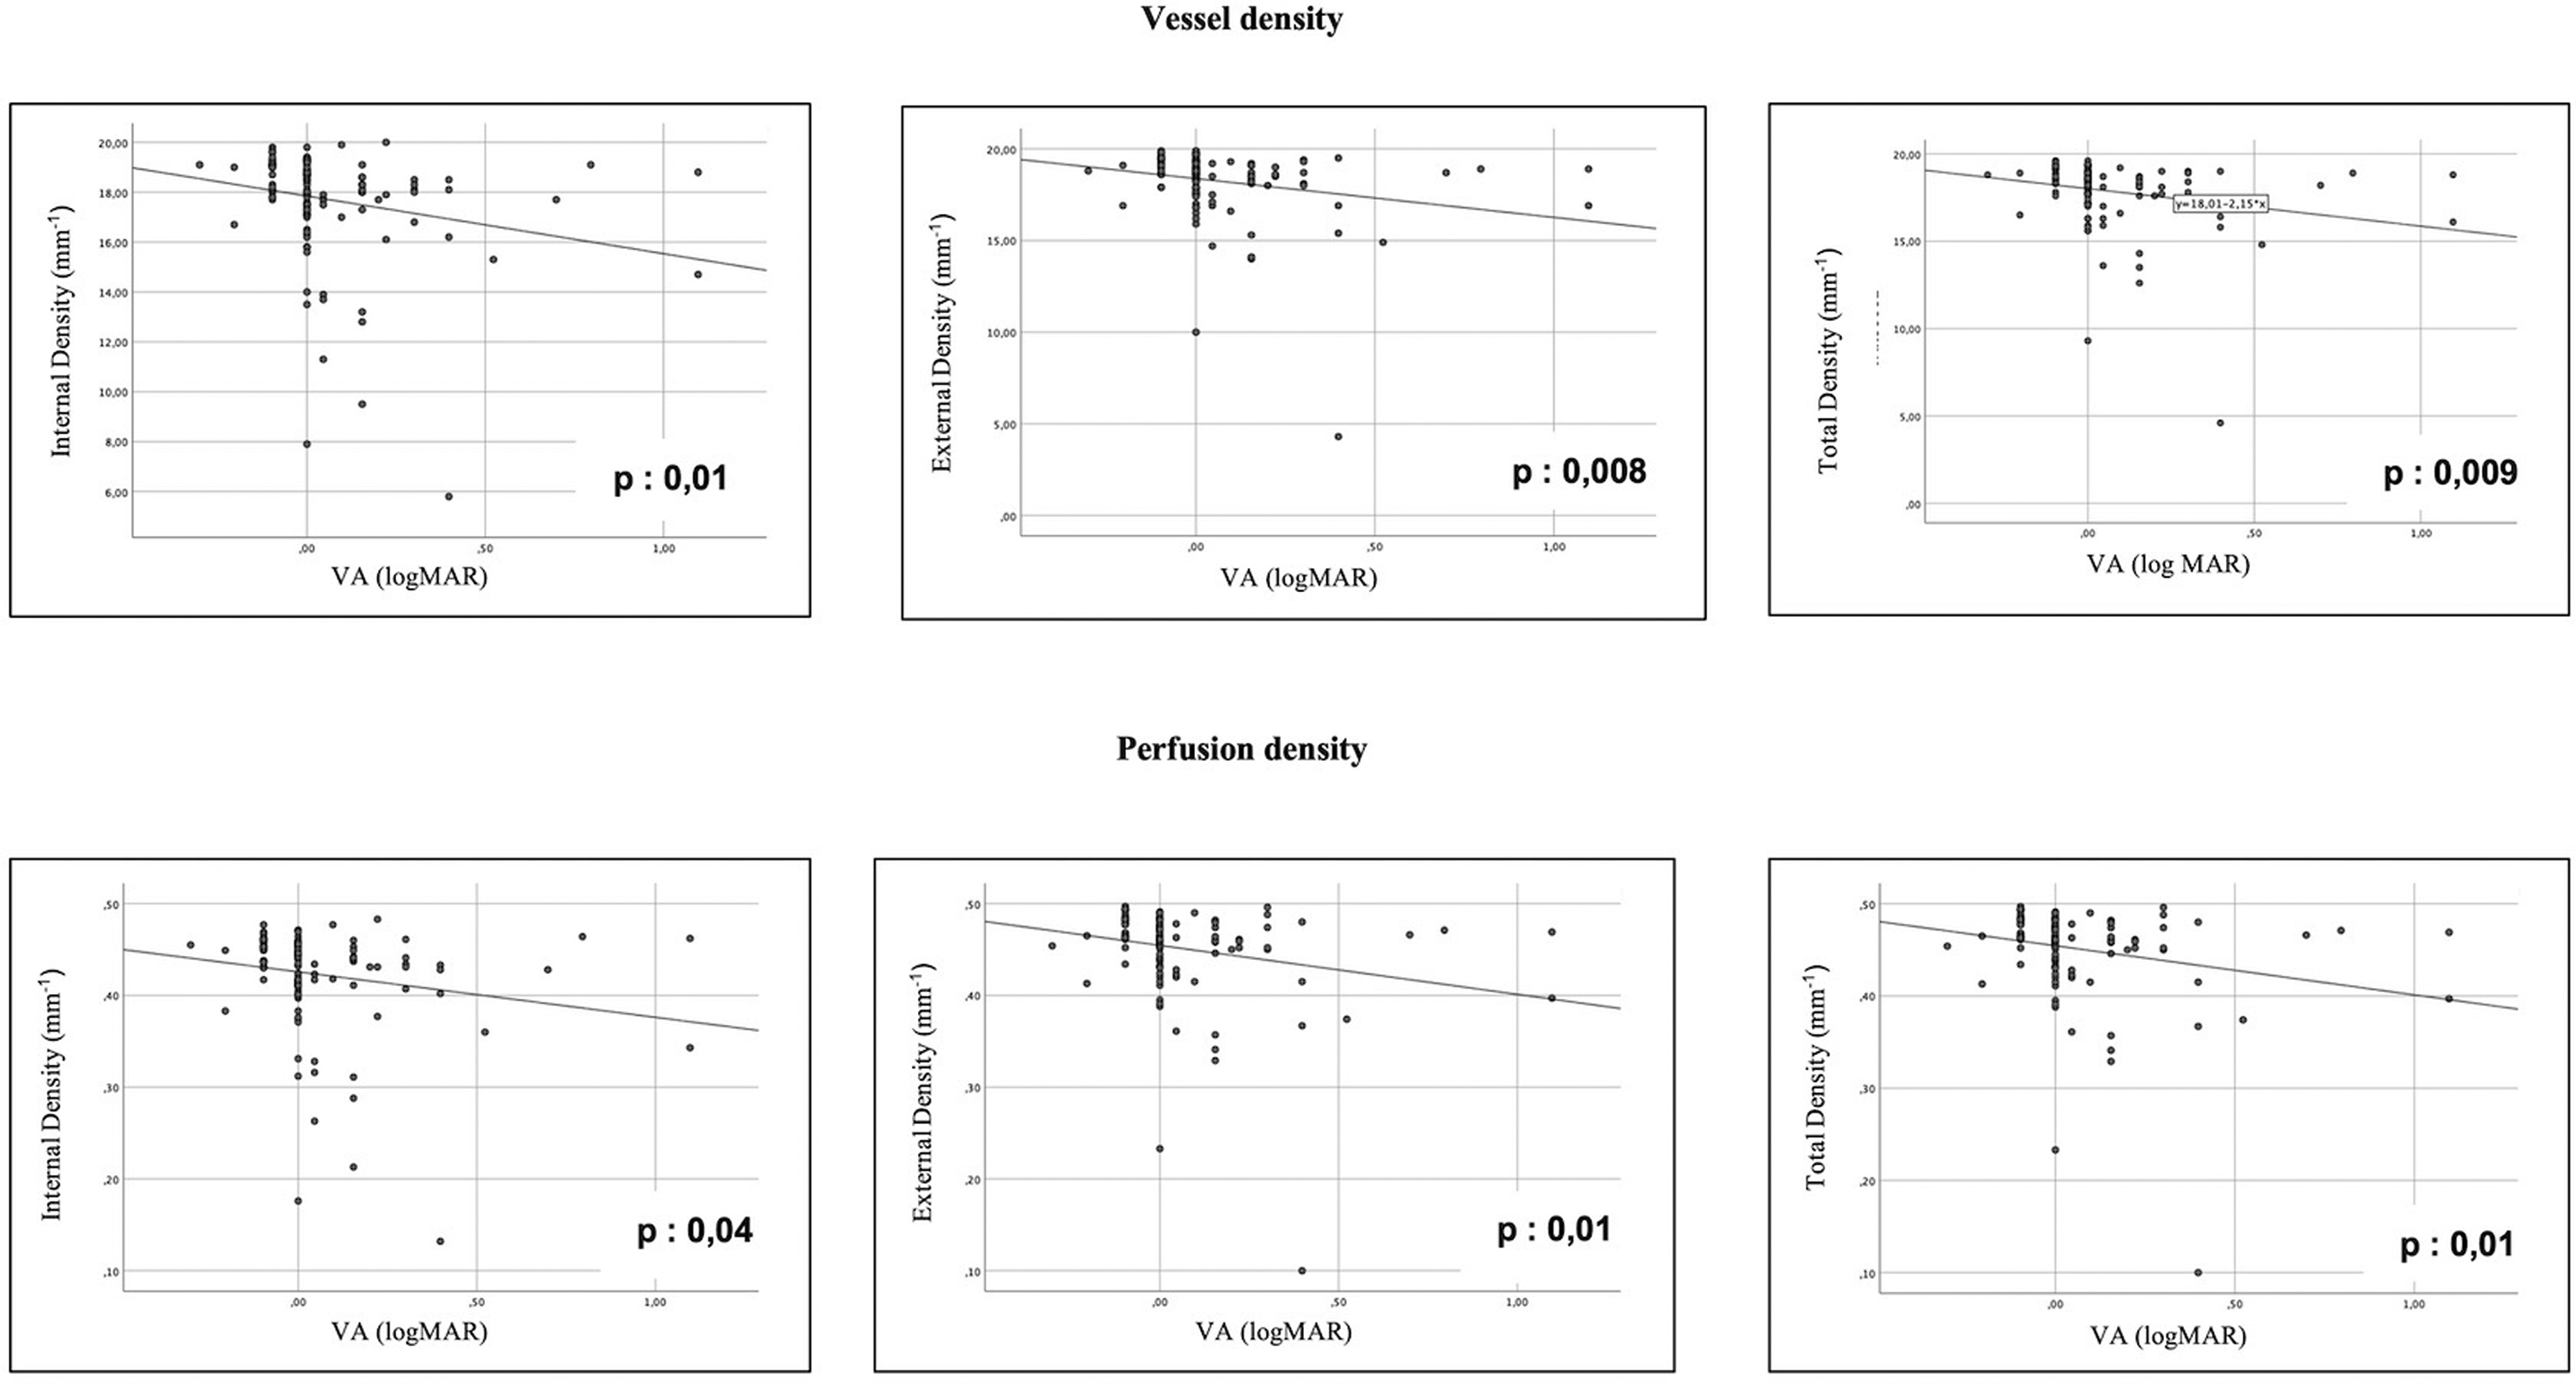
The results of the correlation analyses are shown in Table 4. It was observed that as VA (expressed as LogMAR) increased (decimal scale decrease), inner, outer and total densities (for both vessel density and perfusion density) decreased (p: 0.008 to 0.04; Figure 3). FAZ circularity also tended to decrease as VA decreased, but this correlation did not appear to be statistically significant (p = 0.07).
Correlation between microvascular parameters and visual acuity.
Correlation between microvascular parameters and visual acuity in 6 × 6 mm OCT-A macular scans in all patients.
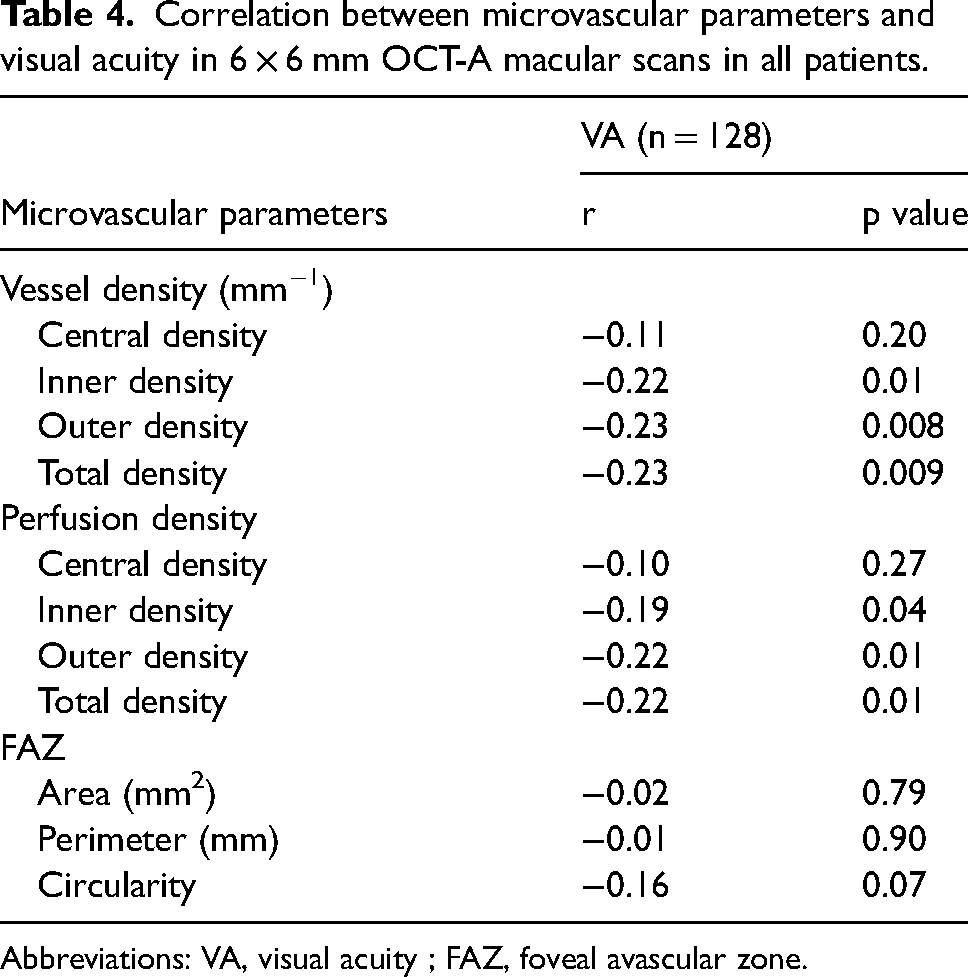
Abbreviations: VA, visual acuity ; FAZ, foveal avascular zone.
Changes in microvascular parameters and visual acuity during treatment
Six patients underwent an OCT-A examination both before and during occlusion therapy: 4 patients with anisometropic amblyopia and 2 patients with strabismic amblyopia. The average duration of follow-up was 284 days (extremes: 168–498 days). LogMAR VA in AEs significantly decreased at the end of the follow-up period (0.27 ± 0.17 before vs 0.03 ± 0.05 after treatment; p = 0.026). VA in CEs was 0 logMAR before and after treatment (p = 1.00)
All microvascular parameter values were increasing by the end of the follow-up period in the AEs (range p : 0.024 to 0.028). With regard to the FAZ, circularity was significantly higher after treatment in the AEs (p = 0.042) but there was no significant difference in terms of perimeter (p = 0.79) or area (p = 0.50). No significant longitudinal changes were found in the contralateral eyes after treatment. (Table 5).
Evolution of microvascular parameters in 6 × 6 mm OCT-A macular scans before and after occlusion therapy.
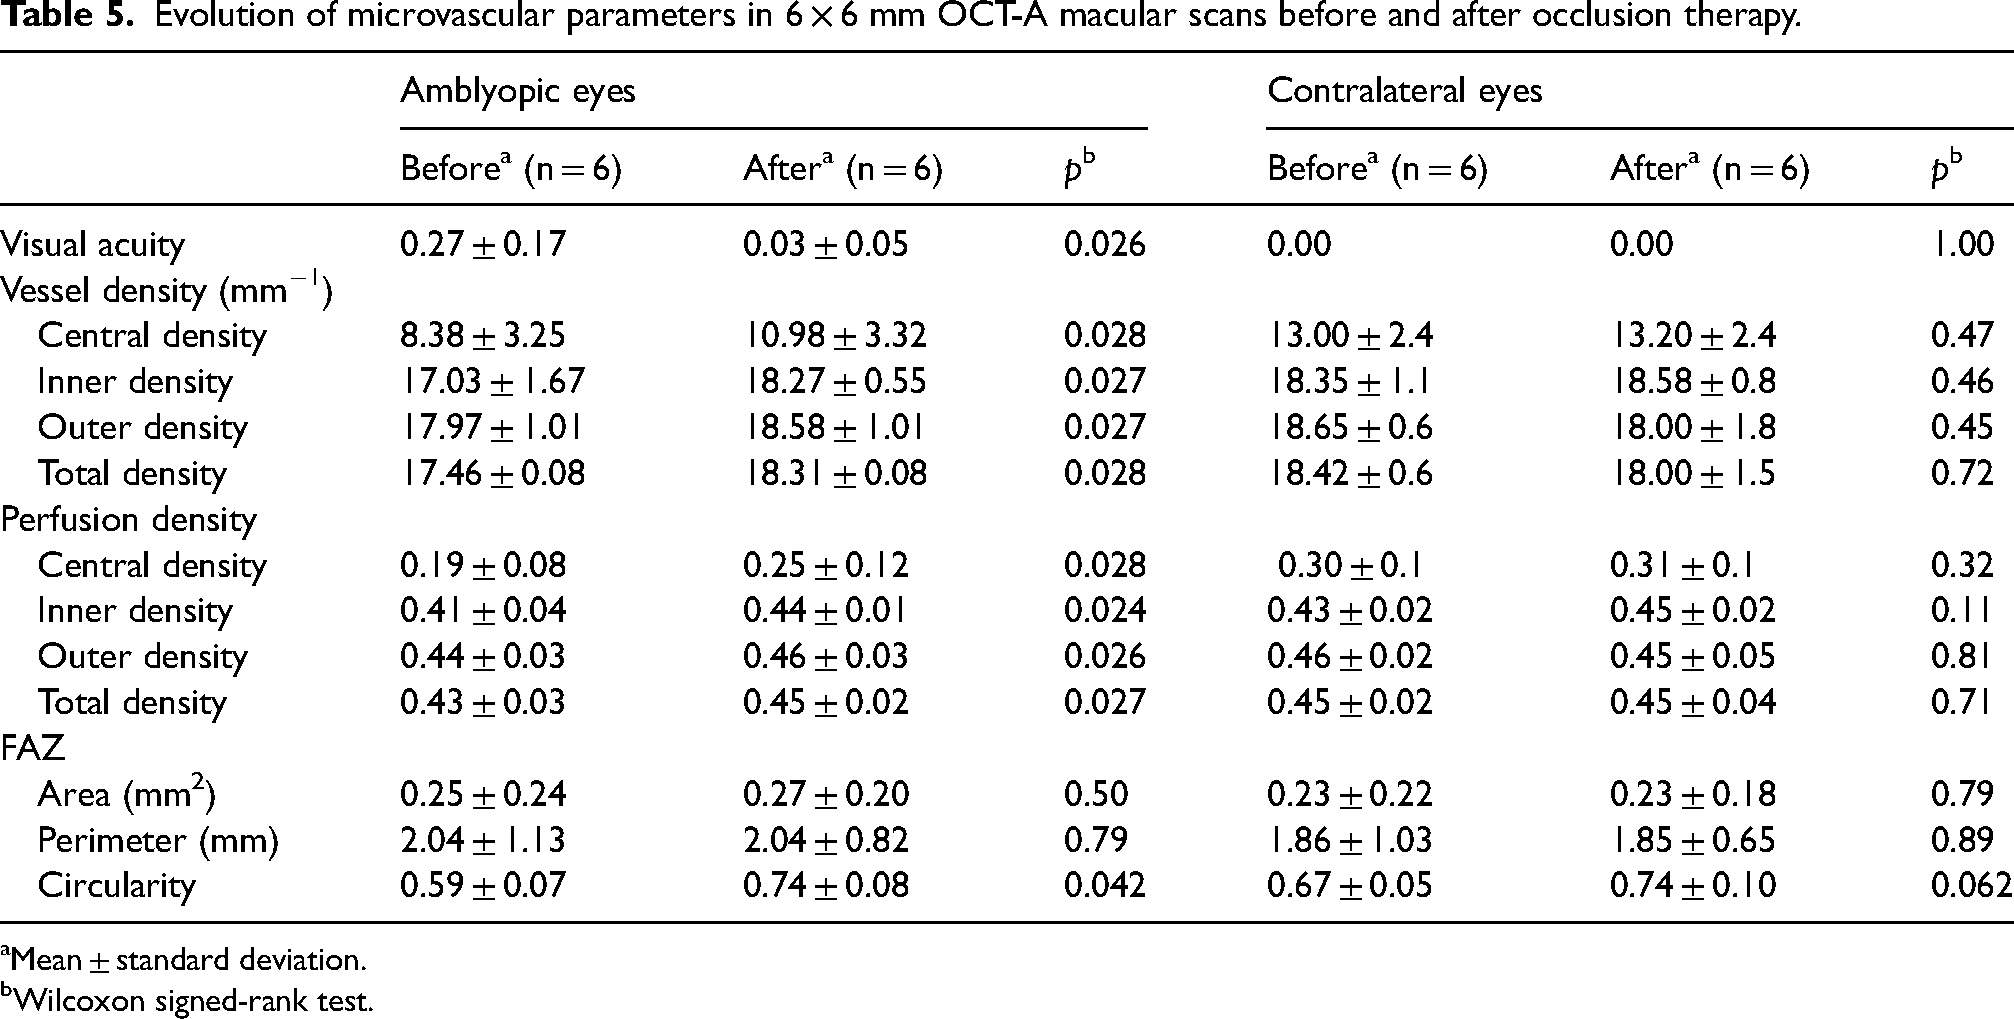
Mean ± standard deviation.
Wilcoxon signed-rank test.
Interobserver reproducibility was excellent for the 112 microvascular parameters tested with an r2 assessed as 0.98 (p < 0.0001; Figure 4).
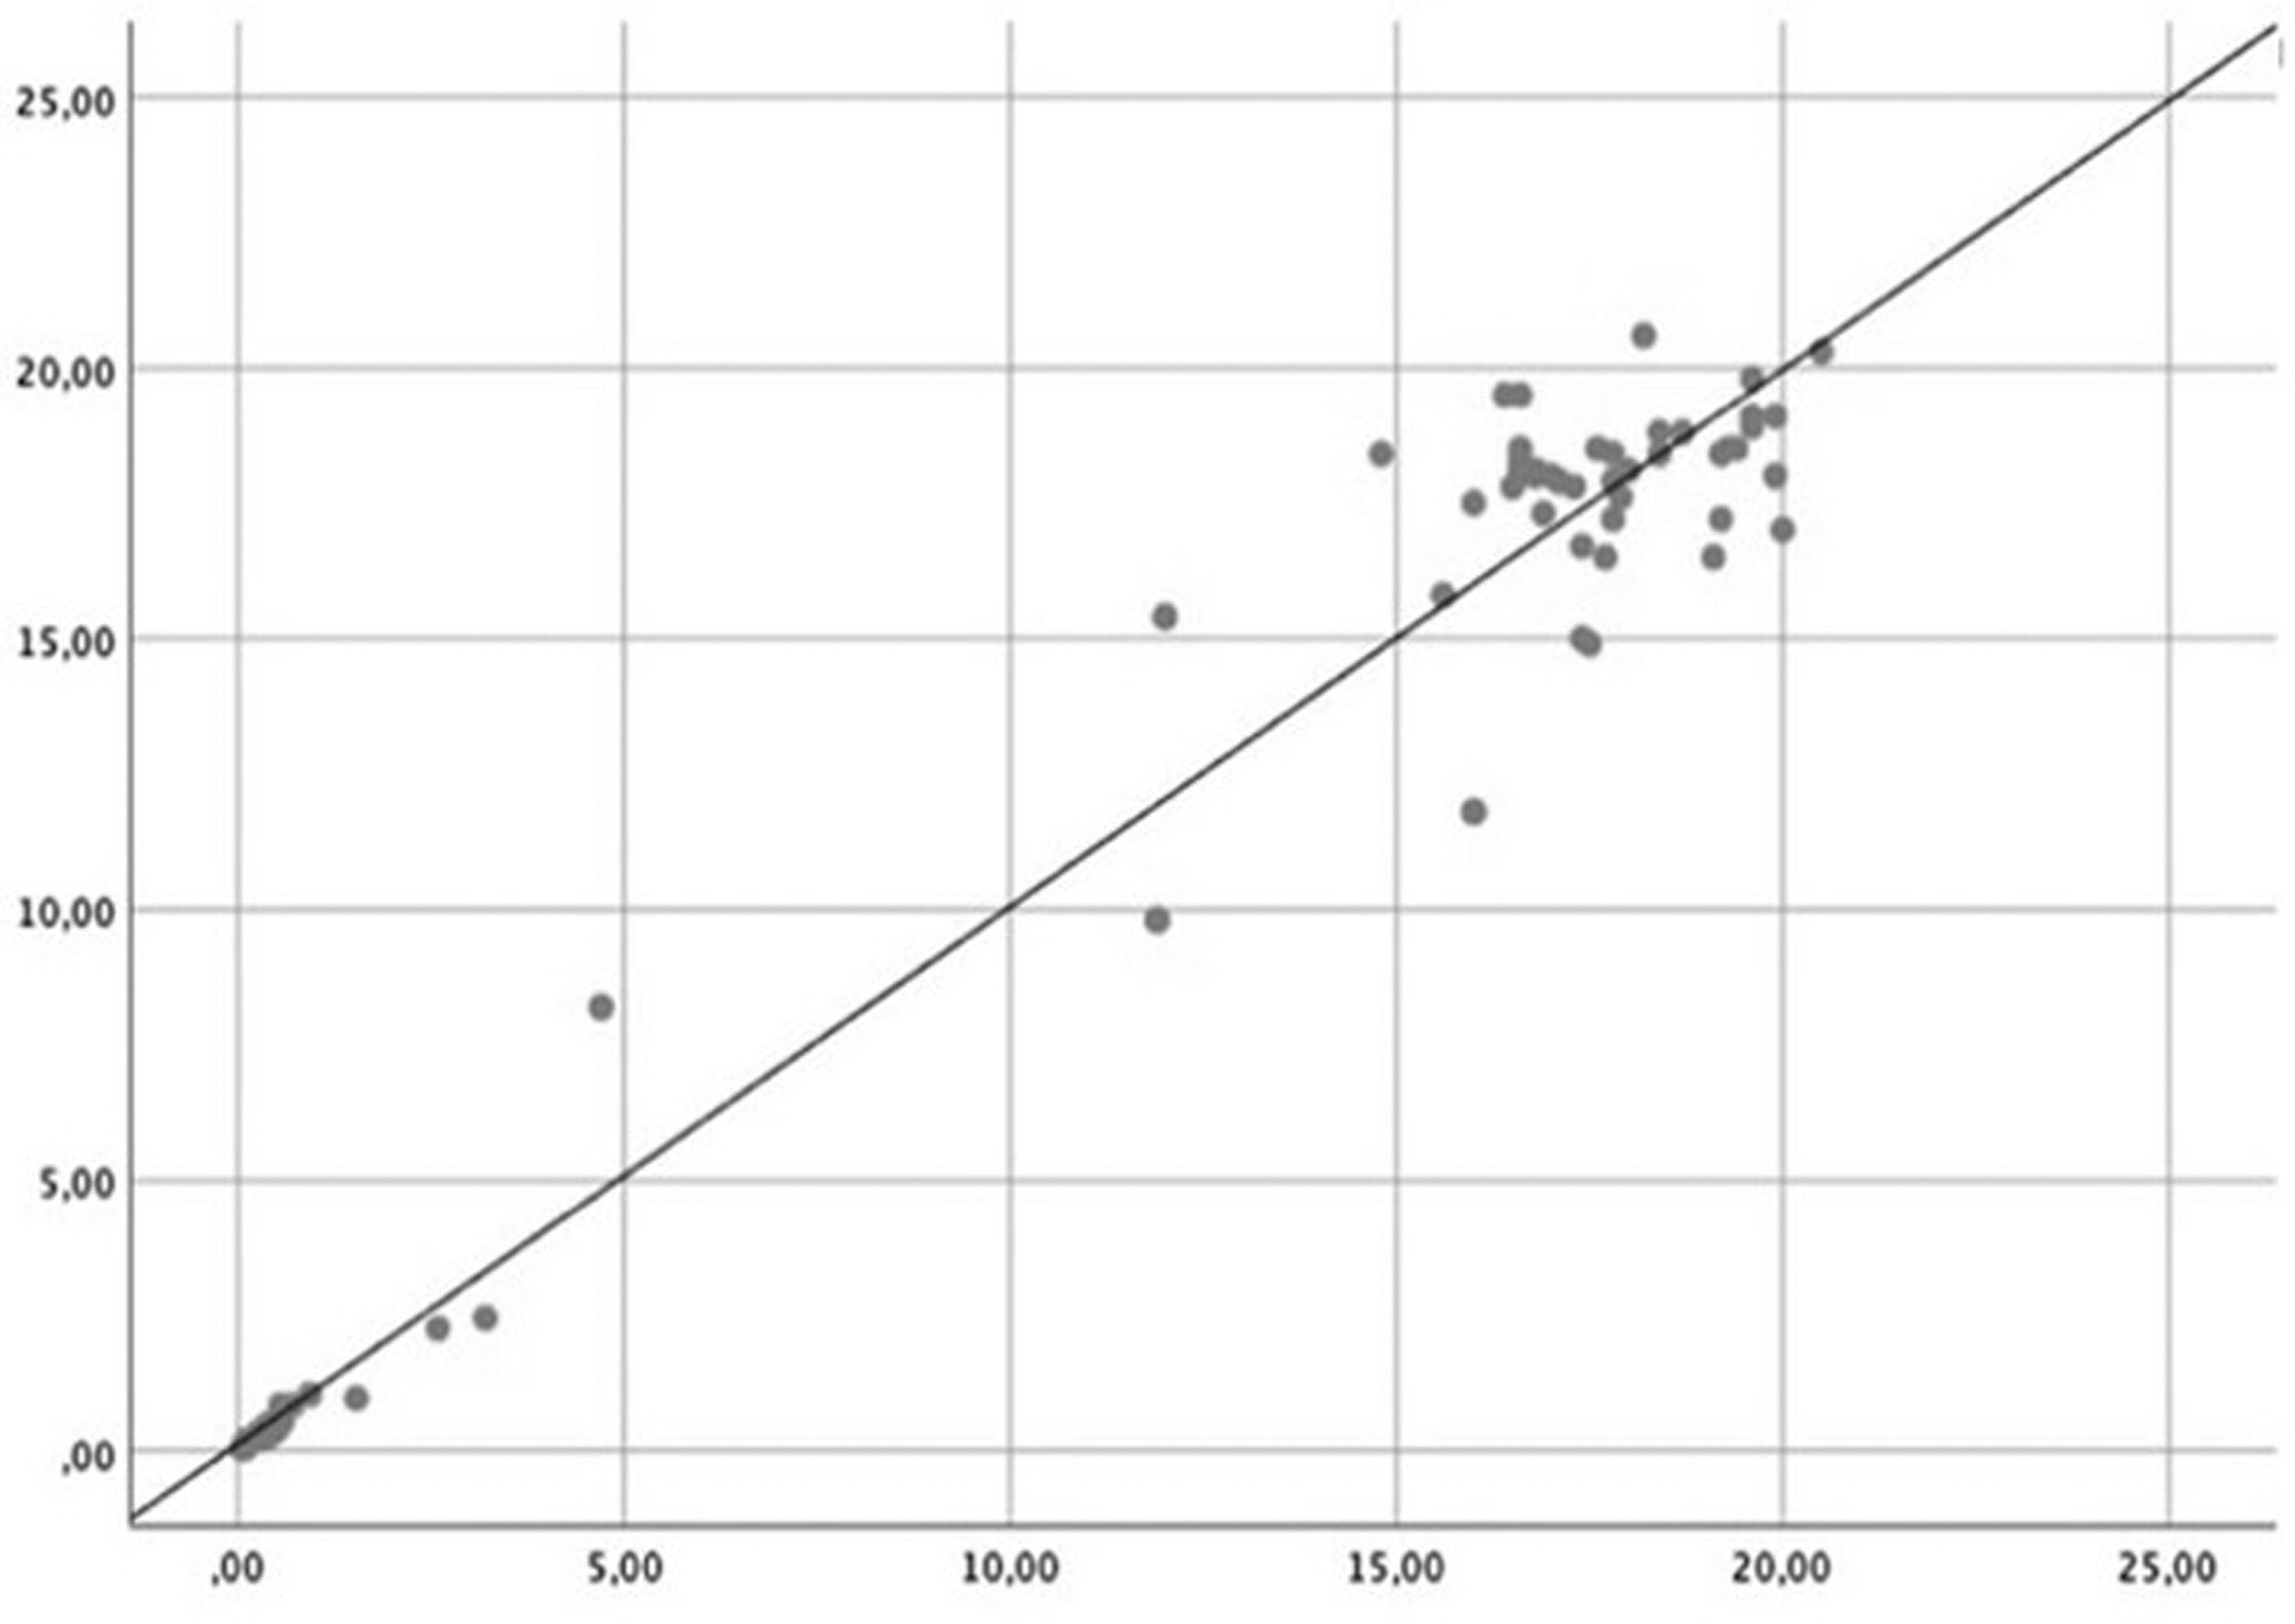
Interobserver reproductibility.
Discussion
OCT-A is a recent non-invasive imaging technique that makes possible to obtain a detailed representation of retinal and choroidal microvasculature. In this study, OCT-A was used to quantitatively assess macular microvascular changes in the SCP in amblyopic patients compared to healthy control subjects. A significant number of patients, in relation to other published studies, was prospectively recruited.
The results showed a statistically significant decrease in VD and PD of the SCP in the 3 × 3-mm and 6 × 6-mm scans in AEs compared with healthy control eyes. These findings are consistent with those of other studies. Indeed, Yilmaz et al. 6 and Karabulut et al. 8 found lower VD of the SCP and DCP in the 6 × 6-mm scans in AEs compared to control eyes in cohorts of 30 and 45 patients respectively. Sobral et al. 7 achieved similar results with 3 × 3-mm scans in a series of 52 patients.
It is currently unclear how these findings might relate to the pathophysiology of amblyopia. These retinal microvascular changes in AEs could indicate abnormalities or slow development of the macula linked to a lack of normal visual experience. Studies in animal models have shown that monocular deprivation leads to a decrease in retinal ganglion cell density12–14 and an overall thinning of the inner plexiform layer.15,16 Ocular deprivation is also believed to result in a decrease in the number of synaptic connections in the inner plexiform layer 17 associated with a decrease in retinal ganglion cell activity.18–20 OCT studies in amblyopic patients have revealed a thinning of the ganglion cell layer and the inner plexiform layer.21,22 This being the case, the decrease in vascular density in AEs could reflect a decrease in oxygen and nutrient requirements in the inner retina due to a reduction in the number and activity of retinal ganglion cells.
In contrast, studies by Demirayak et al. 9 and Araki et al. 5 found no significant difference in VD in the retinal capillary plexuses. These conflicting results could be attributed to the small size of the cohorts, the use of the CEs as the control rather than healthy control subjects, 5 or the failure to take the SE and AL into account when analysing the results. 9 In the study by Lonngi et al., 4 for example, the results were significant only once adjusted to refractive values.
The present study is one of the first to focus on the circularity of the FAZ in amblyopia. The FAZ was found to be less circular in the AEs than in the control eyes, indicating an irregularity in the boundaries of the FAZ. These results are corroborated by the study performed by Wong et al. 23 Apart from amblyopia, loss of circularity in the FAZ has been proven to be a good indicator of a loss of capillaries immediately surrounding the FAZ and was linked to disease progression in maculopathy caused by vascular pathologies. 24 The decrease in FAZ circularity in AEs, as our study shows, could therefore indicate macular vascular loss.
Furthermore, a comparison of the AEs with the CEs revealed a tendency towards lower values for all vascular parameters (VD, PD and FAZ), but these results did not appear to be statistically significant. This was also observed in the studies performed by Yilmaz et al. 6 and Araki et al. 5 Then, it is possible that CEs vascularisation in amblyopic children is not entirely normal. Studies have suggested that the development of both eyes is affected by the presence of unilateral amblyopia,25–28 meaning that the CEs might function abnormally and not be considered equivalent to a healthy eye. However, in some studies, the CEs were used as a reference for comparison with the AEs, 5 which might explain the discrepancy in the results observed.
A negative correlation between VA and SCP density was observed. These findings suggest that the lower the VA, the greater the loss of density in the SCP. We might therefore imagine that OCT-A might allow for an objective estimation of the severity of the amblyopia and classification. These findings will need to be confirmed with a larger cohort.
Finally, the present study also included the longitudinal follow-up of patients with amblyopia over the course of their treatment with a view to analyse changes in microvascular parameters. Patients’ follow-up revealed an improvement in VD, PD and FAZ circularity over the course of the treatment, along with visual recovery. This suggests that the lower macular vessel density and FAZ circularity observed in AEs might be reversible with treatment and that retinal microvascularisation might therefore be involved in the visual recovery process. It would remain to be seen whether such changes would be a cause or a consequence of improved VA.
Longitudinal data and specifically, the impact of amblyopia therapy was not explored in most studies. To our knowledge, it is one of the first longitudinal study to attempt to compare microvascular parameters before and after patching therapy. While Gunzenhaiser et al. 29 showed there was a significant increase in retinal vessel density in 3 × 3-mm scans after treatment, Huang et al. 30 didn’t find significant longitudinal changes in VD or PD.
Only few patients were included in the longitudinal follow-up. In fact, recruiting children under 5 years old was difficult, since such children are often unable to maintain the appropriate position while the images are taken. However, it is these children that have the brain plasticity that allows for good visual recovery with treatment. The importance of the small sample size cannot be understated, and it is unclear whether our findings would be generalizable to a larger group of patients.
If these findings were confirmed in broader studies, OCT-A could emerge as a useful tool for assessing response to treatment for amblyopia.
The present study revealed a decrease in macular VD in children with unilateral functional amblyopia compared to children without amblyopia. Correlation analyses identified a linear decrease in VD and PD in relation to the decline in VA. Furthermore, in a longitudinal study involving a few patients from the amblyopic cohort, the OCT-A abnormalities appeared to be reversible with occlusion and the resulting visual recovery.
On the whole, OCT-A appears to be a relevant, objective complementary examination when it comes to diagnosing and monitoring functional amblyopia. Beyond this, the microvascular disorders observed in amblyopic patients could serve as surrogate markers of neuronal maturity and function.
Footnotes
Declaration of conflicting interests
The author(s) declared no potential conflicts of interest with respect to the research, authorship, and/or publication of this article.
Funding
The author(s) received no financial support for the research, authorship, and/or publication of this article.