
Abstract
Purpose
To estimate the effect of atropine eyedrops at different concentrations for myopia control in children.
Methods
We conducted a Bayesian random-effects network meta-analysis based on randomized controlled trials (RCT). Primary outcomes include changes in spherical equivalent error (SER) and changes in axial length (AL), mean difference (MD) together with 95% credible interval (CrI) were used to evaluate the efficacy.
Results
28 RCTs (6608 children) were included in this review. Comparing ten atropine eyedrops (0.0025%, 0.005%, 0.01%, 0.02%, 0.025%, 0.05%, 0.1%, 0.25%, 0.5% and 1% concentrations) with the placebo, the MDs and 95%CrIs of changes in SER are −0.006 (−0.269, 0.256) D, 0.216 (−0.078, 0.508) D, 0.146 (0.094, 0.199) D, 0.167 (0.039, 0.297) D, 0.201 (0.064, 0.341) D, 0.344 (0.251, 0.440) D, 0.255 (0.114, 0.396) D, 0.296 (0.140, 0.452) D, 0.331 (0.215, 0.447) D, and 0.286 (0.195, 0.337) D, respectively. The MDs and 95%CrIs of changes in AL are −0.048 (−0.182, 0.085) mm, −0.078 (−0.222, 0.066) mm, −0.095 (−0.130, −0.060) mm, −0.096 (−0.183, −0.009) mm, −0.083 (−0.164, −0.004) mm, −0.114 (−0.176, −0.056) mm, −0.134 (−0.198, −0.032) mm, −0.174 (−0.315, −0.061) mm, −0.184 (−0.291, −0.073) mm, and −0.171 (−0.203, −0.097) mm, respectively.Whether evaluated by SER or AL, 1% concentration ranks first in efficacy, but the risk of photophobia is 17 times higher than 0.01% concentration.
Conclusions
0.01% or higher concentration atropine eyedrops are effective for myopia control, while 0.0025% and 0.005% concentrations may not. As the concentration increases, the effect tends to increase, 1% concentration may have the strongest effect.
Introduction
Myopia, a condition that distant image could not be focused appropriately on the retina, is usually defined as the spherical equivalent error (SER) of ≤ −0.5 diopter (D). Myopia is a global public health issue, nearly a quarter of the world's population are myopic. 1 In China, the situation is more severe, over 0.4 billion people are nearsighted. 2 Nearly 20% of the myope will develop high myopia (SER ≤ -6D). 3 It was estimated that 9.8% 4 of the world's population would be of high myopia by 2050. High myopia comes with high risk of retinal damage such as retinal detachment, leading to vision loss.
Atropine eyedrops is commonly used for myopia control, and high dose atropine (like 1% concentration) was reported to have a better performance even than orthokeratology. 5 However, for high doses, side effects like blurred near vision and photophobia is a common problem. 6 Cooper J 7 and coworkers reported that 0.02% was the highest concentration resulting in no clinical symptoms. For low-dose atropine such as 0.01% concentration, the issue is that its efficacy is controversial. Yam JC 8 and coworkers found there was no difference in slowing myopia progress compared with the placebo. On the contrary, some studies have found that 0.01% is effective,9,10 and 0.01% is currently a common clinical choice.
In this review, we aimed to evaluate the effect of ten currently available atropine eye drops at different concentrations for myopia control, and by pooling various randomized controlled trials (RCTs) and expanding the sample size, we can answer whether low concentration atropine is effective with a higher degree of certainty.
Methods
Databases and search strategy
Literature search was done in PubMed, Science Direct, the Cochrane Central Register of Controlled Trials, and ClinicalTrials.gov databases (from inception to 31 August, 2023). The following terms and their combinations were used: myopia, myopic, randomized, randomization, random, atropine, cycloplegia, mydriatic.
Inclusion criteria
The study design must be RCT
In each RCT, at least one arm used atropine eyedrops
No other interventions for myopia control should be used in combination
The results of at least one primary outcome should be reported, whether it is a change in spherical equivalent error (SER) or a change in axial length (AL)
Cycloplegia must be performed is SER was measured
Exclusion criteria
Studies of case report, letter, review, and so on; or studies used cross-sectional design, or cohort design, or case-control design, and so on
Other interventions for myopia control were used in combination with atropine
For multiple publications based on the same group of subjects, for example, Chia A 2012, 11 Chia A 2014 12 Chia A 2016, 13 only the last publication was included. However, there is an exception. If a study uses a crossover design, in order to prevent the treatment effects before and after the crossover from being averaged out, studies published before and after the crossover will be included separately and data will be extracted separately. See study of Wes SF10,14 et al.
Outcomes assessment
The primary outcomes include changes in SER (unit: diopter/year, D/year), and changes in AL (unit: millimeters/year, mm/year).
Study selection and data collection
Two investigators independently reviewed the titles, abstracts, and full text articles, disagreement was solved by thorough discussion. Data was extracted using self-designed forms. Briefly, for categorical data, the numbers of events were extracted (such as the number of photophobia). For continuous data, such as change in SER, the mean value and standard deviation (SD) were extracted. In addition, the following information of each study was extracted: (1) Name of the first author (2) The publication year (3) Country or area where studies were conducted (4) Sample size (5) Participants’ age (6) Participants’ baseline SER level (7) The follow-up duration (8) Concentration of atropine eyedrops.
Assessment on the risk of bias
Paper quality was assessed using the recommended tool by the Cochrane Collaboration, 15 from six aspects: random sequence generation, allocation concealment, blinding of participants and personnel, blinding of outcome assessors, incomplete outcome data, selective outcome reporting. The risk of bias was graded as “low”, “unclear” or “high” according to the methodology of each study.
Statistical analysis
A Bayesian random-effects network meta-analyses was conducted, the weighted MDs and 95% credible intervals (Bayesian confidence interval, CrIs) were used to compare the effect of atropine eye drops at each concentration on myopia control. When performing analysis, the Markov chain Monte Carlo (MCMC) method was adopted for the estimation of the posterior densities for all unknown parameters, with a burn-in number of 5000 in a 20000 times iteration chain. Node-splitting analysis was done to check whether there was inconsistency among all interventions.
In the present review, the annual MD in primary outcomes between atropine groups and the placebo group was calculated, using the following formula. For SER, a negative MD means faster myopia progression, while for AL, a negative MD means slower myopia progression. All the analysis was carried out with an open source R program (http://r-project.org/, version 4.3.1).

Results
Paper selection
The paper selection process was shown in flow chart (Figure 1). Initially, a total of 522 records were identified by literature search, 131 duplication were excluded. Then 259 studies were further excluded by initial screening according to title and abstract:cross-sectional study, cohort study, case control study; review, letter, editorial, correspondence, meta-analysis. Then by full-text screening, 93 studies were excluded: 68 studies showed no sign of randomization; 19 studies used other myopia intervention at the same time; six studies not written in English. Among the left 39 articles assessed for eligibility: six were defined as multiple publications according to our exclusion criteria16–19; two studies20,21 only evaluated the following outcomes: visual acuity, pupil size, binocular vision, and accommodation; pupil metrics; three studies22–24 used single-vision spectacle lenses as the control, no direct or indirect comparison could be done with other studies.
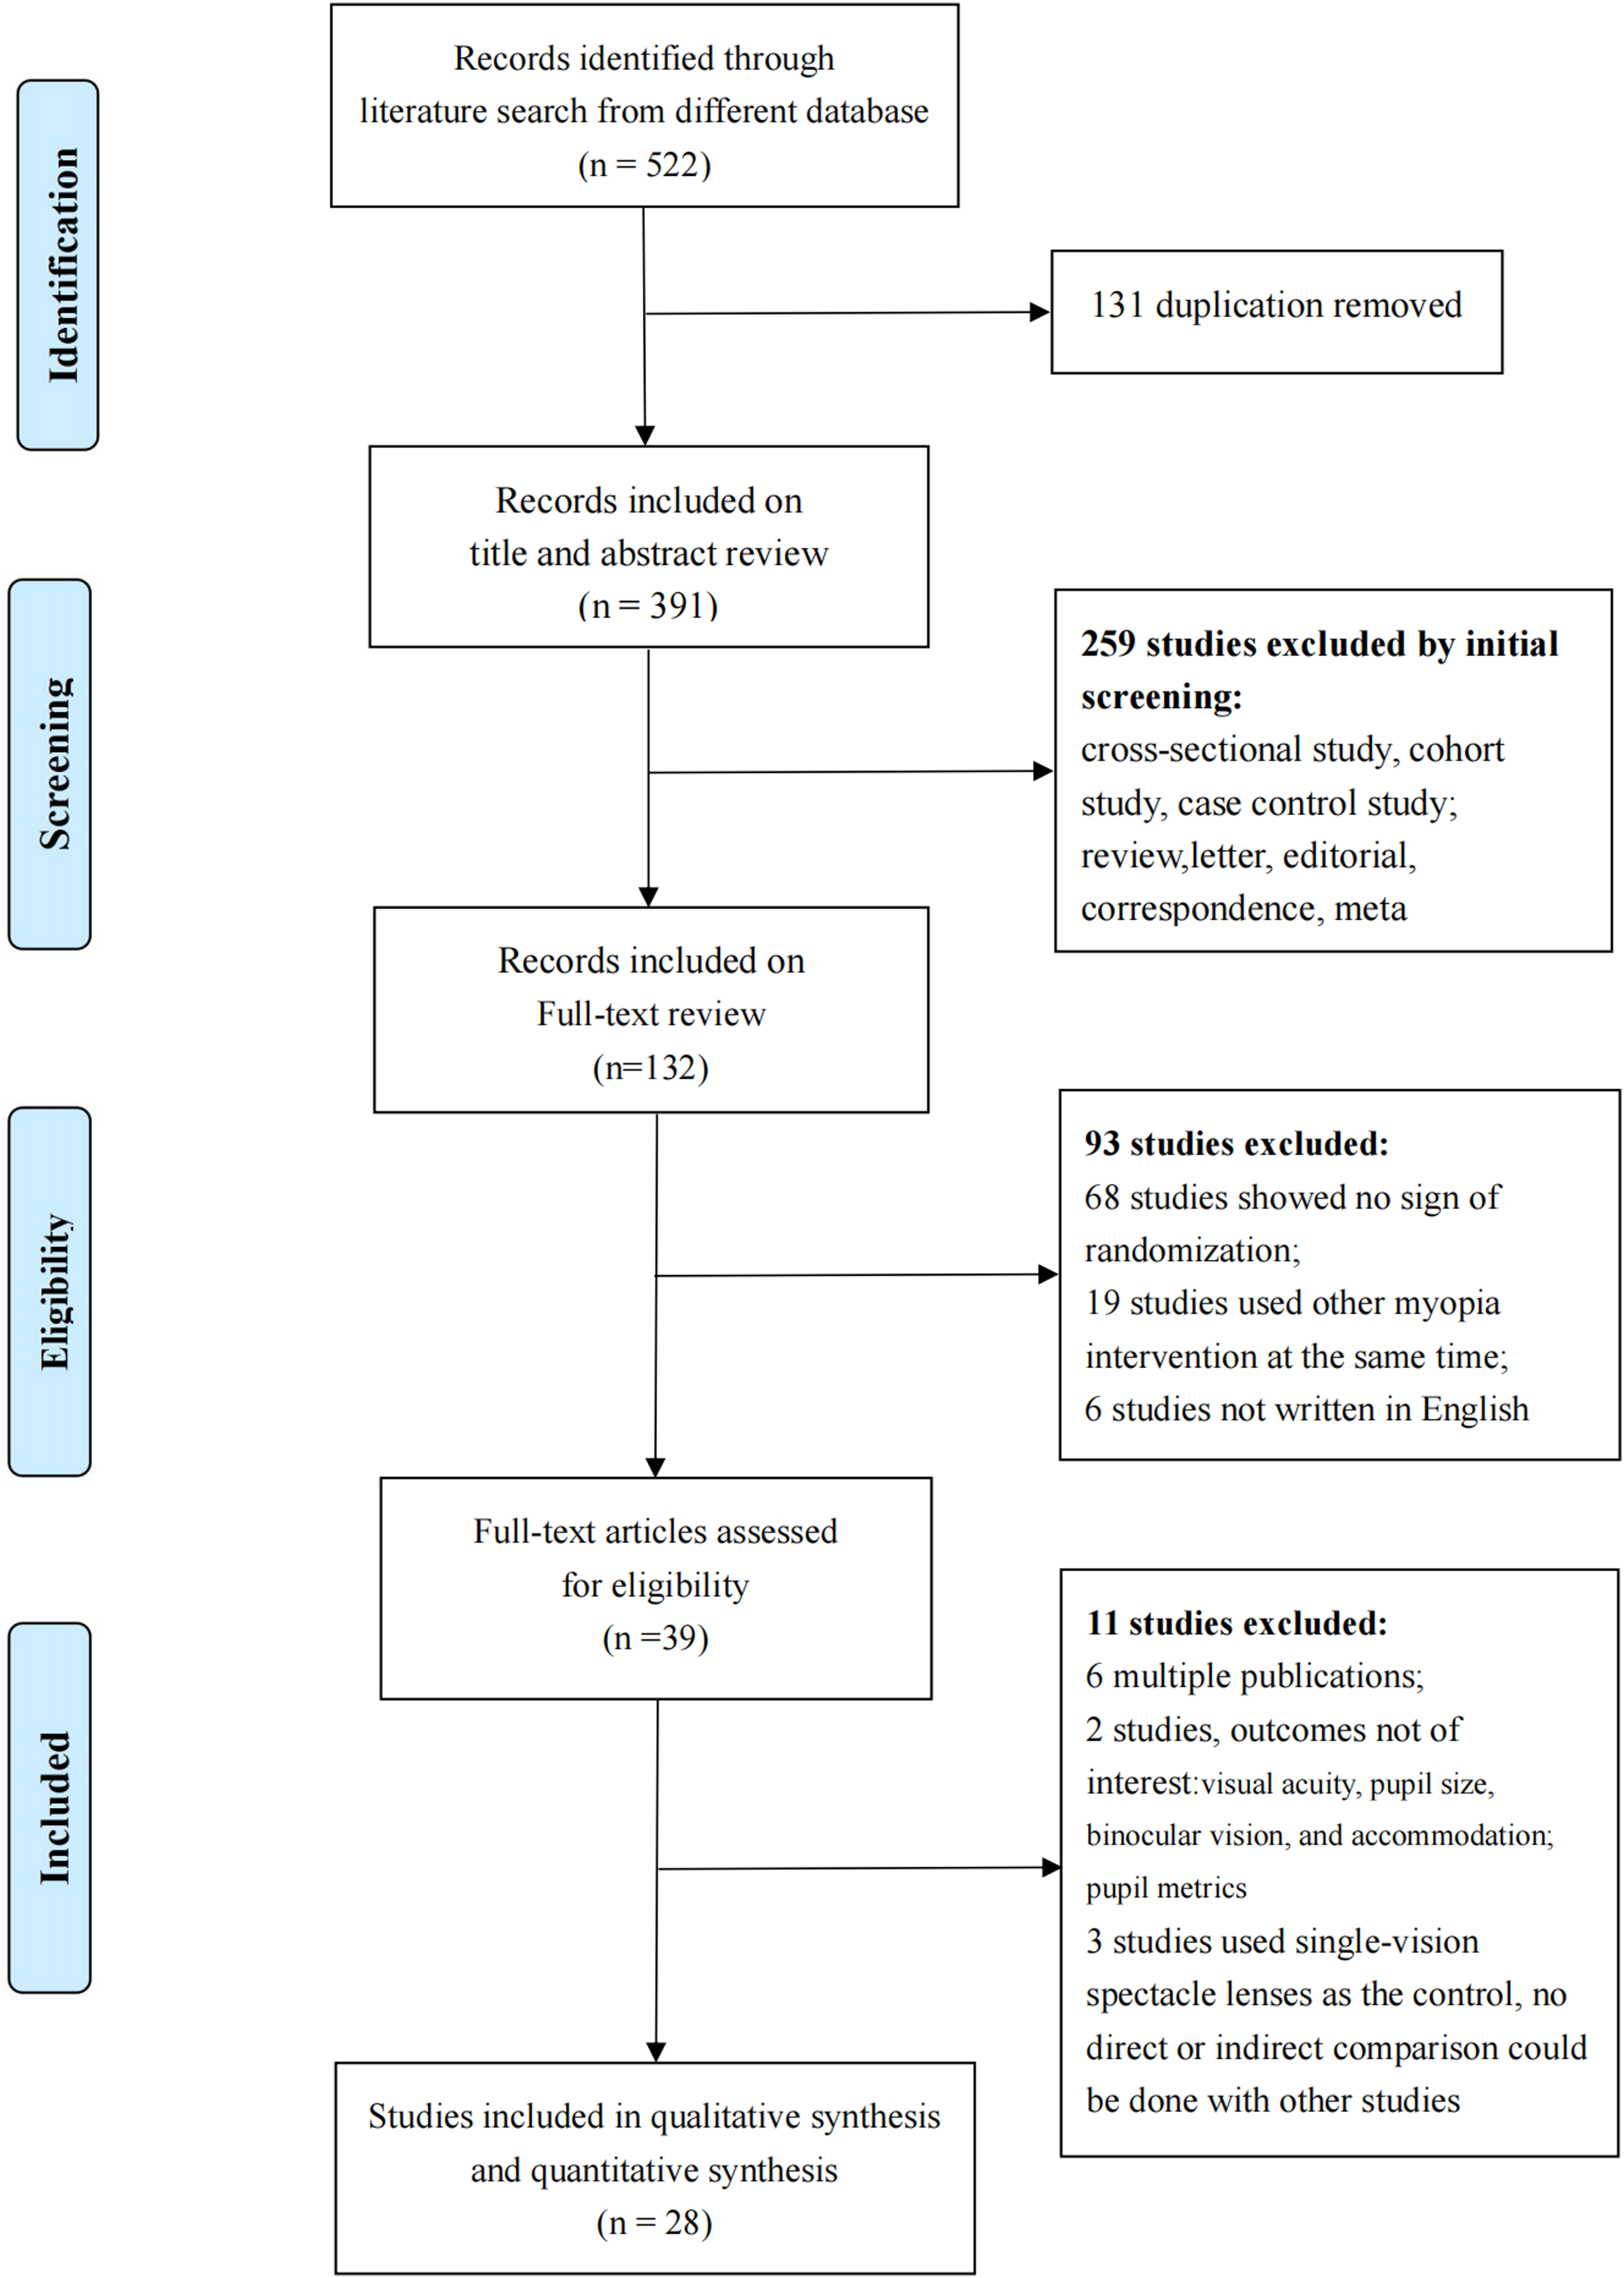
Flow chart of paper selection.
Characteristics of included studies
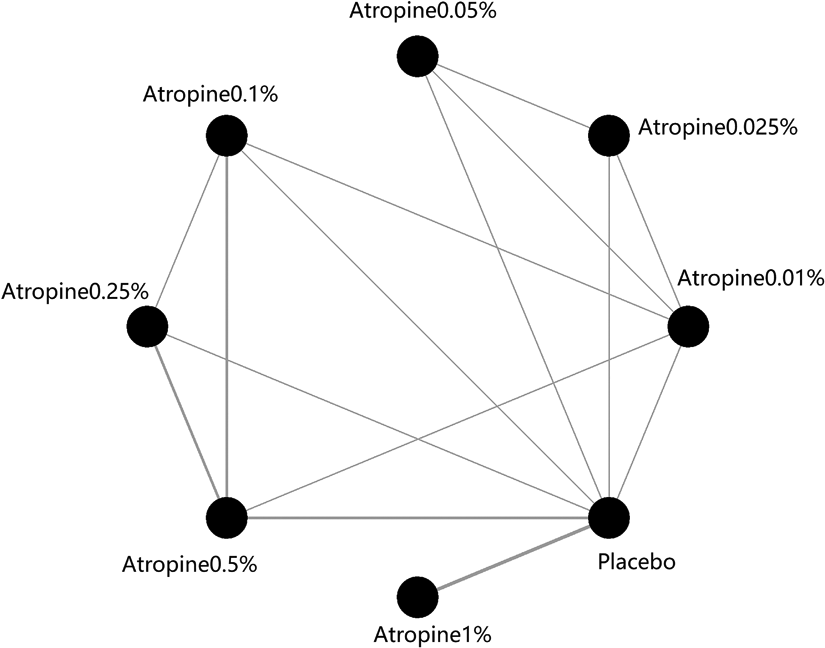
At last, 28 studies,8–10,13,14,18,25–46 involving a total of nearly 3000 children, are included for qualitative and quantitative analysis. The characteristics of each study is summarized in Table 1. Participants’ age ranges from 4 to 16 years old. For most studies, the baseline SER ranges from −0.5D to −6D. The follow-up duration ranges from 6 months to 60 months. There are ten different atropine concentrations involved: 0.0025%, 0.005%, 0.01%, 0.02%, 0.025%, 0.05%, 0.1% 0.25%, 0.5%, and 1%, as shown in the network plot (see appendix1).
Characteristics of included studies.
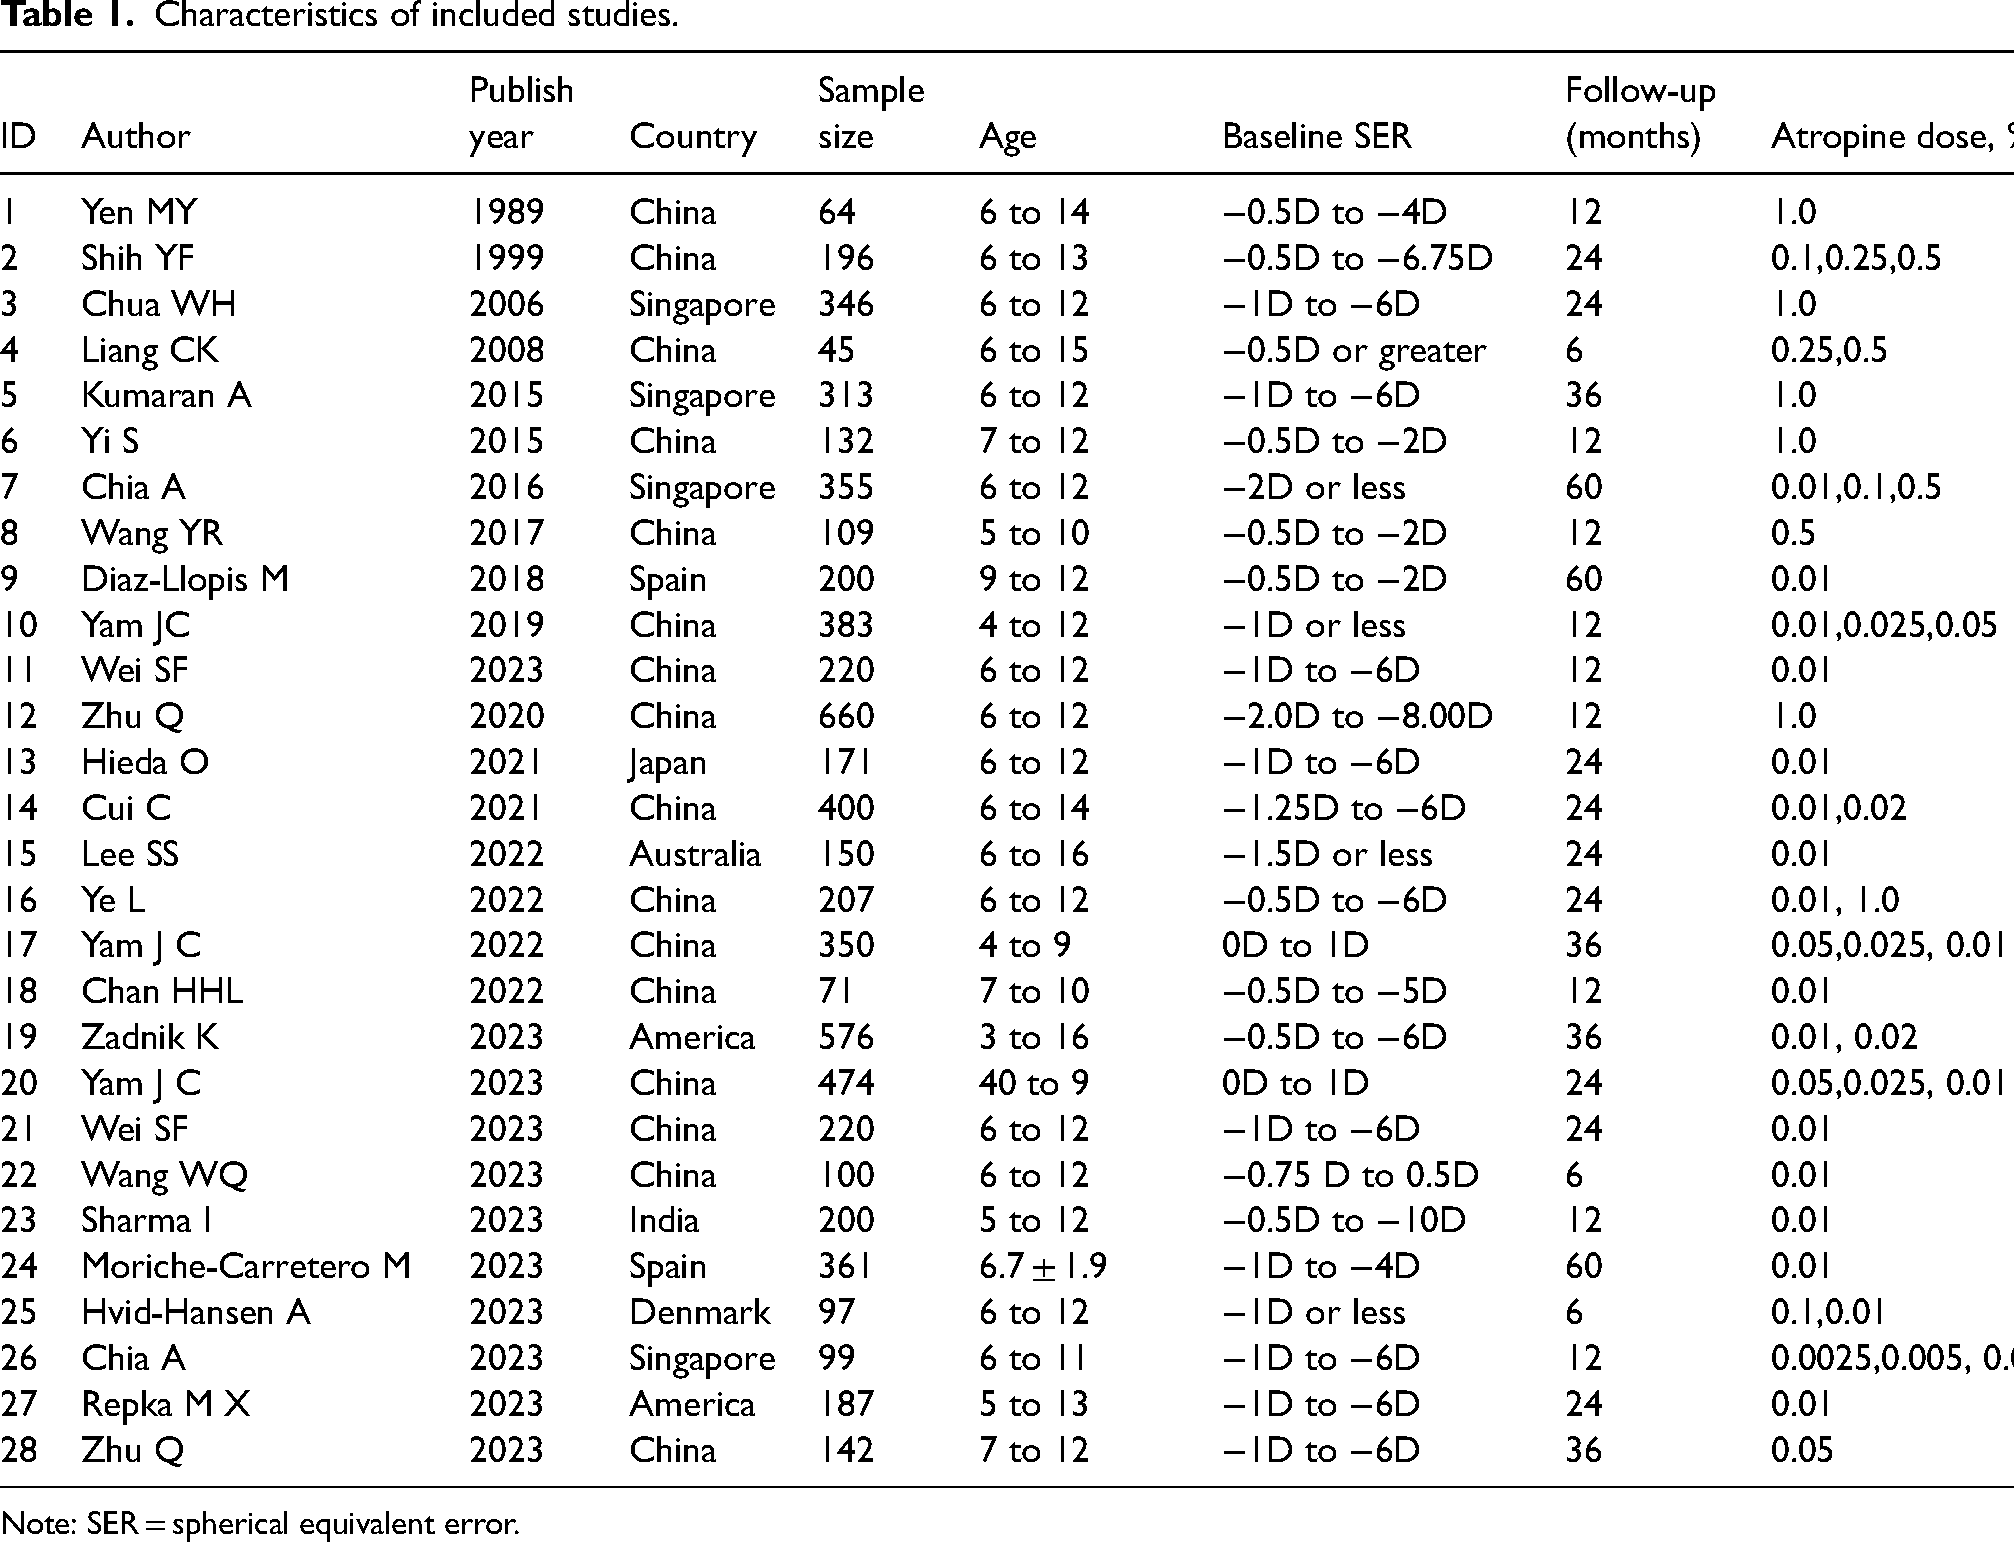
Note: SER = spherical equivalent error.
Risk of bias assessment
Results of risk of bias assessment was shown in Figure 2, in terms of randomization, all the included studies used a random-number table or statistical analysis software to generate the random sequence, either was appropriate, there was a low risk of bias on randomization. In terms of allocation concealment, 18 studies were of low risk of bias as they described clearly that the random sequences were concealed by envelopes or other ways. In terms of blinding method, most studies had a low risk of bias except for study of Yi S 2015, 30 where atropine-treated children were informed of dilation and cycloplegia. In terms of incomplete data, most studies were of low risk of bias except for Yen MY 1989. 25 At the beginning, Yen MY and coworkers recruited a total of 247 subjects, however, only 96 cases were included in the data analysis at last, without any explanation. None study had a high risk of bias on selective reporting. Overall, the 28 included studies are of relatively high quality.
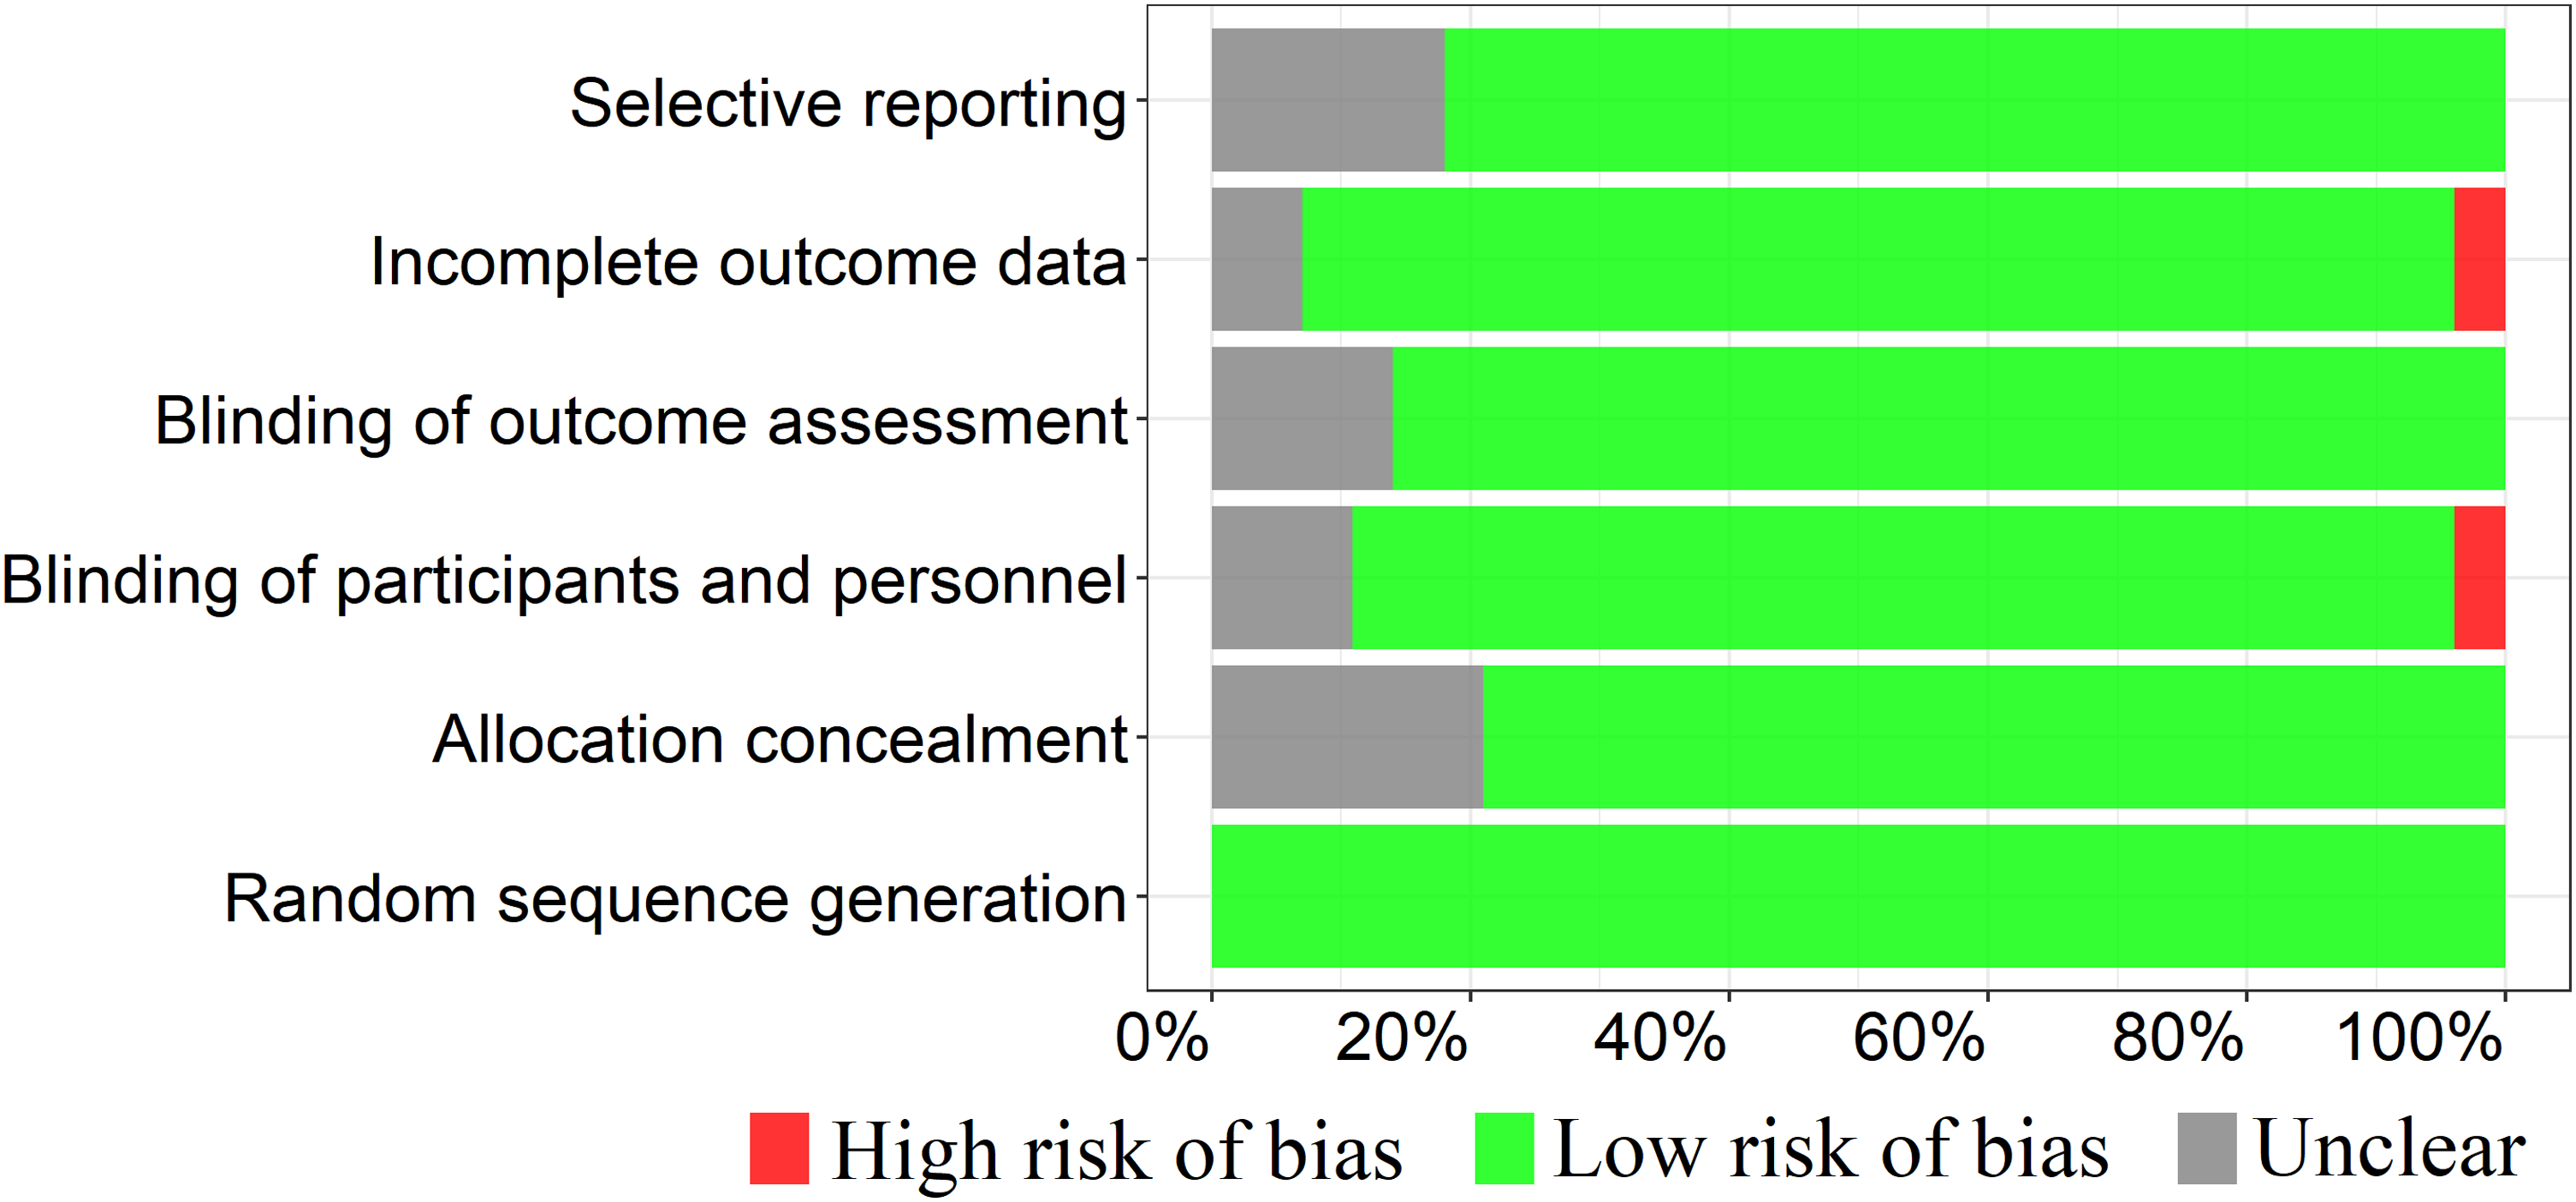
Plot of risk of bias assessment.
Comparison on change in SER among atropine groups and the placebo
Comparing ten atropine eyedrops (0.0025%, 0.005%, 0.01%, 0.02%, 0.025%, 0.05%, 0.1%, 0.25%, 0.5% and 1% concentrations) with the placebo, the MDs and 95%CrIs of changes in SER are −0.006 (−0.269, 0.256) D, 0.216 (−0.078, 0.508) D, 0.146 (0.094, 0.199) D, 0.167 (0.039, 0.297) D, 0.201 (0.064, 0.341) D, 0.344 (0.251, 0.440) D, 0.255 (0.114, 0.396) D, 0.296 (0.140, 0.452) D, 0.331 (0.215, 0.447) D, and 0.286 (0.195, 0.337) D, respectively (Figure 3A).
Comparison on change in primary outcomes between atropine groups and the placebo.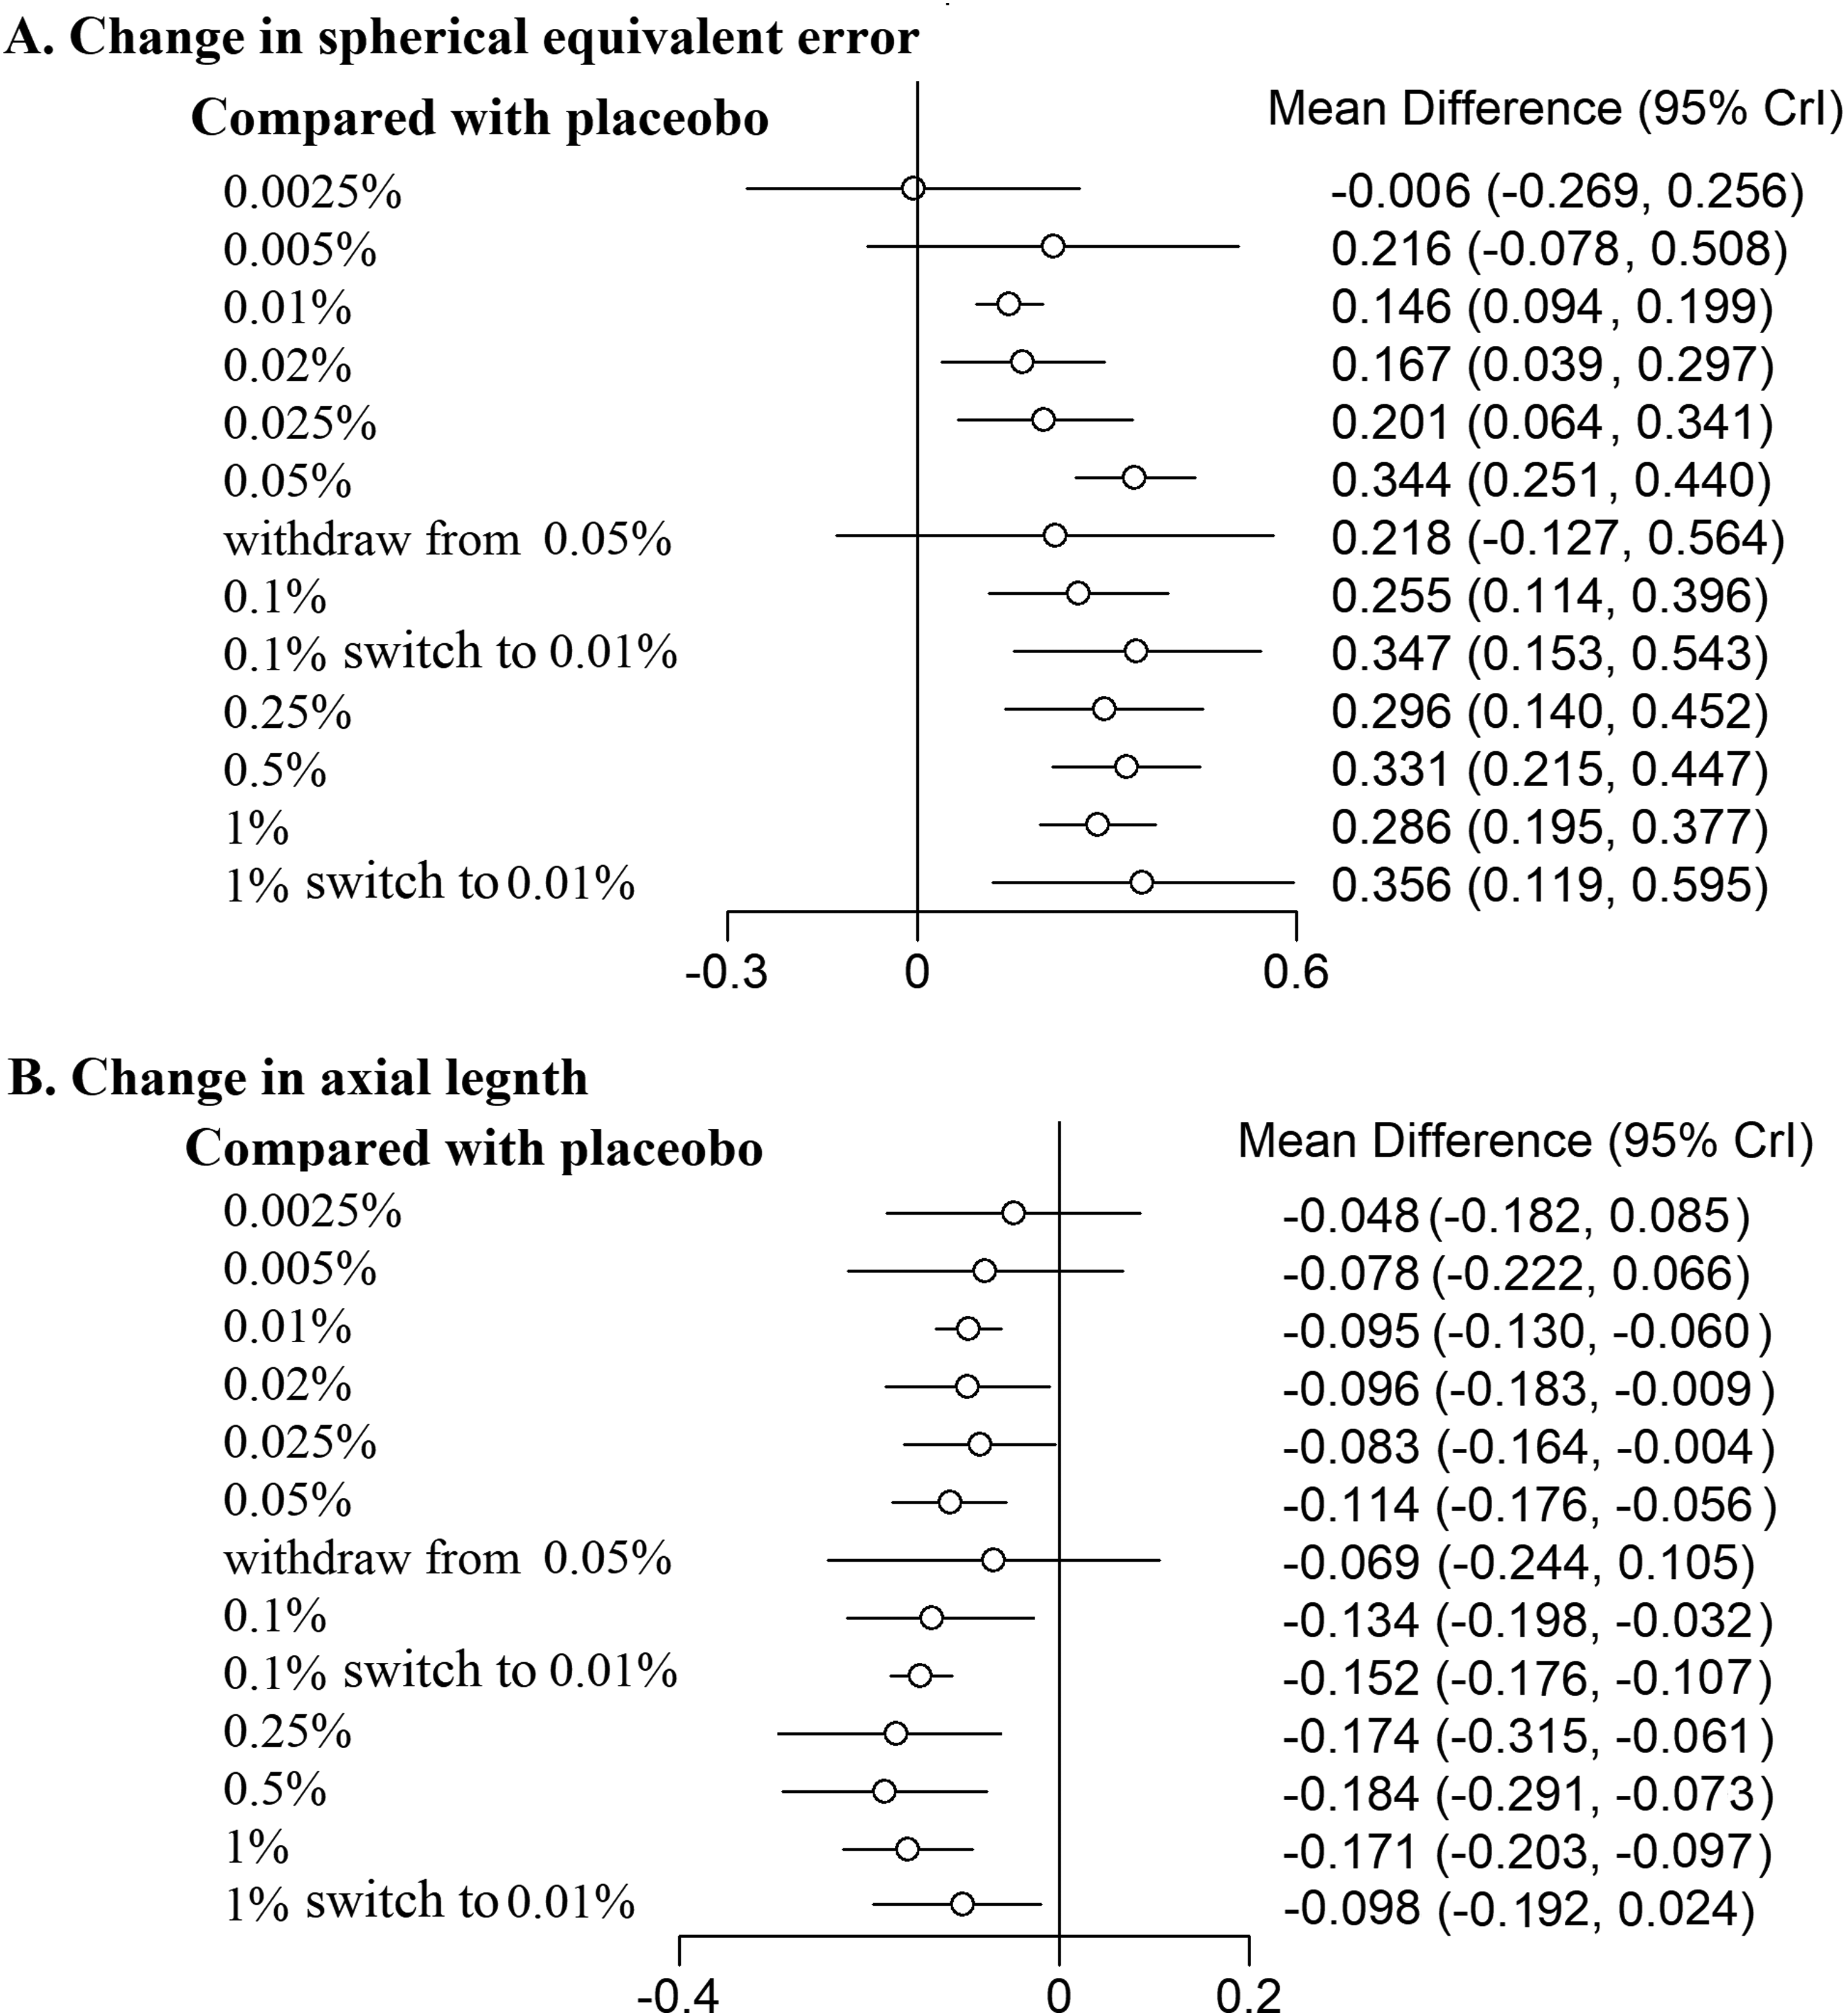
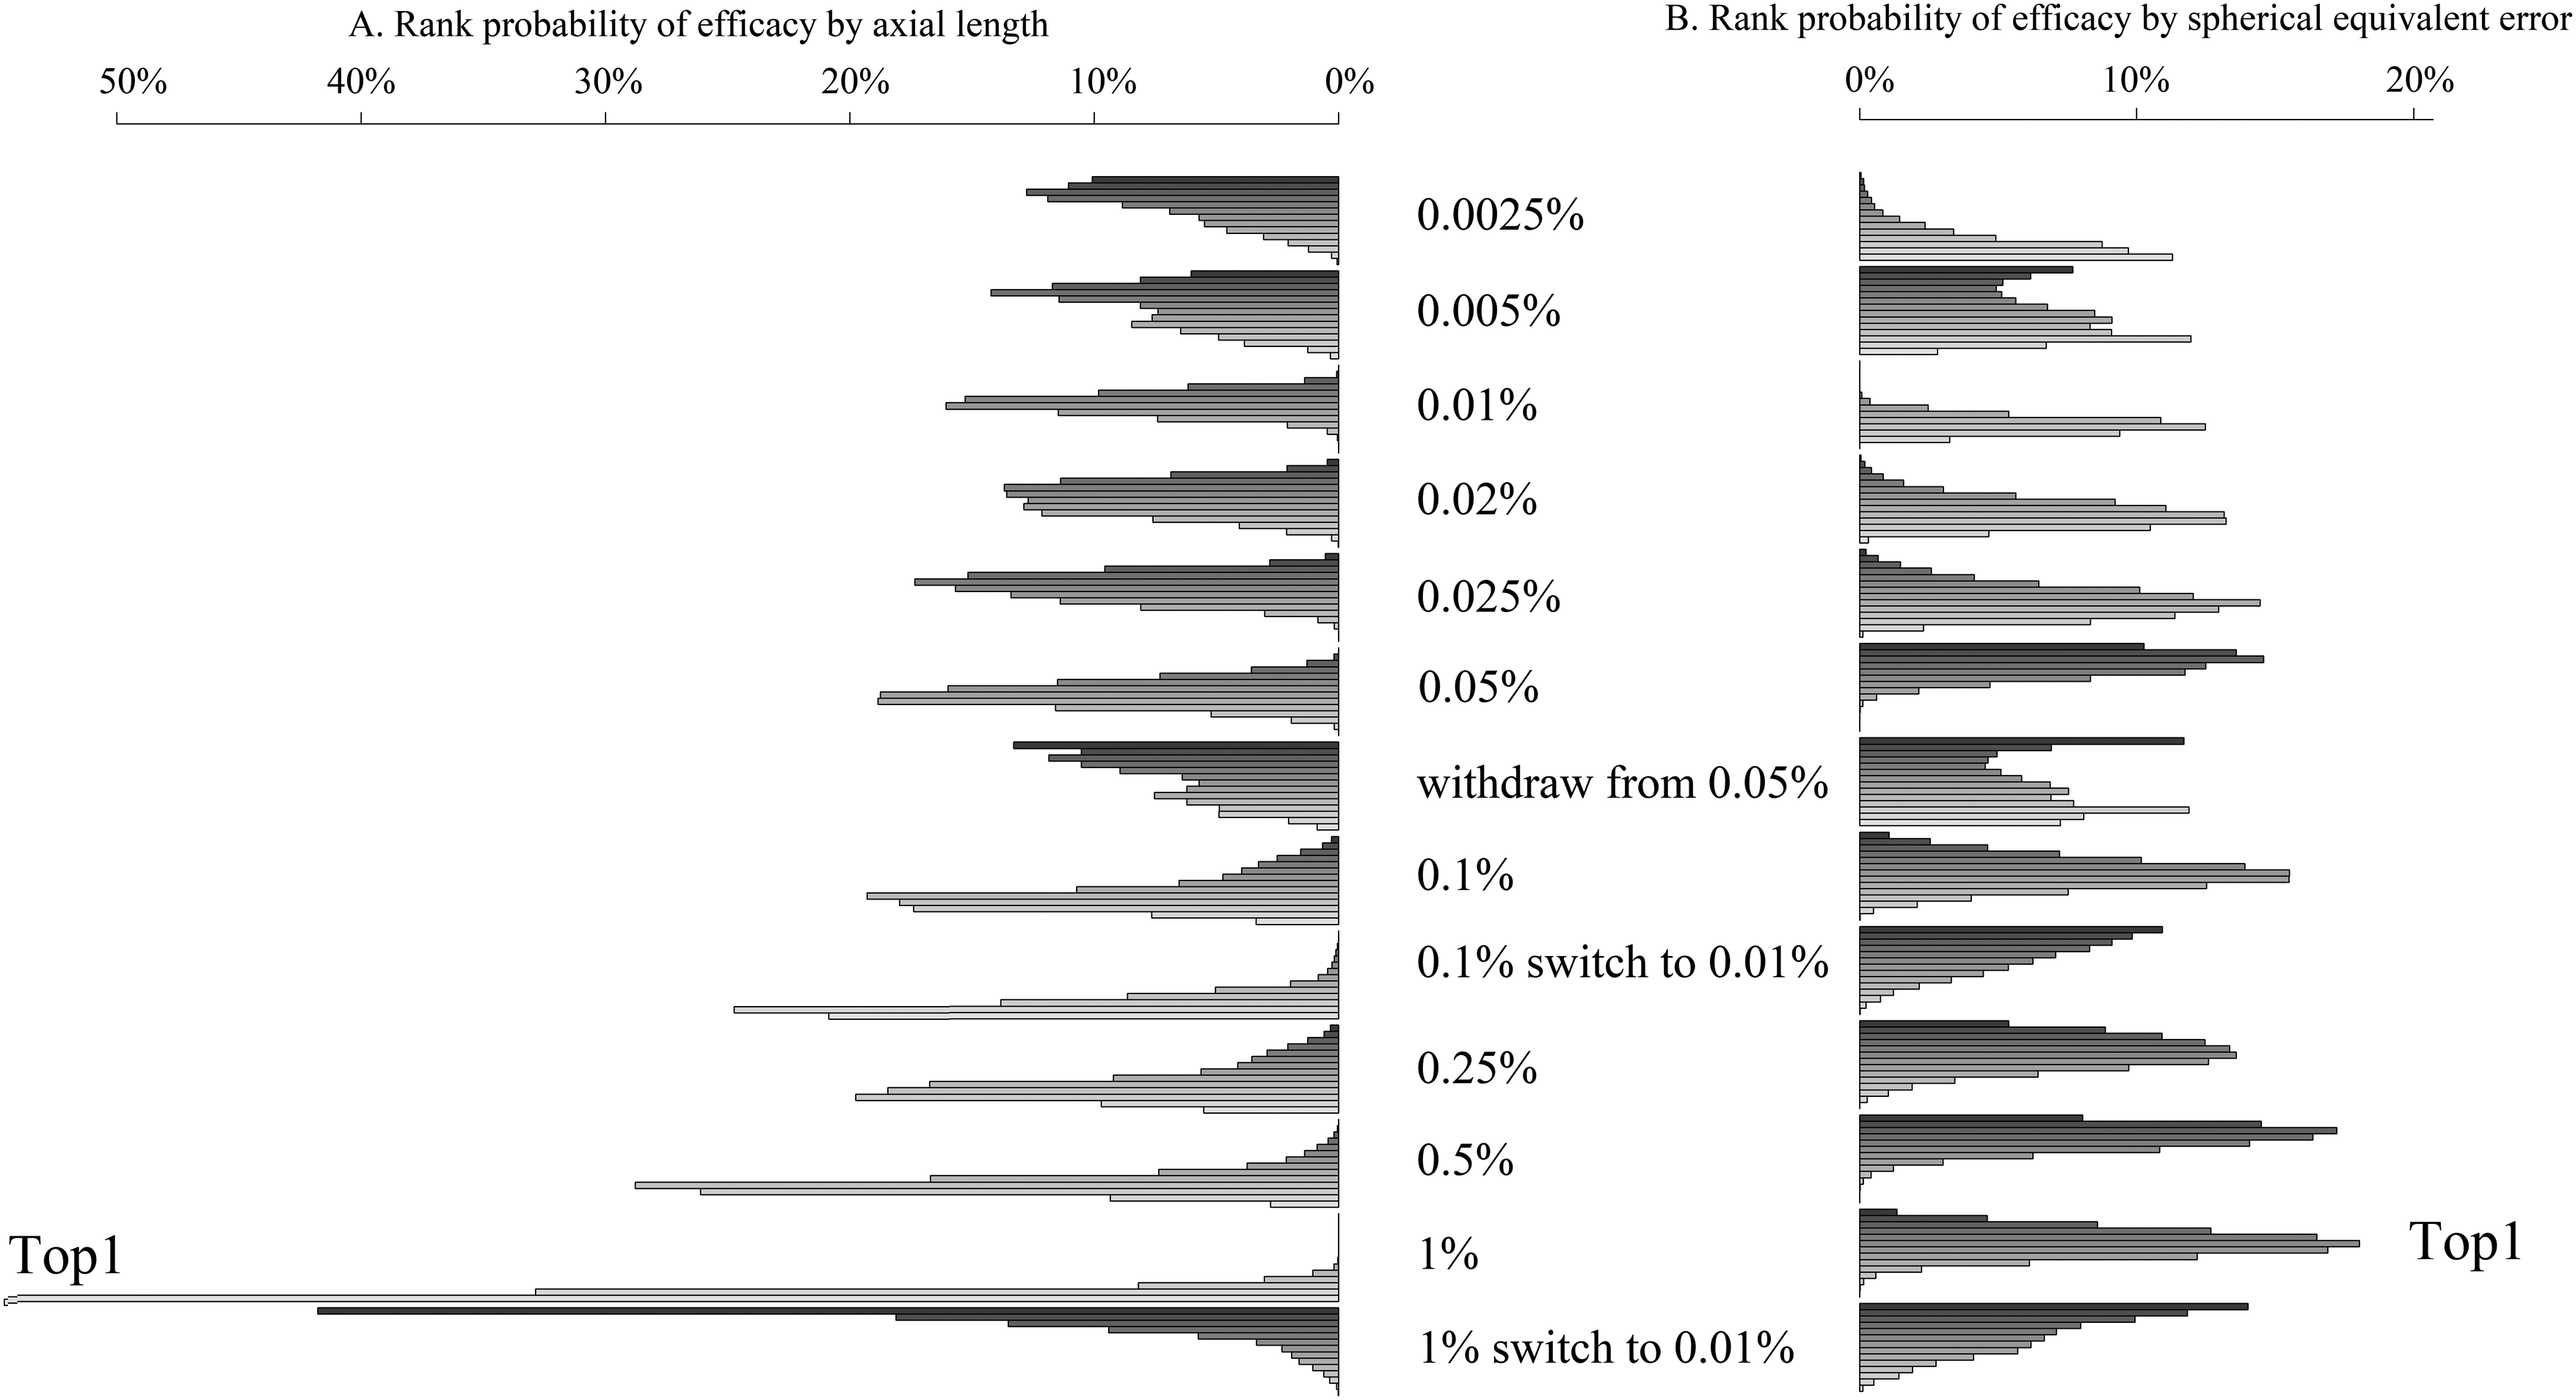
For loading dose (0.1% switch to 0.01%), the MD is 0.347 (0.153, 0.543). For loading dose (1% switch to 0.01%), the MD is 0.356 (0.119, 0.595).
Comparison on change in SER among atropine groups and the placebo
Comparing ten atropine eyedrops (0.0025%, 0.005%, 0.01%, 0.02%, 0.025%, 0.05%, 0.1%, 0.25%, 0.5% and 1% concentrations) with the placebo, the MDs and 95%CrIs of changes in AL are −0.048 (−0.182, 0.085) mm, −0.078 (−0.222, 0.066) mm, −0.095 (−0.130, −0.060) mm, −0.096 (−0.183, −0.009) mm, −0.083 (−0.164, −0.004) mm, −0.114 (−0.176, −0.056) mm, −0.134 (−0.198, −0.032) mm, −0.174 (−0.315, −0.061) mm, −0.184 (−0.291, −0.073) mm, and −0.171 (−0.203, −0.097) mm, respectively (Figure 3B).
For loading dose (0.1% switch to 0.01%), the MD is −0.152 (−0.176, −0.107). For loading dose (1% switch to 0.01%), the MD is −0.098 (−0.192, 0.024).
Comparison among ten different atropine concentrations
Pairwise comparison on the effect of myopia control was also done for each pair of atropine concentrations (e.g., 0.01% VS. 1%) (Table 2). 0.25%, 0.5%, and 1% performs better than 0.01%, the MDs and CrIs of changes in SER are 0.145 (0.003, 0.454) D, 0.286 (0.194,0.595) D, and 0.311 (0.125, 0.620) D, respectively. The MDs and CrIs of changes in AL are −0.077 (−0.118, −0.036) mm, −0.088 (−0.133, −0.043) mm, −0.095(−0.153,−0.037) mm, respectively.
Pairwise comparison on the effect on spherical equivalent error and axial length among ten concentrations.
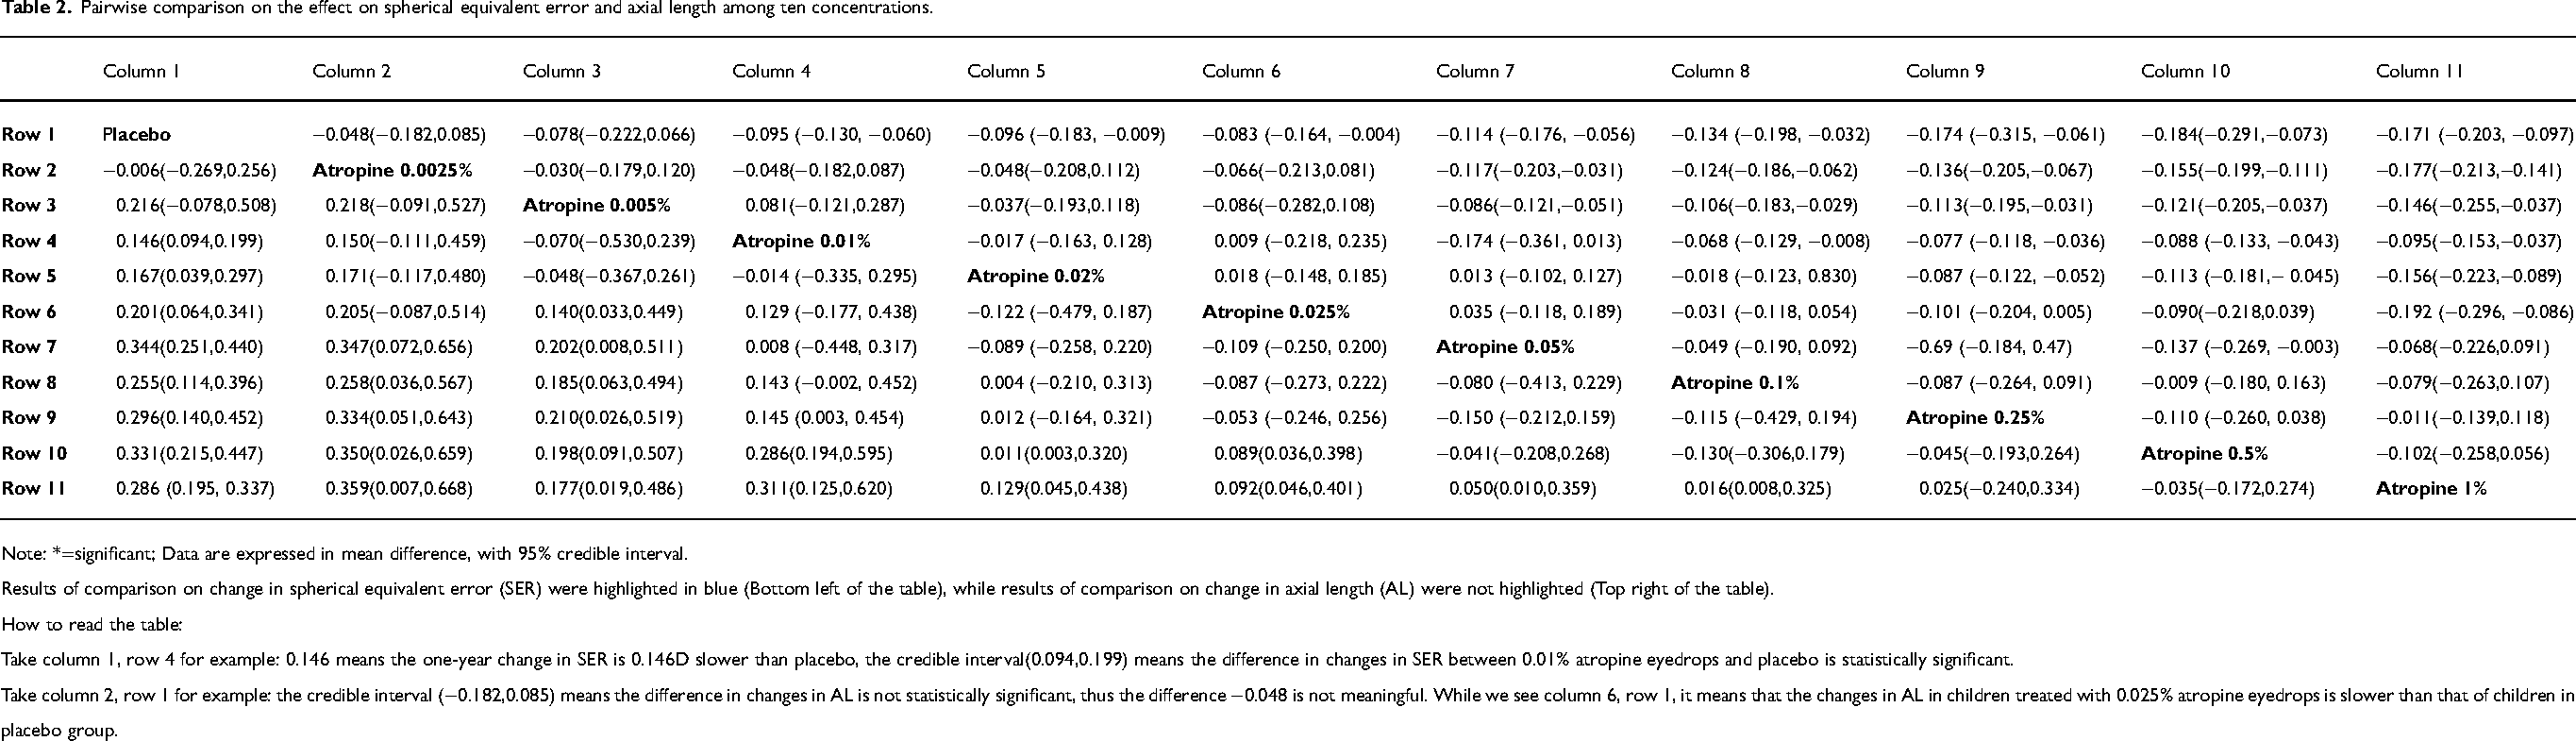
Note: *=significant; Data are expressed in mean difference, with 95% credible interval.
Results of comparison on change in spherical equivalent error (SER) were highlighted in blue (Bottom left of the table), while results of comparison on change in axial length (AL) were not highlighted (Top right of the table).
How to read the table:
Take column 1, row 4 for example: 0.146 means the one-year change in SER is 0.146D slower than placebo, the credible interval(0.094,0.199) means the difference in changes in SER between 0.01% atropine eyedrops and placebo is statistically significant.
Take column 2, row 1 for example: the credible interval (−0.182,0.085) means the difference in changes in AL is not statistically significant, thus the difference −0.048 is not meaningful. While we see column 6, row 1, it means that the changes in AL in children treated with 0.025% atropine eyedrops is slower than that of children in placebo group.
Of the various atropine concentrations currently available, 1% atropine eye drops have the strongest effect on myopia control, whether evaluated using SER or AL (Figure 3).
Discussion
This systematic review and Bayesian network meta-analysis aims at evaluating the effect of atropine eyedrops at ten different concentrations for myopia control. The main findings are: 0.01% and higher concentration are all effective. Concentrations of 0.25%, 0.5%, and 1% may have stronger effect than 0.01%, and 1% concentration may be the most effective one.
There has been controversy about the effect of low concentration atropine on myopia control: Repka MX 42 et al. Reported that 0.01% atropine eye drops didn’t help slow myopia progression or axial elongation in US children. Usmani E 47 et al. reported a similar finding in a real-word observation. Conversely, some studies have reported that low concentrations are effective, e.g., Moriche-Carretero M 41 et al. reported through a five-year follow-up that atropine 0.01% is effective in slowing myopia progression in European children. A recent study of Chinese children by Yam JC 8 et al. found that using 0.01% atropine reduced the incidence of myopia by 7.1% over two years. The difference in conclusions between different studies may be caused by the difference in sample size, so we conducted this review. By summarizing existing randomized controlled trials and expanding the sample size, we clarified the issue with a higher certainty that a low concentration of 0.01% is effective.
The mechanism that atropine eyedrops slows myopia progression remains unclear. McBrien NA et al. 48 previously proposed a hypothesis called nonaccommodative mechanism through an experiment, where 16 chicks were monocularly deprived of pattern vision and injected with either atropine or saline. Atropine-injected chicks showed a markedly slower progression of refraction eight days later, which was thought to be associated with the reduction of axial elongation resulting from the vitreous chamber elongation change. Recently, based on another chick model, McBrien NA et al. 48 reported that atropine played a role in myopia progression with the mediation of M4-muscarinic receptor. Other researchers reported that α2-adrenoceptors, 49 M1 muscarinic receptor 50 and Nitric Oxide (NO) 51 might also mediate the atropine-inhibited form-deprivation myopia process. A pig model 52 revealed that scleral remodeling played an important role in the development of myopia. A significant decrease of expression of posterior scleral collagen type I mRNA, as well as a significant decrease of the sclera protein expression, was found in form deprivation pig eyes. Besides, form-deprived eyes showed a significant increase of regulator of G-protein signaling 2 (RGS2) mRNA and protein expression. 53 Atropine treatment was given to these pig eyes later, it turned out that the collagen type I mRNA expression level was significantly increased, and RGS2 mRNA expression level was decreased.
Although this review shows that high concentrations of atropine have the best effect on myopia control, it does not mean that 1% concentration should be clinically preferred. As the concentration increases, the photophobia becomes more severe. Yen MY 25 et al. reported 100% of children who used 1% concentration atropine eye drops developed photophobia. According to Shih YF 26 et al., the incidences of photophobia among children using 0.5%, 0.25% and 0.1% concentration atropines eyedrops were 21.95%, 6.38%, and 0%, respectively. Yam JC 19 et al. reported a similar finding. Even with a low concentration of 0.01% atropine, the annual incidence of photophobia can be as high as 18.9%. 8 It was worth mentioning that photophobia could be minimized by photochromatic lenses, Chua WH 27 and coworkers gave photochromatic lenses to 200 children using 1% atropine eyedrops, none developed photophobia over two years.
Conclusions
0.01% and higher concentration atropine eyedrops are all effective for myopia control. Concentrations of 0.25%, 0.5%, and 1% may have stronger effect than 0.01%. 1% concentration ranks first in efficacy.
Footnotes
Author contributions
Conception and design: Xiu-Hua Wan
Administrative support: Xiu-Hua Wan
Provision of study materials or patients: Jin-Da Wang, Mei-Rui Liu, Changxi-Chen, Yun Zhang
Collection and assembly of data: Jin-Da Wang, Mei-Rui Liu, Kai Cao, Yun Zhang, Xiao-Hong Zhu
Data analysis and interpretation: Kai Cao, Xiao-Hong Zhu
Manuscript writing: All authors
Final approval of manuscript: All authors.
Declaration of conflicting interests
The authors declared no potential conflicts of interest with respect to the research, authorship, and/or publication of this article.
Ethic statement
Ethic approval and consent are not applicable.
Funding
The authors received no financial support for the research, authorship, and/or publication of this article.
Supplemental material
Supplemental material for this article is available online.