
Abstract
Purpose
To assess the associations between visual acuity (VA) and retinal thickness in age-related macular degeneration (AMD) eyes treated with anti-vascular endothelial growth factor (VEGF) therapy.
Methods
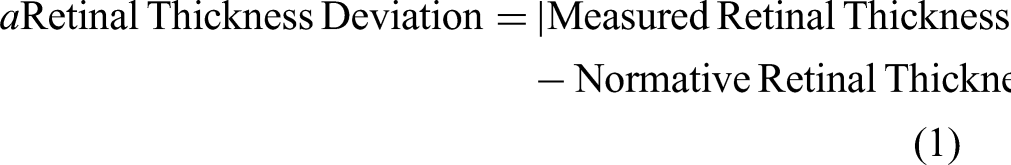
Sixty-eight patients with neovascular AMD (68 eyes) undergoing anti-VEGF therapy with two years of follow-up imaging data after the initiation of treatment were retrospectively included. Linear and nonlinear regression analyses with curve fitting estimation were performed to explore the relationship between visual acuity and OCT-based parameters at the 3-month and 24-month follow-up visits. Regression analyses were also performed between visual acuity and the retinal thickness deviation which was calculated as the absolute value of the difference between measured and normative retinal thickness values.
Results
The VA was not associated with either foveal (R2 = 0.011 and p = .401 at 3 months; R2 = 0.032 and p = .142 at 24 months) or parafoveal (R2 = 0.045 and p = .081 at 3 months; R2 = 0.050 and p = .055 at 24 months) retinal thicknesses. Compared with the linear models, a quadratic function yielded a relative increase in the R2 coefficients. Conversely, the VA was linearly associated with foveal retinal thickness deviation (R2 = 0.041 and p = .037 at 24 months) and parafoveal retinal thickness deviation (R2 = 0.062 and p = .040 at 3 months; R2 = 0.088 and p = .014 at 24 months) values.
Conclusions
Although there was no linear relationship between retinal thickness and VA, a weak but statistically significant linear relationship could be observed when a retinal thickness deviation was considered. This suggests that deviation-based parameters may be beneficial for structure-function correlations in the context of anti-VEGF therapy for neovascular AMD.
Keywords
Introduction
Age-related macular degeneration (AMD) represents the leading cause of visual impairment among subjects older than 50 years, with around 200,000 new cases per year in the United States. 1 Severe vision loss in AMD may be the result of the development of exudative macular neovascularization (MNV), the latter condition commonly termed “neovascular exudative AMD”.2–4 Notably, exudation from MNV may irreversibly impair the central vision as a result of the damage to photoreceptors and retinal pigment epithelium (RPE).5,6
The introduction of anti-vascular endothelial growth factor (anti-VEGF) therapy has dramatically transformed the care of patients with neovascular exudative AMD and this treatment is currently considered as the gold standard. At present, there are multiple intravitreal anti-VEGF agents which are available for use in clinical practice. The efficacy and safety of these anti-VEGF therapies has been evaluated in large clinical trials demonstrating that this therapy is associated with visual improvement in eyes with neovascular AMD.7–12
Although visual acuity has been considered as the primary outcome measure in most clinical trials and studies assessing the efficacy of anti-VEGF therapies, OCT-derived anatomical measures have been commonly used to confirm the effect of these drugs on the retina of neovascular AMD patients. Specifically, quantitative measurements of retinal thickness and qualitative assessment of retinal fluid on OCT B-scan images have been employed as secondary efficacy outcomes in many clinical trials. 13 Furthermore, structural OCT is routinely used in clinical practice to quantify the response to treatment and to assess the presence of intraretinal fluid (IRF), subretinal fluid (SRF), and subretinal hyperreflective material (SHRM) which may represent OCT signs of MNV exudation. 14
Although the relevance of retinal thickness measurements in assessing the drying efficacy of anti-VEGF agents is well-established, the relationship between retinal thickness and visual acuity has been inconsistent and remains uncertain. 15 Establishing the relationship between anatomical and functional parameters is essential to better understand the pathophysiology of AMD and the mechanisms of vision loss. Therefore, the aim of this study was thus to further explore the relationship between structural OCT retinal thickness metrics and visual acuity values in patients with neovascular exudative AMD treated with intravitreal anti-VEGF injections.
Methods
Study participants
In this retrospective study, consecutive subjects 50 years of age and older with exudative neovascular AMD during the period between January 2018 and December 2019 were identified from the medical records of the “Medical Retina Unit” at “Città della Salute e della Scienza” hospital, University of Turin, Turin, Italy. The study was approved by local Ethics Committee and the researched adhered to the 1964 Helsinki declaration and its later amendments.
The diagnosis of neovascular exudative AMD was based on clinical and imaging assessment, according to criteria which were previously reported. 16 The following exclusion criteria were adopted: (i) evidence of complications associated with neovascular AMD including massive subretinal hemorrhage, vitreous hemorrhage, and RPE tear 17 ; (ii) previous vitreoretinal procedure in the study eye; (iii) presence of other macular (e.g., vitreoretinal disorders) and/or optic nerve (e.g., glaucoma) pathologic conditions. These conditions were excluded as they may have an impact on the OCT metrics.
In addition to be included in this analysis, subjects had to have at least three clinical assessments with OCT imaging every year over a period of two years following the initiation of anti-VEGF treatment. The clinical assessment after the loading phase of anti-VEGF therapy was considered as the 3-month follow-up visit in our analysis. As part of the analysis, a second visit occurring after a period of 2 years of ongoing follow-up examinations, subsequent to the commencement of anti-VEGF therapy, was incorporated to offer a more comprehensive evaluation of the retinal changes. The patients involved in the study received intravitreal injections of bevacizumab, ranibizumab, or aflibercept as anti-VEGF treatment. The administration of these injections followed either a pro re nata (PRN) or treat and extend regimen, which was determined by the treating physician's discretion. Patients undergoing treatment with a PRN regimen were retreated when evidence of IRF or SRF, or a change in SHRM thickness/reflectivity was observed.
The final study cohort of analyzed patients consisted of 68 subjects (68 eyes).
The Heidelberg Spectralis HRA + OCT was utilized for performing OCT imaging. A volumetric scan protocol was employed, consisting of 19 horizontal B-scans. Each B-scan was averaged 24 times, and the scan area covered approximately 5.5 × 4.5 mm (20°×15°). In order to be included in the analysis, the scans needed to meet a minimum quality index of 25, as recommended by the manufacturer. 18
Visual acuities were tested with decimal charts and transformed to LogMAR (logarithm of the minimal angle of resolution) values for analysis.
OCT grading
Two independent readers (GB and FG) initially reviewed the structural OCT images during the baseline study visit to determine eligibility. They also evaluated the OCT images to identify the type of MNV (macular neovascularization). All grading was conducted in a manner that ensured independence and masking of the readers, meaning they were unaware of each other's assessments. Following this, the two readers convened to evaluate the agreement in their grades. Any discrepancies were resolved through further discussion and open adjudication, aiming to reach a unified outcome for each case. If the two readers were unable to reach a consensus on a single result, a third senior retinal expert (EB) made the final decision.
Quantitative measurements were obtained by analyzing the images as well. In particular, the retinal thickness within the ETDRS (Early Treatment Diabetic Retinopathy Study) grid centered over the fovea was measured using the software of the Spectralis instrument. 19 The measurements were automatically averaged within specific subfields. These subfields included the central fovea subfield, which has a diameter of 1 mm, and the four inner ETDRS subfields located between 1 and 3 mm in diameter. The software utilized an algorithm to automatically identify the inner limiting membrane (ILM) and Bruch's membrane, and then calculated the retinal thickness between these two boundaries. Based on this definition of the boundaries, it is important to recognize that the retinal thickness would include not only the neurosensory retina (and IRF) but also the RPE, and any SRF, SHRM, and pigment epithelial detachment (PED). However, in accordance with the manufacturer's definition, we will continue to refer to this as “retinal thickness” in this analysis. Before computing the thickness values, the graders evaluated all B-scans and manually corrected any segmentation or decentration errors.
To measure the extent of deviation in retinal thickness from age-adapted normative values obtained using the Heidelberg Spectralis device, we introduced a new quantitative metric called “retinal thickness deviation.” This metric was calculated by taking the absolute value of the difference between the measured retinal thickness and the normative retinal thickness values, which were obtained from a previous study,
20
as indicated in the following formula:
Statistical analysis
Statistical calculations were performed using Statistical Package for Social Sciences (version 20.0, SPSS Inc., Chicago, IL, USA). To detect departures from the normality distribution, a Shapiro-Wilk's test was performed for all variables.
All quantitative variables were reported as mean and standard deviation (SD) in the Results section and tables. Comparisons between study visits were conducted using a paired-samples T test.
To explore the association between visual acuity and structural OCT variables, we first computed a linear regression analysis. Models investigated the relationship between visual acuity and mean retinal thickness in the different sub-fields. In addition, we did perform a stepwise multiple regression analysis introducing age and gender as covariates to adjust the regression models for these potential confounding factors.
Subsequently, we investigated different nonlinear regression models (i.e., linear, quadratic, logarithmic, inverse, and cubic) with curve fitting in order to explore the association between visual acuity and structural OCT metrics (i.e., including deviation values). For each model, the R2 coefficient was calculated in order to measure the “goodness of fit”. Since the conversion of decimal visual acuity measurements to logMAR values may produce an overestimation of true values, 21 decimal values were considered in the regression analyses.
A p value of 0.05 was considered to be statistically significant.
Results
Sixty-eight eyes from 68 neovascular AMD subjects (31 males) met the inclusion criteria and were included in this analysis. Mean ± SD age was 79.2 ± 7.1 years [range: 60.0–92.0 years].
Mean ± SD anti-VEGF injections received in the study eye by the 24-month follow-up visit was 10.2 ± 3.2 [range 4–17 injections]. Initially, aflibercept was administered to 45 out of 68 eyes (66.2%), whereas ranibizumab was initially given to 21 eyes (30.9%), and bevacizumab to 2 eyes (2.9%). During the follow-up period, 4 out of the 45 eyes initially treated with aflibercept were switched to ranibizumab, while 6 out of the 21 cases initially treated with ranibizumab were switched to aflibercept. There were no switches observed in the two cases treated with bevacizumab throughout the follow-up. Thirty out of 68 eyes (44.1%) were affected by type 1 MNV, while 21 (30.9%) and 17 (25.0%) eyes were affected by type 3 and type 2 MNV, respectively.
Table 1 summarizes the clinical characteristics of this study cohort. BCVA was 0.59 ± 0.54 logMAR (Snellen equivalent of approximately 20/80) at baseline, 0.47 ± 0.34 logMAR (Snellen equivalent of approximately 20/63) at the 3-month follow-up visit (p = .041 vs. baseline visit), and 0.56 ± 0.43 logMAR (Snellen equivalent of approximately 20/80) at the 24-month follow-up visit (p = .106 vs. 3-month follow-up visit) (Table 1). The foveal retinal thickness was 512.3 ± 232.2 μm at the baseline visit, 408.0 ± 120.1 μm at the 3-month follow-up visit (p < .0001 vs. baseline visit), and 356.4 ± 136.2 μm in the 24-month follow-up visit (p = .003 vs. 3-month follow-up visit) (Table 1). The parafoveal retinal thickness was 421.7 ± 53.9 μm at baseline, and 385.8 ± 81.0 μm and 356.4 ± 77.9 μm at the 3-month (p < .0001 vs. baseline visit) and 24-month (p = .003 vs. 3-month follow-up visit) follow-up visits, respectively (Table 1).
Clinical characteristics of AMD patients at different follow-up visits.
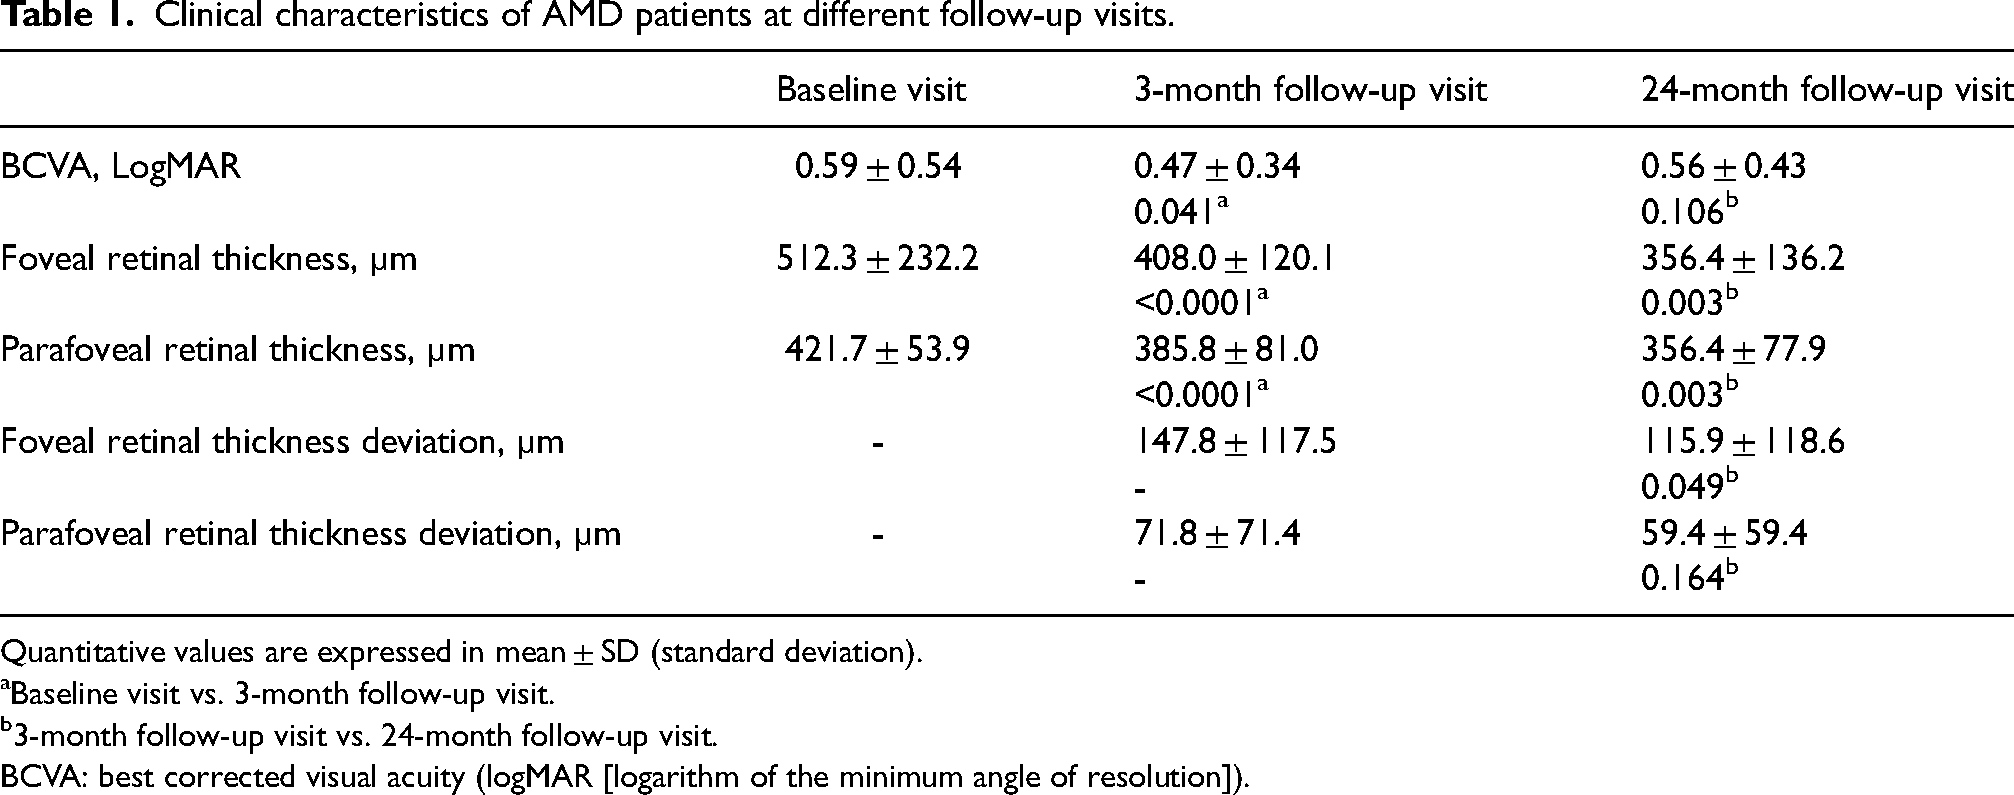
Quantitative values are expressed in mean ± SD (standard deviation).
Baseline visit vs. 3-month follow-up visit.
3-month follow-up visit vs. 24-month follow-up visit.
BCVA: best corrected visual acuity (logMAR [logarithm of the minimum angle of resolution]).
Retinal thickness and visual acuity
Linear regression analysis
In the univariate analysis, there was no statistically significant relationship between the follow-up BCVA and either the foveal retinal thickness (R2 = 0.011, β = −0.104 and p = .401 at the 3-month follow-up visit; R2 = 0.032, β = −0.180 and p = .142 at the 24-month follow-up visit) or the parafoveal retinal thickness (R2 = 0.045, β = −0.231 and p = .081 at the 3-month follow-up visit; R2 = 0.050, β = −.240 and p = .055 at the 24-month follow-up visit) (Figure 1, Supplemental Table 1). In the multiple regression analysis carried out to adjust for covariates, the estimates were moderately unchanged (Table 2).
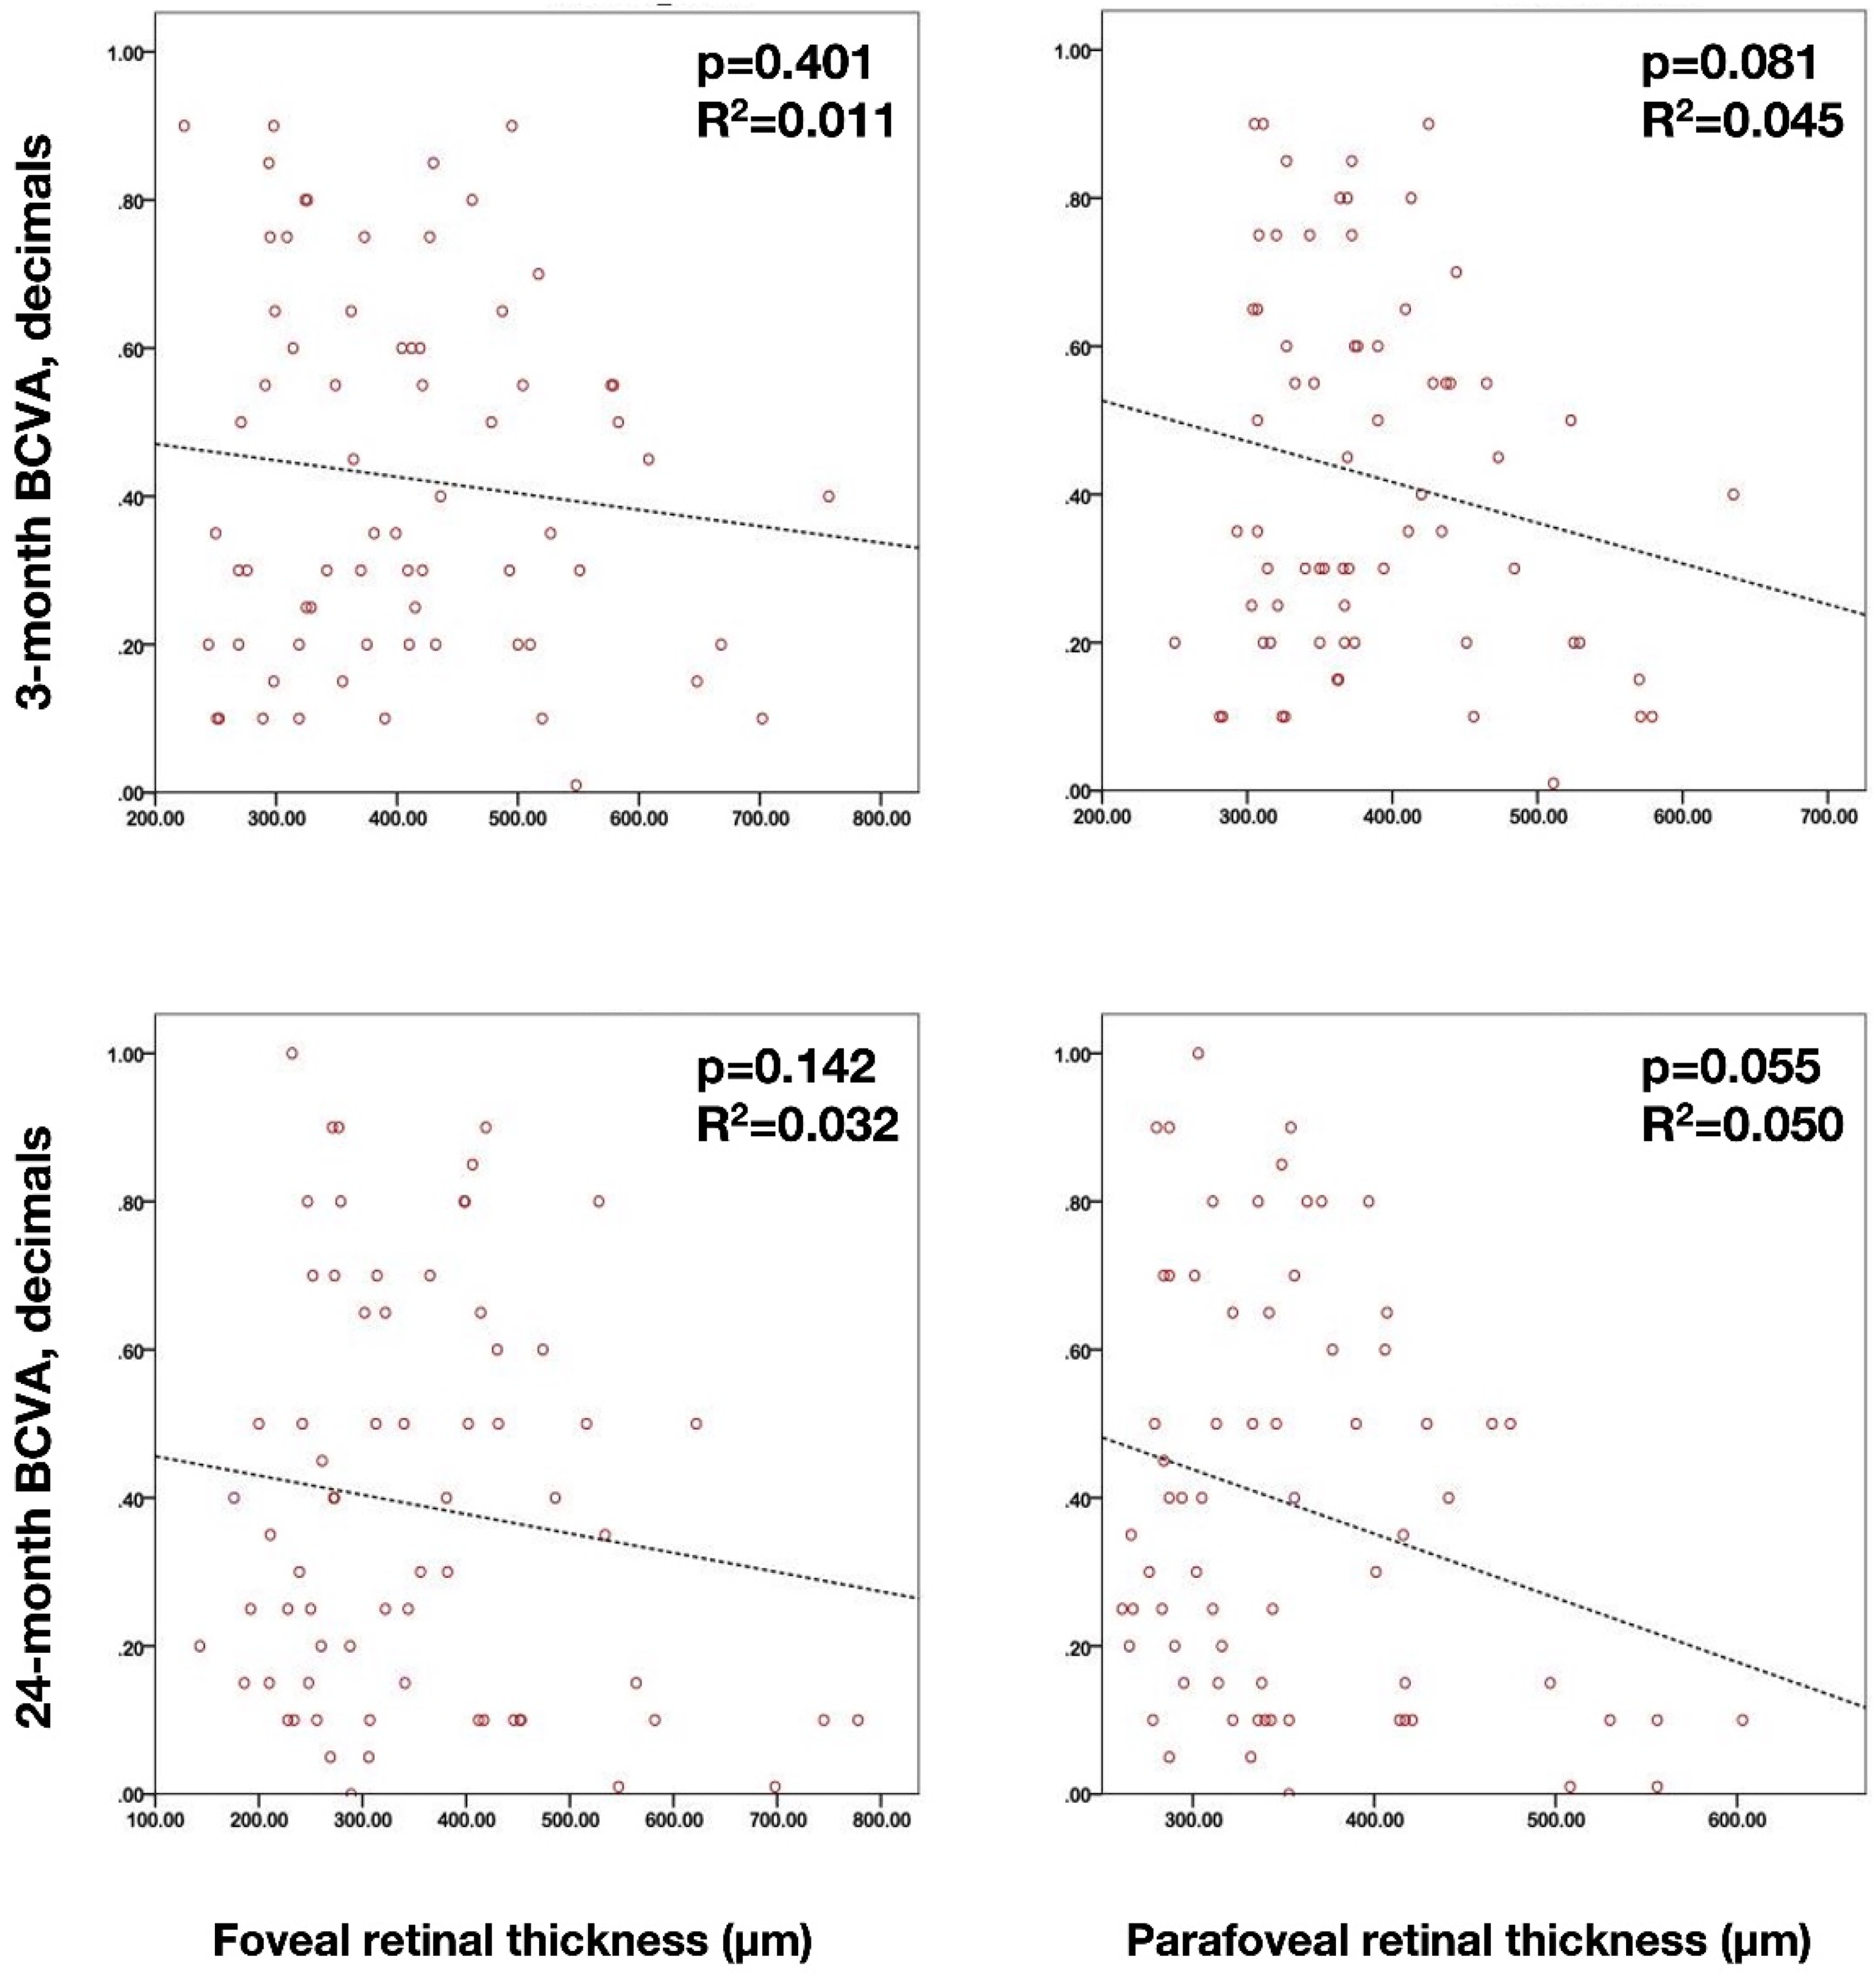
Scatterplots illustrating univariate linear regression analysis between the best corrected visual acuity (BCVA - set as dependent variable) and the foveal and parafoveal retinal thicknesses. (Upper scatterplots) Relationship between 3-month BCVA and retinal thickness in the foveal (left – p = .401) and parafoveal (right – p = .081) regions. (Lower scatterplots) Relationship between 24-month BCVA and retinal thickness in the foveal (left – p = .142) and parafoveal (right – p = .055) regions.
Results of multiple linear regression analysis of the association between visual acuity and other parameters.
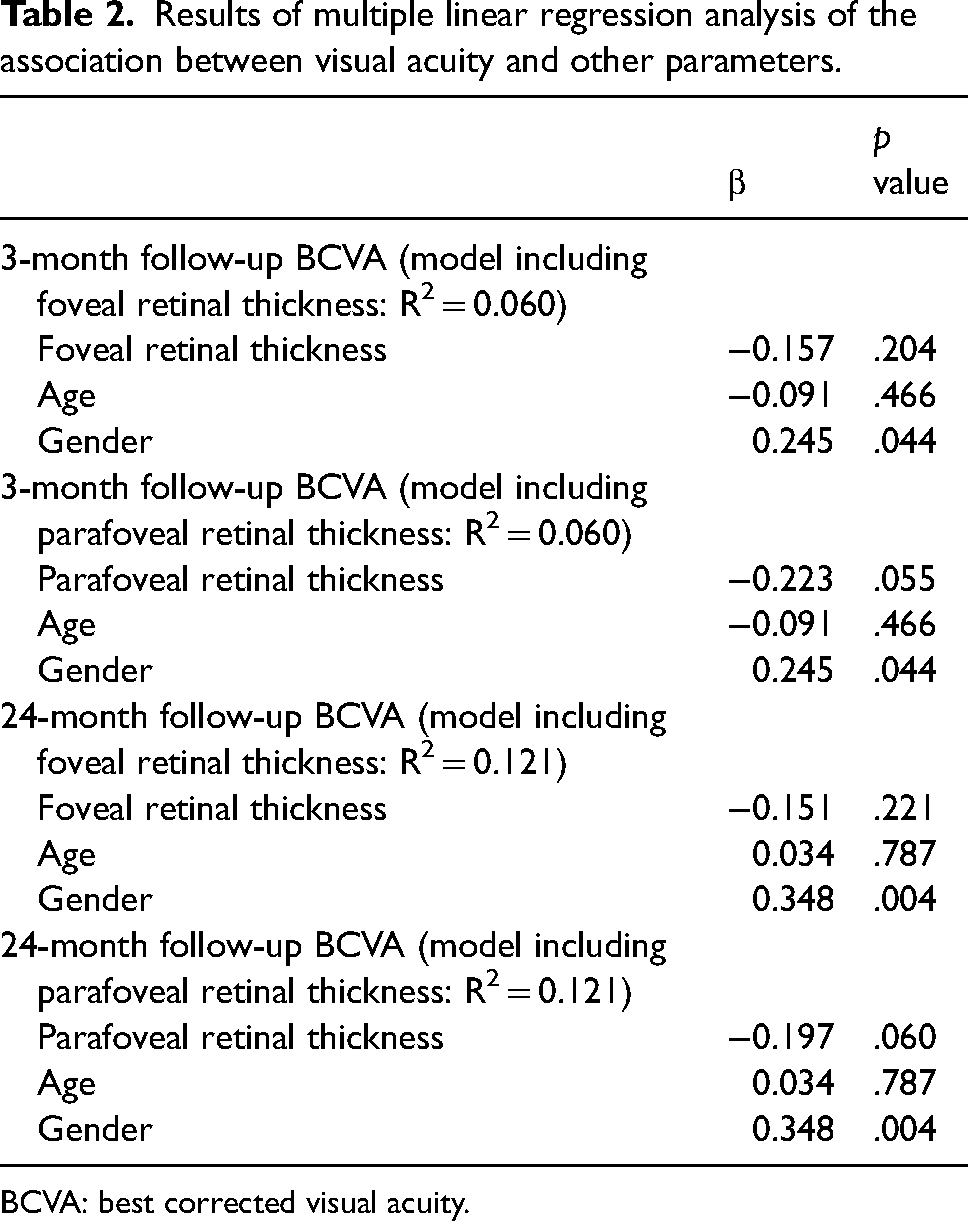
BCVA: best corrected visual acuity.
Nonlinear regression analysis
Nonlinear regression analysis demonstrated that the quadratic function provided the best fit between the foveal and parafoveal retinal thicknesses and visual acuity (Supplemental Table 1). An increase in the R2 was obtained by using a quadratic function, as compared with the linear models, which was more evident at the 24-month follow-up visit (Figure 2). In detail, the use of the quadratic function provided statistically significant associations between the two variables except for the foveal thickness at the 3-month follow-up visit (Figure 2).
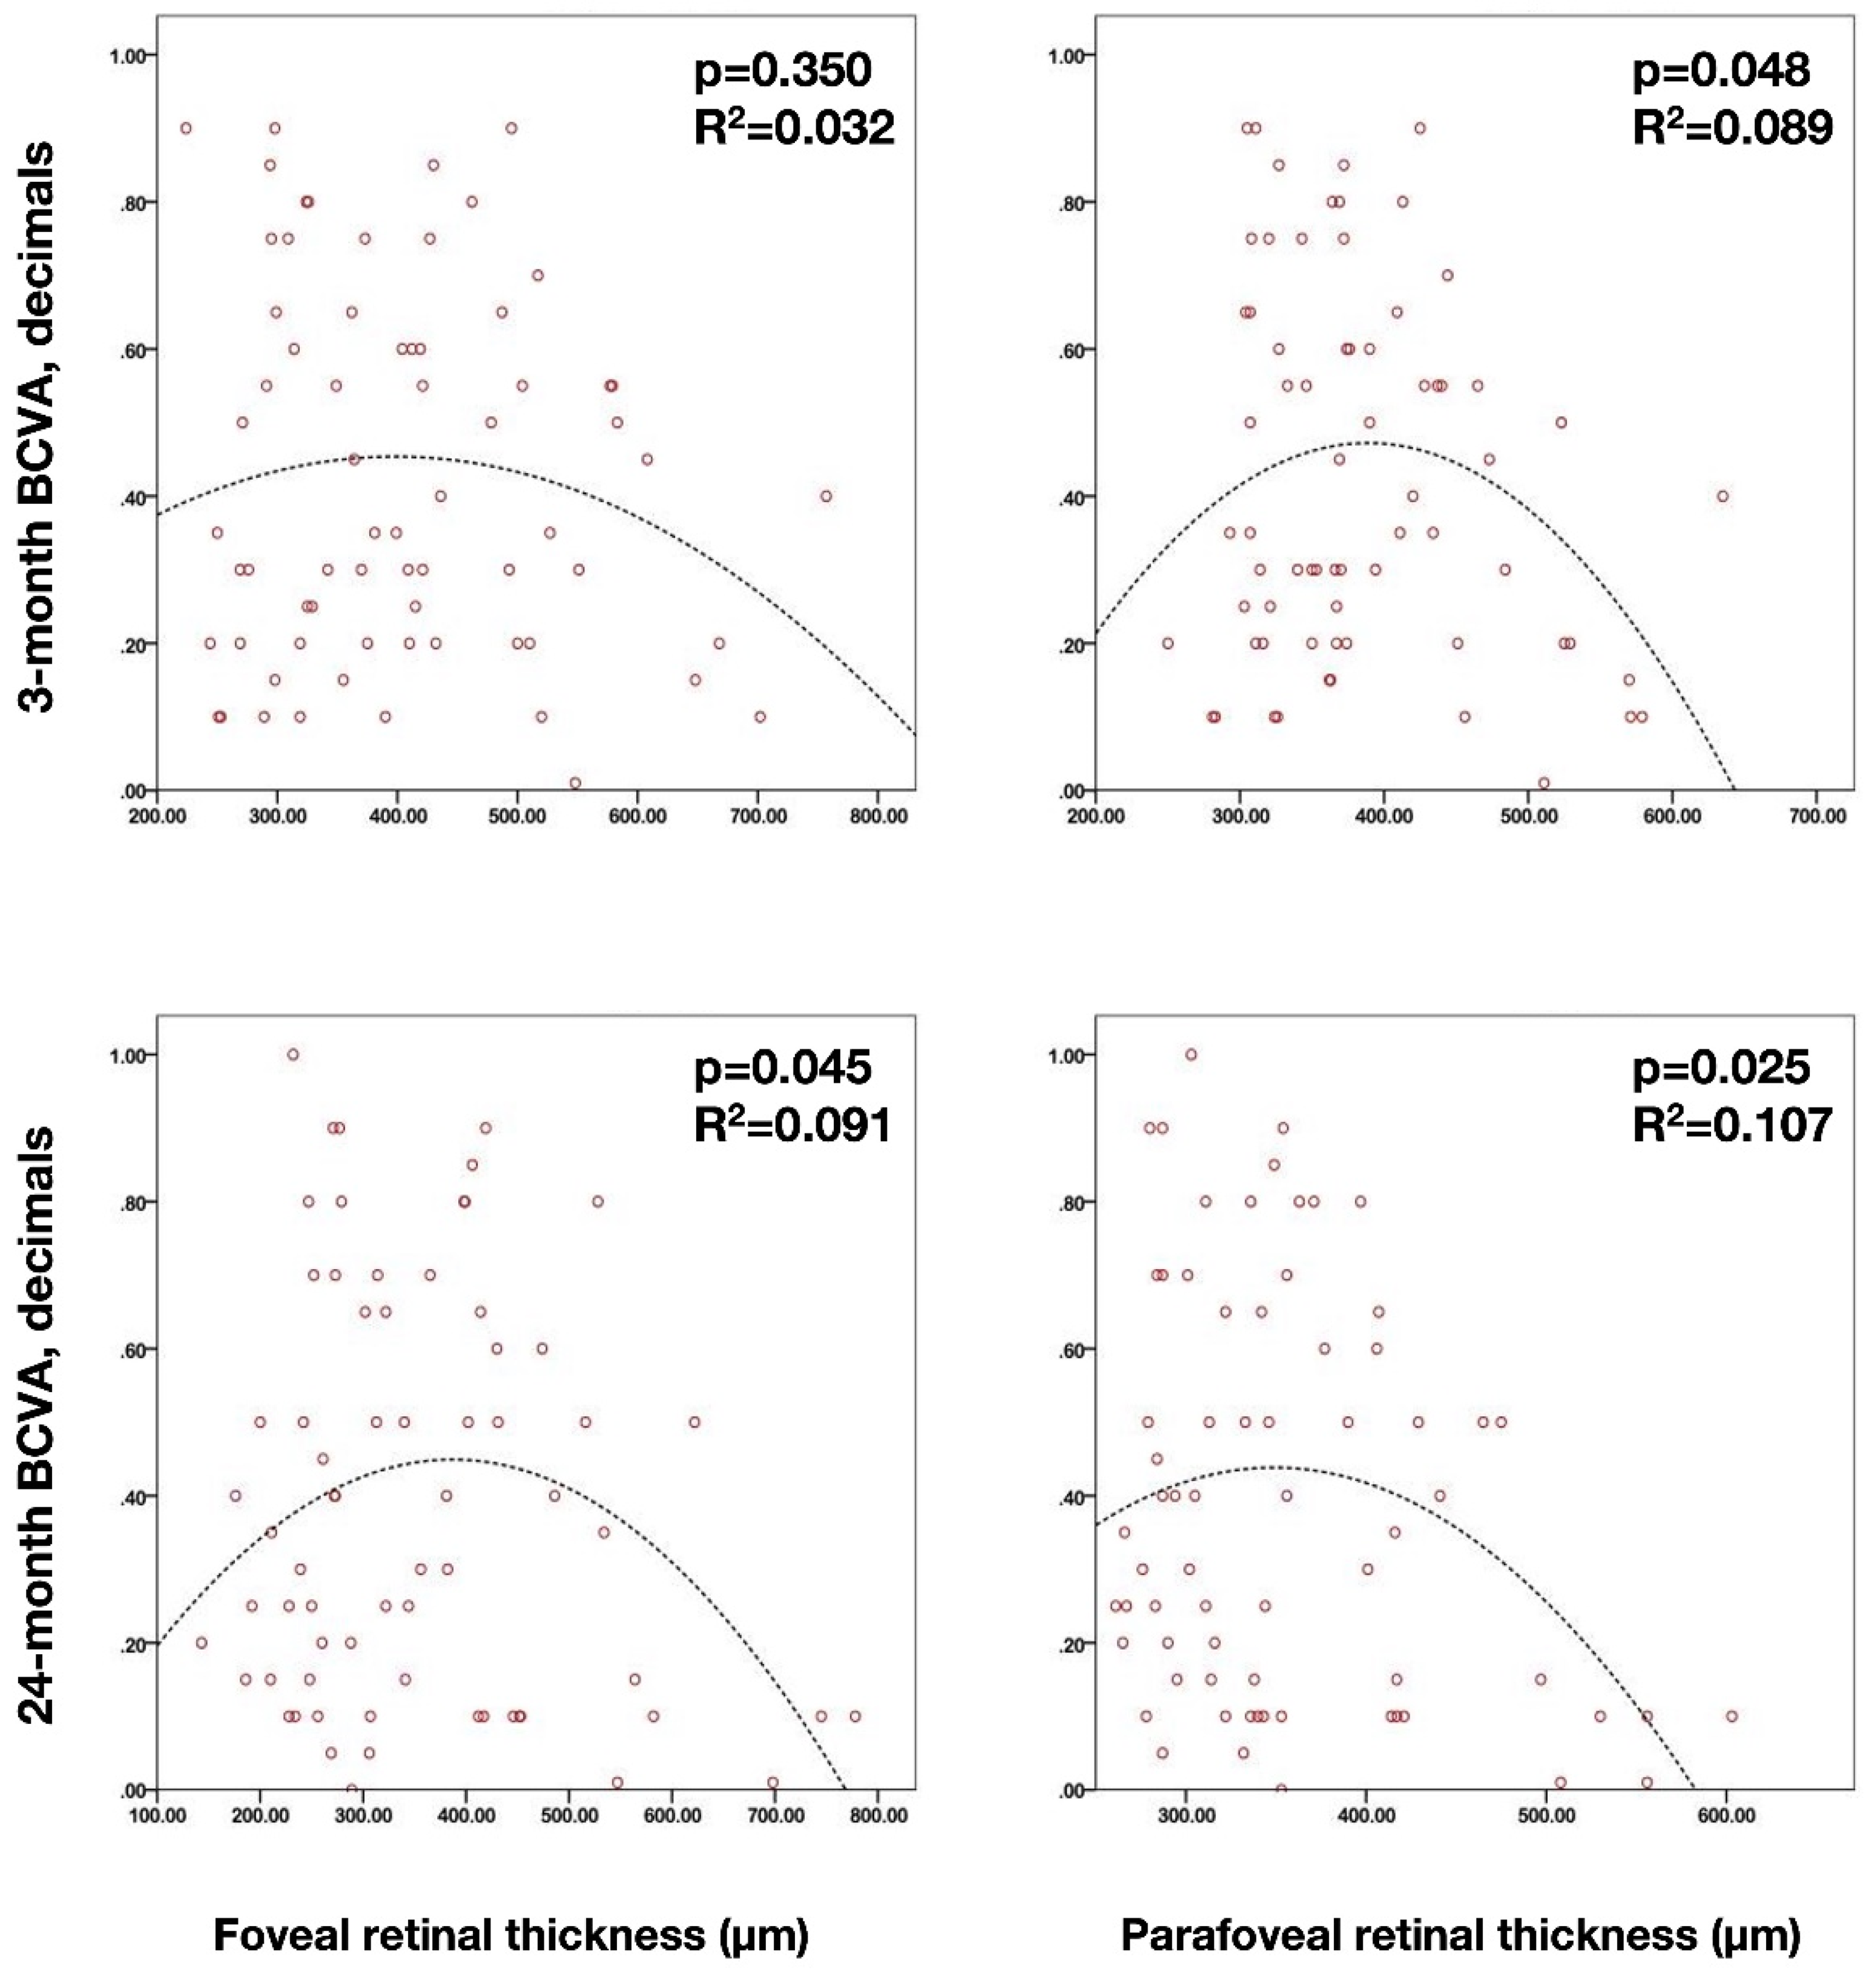
Scatterplots illustrating nonlinear quadratic regression analysis between the best corrected visual acuity (BCVA - set as dependent variable) and the foveal and parafoveal retinal thicknesses. (Upper scatterplots) Relationship between 3-month BCVA and retinal thickness in the foveal (left – p = .350) and parafoveal (right – p = .048) regions. (Lower scatterplots) Relationship between 24-month BCVA and retinal thickness in the foveal (left – p = .045) and parafoveal (right – p = .025) regions.
Retinal thickness deviation and visual acuity
Linear and nonlinear regression analyses
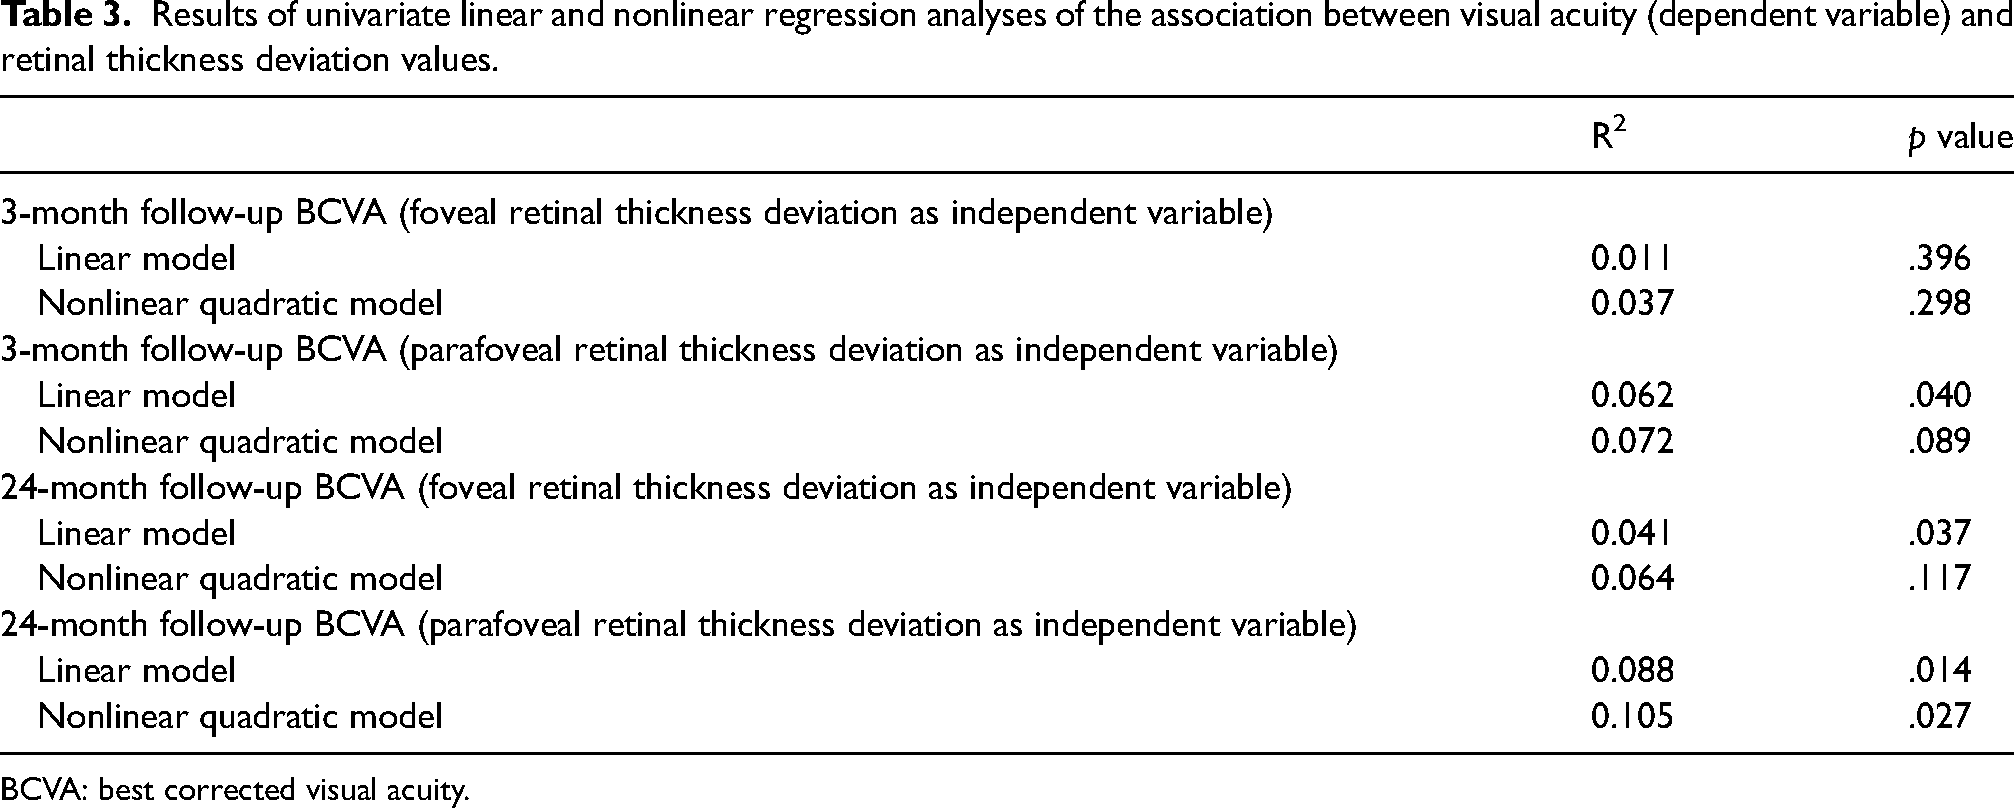
The results of the univariate linear and nonlinear quadratic regressions are summarized in Table 3. In the univariate analysis, the BCVA was linearly associated with the foveal retinal thickness deviation (R2 = 0.041 and p = .037 at the 24-month follow-up visit) and parafoveal retinal thickness deviation (R2 = 0.062 and p = .040 at the 3-month follow-up visit; R2 = 0.088 and p = .014 at the 24-month follow-up visit) values (Figure 3).
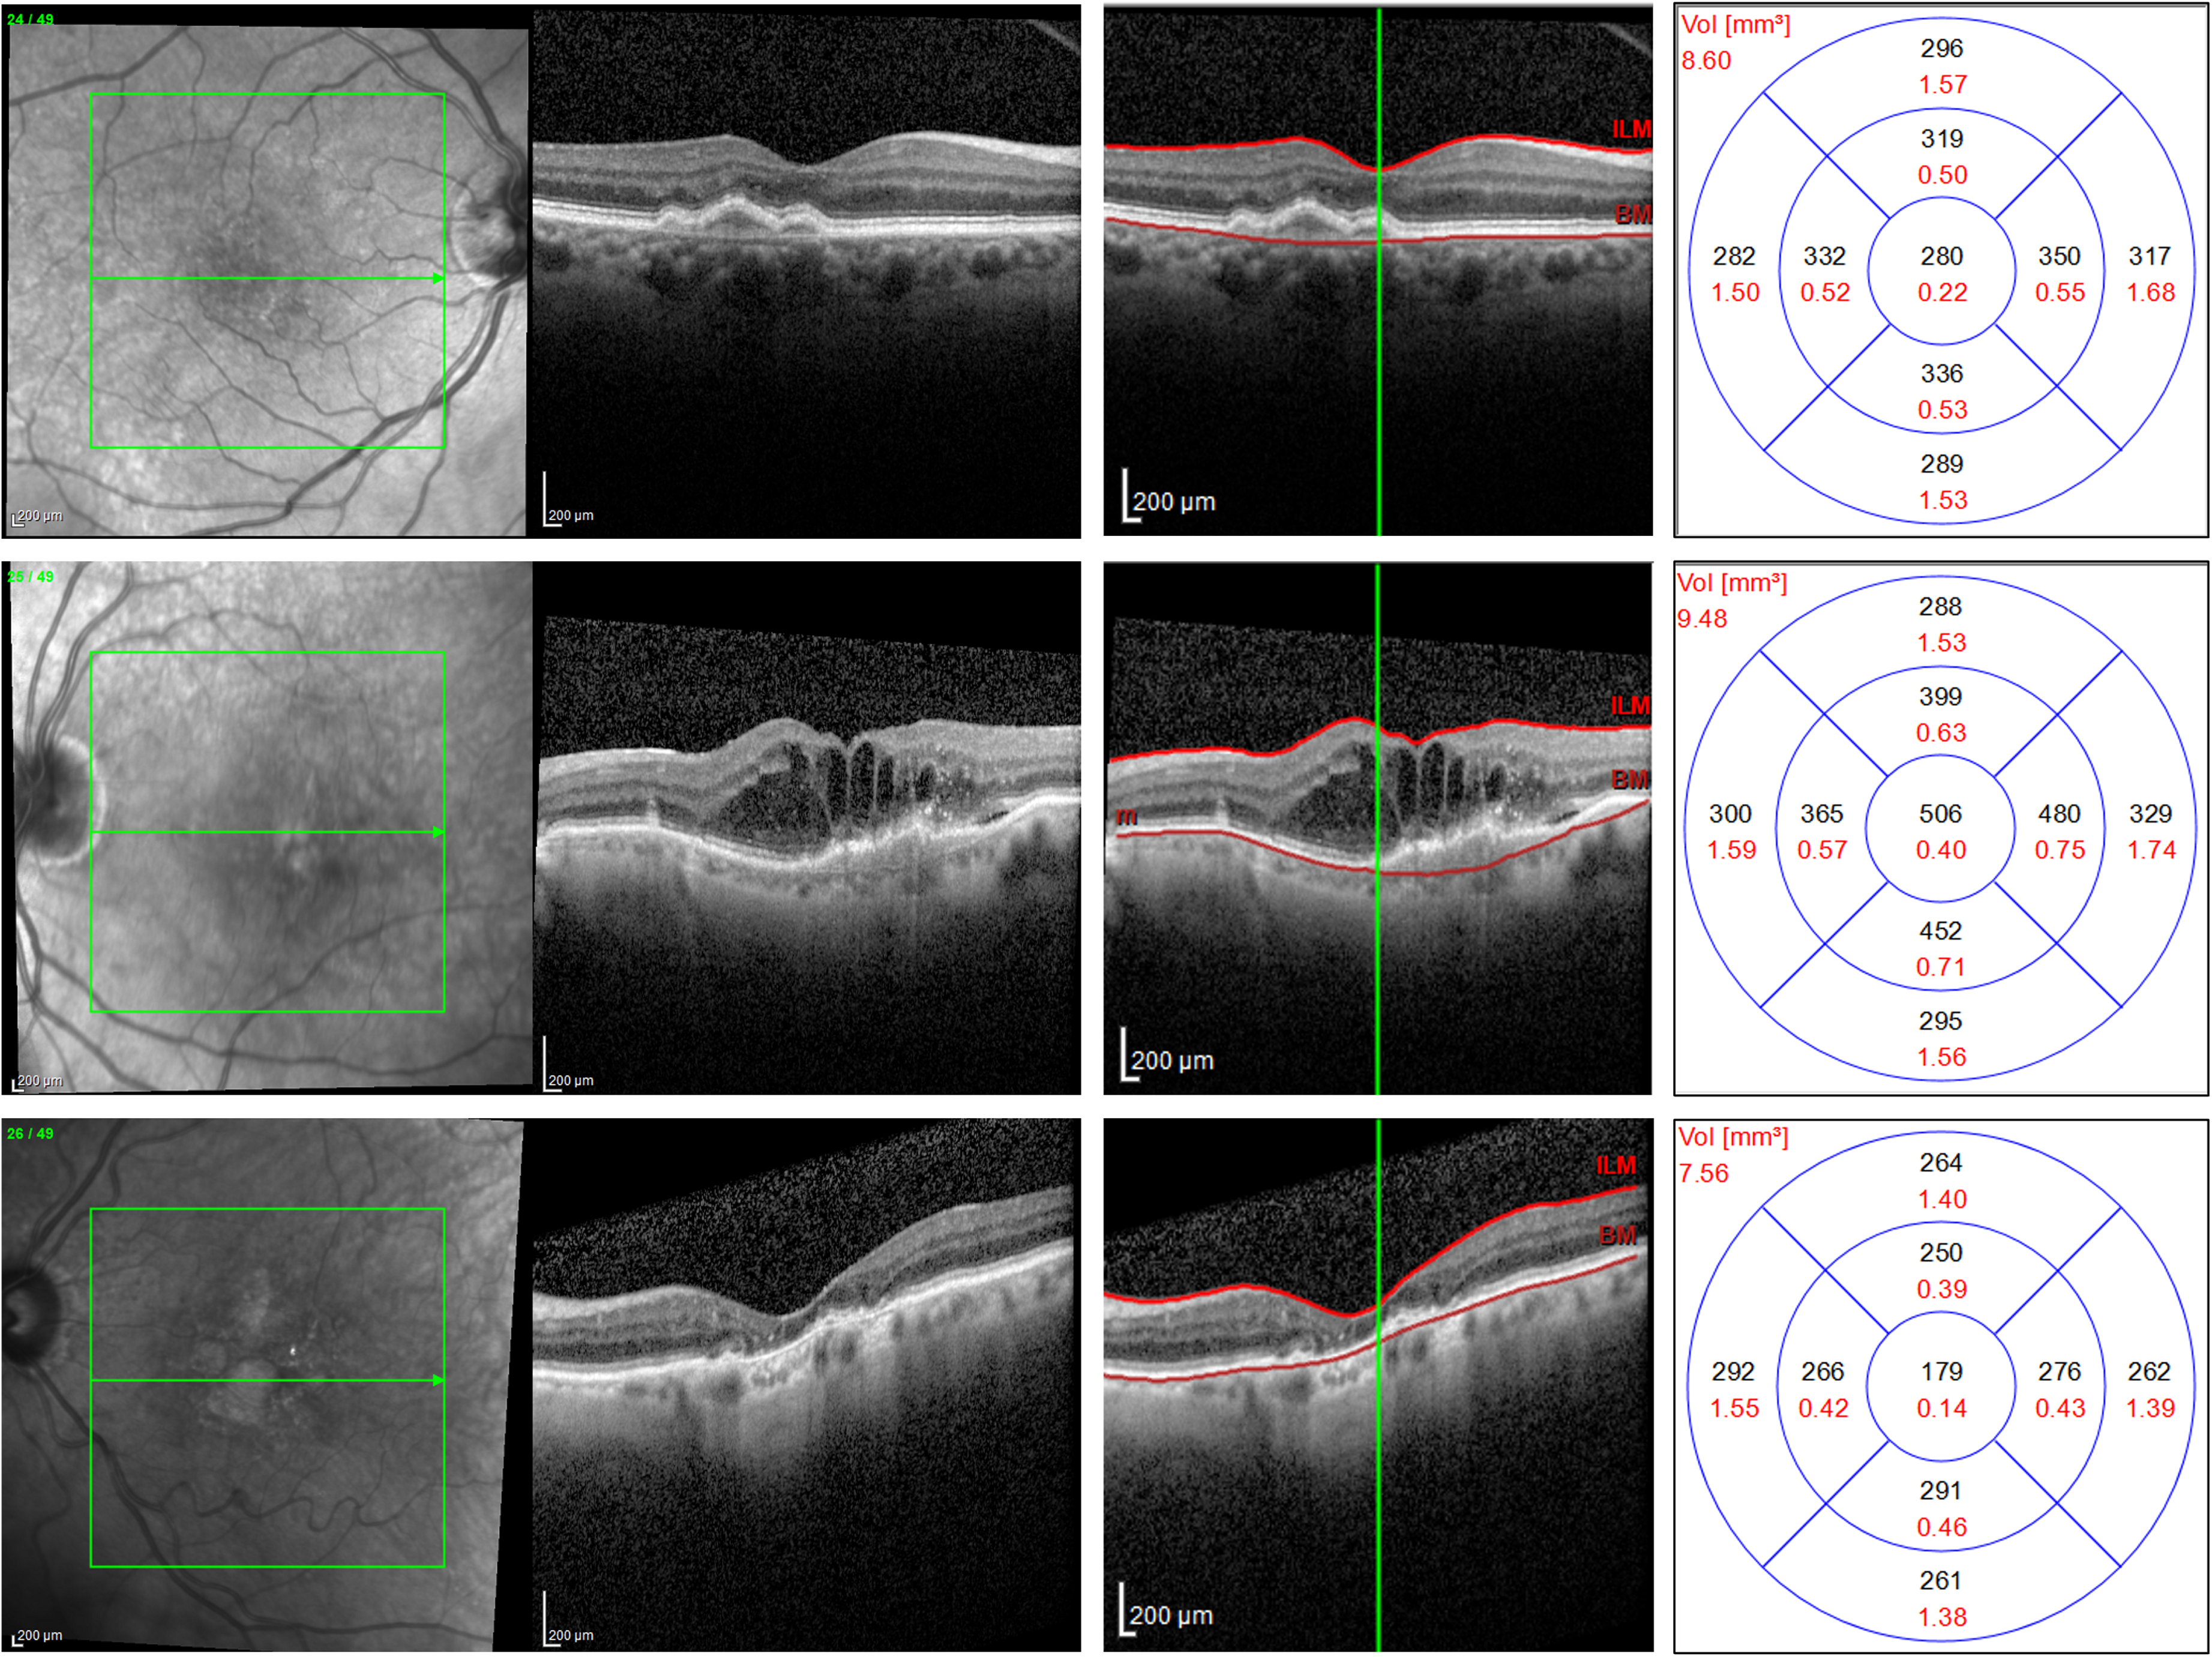
Structural OCT images from patients with neovascular AMD. Top panel: The structural OCT B-scan reveals a fibrovascular pigment epithelial detachment without indications of exudation following anti-VEGF treatment. Segmentation boundaries on the right are positioned at the ILM and Bruch's membrane levels, displaying a thickness of 280 μm in the ETDRS central circle. Middle panel: The structural OCT B-scan exhibits intraretinal fluid associated with a Type 3 MNV. Segmentation boundaries on the right are established at the ILM and Bruch's membrane levels, revealing a thickness of 506 μm in the ETDRS central circle. Bottom panel: The structural OCT B-scan displays a region of macular atrophy without signs of exudation post anti-VEGF treatment due to a Type 1 MNV. Segmentation boundaries on the right are set at the ILM and Bruch's membrane levels, illustrating a thickness of 179 μm in the ETDRS central circle.
Results of univariate linear and nonlinear regression analyses of the association between visual acuity (dependent variable) and retinal thickness deviation values.
BCVA: best corrected visual acuity.
Discussion
In this study employing structural OCT, we report a topographical quantitative assessment of the macula in neovascular exudative AMD patients undergoing anti-VEGF therapy over a period of 2 years. Also, the present study explored the relationship between visual acuity and several retinal thickness-related parameters. We demonstrated that a nonlinear quadratic relationship between these variables appears to be present. In other words, it can be observed that an initial thinning of the retina within the first three months could potentially lead to an improvement in visual acuity. However, a subsequent and additional decrease in retinal thickness may be associated with a decline in vision quality. Since the aim of this study was to assess the relationship between visual acuity and retinal thickness in neovascular AMD eyes following treatment with anti-VEGF therapy, we did not investigate this association at baseline (before the initiation of anti-VEGF therapy). The existence of a linear association between these two variables in treatment naïve eyes has been reported previously.13,22
As mentioned previously, the significance of retinal thickness as an anatomical feature in neovascular exudative AMD is highlighted by its consistent use in clinical studies to judge the efficacy of treatment. 13 However, previous studies demonstrated that retinal thickness and visual acuity are not characterized by a linear association in neovascular AMD eyes. As an example, in the EXCITE study, while a linear association between visual acuity and central retinal thickness was observed at baseline, this association was not significant at any other point during the first year of treatment. 22 Consistent with these previous results, our topographical analysis also revealed that retinal thicknesses and visual acuity were linearly associated at either the 3-month or 24-month follow-up visits. Of note, the CATT study did demonstrate that neovascular AMD eyes with very high or low retinal thickness had worse visual acuity as compared with eyes with average values of thickness throughout the first 2 years of treatment.23,24 This latter finding suggests that these two variables (i.e., retinal thickness and visual acuity) might be instead characterized by a nonlinear relationship.
Indeed, in our study, we demonstrated that a quadratic function yielded the best fit between foveal and parafoveal retinal thicknesses and visual acuity. Assuming the quadratic function is characterized by a graph with a U-shaped curve (i.e., parabola) in which the vertex constitutes the point at which the parabola turns to the opposite direction, the findings from our study support the notion that the initial decrease in retinal thickness corresponds to an improvement in visual acuity. Furthermore, our results indicate that a subsequent and continued thinning of the retina is indeed linked to a deterioration in vision.
The presence of a nonlinear (i.e., quadratic) association between retinal thickness and visual acuity values may be due, at least in part, to the fact that retinal thickness quantifies several complex anatomic features and may therefore represent a crude picture of what is actually occurring in the retina. An increase in retinal thickness secondary to accumulation of fluid in different retinal compartments is known to be associated with a decrease in visual acuity. 13 Conversely, neovascular AMD eyes undergoing anti-VEGF treatment may experience a progressive thinning of the inner 25 and outer 26 retina. A previous report by Woo Lee et al 25 investigated the changes in inner retinal thickness in AMD subjects during treatment with anti-VEGF injections. The latter study provided evidence indicating a notable and progressive thinning of the inner retina in these eyes. Considering the potential dependence of ganglion cell survival on VEGF, 27 a continuous decline in VEGF levels could be associated with neuronal loss and, consequently, a reduction in the thickness of the inner retina.. 25 Alternatively, it is possible that the thinning of the inner retina is a consequence of disrupted synaptic architecture and transneuronal degeneration over time, which can occur due to chronic photoreceptor damage. This photoreceptor damage leads to a chronically reduced input to the inner retina, ultimately resulting in the observed thinning of the inner retinal layers.28–30 Previous reports have shown that damage of the outer retina may occur in neovascular AMD eyes treated with anti-VEGF intravitreal injections and this outer retinal injury is associated with a decrease in visual acuity. 26 Specifically, exudation from macular neovascularization or fibrosis may result in damage to the outer retinal layers and RPE with consequent thinning or atrophy of these structures. 26 Therefore, taken together these findings may explain our results of concomitant decline in visual acuity with both lowest and highest values of neuroretinal thickness.
Considering that deviations in retinal thickness from normal, whether an increase or a decrease, were found to be linked to poorer vision, our objective was to investigate whether a novel parameter, known as retinal thickness deviation, could better reflect this relationship, potentially demonstrating a linear correlation with visual acuity. This parameter takes into account the difference from a healthy, normal retina, regardless of whether the deviation is due to fluid accumulation resulting in increased thickness or neurodegeneration leading to decreased thickness. In essence, both increased and decreased retinal thickness would have a similar impact on the retinal thickness deviation variable, as it primarily reflects the deviation from the norm. Of note, we did find that the retinal thickness deviation exhibited a linear association with visual acuity at both the 3-month and 24-month follow-up visits. The presence of a linear relationship between retinal thickness deviation values and visual acuity in treated neovascular AMD subjects further suggests the presence of several complex and interacting anatomic features (i.e., features of exudation and features of neuronal cell loss) in the retina of these patients.29–31 Furthermore, our results suggest that the retinal thickness deviation may be better single anatomic parameter for tracking the response to anti-VEGF therapy in neovascular AMD if correlation with visual function is a key requirement. In particular, we believe that this parameter may be of particular value in future clinical trials investing therapeutics for neovascular AMD.
The primary limitation of our study is its retrospective design. Conducting a prospective longitudinal assessment of retinal thickness in eyes with exudative neovascular AMD would be valuable in providing additional insights into the relationship between the retinal thickness deviation metric and visual acuity in such cases. A prospective study would allow for a more controlled and systematic examination of the longitudinal changes in retinal thickness and their correlation with visual acuity, offering a more robust understanding of the topic. Another limitation is that segmentation failure commonly occurs when imaging eyes with neovascular AMD, resulting in erroneous measurements of the automated retinal thickness, which limits the application of our metric in standard clinical practice. 32 In order to overcome this issues, two readers identified and corrected segmentation errors, but this would not be a practical solution in the clinic. We should also acknowledge that we did not measure the measurements’ repeatability and/or reproducibility. Nonetheless, the reproducibility assessments have been published in a previous paper and reported to be high. 33 An additional limitation of our study, is that the “retinal thickness” parameters combined the neurosensory retinal thickness with various features of exudation and the neovascular complex itself. Even after successful treatment and resolution of fluid, many patients will have a persistent PED (from the Type 1 MNV), which could lead to a persistently increased “retinal thickness” in the presence of a dry retina, which could impact the visual acuity associations. Indeed, while we demonstrated statistically significant associations between retinal thickness deviation and visual acuity, the R2 values were nonetheless weak, indicating that much of the variability in vision remained unexplained. Thus, while retinal thickness deviation seems to be a step forward from retinal thickness alone, additional parameters will need to be considered to achieve optimal correlations with vision. Furthermore, it's important to clarify that our study was not structured to independently assess various fluid locations (i.e., IRF, SRF, and sub-RPE). Our primary objective was to establish correlations between macular thickness and visual acuity. Numerous prior studies have already established the impact of fluid location on visual acuity, prompting our focus on exploring associations between macular thickness and visual outcomes.34,35 Finally, the patients in this retrospective analysis were treated with variable treatment regimens (i.e., PRN or treat and extend regimen) employing different anti-VEGF drugs. As a result, the results of our analysis may not necessarily generalize to other cohorts. On the other hand, our cohort does reflect the real-world diversity in treatment of neovascular AMD. Significantly, our research did not adequately examine whether fluctuations in retinal thickness during the treatment might have influenced visual acuity. Additionally, we were unable to explore the effects of the three different drugs (i.e., aflibercept, bevacizumab, and ranibizumab) on retinal thickness deviation. Our study possesses notable strengths that contribute to its reliability and consistency. Firstly, we employed a single OCT device and scanning protocol, which ensures uniformity in data acquisition and minimizes potential variations introduced by using different devices or protocols. Secondly, the standardized visits conducted throughout the 2-year follow-up period further enhance the study's strength.
In summary, this study demonstrated that retinal thickness and visual acuity are best characterized by a nonlinear quadratic relationship in neovascular AMD eyes treated with intravitreal anti-VEGF injections. The retinal thickness deviation, if replicated in future studies, may prove to be useful as a single anatomic parameter capable of better reflecting visual function, and perhaps serving a key target metric for optimizing therapy.
Supplemental Material
sj-docx-1-ejo-10.1177_11206721241265998 - Supplemental material for Macular thickness and visual acuity are characterized by a quadratic nonlinear relation in previously treated neovascular AMD eyes
Supplemental material, sj-docx-1-ejo-10.1177_11206721241265998 for Macular thickness and visual acuity are characterized by a quadratic nonlinear relation in previously treated neovascular AMD eyes by Enrico Borrelli, Giacomo Boscia, Francesco Gelormini, Federico Ricardi, Andrea Ghilardi, Paola Marolo, Guglielmo Parisi, Matteo Fallico, Marco Lupidi, Cesare Mariotti, Francesco Bandello, SriniVas Sadda and Michele Reibaldi in European Journal of Ophthalmology
Footnotes
Declaration of conflicting interests
The author(s) declared no potential conflicts of interest with respect to the research, authorship, and/or publication of this article.
Funding
The author(s) received no financial support for the research, authorship, and/or publication of this article.
ORCID iDs
Supplemental material
Supplemental material for this article is available online.
References
Supplementary Material
Please find the following supplemental material available below.
For Open Access articles published under a Creative Commons License, all supplemental material carries the same license as the article it is associated with.
For non-Open Access articles published, all supplemental material carries a non-exclusive license, and permission requests for re-use of supplemental material or any part of supplemental material shall be sent directly to the copyright owner as specified in the copyright notice associated with the article.