






Abstract
Purpose
To compare geographic atrophy (GA) growth in eyes with and without macular neovascularization (MNV) and evaluate anti-VEGF therapy effects on GA progression.
Methods
One eye per patient with GA with one-year of follow-up was included. Patients who developed MNV in previously diagnosed GA were assigned to the MNV-GA group, while those who did not were assigned to the non-MNV group. OCT determined MNV location and type. GA was quantified from RPE en-face images using ImageJ over one year. Fellow eyes were followed to last visit. Analyses used SPSS with Mann–Whitney U; P < 0.05 denoted significance, and prespecified thresholds applied throughout analyses.
Results
A total of 60 eyes from 60 patients were included (mean age: 82.75 ± 7.31; 56.7% female). A significant difference in GA area growth over one year was observed between two groups, with slower GA enlargement in MNV-GA group (1.15 mm2 vs. 2.36 mm2; P = 0.001; and square root: 0.38 ± 0.28 vs. 0.46 ± 0.36; P = 0.040). In MNV-GA eyes, GA growth showed no correlation with the number of anti-VEGF injections (P = 0.692). Most MNVs were type 1 (46.7%) and type 2 (43.3%) and were predominantly located at the GA border (70.0%), particularly in the central (30.0%) and superior (30.0%) sectors. Among the 60 fellow-eyes, 27 (45.0%) developed MNV during follow-up. Of these, 25 eyes (83.3%) were from patients from MNV-GA group, whereas only 2 eyes (6.7%) were from non-MNV group (P < 0.001).
Conclusion
Eyes with MNV-GA showed slower GA enlargement over one-year, regardless of anti-VEGF frequency, and higher fellow-eye MNV risk, indicating shared risk factors but distinct mechanisms influencing disease progression.
Introduction
Geographic atrophy (GA) and macular neovascularization (MNV) represent the late stages of age-related macular degeneration (AMD) according to the Beckman classification, and both can lead to central visual field defect in the elderly worldwide. 1 GA is characterized by complete atrophy of the retinal pigment epithelium (RPE), choriocapillaris, and outer retina, whereas MNV involves newly formed neovascularization arising either from the choriocapillaris in type 1 and type 2 MNV or from the deep retinal capillary plexus in type 3.2,3 These conditions are treated with different intravitreal agents: MNV is managed with anti–vascular endothelial growth factor (anti-VEGF) therapy, while GA is targeted with recently approved anti-complement factor therapies.4,5 No clinical trial has evaluated treatment for concurrent GA and MNV; currently, MNV with or without atrophy is managed using anti-VEGF therapy. 6
Geographic atrophy represents an advanced form of AMD and accounts for a substantial proportion of irreversible vision loss in the elderly population. 7 Epidemiologic studies have estimated that GA is present in approximately 20% of eyes with late AMD. In addition, prior studies have reported that exudative MNV may develop in eyes with pre-existing GA, with reported rates ranging from approximately 7% to 8% in longitudinal cohorts. 7 These findings suggest that GA and MNV frequently coexist and may represent overlapping manifestations of advanced AMD.8,9 The complement pathway contributes to GA development, and although clinical trials of complement inhibitors have demonstrated reduced GA progression, post hoc analyses revealed a dose-dependent increase in the risk of MNV formation, with a mean time to exudative changes of 8.5 months.10,11 Furthermore, safety assessments indicated that exudative AMD in the fellow eye and the presence of a double-layer sign in the study eye were associated with a higher risk of exudative conversion.10,12 Several studies have also investigated whether anti-VEGF therapy for MNV accelerates the development or enlargement of macular atrophy, with multiple reports finding no significant association between anti-VEGF treatment and macular atrophy progression.13,14
In general, clinical studies have focused on either MNV or GA individually, and treatment options for patients with coexisting GA and MNV are currently limited. However, a few reports have described the simultaneous presence of GA and MNV. A recent review by Kataoka et al. highlighted the high likelihood of GA and MNV coexisting, noting that they share common genetic and clinical risk factors and should not be considered entirely separate entities.15–17 In the present study, we aim to assess the impact of newly formed MNV in patients with GA, and anti-VEGF therapy in a 1-year follow-up on GA progression, as well as to evaluate the rate of MNV development in the fellow eye of patients with GA.
Method
Study population
In the present study, we retrospectively included patients with GA, with or without MNV formation. The study was conducted at the Medical Retina and Vitreoretinal Surgery service, University of Pittsburgh School of Medicine, between January 2017 and September 2025. The study adhered to the tenets of the Declaration of Helsinki. Informed Consent was waived in view of retrospective analysis of clinical and imaging data of patients.
The main objective of this study was to assess differences in GA growth between eyes with GA associated with MNV and those that did not, the effect of anti-VEGF injections on GA growth, as well as the condition of the fellow eyes. GA was defined as complete RPE and outer retinal atrophy with hypertransmission on OCT scans, involving ≥250 μm diameter and visible underlying choroidal vessels. 18 The diagnosis of MNV was based on the presence of newly developed intraretinal edema, exudation, or hemorrhage, along with visible MNV on clinical examination and OCT imaging.
We included patients with geographic atrophy (GA) secondary to age-related macular degeneration. From a cohort of 276 patients with GA, 30 patients who developed macular neovascularization (MNV) during follow-up, with complete ocular history and adequate OCT imaging, were identified for inclusion. Only one eye per patient was analyzed. Patients who developed MNV after prior GA diagnosis in the study eye were assigned to the MNV-GA group. A control group of 30 patients with GA without MNV was also selected. As these patients had multiple longitudinal visits, the baseline visit was chosen to provide a comparable baseline GA area to that of the MNV-GA group. These patients were assigned to the non-MNV group. Best-corrected visual acuity was measured using a Snellen chart and converted to logMAR for analysis. Patients with less than one year of follow-up were excluded. Additionally, patients with prior MNV formation or any anti-VEGF injections before the baseline visit were excluded. Other exclusion criteria included high myopia, diabetic retinopathy, retinal vascular occlusion, other vitreoretinal diseases, receiving intravitreal anti-complement injection, and poor OCT scan quality in both eyes. Poor OCT scan quality was defined as significant motion artifact, poor centration, media opacity-related signal loss, segmentation error, or inadequate visualization of GA borders precluding reliable measurement. The fellow eyes of the patients were assessed until the last available follow-up visit. MNV subtype was classified based on available structural OCT and clinical imaging findings as follows: type 1, neovascular tissue located beneath the sub-RPE; type 2, neovascular tissue extending into the subretinal space above the RPE; and type 3, intraretinal neovascularization consistent with retinal angiomatous proliferation. 3
Patients in the MNV-GA group were included when a newly developed exudative MNV was first identified during follow-up on clinical examination and structural OCT imaging. For eyes in the MNV-GA group, baseline was defined as the visit at which newly developed MNV was first identified on clinical examination and OCT imaging; this visit also corresponded to the first intravitreal anti-VEGF injection in all included cases. The GA area was measured at baseline and again after one year of follow-up. For eyes in the non-MNV group, which had multiple longitudinal visits, a baseline visit was selected to provide a comparable baseline GA area to that of the MNV-GA group, and the GA area was similarly reassessed after one year. Square root measurement was also done for the baseline, 1-year follow-up, and the square-root growth was computed as the difference of square-root–transformed areas.19,20
Patients in the MNV-GA group documented GA prior to MNV onset.
Imaging assessment
Patients underwent spectral-domain OCT imaging using Zeiss Cirrus 5000 Spectral Domain-OCT devices (Zeiss, Oberkochen, Germany), with high-resolution B-scans through the fovea. RPE en face images were used to measure the GA area. Hyper-reflective regions were quantified as the GA area and cross-validated with OCT. Peripapillary atrophy was not measured. ImageJ version 1.51 s (National Institutes of Health, Bethesda, MD) was used for the measurements. GA area measurements were performed at two visits by one expert grader, with a one-year follow-up interval, with only minor variation of ±3 weeks between visits. (Figure 1)
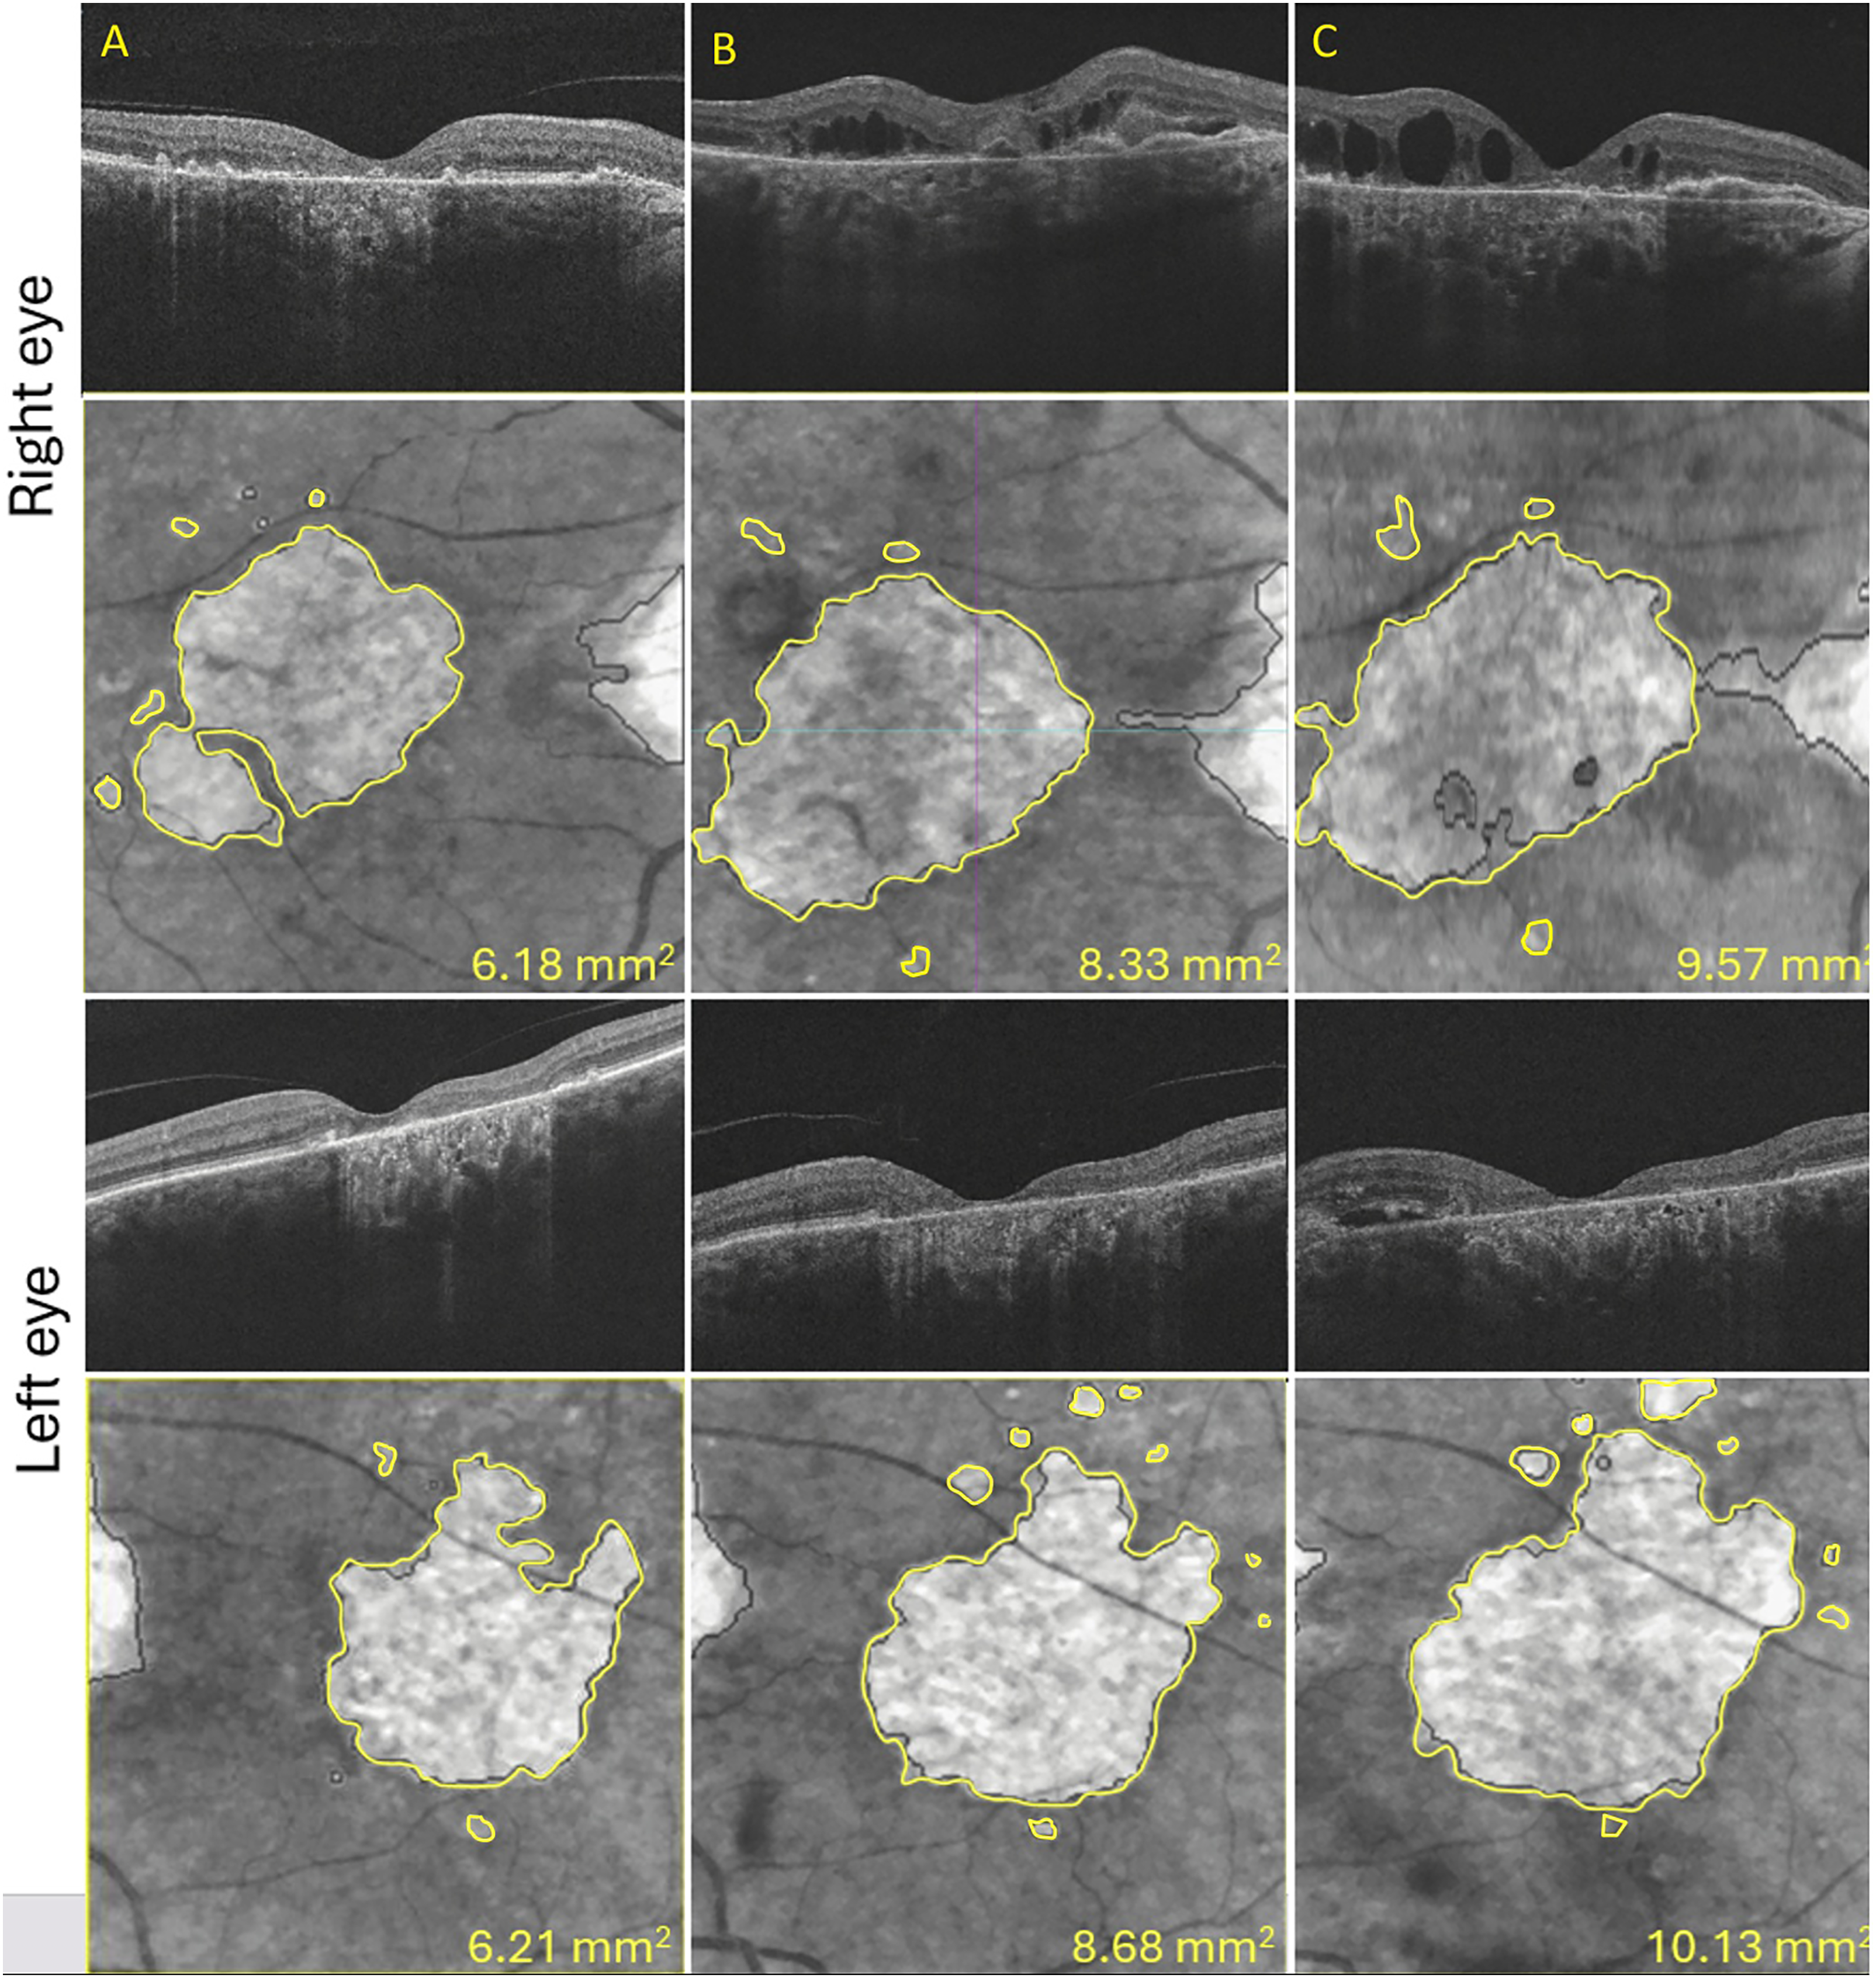
Representative multimodal OCT images demonstrating geographic atrophy (GA) progression over time in eyes with concurrent macular neovascularization (MNV). Panels A–C show sequential visits of the right eye (top two rows) and left eye (bottom two rows). Upper panels in each row represent corresponding B-scan OCT images, while lower panels show retinal pigment epithelium en face images with manually delineated GA margins outlined in yellow. The measured GA area increased over time in both eyes. In both eyes, intraretinal/subretinal fluid related to MNV is visible on B-scan imaging during follow-up. GA area values (mm2) are displayed in each en face image.
Statistical analysis
Comparisons between the two groups for logMAR visual acuity and GA area were performed using appropriate statistical tests, depending on the distribution of the data. For normally distributed data, the independent samples t-test was used, while the Mann–Whitney U test was applied for non-normally distributed data. Correlations between variables were assessed using Pearson correlation for normally distributed data and Spearman correlation for non-normally distributed data. A P value of <0.05 was considered statistically significant. All statistical analyses were performed using IBM SPSS version 26 (IBM Corp., Armonk, NY, USA).
Results
Baseline evaluation
A total of 60 eyes with GA from 60 patients were included in this study. Patients were divided into two groups: those who developed MNV after GA (MNV-GA) and those who did not (non-MNV). The mean age of all patients was 82.75 ± 7.31 years (MNV-GA: 82.36 ± 7.32; non-MNV: 83.13 ± 7.32; P = 0.686). The male-to-female ratio was 26/34 (MNV-GA: 10/20; non-MNV: 16/14; P = 0.122). Of all 60 eyes, 31 (51.7%) were right eyes, and 29 (48.3%) were left eyes (MNV-GA: 13/30 right eyes; non-MNV: 18/30 right eyes; P = 0.192).
MNV type among the 30 eyes in the MNV-GA group, 14 (46.7%) were type 1, 13 (43.3%) were type 2, and 3 (10.0%) were type 3. MNV was most frequently located in the central (9 eyes, 30.0%) and superior (9 eyes, 30.0%) sectors, followed by the inferior (6 eyes, 20.0%), nasal (3 eyes, 10.0%), and temporal (3 eyes, 10.0%) sectors (Figure 2). In relation to the area of GA, MNV was located at the border of GA in 21 eyes (70.0%), within the GA area in 5 eyes (16.7%), and outside the GA area in 4 eyes (13.3%).
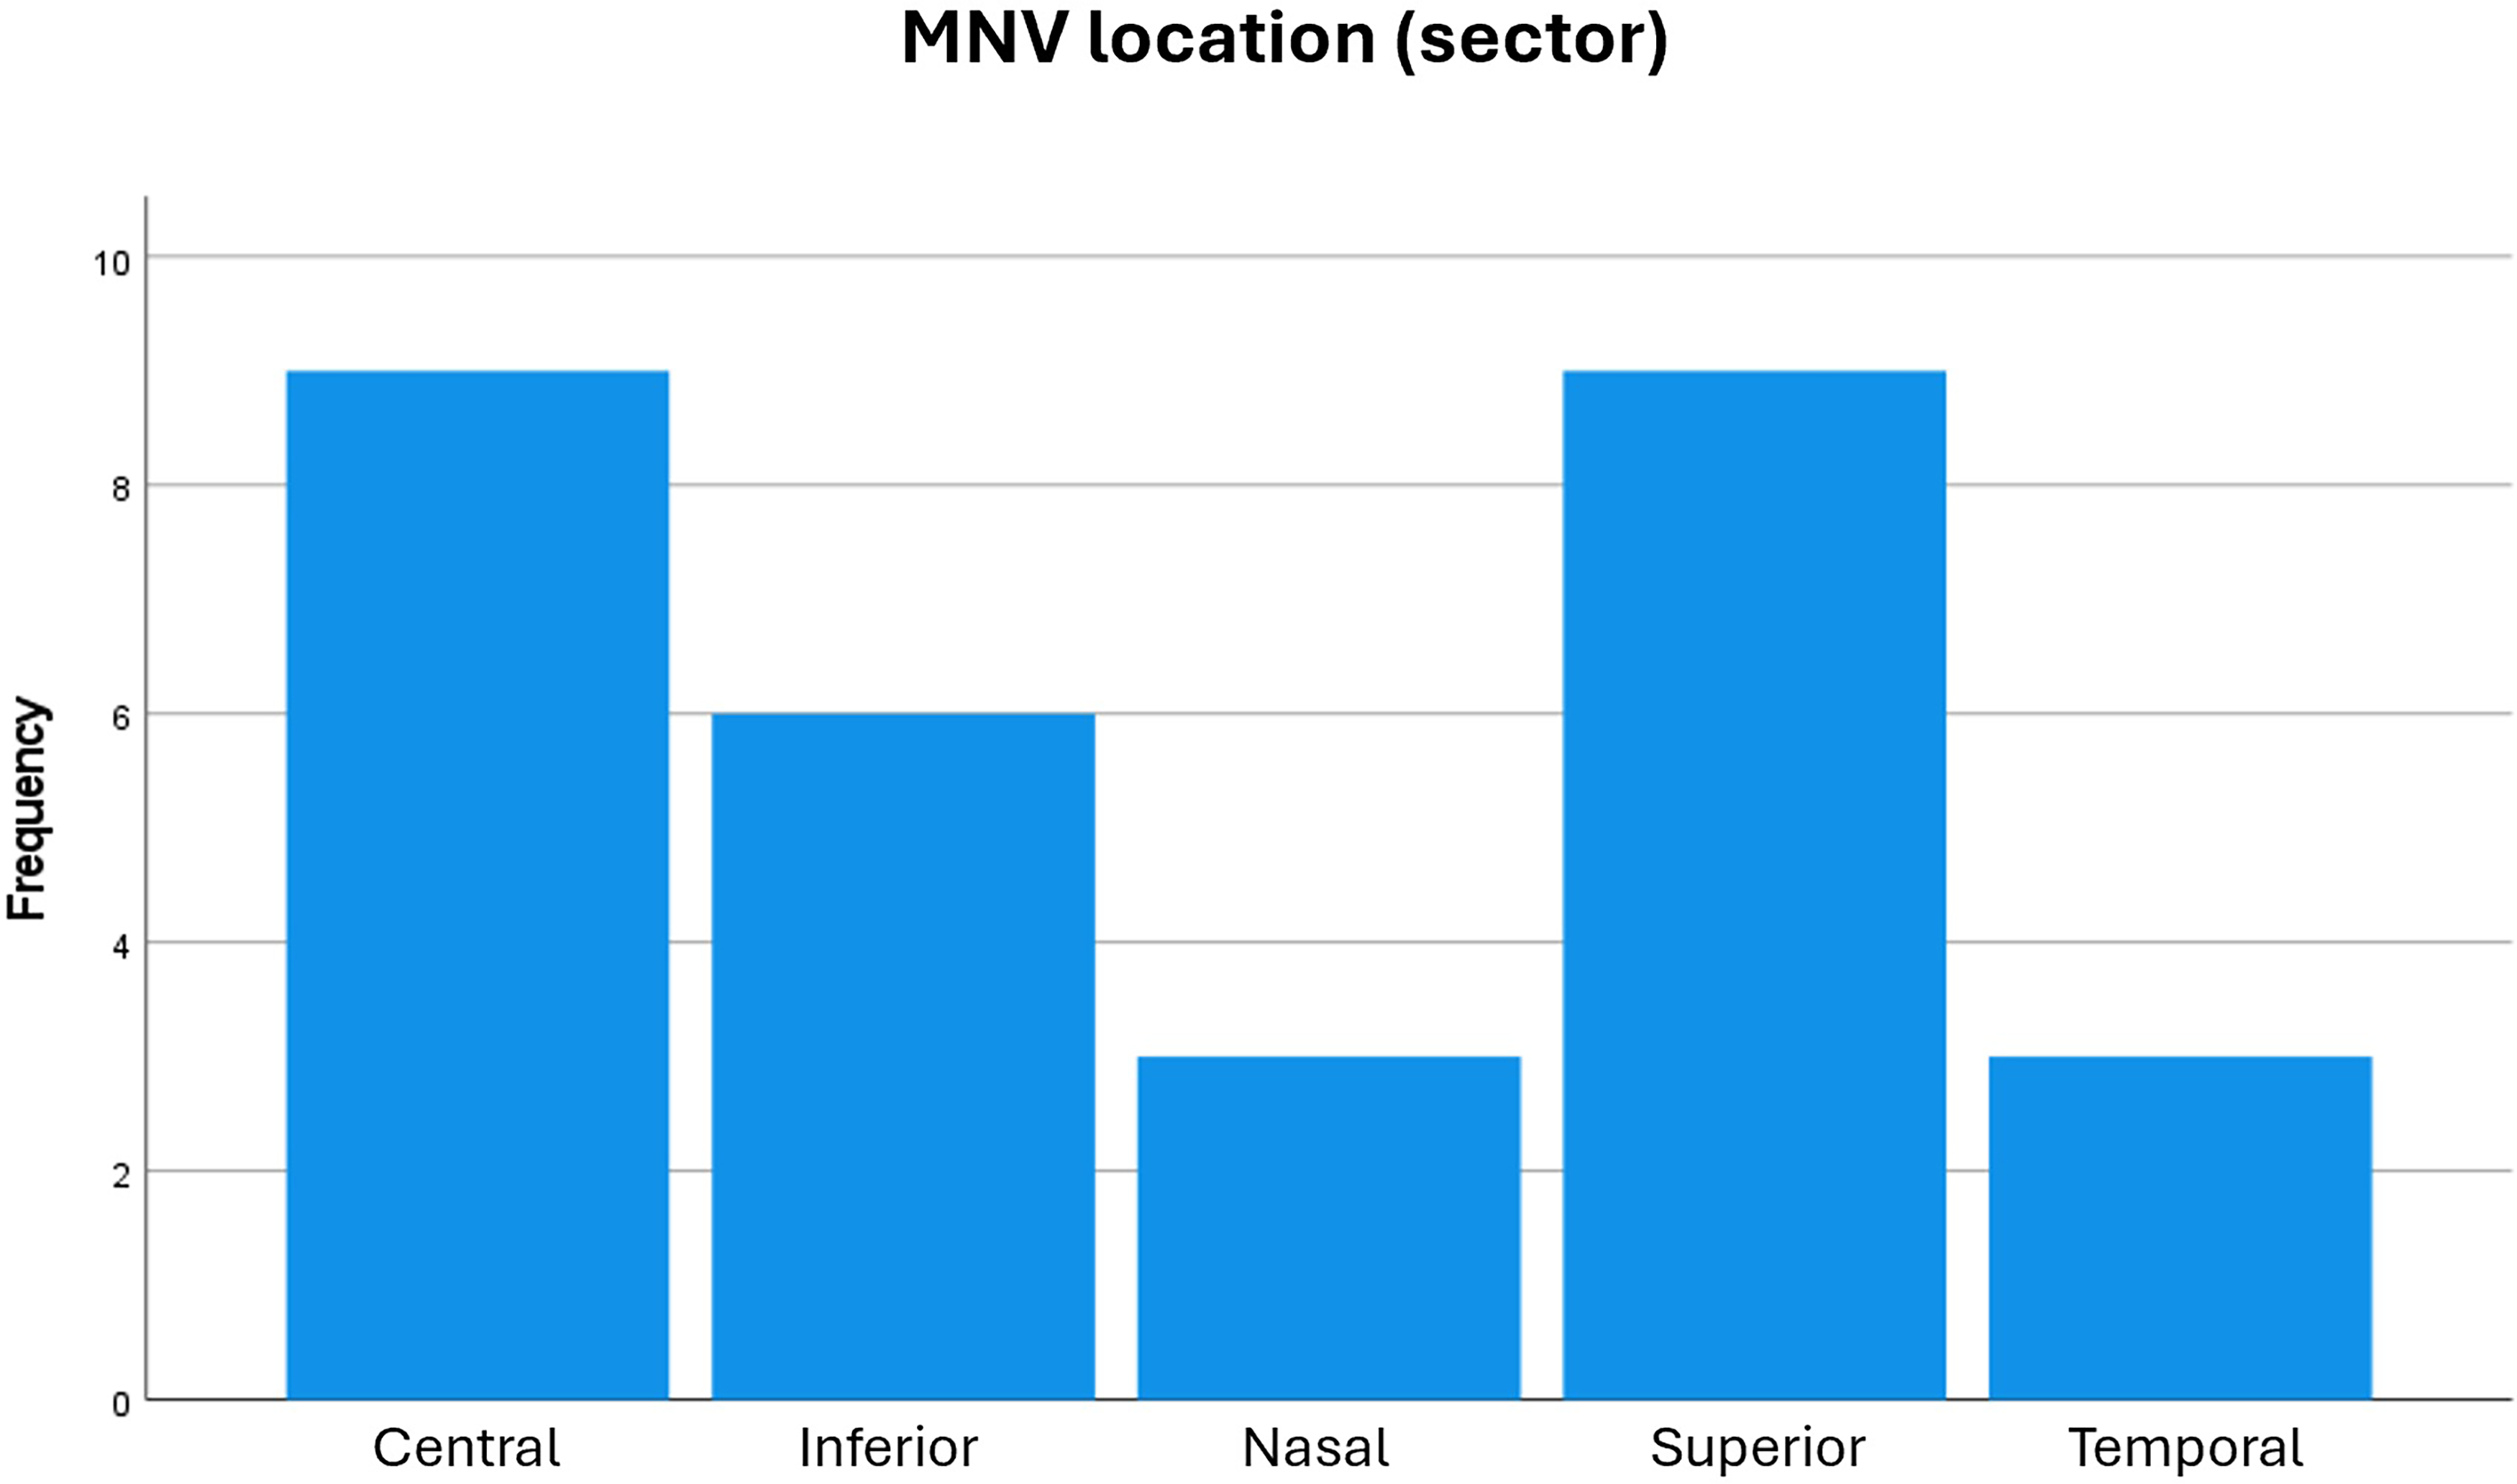
The location of new macular neovascular membrane (MNV) formation in eyes with geographic atrophy is shown in this graph.
Baseline and one-year follow-up evaluation
The baseline logMAR visual acuity in the study eyes was 0.74 ± 0.64 (MNV-GA: 0.66 ± 0.57; non-MNV: 0.82 ± 0.72; P = 0.363). At the one-year follow-up, the logMAR visual acuity was 0.85 ± 0.66 (MNV-GA: 0.81 ± 0.64; non-MNV: 0.90 ± 0.69; P = 0.614).
At baseline, the GA area measured 4.01 ± 3.38 mm2 (MNV-GA: 4.09 ± 3.55 mm2; non-MNV: 3.93 ± 3.26 mm2; P = 0.988). After one year, the GA area increased to 5.77 ± 4.31 mm2 (MNV-GA: 5.25 ± 4.01 mm2; non-MNV: 6.30 ± 4.50 mm2; P = 0.340). Eyes in the MNV-GA group received a mean of 4.46 ± 2.59 anti-VEGF injections during the one-year follow-up period after MNV diagnosis, with a range of 0 to 10 injections. GA growth during this interval was not significantly correlated with injection number (r = -0.075, P = 0.692).
The mean GA growth over one year was 1.76 ± 1.47 mm2, and it was significantly greater in non-MNV eyes (MNV-GA: 1.15 ± 1.00 mm2; non-MNV: 2.36 ± 1.62 mm2; P = 0.001). (Table 1 and Figure 3)
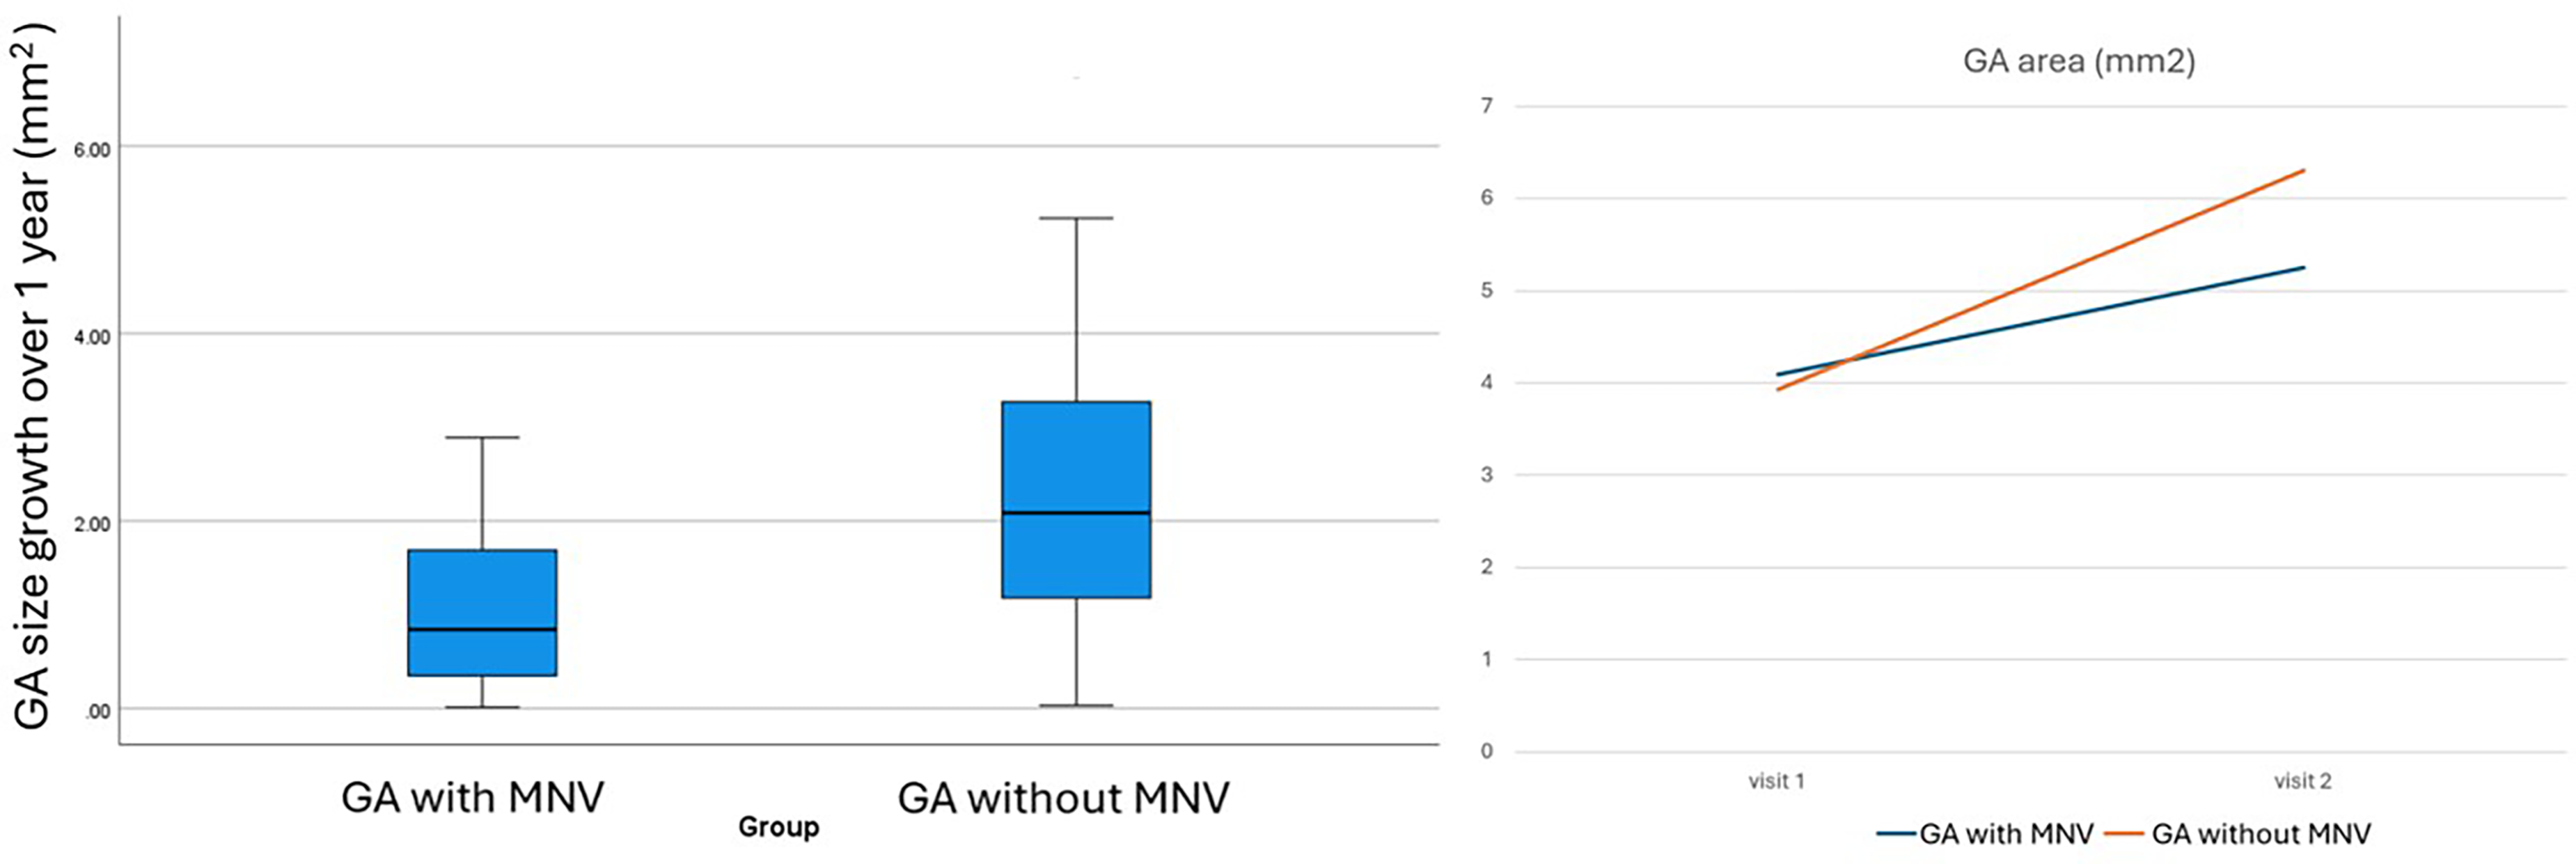
Comparison of geographic atrophy (GA) progression between eyes with and without macular neovascularization (MNV). Left panel: Boxplot demonstrating one-year GA growth (mm2), showing lower enlargement in eyes with GA and MNV compared with eyes without MNV. Right panel: Mean GA area (mm2) at baseline (visit 1) and one-year follow-up (visit 2), illustrating a slower increase in GA area in the GA with MNV group than in the GA without MNV group.
Visual acuity (va) and geographic atrophy (ga) area (mm2 and square root) in study eyes at baseline and one-year follow-up is shown in this table.
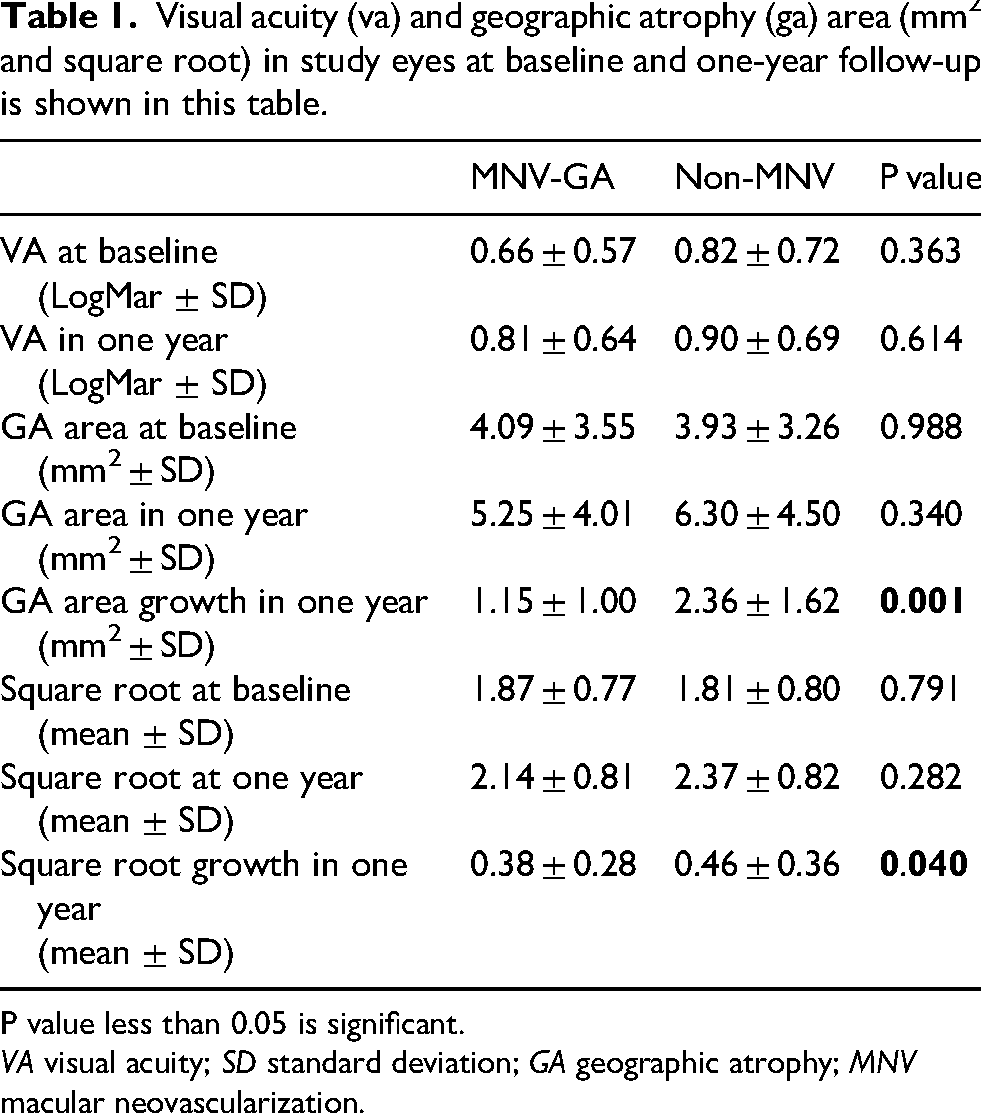
P value less than 0.05 is significant.
VA visual acuity; SD standard deviation; GA geographic atrophy; MNV macular neovascularization.
Using square root–transformed GA measurements, baseline values were comparable between the two groups (MNV-GA: 1.87 ± 0.77 vs non-MNV: 1.81 ± 0.80; P = 0.791). At one-year follow-up, square root GA values increased in both groups without a significant between-group difference (MNV-GA: 2.14 ± 0.81 vs non-MNV: 2.37 ± 0.82; P = 0.282). However, square root GA growth over one year was significantly lower in the MNV-GA group compared with the non-MNV group (0.38 ± 0.28 vs. 0.46 ± 0.36; P = 0.040), supporting a slower rate of GA enlargement in eyes that developed MNV.
Fellow eye assessment
The baseline logMAR visual acuity in the fellow eyes was 0.47 ± 0.45 (MNV-GA: 0.55 ± 0.54; non-MNV: 0.39 ± 0.47; P = 0.198). To assess the condition of the fellow eyes, all available OCT scans were reviewed. The mean follow-up duration was 50.46 ± 40.44 months from the baseline evaluation (MNV-GA: 52.89 ± 43.58 months; non-MNV: 48.20 ± 37.88 months; P = 0.663). Among the 60 fellow eyes, 27 (45.0%) had MNV either before the start of follow-up or developed MNV during follow-up. Of these, 25 eyes (83.3%) belonged to patients whose study eye had GA with MNV: 5 fellow eyes had no MNV throughout follow-up, 19 fellow eyes had exudative MNV prior to the baseline visit of the study eye, and 6 fellow eyes developed incident MNV after a mean of 28.83 ± 21.05 months from the baseline visit of the study eye (range: 3–53 months). In contrast, only 2 eyes (6.7%) were from patients whose study eye had GA without MNV (P < 0.001), of which one fellow eye had MNV prior to baseline and one developed incident MNV 71 months after the baseline visit of the study eye.
Discussion
In this study, we observed a significant difference in GA area growth over one year between eyes with GA that developed MNV and those that did not, with lower GA growth in eyes with MNV formation (1.15 mm2 vs. 2.36 mm2 and 0.38 vs. 0.46 square root). Additionally, in eyes with MNV, GA growth was not associated with the number of anti-VEGF injections. Most MNV formations were observed at the border of the GA, particularly in the central and superior sectors. Evaluation of the fellow eyes over a longer follow-up revealed a highly significant difference in MNV development, indicating that patients with GA and MNV in the study eye are more likely to develop neovascularization in the fellow eye.
In a multimodal imaging analysis of patients with newly diagnosed nAMD, GA was detected in 24.3% of eyes. 21 Sacconi et al. reported a 7.81% prevalence of exudative MNV development in patients with pre-existing GA, most commonly type 2 (67.5%), followed by type 1 (25%), type 3 (2.5%), and mixed phenotype (5%), requiring an average of 2.9 ± 1.4 anti-VEGF injections in the first year. They also observed that MNVs associated with GA exhibited distinct morphological and therapeutic characteristics compared with MNVs in AMD without GA, with 92.5% of cases showing subretinal hyperreflective material, with or without subretinal or intraretinal hyporeflective exudation. 8 In comparison, our study demonstrated 46.7% type 1, 43.3% type 2, and 10.0% type 3 MNV formation in GA secondary to AMD, requiring a mean of 4.46 ± 2.59 anti-VEGF injections over one year.
In 2021, AREDS2 Report 24 demonstrated that eyes with newly developed GA showed slower enlargement when exudative nAMD subsequently appeared. 14 Similarly, Heiferman and Fawzi 22 described a patient with GA and nonexudative MNV showing a markedly slower GA progression. Other studies have reported comparable findings, suggesting that eyes with type 1 MNV are less prone to GA development or enlargement, with GA often occurring eccentrically to the MNV site.23–25 A possible explanation for the slower enlargement of GA that later develops exudative MNV is the presence of nonexudative type 1 MNV, which may form a sub-RPE capillary network supplying nutrients and oxygen to the RPE, partially compensating for choriocapillaris loss and reducing oxidative stress.14,22 Our study showed similar findings, indicating that eyes with pre-existing GA and newly developed MNV exhibited slower GA enlargement over one year of follow-up compared with eyes without MNV. We also found that GA growth over one year was not correlated with the number of anti-VEGF injections, suggesting that the protective effect on GA progression is attributable to the presence of MNV itself rather than the anti-VEGF treatment. Injection frequency varied considerably across patients in this real-world cohort, likely reflecting differences in lesion activity, follow-up adherence, and individualized retreatment decisions. Therefore, injection count alone may not fully represent treatment burden or anti-VEGF exposure. This finding is consistent with the results of Kataoka et al., who reported that anti-VEGF therapy for MNV does not influence the rate or extent of macular atrophy development or enlargement. 15
Kataoka et al. suggested that GA and MNV share common genetic risk factors, including HTRA1, CFH, C3, C2, and ARMS2, as well as clinical risk factors such as subretinal drusenoid deposits, large or cuticular drusen, and intraretinal hyperreflective foci. They suggest that these shared features support the concept of GA and MNV representing a continuum of late-stage AMD, underscoring the importance of using multimodal imaging to assess for MNV in patients with GA and for GA in those with MNV. 15 Our study found that MNV in the fellow eyes of patients with MNV formation on pre-existing GA was significantly higher than in the fellow eyes of patients with GA without MNV. These results suggest that although GA and MNV share some genetic and clinical risk factors, and both represent late-stage AMD, they may also have distinct risk factors, and patients with MNV on GA may differ from those with GA without MNV. Further long-term evaluation is needed to confirm this observation.
In the present study, 70% of MNV lesions were located at the border of GA. Prior studies have similarly reported that neovascular lesions in eyes with GA frequently arise adjacent to areas of atrophy rather than within fully atrophic tissue, suggesting that transition zones between preserved and degenerated retina may favor angiogenesis.8,23,24 Clinically, these findings support careful surveillance of GA margins when monitoring for neovascular conversion.
Although GA growth differed between groups, corresponding differences in visual acuity were not observed over one year. Structural enlargement of GA does not necessarily translate into short-term visual acuity decline, particularly when lesions remain extrafoveal or spare the foveal center. Furthermore, visual acuity in AMD may be influenced by several factors beyond GA size alone, including photoreceptor integrity, fixation stability, cataract, and concurrent neovascular activity. Accordingly, best-corrected visual acuity may have limited sensitivity as a sole functional endpoint in GA studies, and future investigations may benefit from complementary measures such as microperimetry, contrast sensitivity, reading performance, and patient-reported outcomes.26–28
With the recent introduction of complement inhibitor therapies for GA, post hoc analyses of clinical trials have reported increased rates of exudative MNV conversion in some treated eyes. Therefore, improved characterization of the GA-MNV phenotype is becoming increasingly relevant in clinical practice.10,11,29 The present findings suggest that patients with study-eye MNV arising on GA may have a higher likelihood of neovascular involvement in the fellow eye, supporting the need for future studies to identify imaging and clinical biomarkers that may guide risk stratification and monitoring during complement inhibitor treatment.
Our study was limited by a small sample size and its retrospective design. Given that GA from AMD primarily affects an older population, often with multiple systemic comorbidities and concomitant medications and cigarette smoking, this poses an additional limitation. Moreover, our analysis did not include GA lesion configuration, OCT angiographic features, or OCT biomarkers such as choroidal layer thickness or choroidal volume. The absence of a significant correlation between injection number and GA growth should be interpreted cautiously, as the sample size may have limited statistical power to detect smaller treatment-related effects. In addition, the single-center tertiary referral design may have introduced referral bias, as patients seen at a specialized retina center may represent more complex or advanced disease phenotypes. Further studies are needed to investigate how comorbidities, medication use, and retinal and choroidal biomarkers, along with comprehensive multimodal imaging assessments, influence MNV development in patients with GA.
In conclusion, this study found that eyes with GA associated with MNV had slower GA enlargement over one year compared with eyes without MNV. Injection frequency was not significantly associated with GA growth in this cohort. Moreover, patients with MNV arising on previously diagnosed GA are more likely to have MNV in the fellow eye. These observations may reflect differences in disease phenotype or risk profile and warrant further investigation in prospective studies. Further studies are warranted to identify these risk factors and elucidate the pathways contributing to MNV development in patients with GA.
Footnotes

Ethics approval
All procedures performed in studies involving human participants were in accordance with the ethical standards of the Institutional Review Board and with the 1964 Helsinki declaration and its later amendments or comparable ethical standards.
Informed consent
Informed Consent was waived in view of retrospective analysis of clinical and imaging data of patients.
Authors contributions
E.S. wrote the main manuscript, led the project, and contributed to data analysis.
G. G., J. D., Z. S., P. G., S.C. B., and K.K. V. assisted with data collection and manuscript revision.
J.A. S. and A.W. E. provided critical review and final revisions.
J. C. contributed to study conception, project supervision, and manuscript revision.
Funding
The authors received no financial support for the research, authorship, and/or publication of this article.
Declaration of conflicting interests
The authors declared no potential conflicts of interest with respect to the research, authorship, and/or publication of this article.
Data availability
The datasets generated and/or analyzed during the current study are available from the corresponding author on reasonable request.