
Abstract
Objectives:
To evaluate the efficiency and tolerability of pericapsular nerve group block (PENG) for the treatment of chronic hip pain.
Methods:
This is a retrospective, single-centre, 4-group study conducted over a 3-month period to find out the most typical cause of chronic hip pain. A total of 112 patients with symptomatic hip osteoarthritis (OA), Stage 2–3, greater trochanteric pain (GTPS) and chronic pain after total hip arthroplasty (cTHA), who had an ultrasound-guided PENG block, were selected. To assess the effectiveness of the treatment, the Western Ontario and McMaster Universities osteoarthritis index (WOMAC) and visual analogue scale (VAS) scores of the patients prior to treatment were compared with their scores after the 1st week, 1st month, and 3rd month of treatment. The study also aimed to analyse the patients’ initial feelings of alleviation following the block (1st VAS/2) and problems experienced both during and after the block.
Results:
The parameters studied included pain, stiffness, and results of physical activity in the 1st week, 1st month, and 3rd month following PENG block application. At the beginning of the 1st week, of the 112 patients who were administered a PENG block for hip pain, we reported a 62% improvement in pain, a 52% reduction in stiffness, and a 53% increase in physical activity. Even though these results slightly declined in the 1st and 3rd months, the rates were still higher than 45%.
Conclusions:
Overall, the PENG block was well-tolerated by the patients in our study. No treatment-related infections or any other serious complications were observed.
Keywords
Introduction
One of the frequent concerns among individuals aged over 60 years is hip pain, which affects 14% of them. 1 Hip OA is 1 of the most typical causes.2,3 Rheumatoid arthritis, osteonecrosis, femoroacetabular impingement, GTPS, chronic infectious coxarthrosis, posttraumatic pain, and chronic pain after total hip arthroplasty (cTHA) are additional causes of chronic hip pain. 4
Patients with persistent hip pain can receive analgesic effects from a variety of treatment methods, including physical therapy and analgesics such as anti-inflammatory me-dications. Nevertheless, the frequent and only short-term advantage is pricey and has serious adverse effects. 5 Among other therapeutic options, minimally-invasive techniques, typically, fail to provide effective long-term pain management. 6 Arthroplasty is frequently the suggested course of treatment for patients with advanced symptoms, significant impairment, and extensive disease; however, there are dramatic failure rates (5–15%).7–11
Several innovative procedures have emerged in the last few years as a result of the expanding use of ultrasonography in regional anaesthesia. One of these methods was initially discussed in the literature by Giron-Arango et al. 12 in 2018, and this block method is called the PENG block. This quickly garnered fame because of its encouraging outcomes in pain management in the perioperative context. The hip’s anterior capsule, which has the most extensive innervation, is the target of this block technique.13–15
The efficiency of the PENG block was examined in the study for the most prevalent hip pain aetiologies. This study investigated the effectiveness and safety of PENG block, which provides successful and targeted postoperative pain control in a short amount of time for chronic hip pain for which adequate analgesic treatment is still not known.
Materials and methods
Patient selection
The data of patients who met the requirements were retrospectively scanned to conduct this study, which included patient application data from the Ordu State Hospital’s Algology Department between January 2021 and December 2022. A diagnosis of greater trochanteric pain syndrome (GTPS) confirmed by physical examination and radiological imaging or radiographically confirmed hip OA, Kellgren/Lawrence grade 2 or 3 and hip OA symptoms for at least 1 month,16,17 or developing after the last surgery, persisting for at least 1 year were the criteria for the patients to be accepted for this study. It was necessary to make a diagnosis of chronic pain (cTHA) brought on by total hip arthroplasty (THA) without a known reason (Figure 1). The study excluded patients who refused PENG block intervention therapy, did not finish the 3-month follow-up, or refused to consent to the use of their data. The study protocol was approved by the Ordu University Ethics Committee (17.02.2023-61).
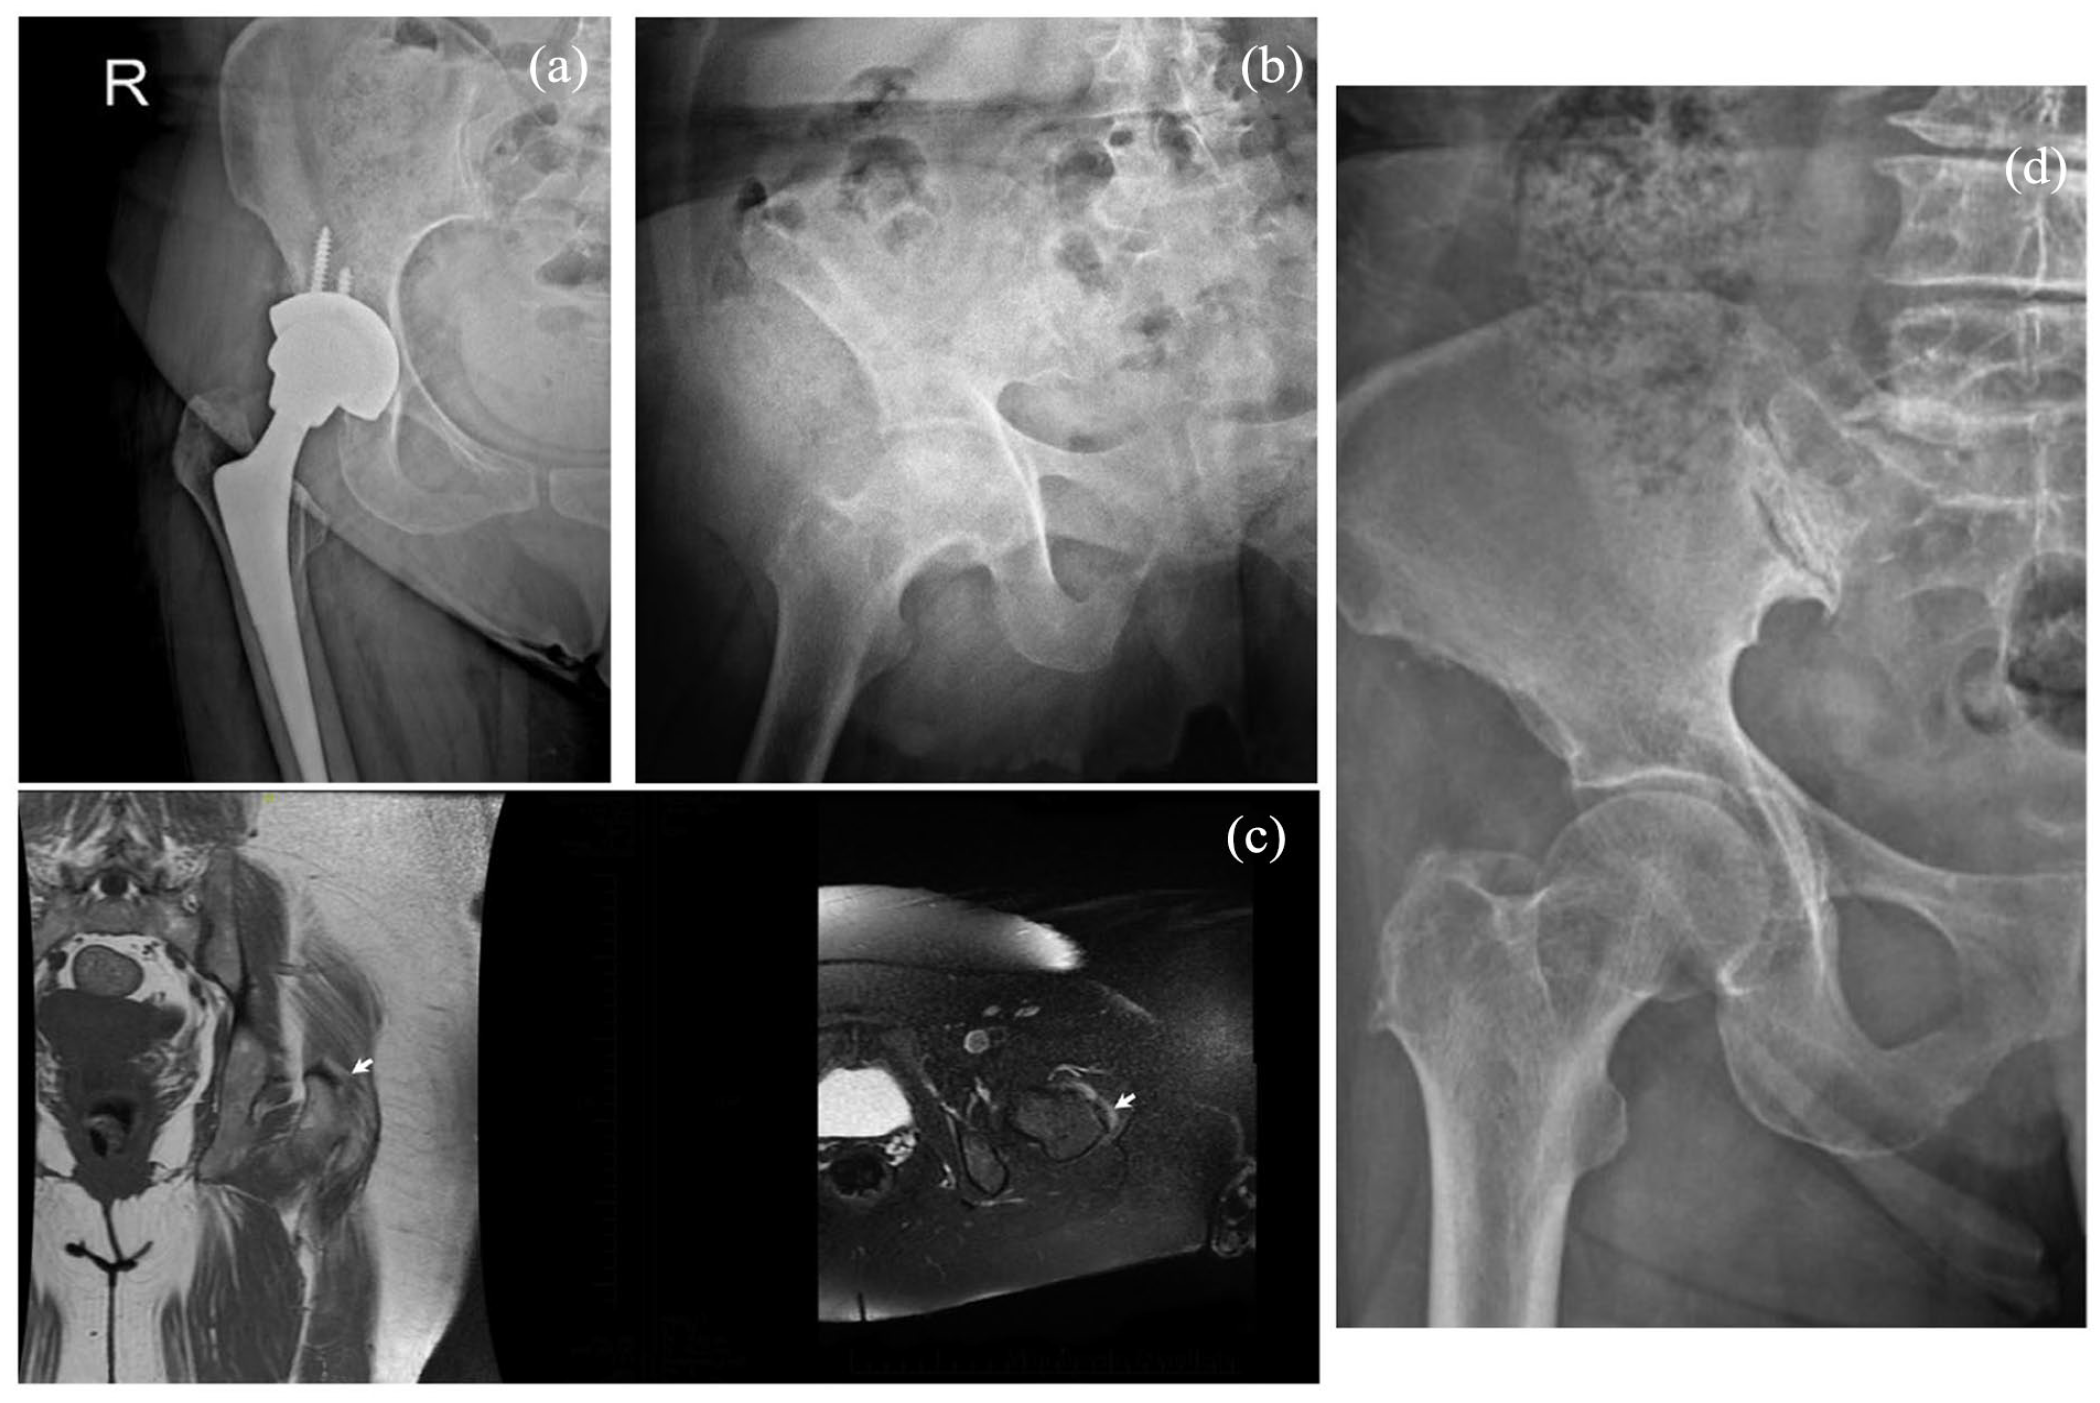
Representative figures of groups: a: Group 4 (chronic pain after total hip arthroplasty), b: Group 3 (Stage 3 coxarthrosis), c: Group 1 (great trochanteric pain syndrome) and d: Group 2 (Stage 2 costarthrosis). White arrow: Greater trochanteric bursitis.
Intervention
PENG block was administered in patients with a visual analogue scale score (VAS) >4 despite receiving an effective dose of acetaminophen (4 g/day) and/or nonsteroidal anti-inflammatory drugs (NSAIDs) for at least 3 weeks. The PENG block was avoided in the following conditions: patients with pregnancy, Kellgren/Lawrence Grade 1 or 4, major acetabular dysplasia of the target joint, inflammatory joint disease, chondrocalcinosis of the hip, history of allergy or intolerance to local anaesthetics (LA) and dexamethasone, skin changes at the injection area with the risk of infection, surgery on the target hip within the last month, intermittent claudication, current anticoagulant therapy or viscosupplementation in the last 3 months, and oral corticosteroid therapy in the last month, or intra-articular injection of corticosteroids into the hip or knee joint.
With the patient in the supine position, the curved ultrasound probe was positioned transversely on the anterior superior iliac spine (ASIS). After ASIS was identified with the help of ultrasound, the probe was aligned with the pubic ramus and a 45°rotation was achieved by moving the medial end of the probe parallel to the inguinal crease. The probe was then moved medially along this axis until the anterior inferior iliac spine (AIIS), iliopubic eminence (IPE), and psoas tendon were clearly defined and appeared as anatomical landmarks (target point). At this point, the femoral head was imaged by moving the probe distally and caudally to ensure anatomical localisation. When the femoral head came into view, the probe was moved cephalad and the target point was viewed again. In this position, 20 ml of 0.25% bupivacaine + 4 mg of dexamethasone was injected into the plane between the psoas muscle and the pubic ramus using the lateral-to-medial in-plane technique. After the injection, a lifting movement was observed in the psoas muscle tendon (Figure. 2). 18
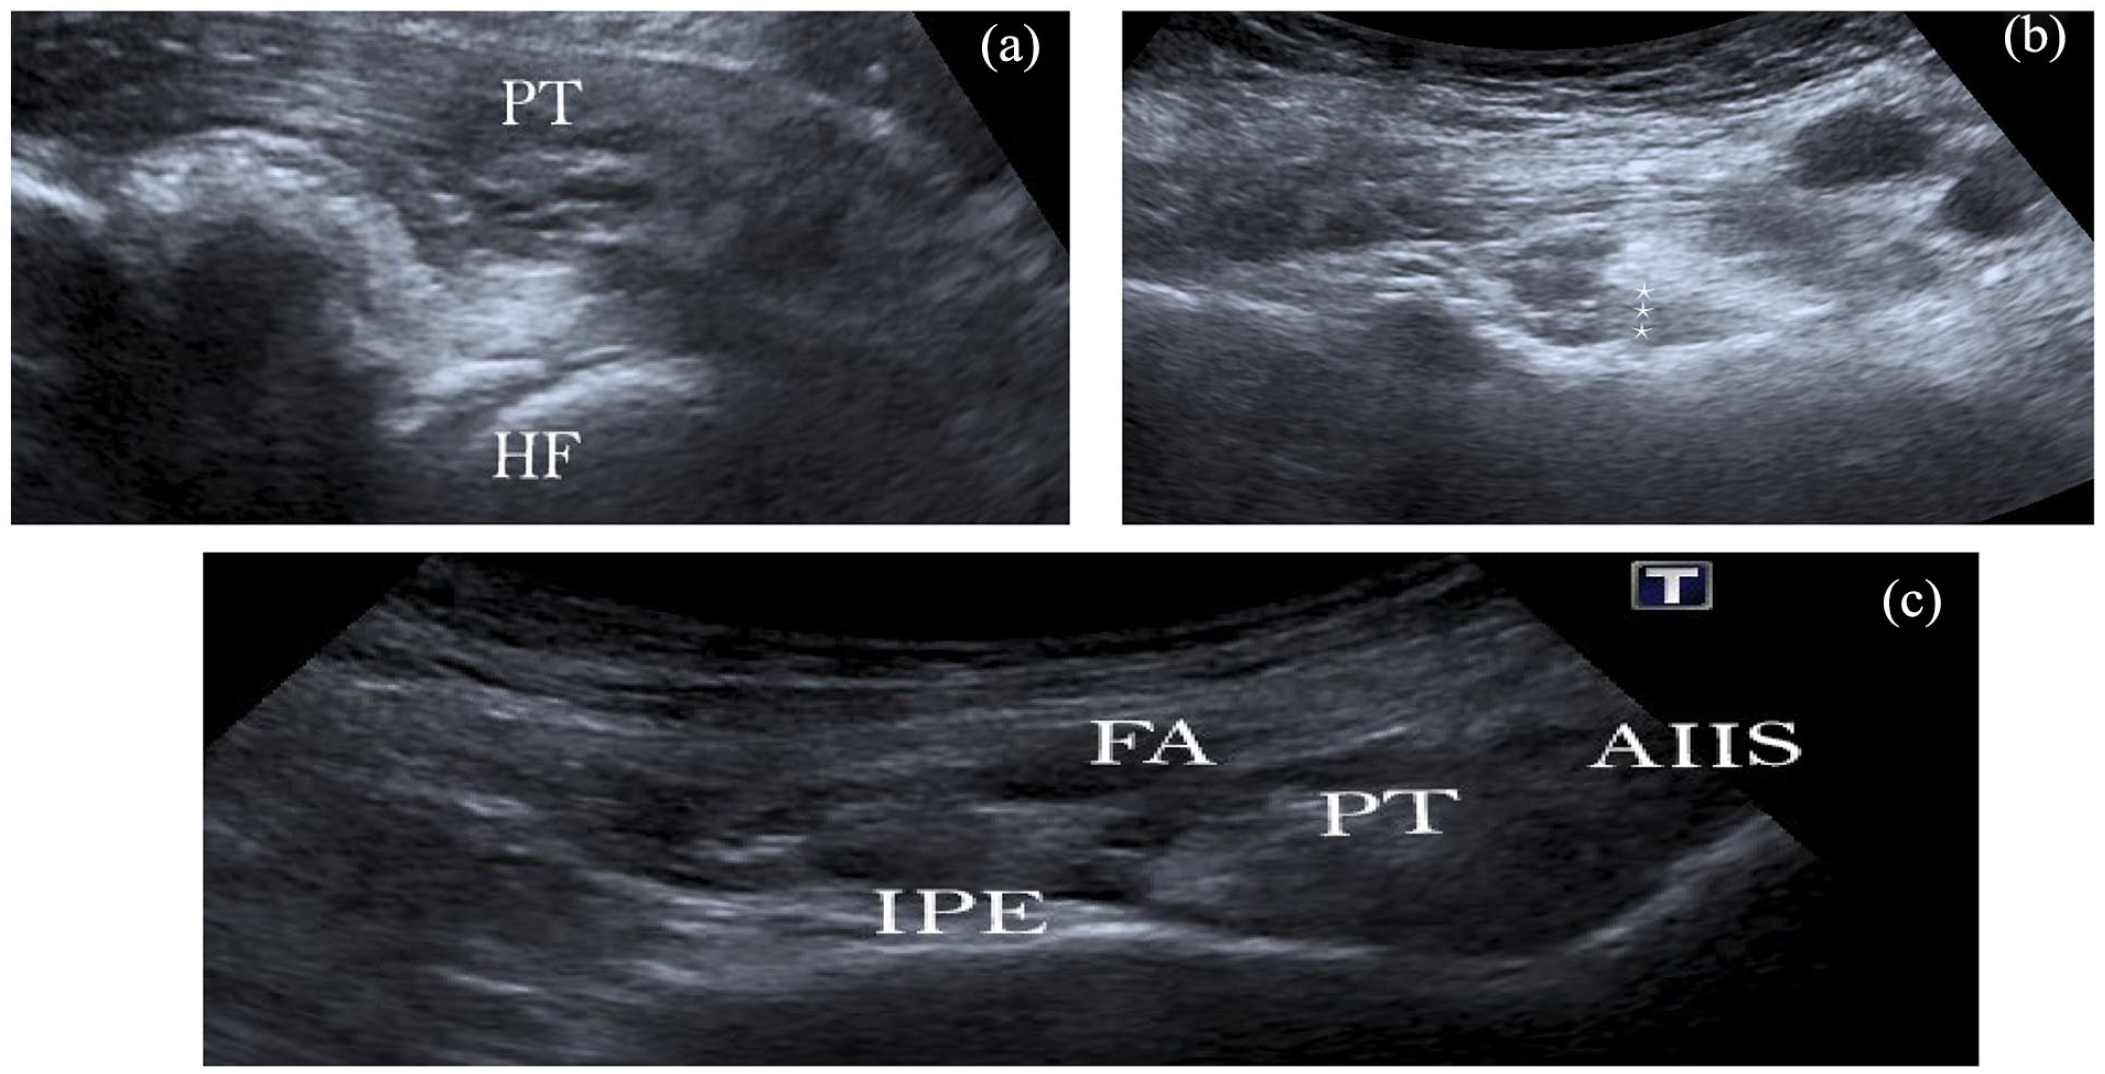
Ultrasound guided peng block application: (a) the femoral head was imaged by moving the probe distally, (b) *** lifting movement of psoas muscle tendon, and (c) releavant anatomy after PENG block
Outcome scores
Age, gender, body mass index (BMI), and disease duration of the patients were documented as sociodemographic information. Based on their diagnosis, the study participants were split into 4 groups. Group 1 patients were those with pre-block, GTPS, Group 2 patients were those with Kellgren/Lawrence Grade 2 hip OA, Group 3 patients were those with Grade 3 hip OA, and Group 4 patients were those with cTHA. The WOMAC and VAS scores of the patients prior to the treatment were compared with the scores after the 1st week, 1st month and 3rd month of the treatment in order to assess the response to the treatment. Patients’ 1st VAS/2 following the block and any complications both during and after the block were also recorded.
Statistical analysis
The chi-square and Kruskal Wallis tests were used to compare the basic demographic findings of the groups. The reason for using the Kruskal-Wallis test was the acceptance that it could not show parametric properties since the relevant data were obtained from <30 patient groups.
The Kruskal-Wallis test was used to compare >2 non-parametric independent groups. Additionally, to compare >2 related samples, Wilcoxon signed-rank test was used since they did not show parametric properties. All analyses were evaluated at a 95% confidence interval and p < 0.05 significance level.
Results
In the study, gender distribution did not show a statistically significant difference between the groups (Table 1). The mean age was 53.04 ± 8.31 years in Group 1, 54.77 ± 6.76 years in Group 2, 71.17 ± 6.22 years in Group 3 and 59.24 ± 10.33 years in Group 4. Group 3 had the highest mean age among the groups, while Group 1 had the lowest mean age (Table 2).
Gender distribution in groups.
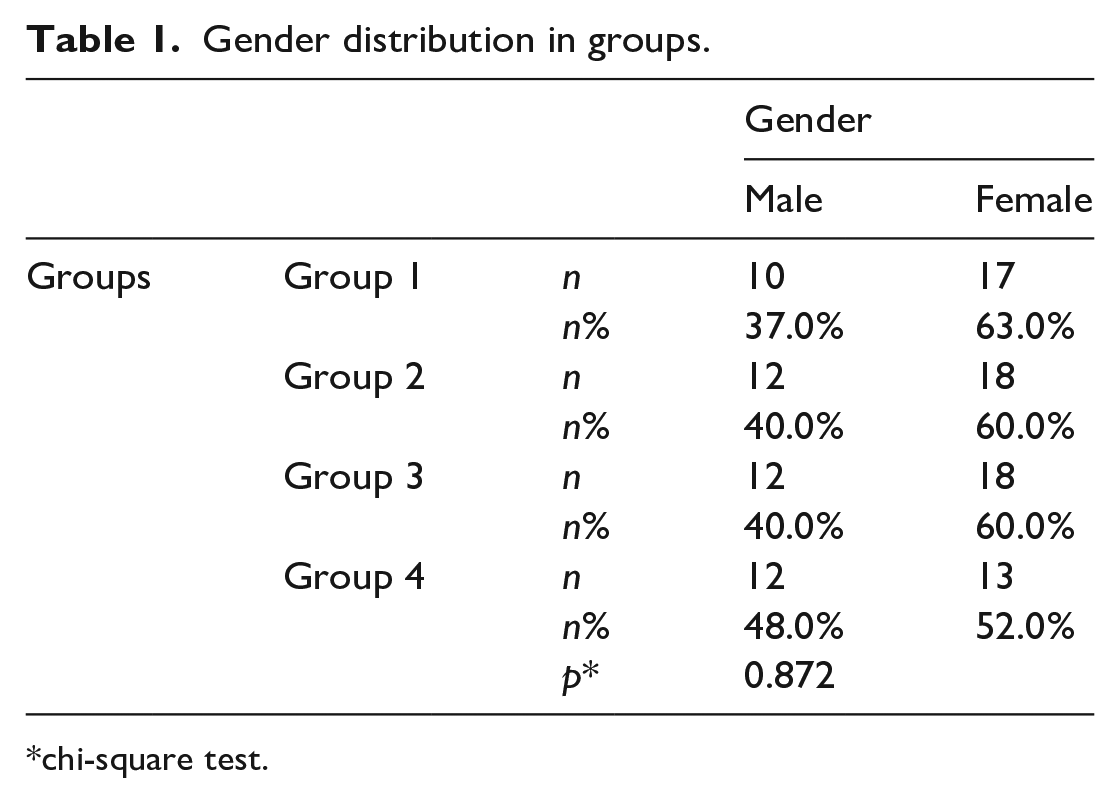
chi-square test.
Age distribution by groups.
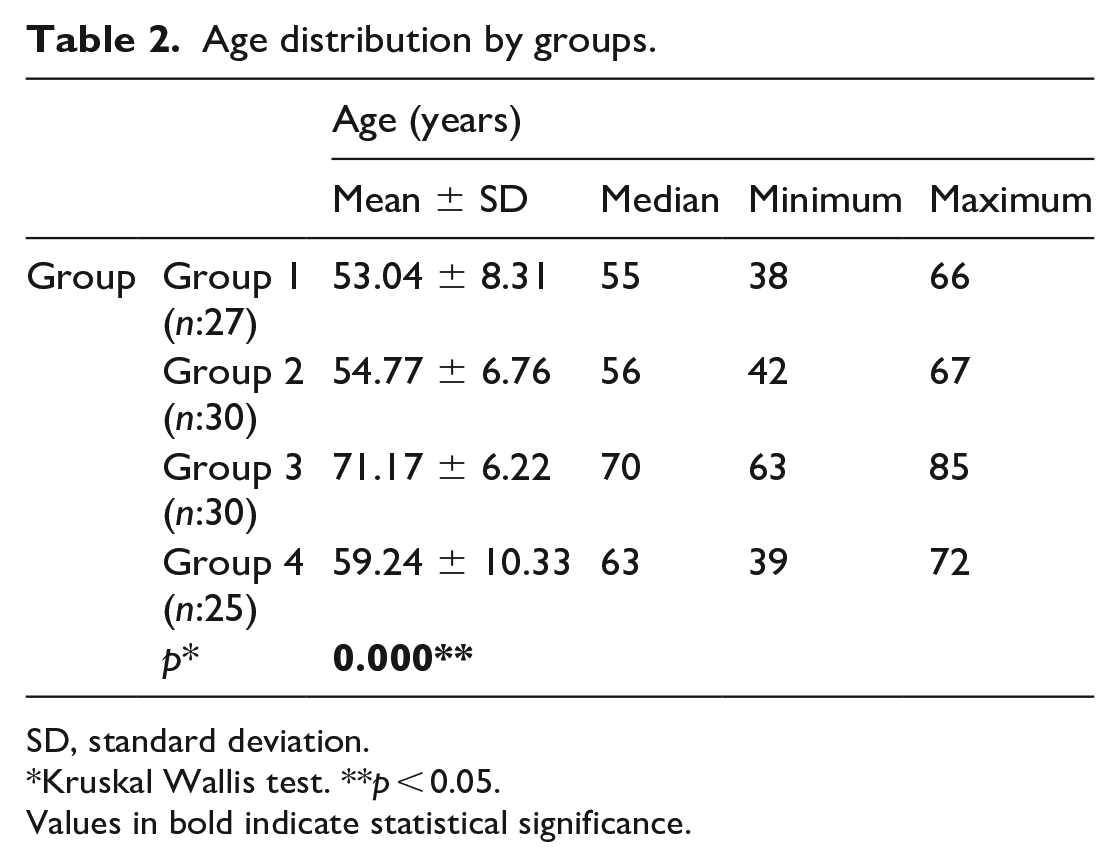
SD, standard deviation.
Kruskal Wallis test. **p < 0.05.
Values in bold indicate statistical significance.
The mean BMI was 25.80 ± 4.04 in Group 1, 24.88 ± 3.78 in Group 2, 28.89 ± 2.65 in Group 3 and 27.63 ± 2 in Group 4; Group 3 had the highest mean BMI among the groups, while Group 2 had the lowest mean BMI (Table 3).
Distribution of body mass index by groups.
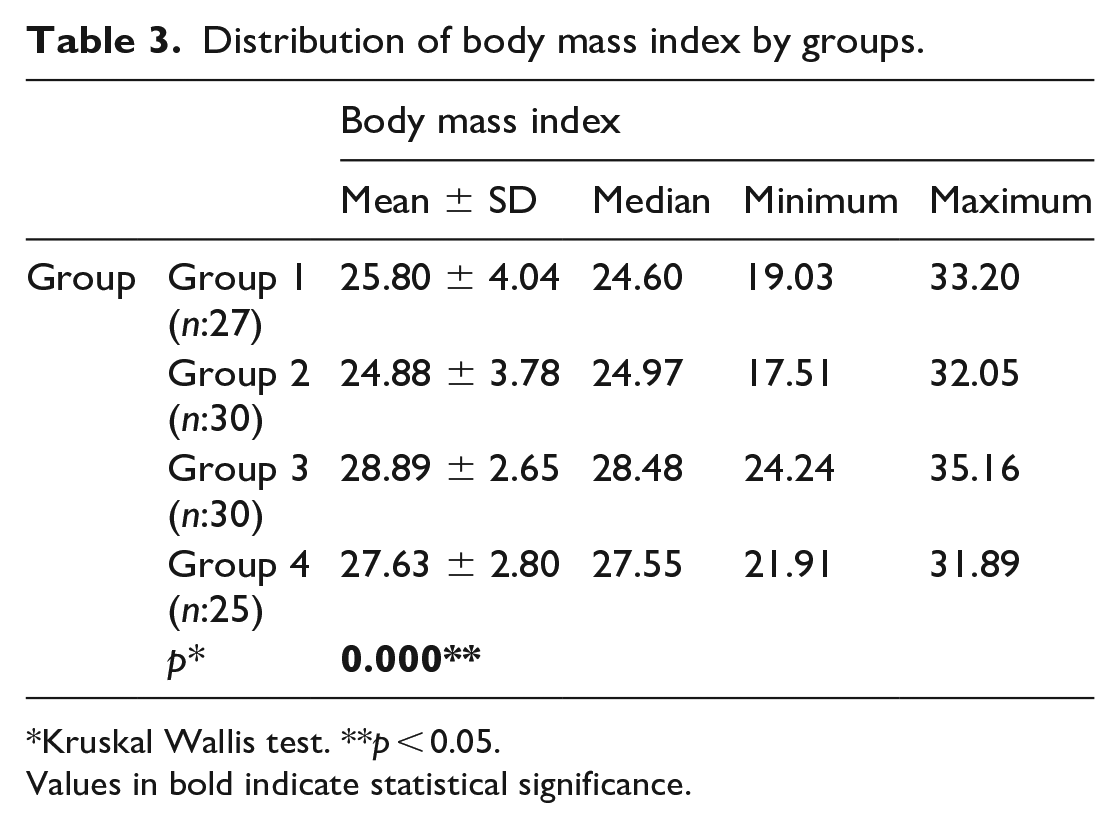
Kruskal Wallis test. **p < 0.05.
Values in bold indicate statistical significance.
The mean disease duration was 10.67 ± 6.51 in Group 1, 21.37 ± 18.2 in Group 2, 43.2 ± 20.51 in Group 3 and 8.48 ± 4.53 in Group 4, indicating a statistically significant difference between the groups (Table 4). Among the groups, Group 3 had the highest mean disease duration, while Group 4 had the lowest mean disease duration.
Distribution of disease duration in months by groups.
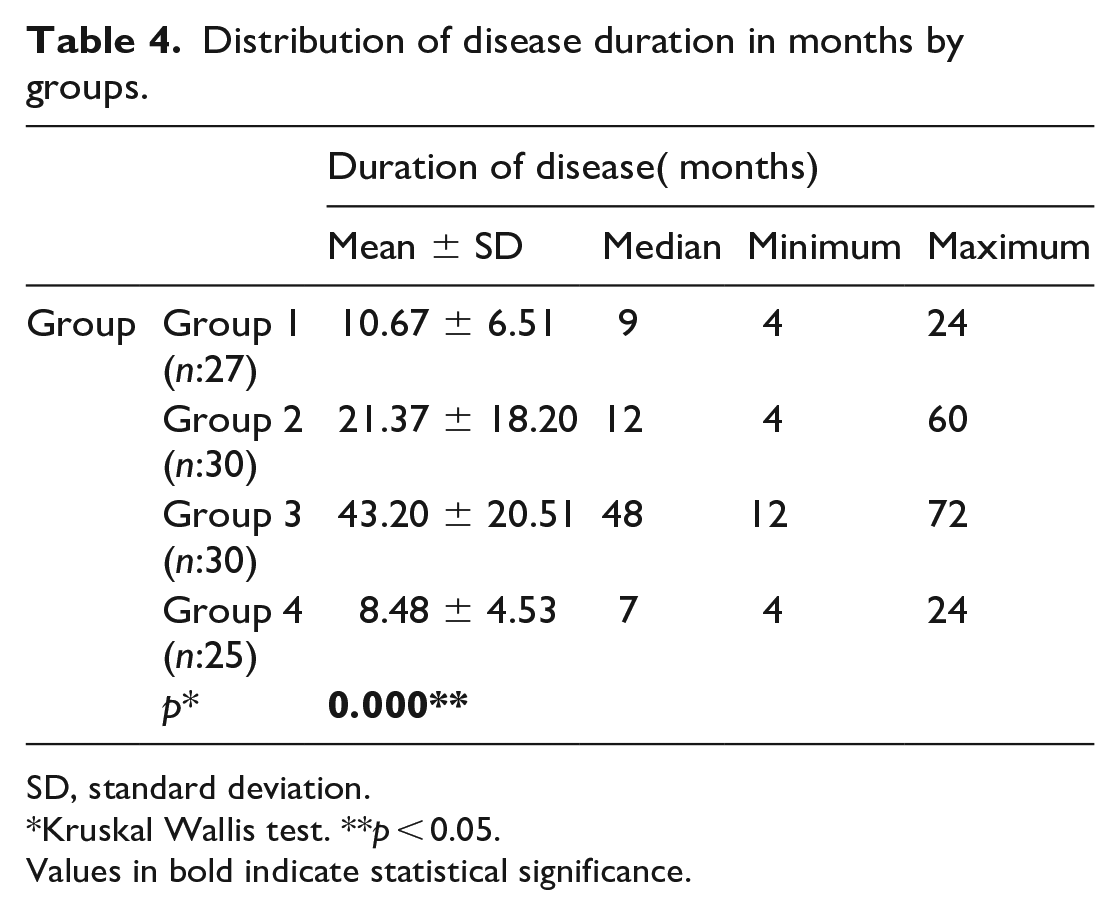
SD, standard deviation.
Kruskal Wallis test. **p < 0.05.
Values in bold indicate statistical significance.
The mean of the first sense of relief (1st VAS/2) in hours was 47.56 ± 36.45 in Group 1, 48.62 ± 28.07 in Group 2, 42.00 ± 23.48 in Group 3 and 23.93 ± 23.03 in Group 4, which shows a statistically significant difference between the groups (Table 4). Among the groups, Group 2 had the highest mean relaxation time, while Group 4 had the lowest mean relaxation time (Table 5).
Comparison of relaxation times between groups.
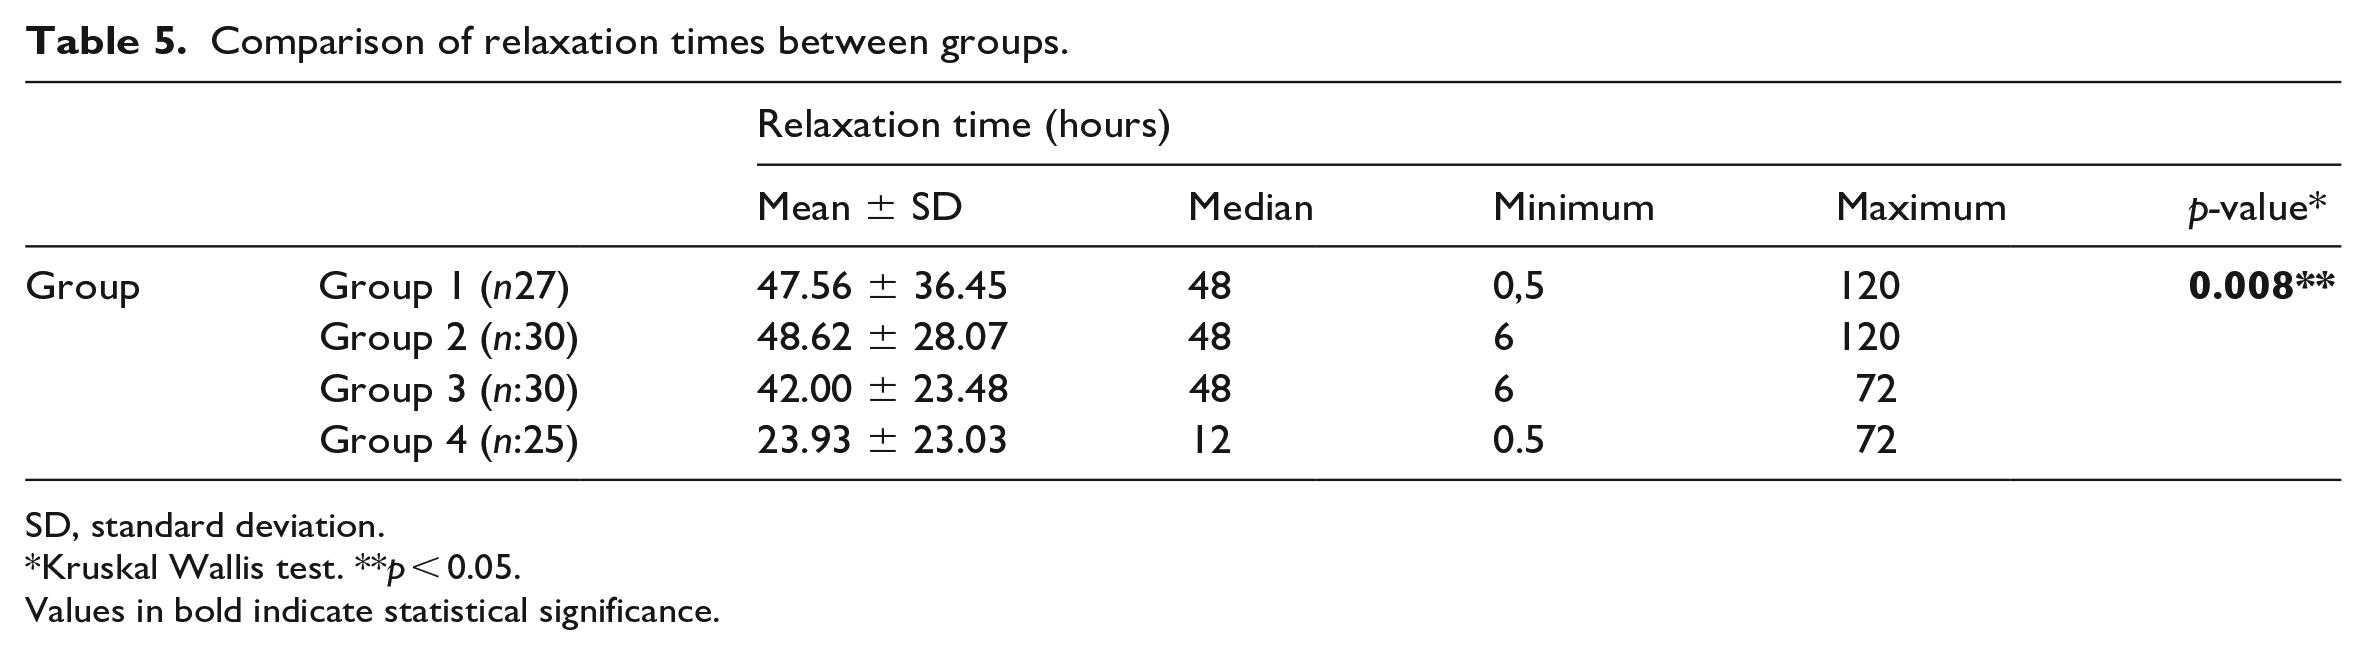
SD, standard deviation.
Kruskal Wallis test. **p < 0.05.
Values in bold indicate statistical significance.
Considering the WOMAC pain score averages of the patients in Group 1, the 1st-week change compared to pre-treatment was 8.72 ± 3.59 (74.61%), the 1st-month change was 9.88 ± 3.59 (84.50%), and the 3rd-month change 9.84 ± 3.59 (84.17%). While the mean of pain change at most was seen in the 1st month, the smallest least mean of pain change was seen in the 1st week (Table 6). The change in pain in the 1st month was compared to that in the 1st week; the change in the 3rd month was statistically significantly higher than the change in the 1st week (p < 0.05). However, the difference in the pain fluctuations between the 1st and 3rd months was not statistically significant (Table 7).
The changes in the 1st week, 1st month and 3rd month measurements of the patients in Group 1 compared to the pre-treatment measurements.
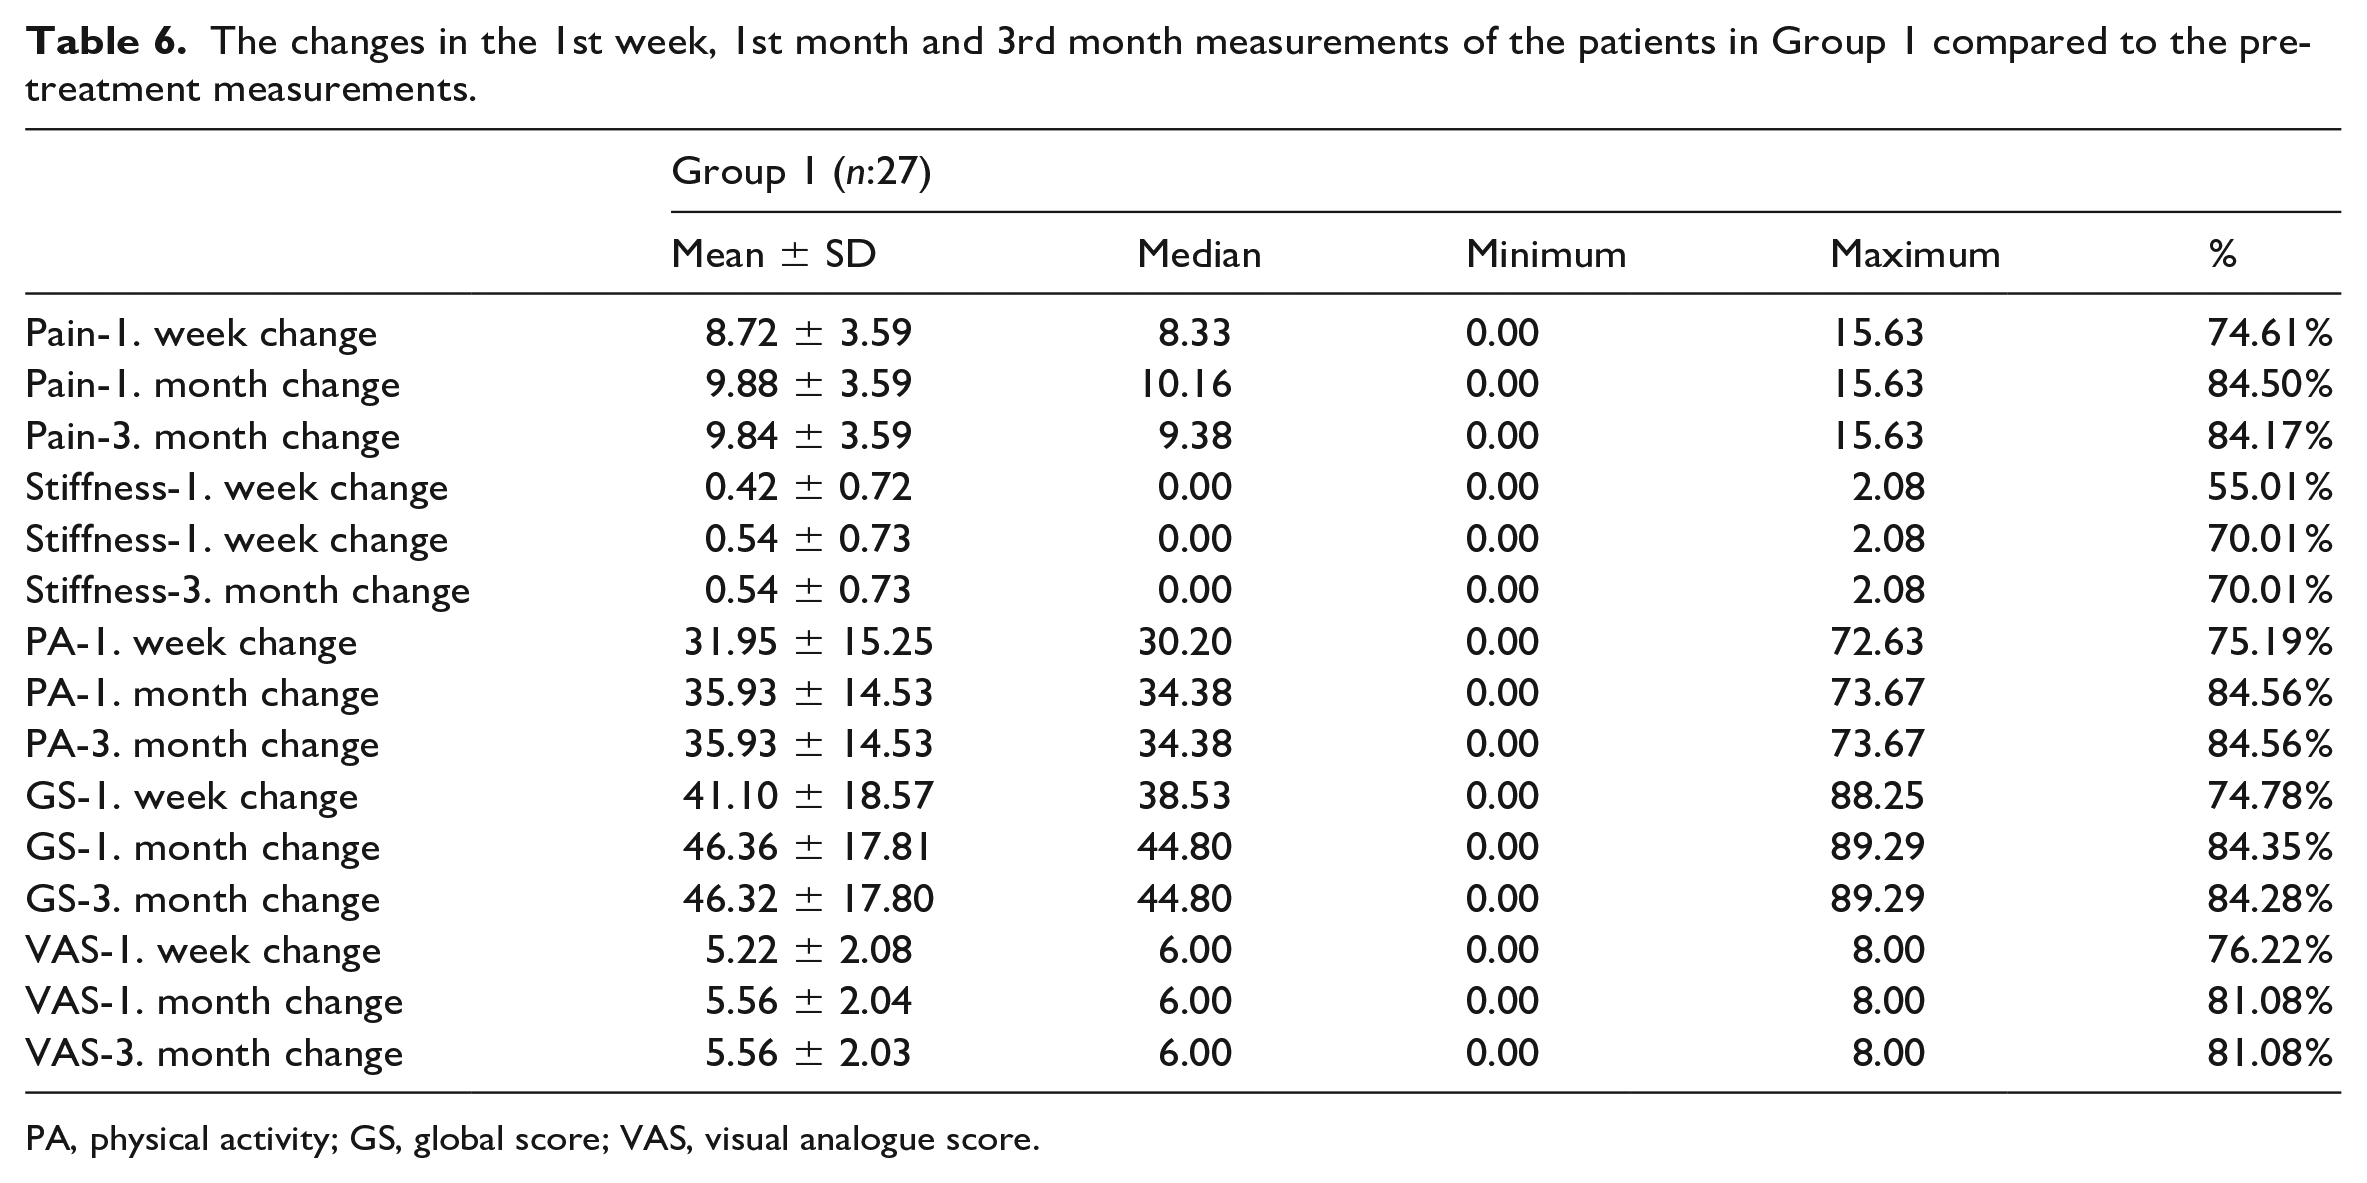
PA, physical activity; GS, global score; VAS, visual analogue score.
Statistical analysis of changes in Group 1 at week 1, month 1 and month 3.
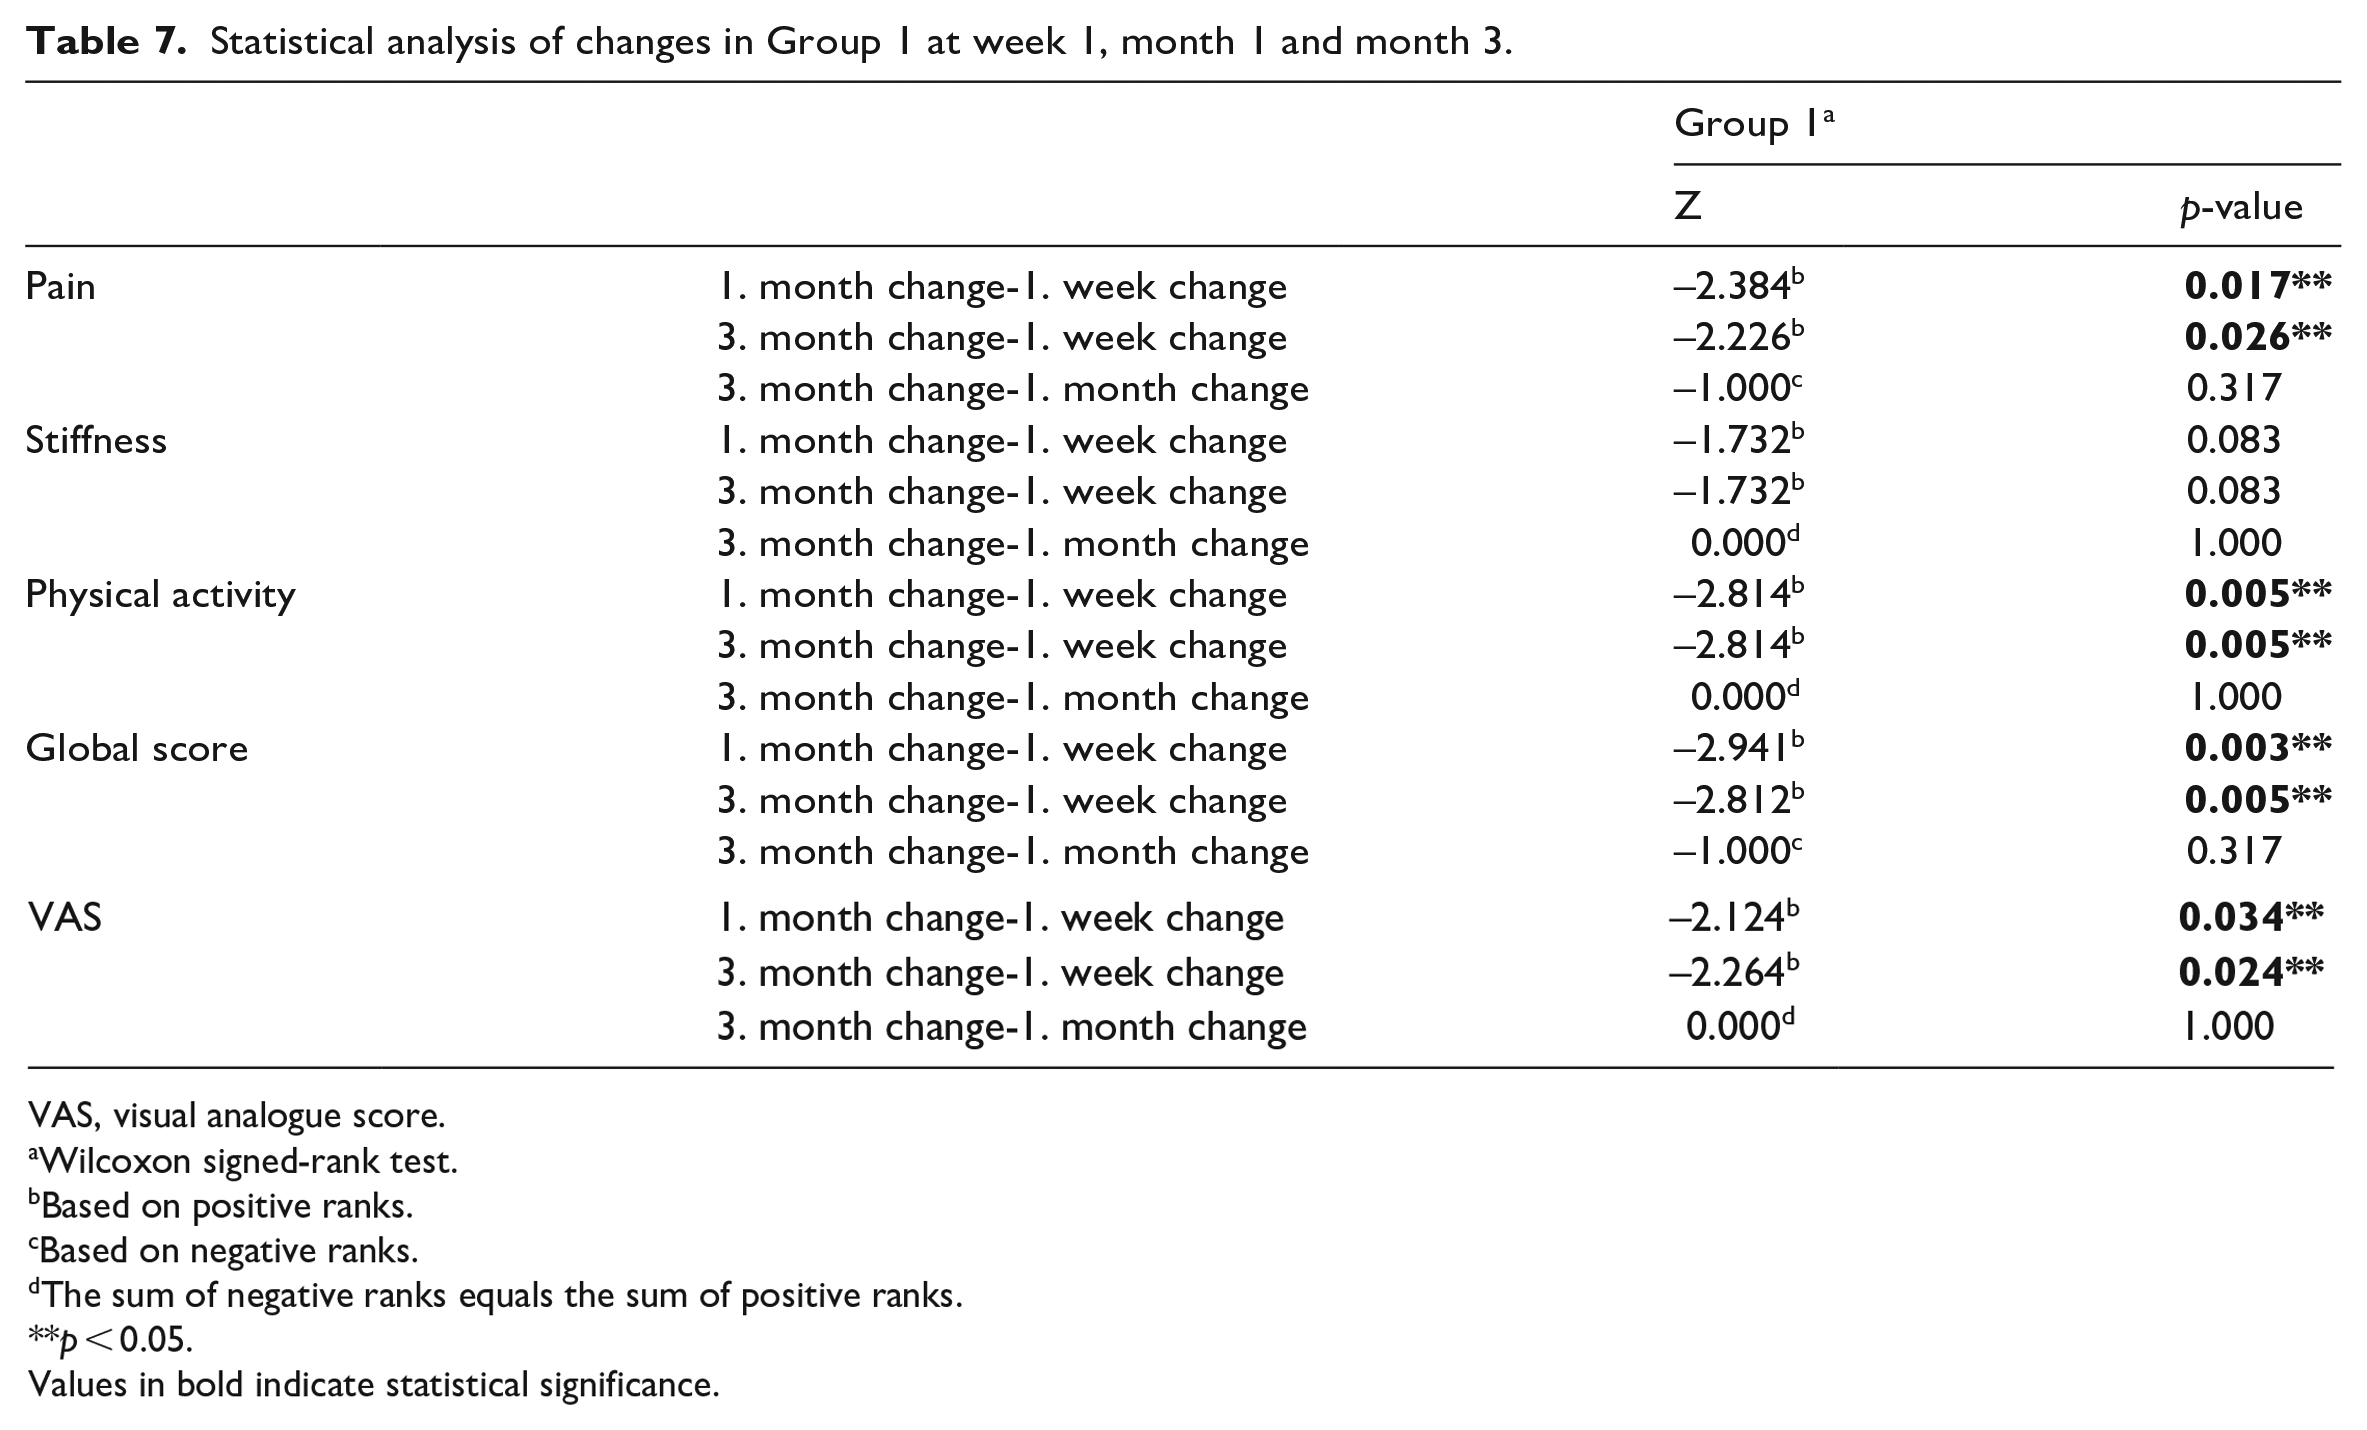
VAS, visual analogue score.
Wilcoxon signed-rank test.
Based on positive ranks.
Based on negative ranks.
The sum of negative ranks equals the sum of positive ranks.
p < 0.05.
Values in bold indicate statistical significance.
In terms of the WOMAC stifness score averages of the patients in Group 1, the 1st-week change compared with the pre-treatment change was 0.42 ± 0.72 (55.01%), the 1st-month change was 0.54 ± 0.73 (70.01%), and 3rd-month change was 0.54 ± 0.73 (70.01%). While the maximum stifness change average was seen in the 1st month, the minimum stifness change average was seen in the 1st week (Table 6). Although the mean stifness change in the 1st month and 3rd month was higher than that in the 1st week, this difference was not statistically significant (Table 7).
When the physical activity averages of the patients in Group 1 were examined, the 1st-week change was 31.95 ± 15.25 (75.19%), the 1st-month change was 35.93 ± 14.53 (84.56%), and the 3rd-week change compared to pre-treatment change was 35.93 ± 14.53 (84.56%). While the average physical activity change was the highest in the 1st month, the least was seen in the 1st week (Table 6). Physical activity change in the 1st month and the 3rd month was statistically significantly higher than the change in the 1st week (p < 0.05). However, the difference between the changes in physical activities in the 1st and 3rd months was not statistically significant (Table 7).
Considering the WOMAC global score averages of the patients in Group 1, the 1st-week change compared to pre-treatment was 41.10 ± 18.57 (74.78%), the 1st-month change was 46.36 ± 17.81 (84.35%), and the 3rd-month change was 46.32 ± 17.80 (84.28%). The maximum global mean score change was seen in the 1st month, while the smallest global score change mean was observed in the 1st week (Table 1.6). The global score for the 1st month was different from that of the 1st week; the change in the 3rd month was statistically significantly higher than the change in the 1st week (p < 0.05). However, the difference between the global score changes in the 1st and 3rd months was not statistically significant (Table 7).
When the mean VAS of the patients in Group 1 was examined, the change in the 1st week compared to the pre-treatment period was 5.22 ± 2.08 (76.22%), in the 1st month was 5.56 ± 2.04 (81.08%) and in the 3rd month was 5.56 ± 2.03 (81.08%). The highest mean of VAS change was seen in the 1st month, while the least VAS change average was observed in the 1st week (Table 6). VAS 1t-month change from the 1st-week change, and the 3rd-month change from the 1st-week change were statistically significantly higher (p < 0.05). However, the difference between the VAS changes in the 1st and 3rd months was not statistically significant (Table 7).
When the changes in the patients in Group 2 were examined, the highest mean change was observed in the 1st month for WOMAC pain, WOMAC physical activity, WOMAC global score, and VAS, and in the 3rd month for WOMAC stiffness (Table 8). However, when the Group 2 changes were examined, no statistically significant difference was found in the changes (Table 9).
The changes in the 1st week, 1st month and 3rd month measurements of the patients in Group 2 compared to the pretreatment measurements.

SD, standard deviation; PA, physical activity; GS, global score; VAS, visual analogue score.
Statistical analysis of the changes in Group 2 in the 1st week, 1st month and 3rd month.
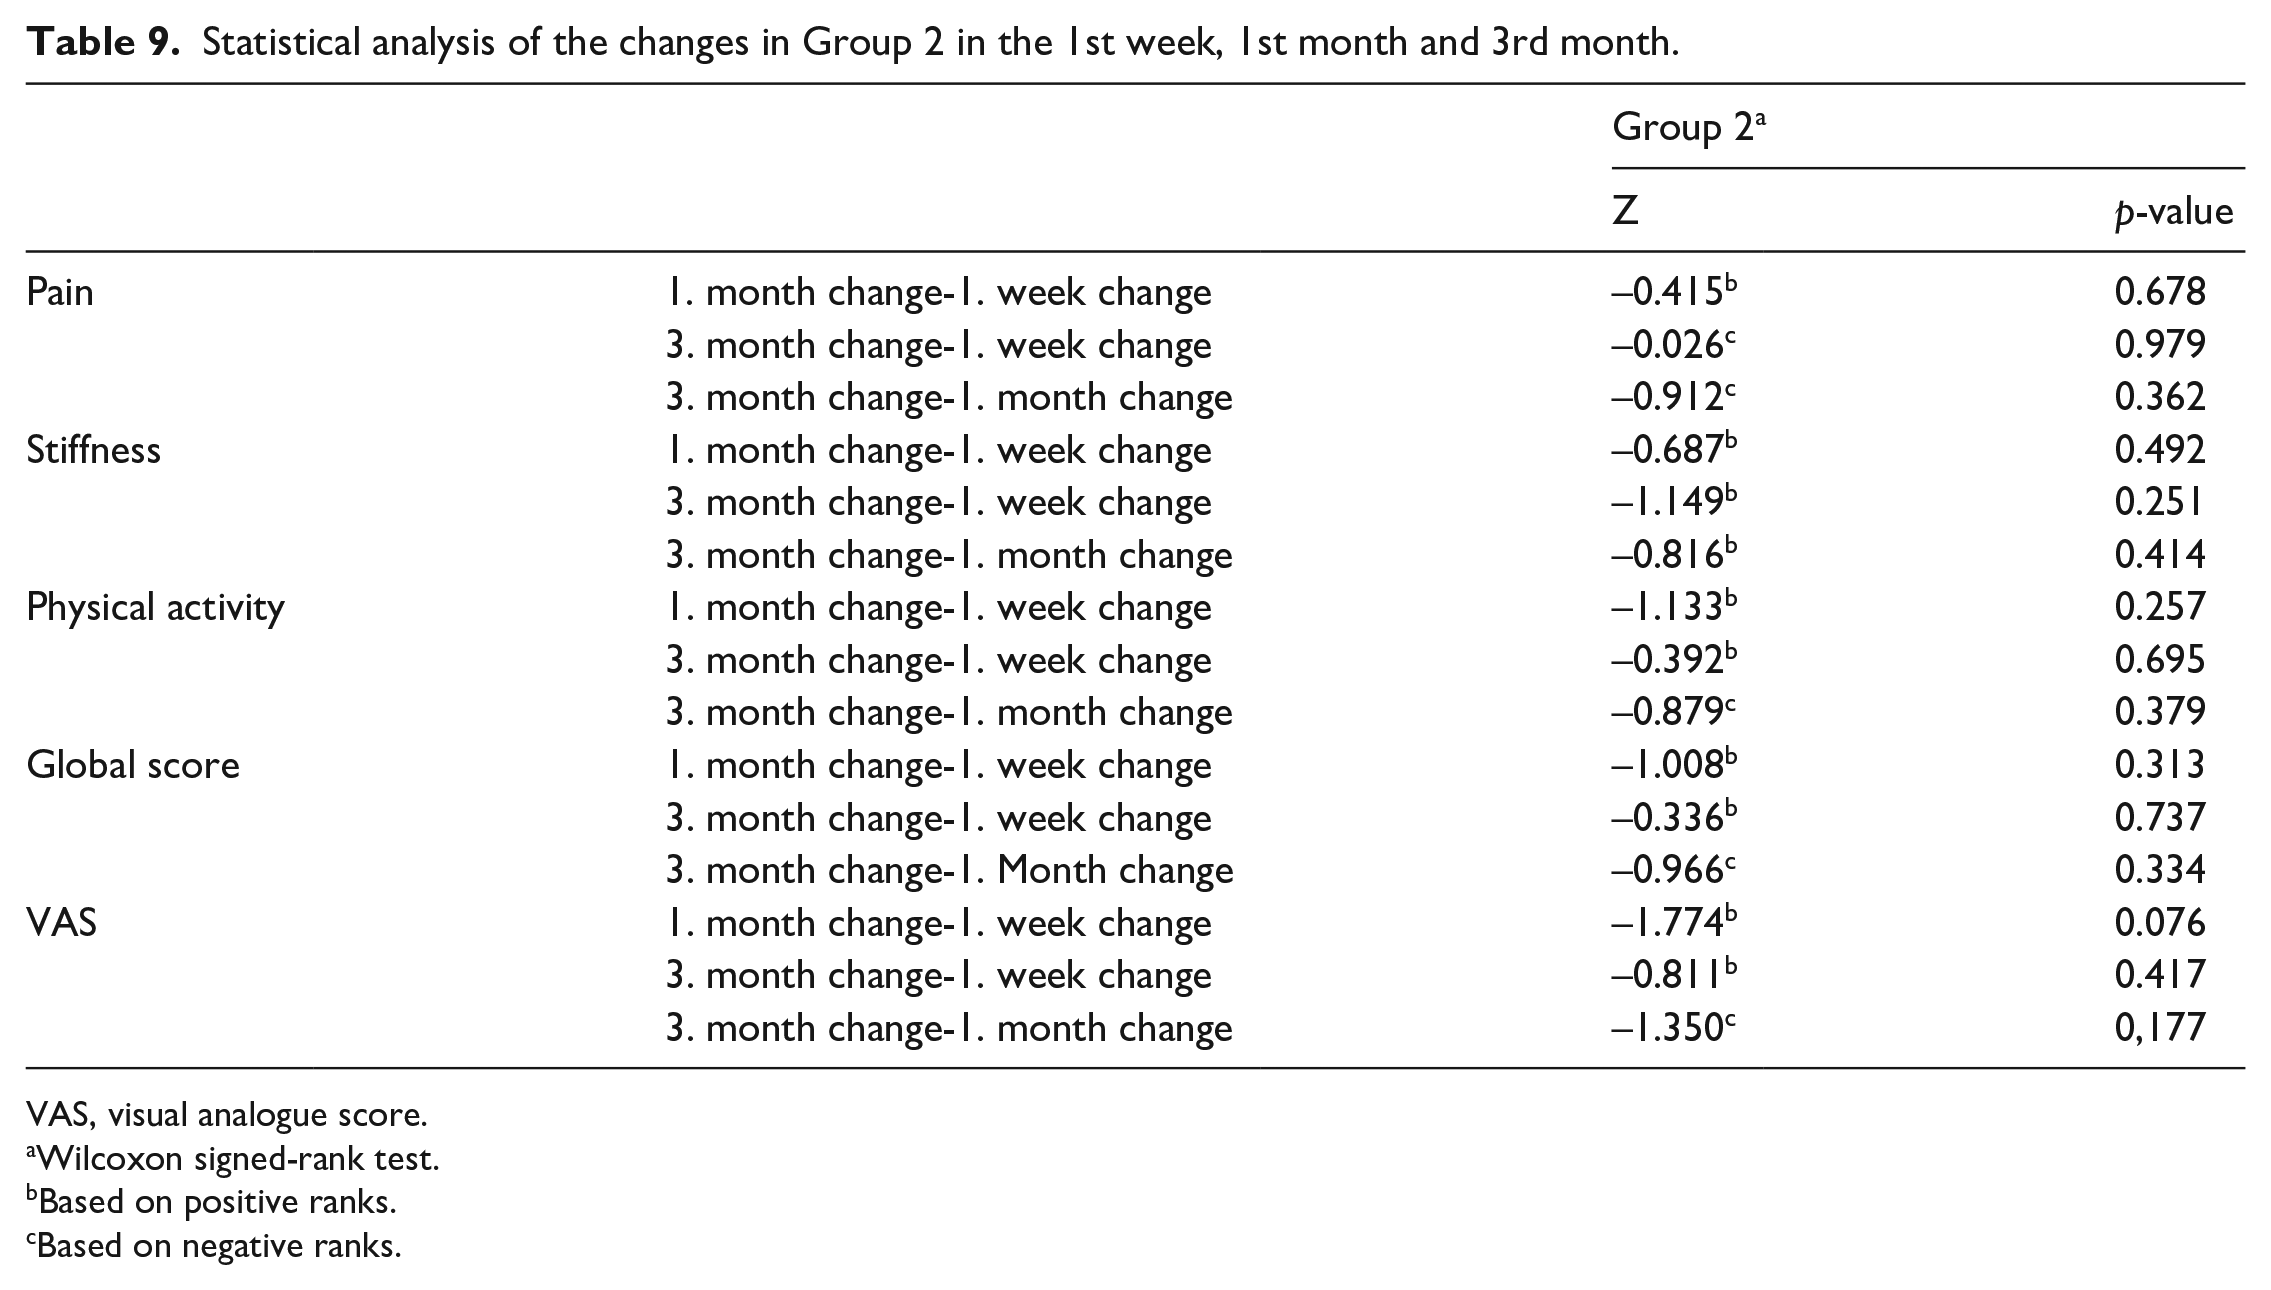
VAS, visual analogue score.
Wilcoxon signed-rank test.
Based on positive ranks.
Based on negative ranks.
Considering the changes in the patients in Group 3, the maximum mean change was observed in the 1st month for WOMAC stiffness, WOMAC-physical activity and VAS. The maximum mean change was observed in the 1st week for pain and in the 3rd month for the WOMAC global score (Table 10). However, when the Group 3 changes were examined, no statistically significant difference was found in the changes (Table 11).
The changes in the 1st week, 1st month and 3rd month measurements of the patients in Group 3 compared to the pre-treatment measurements.
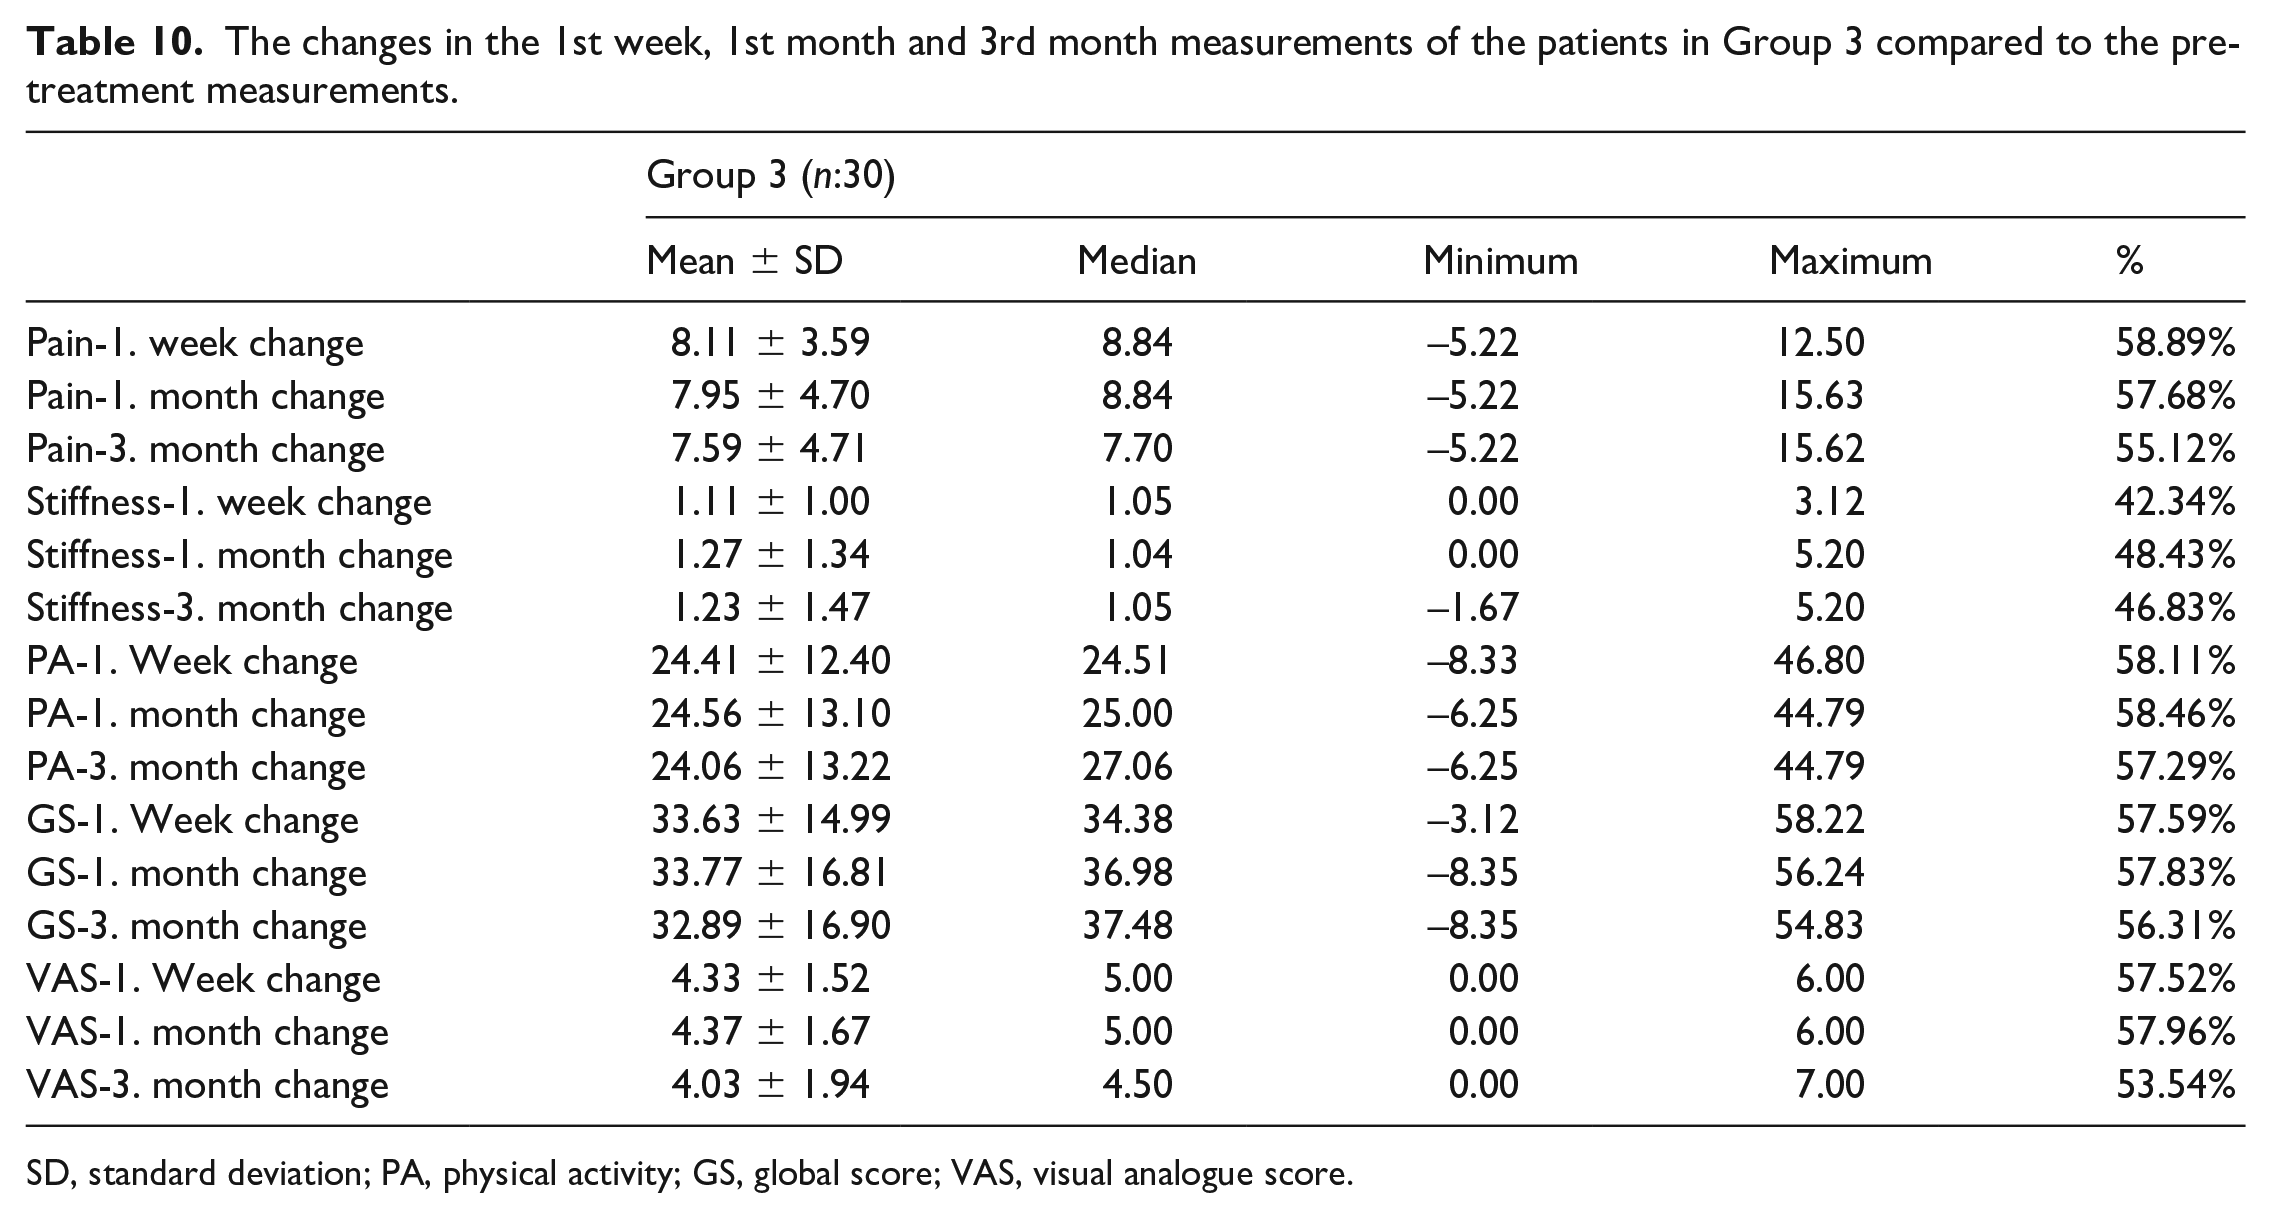
SD, standard deviation; PA, physical activity; GS, global score; VAS, visual analogue score.
Statistical analysis of changes in Group 3 in the 1st week, 1st month and 3rd month.
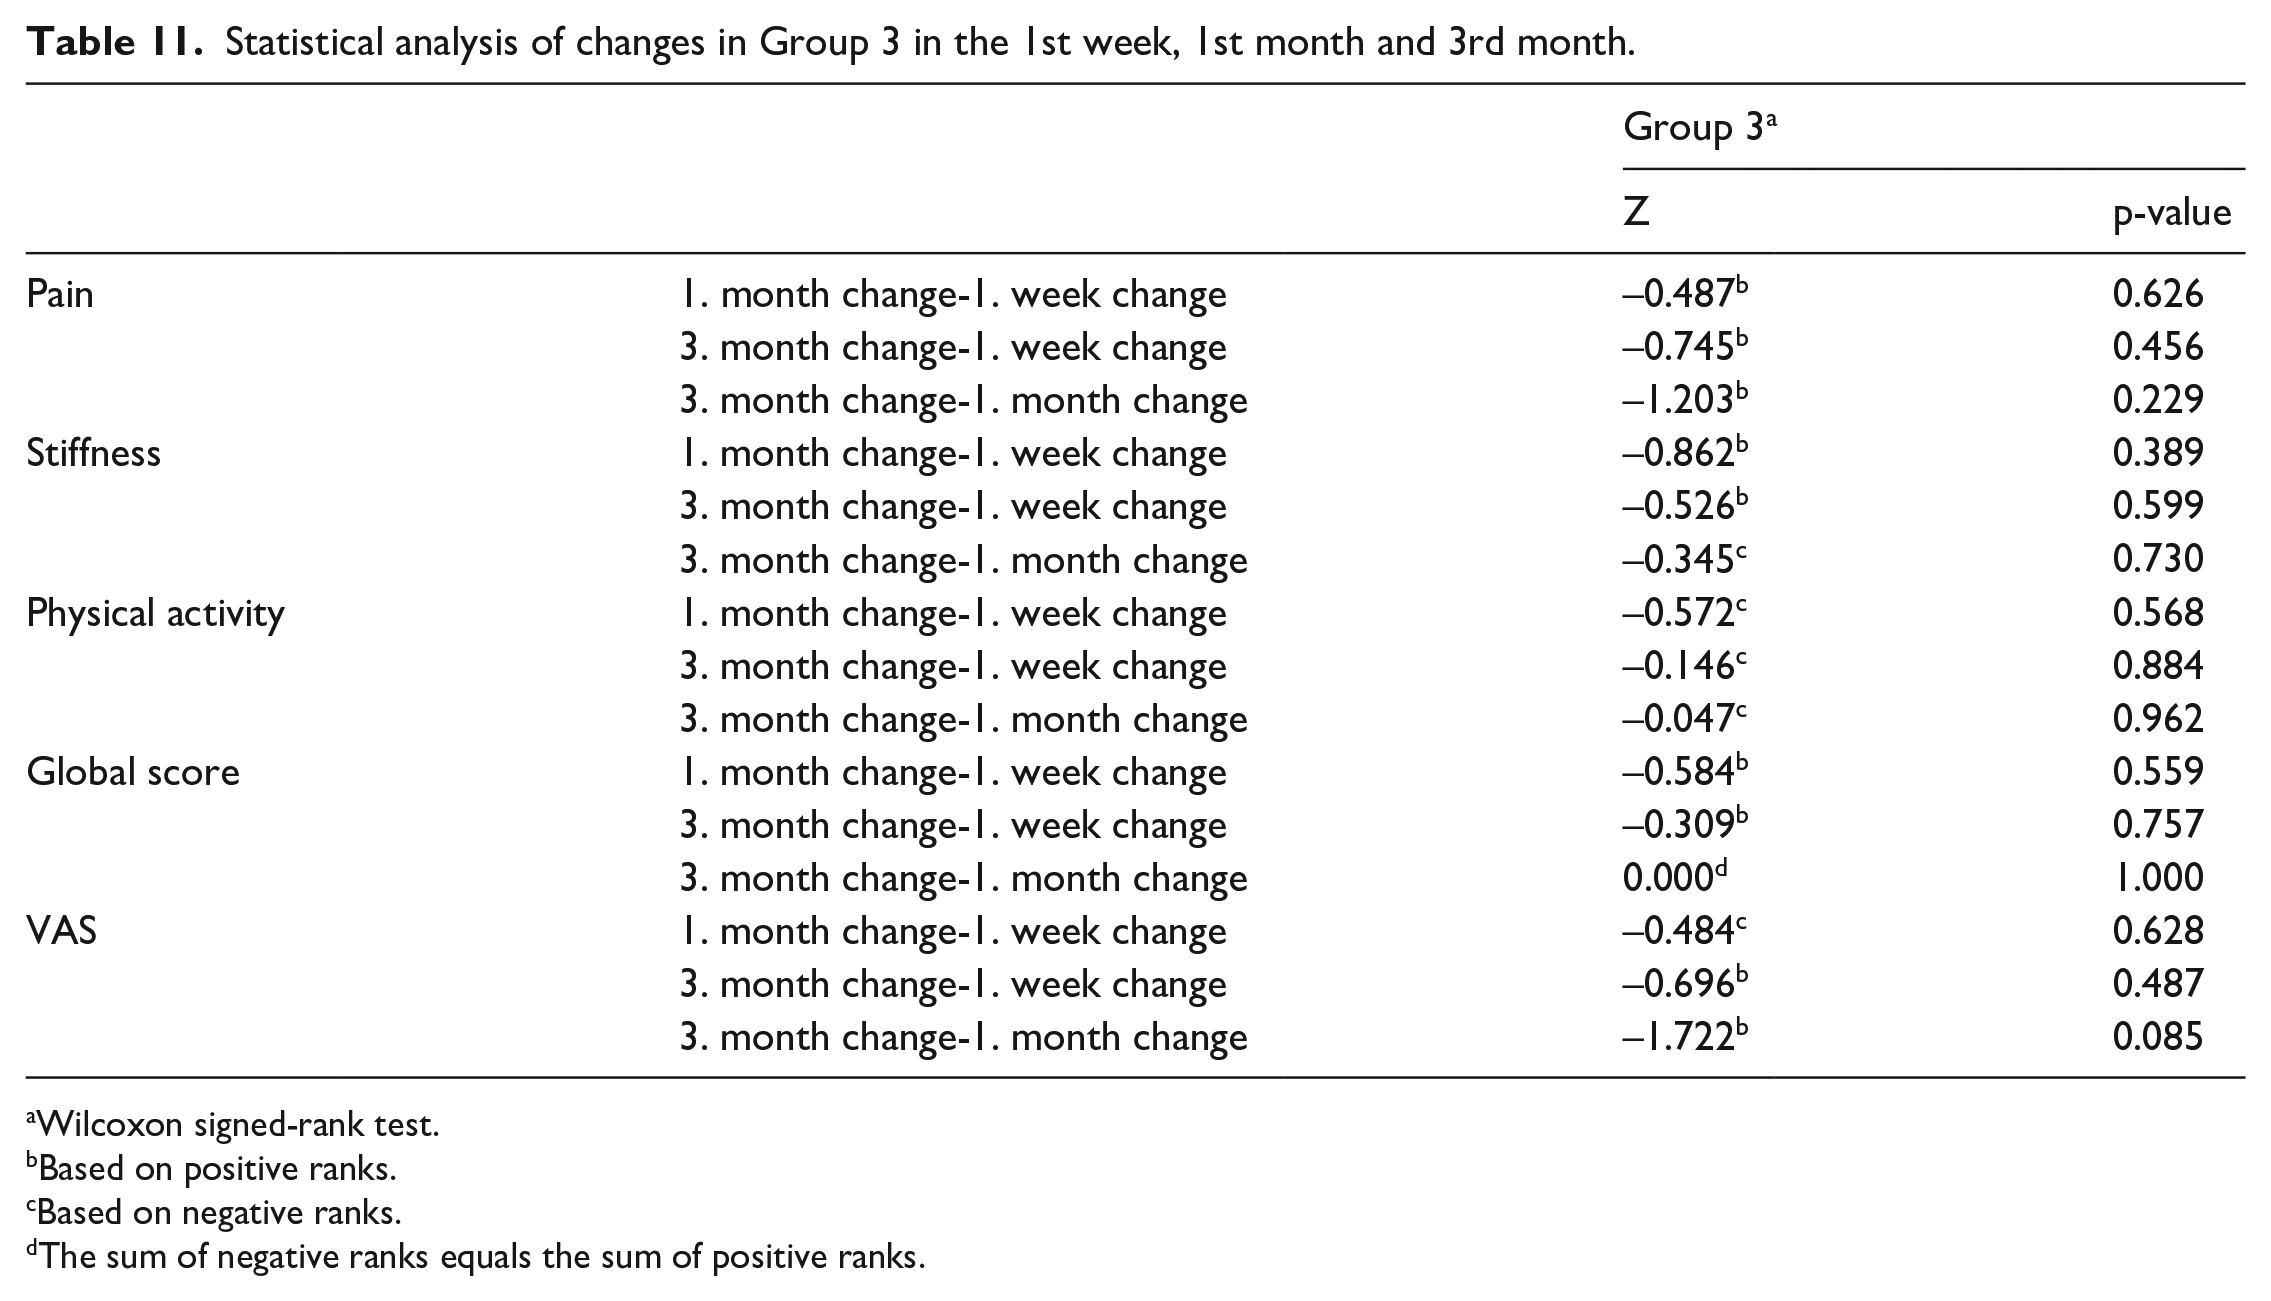
Wilcoxon signed-rank test.
Based on positive ranks.
Based on negative ranks.
The sum of negative ranks equals the sum of positive ranks.
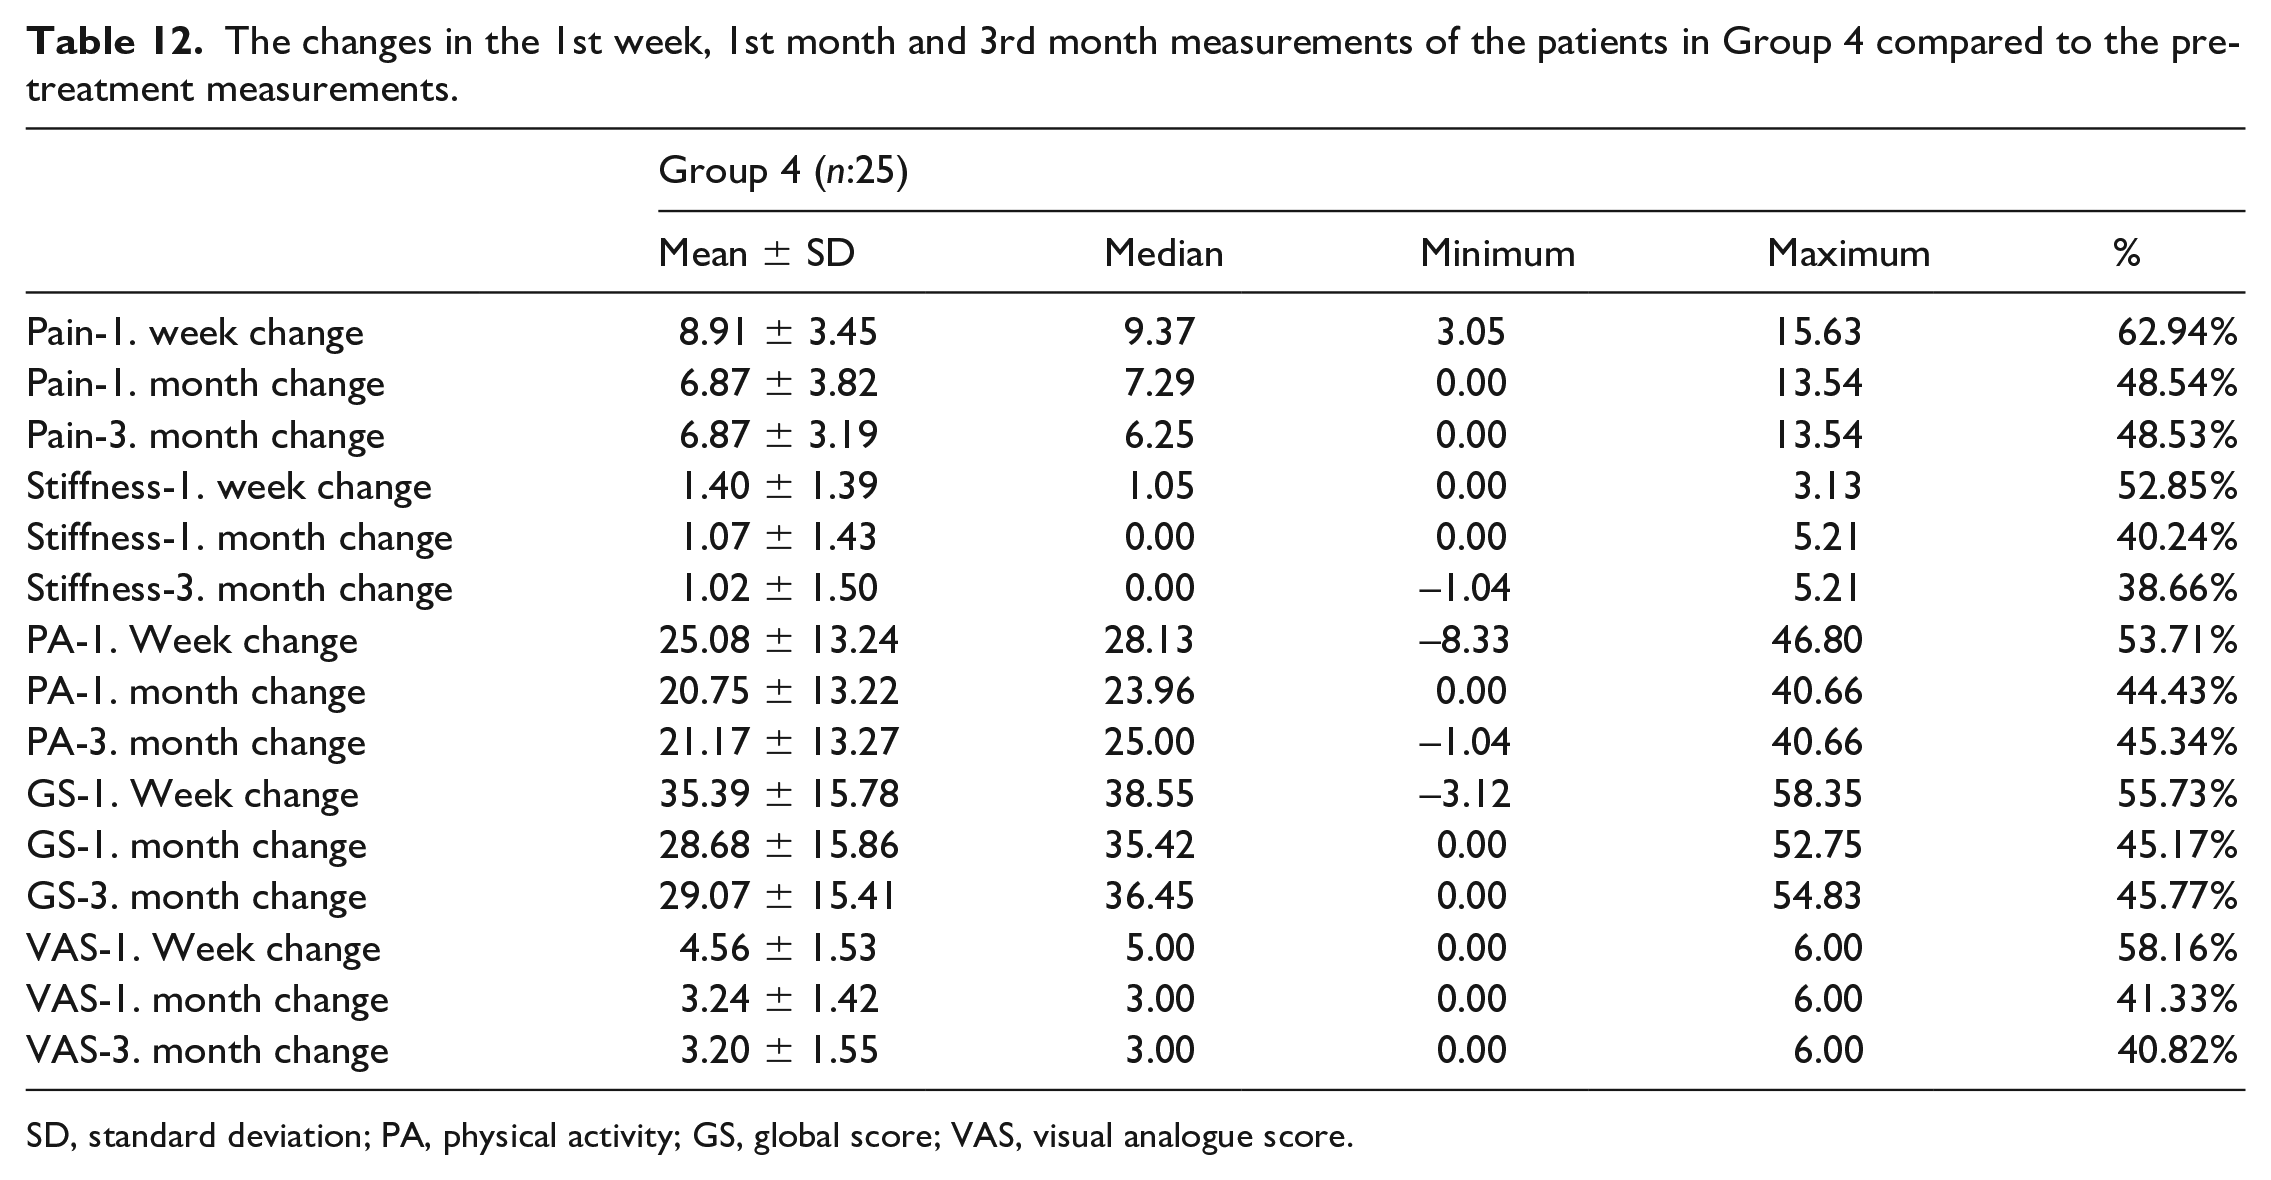
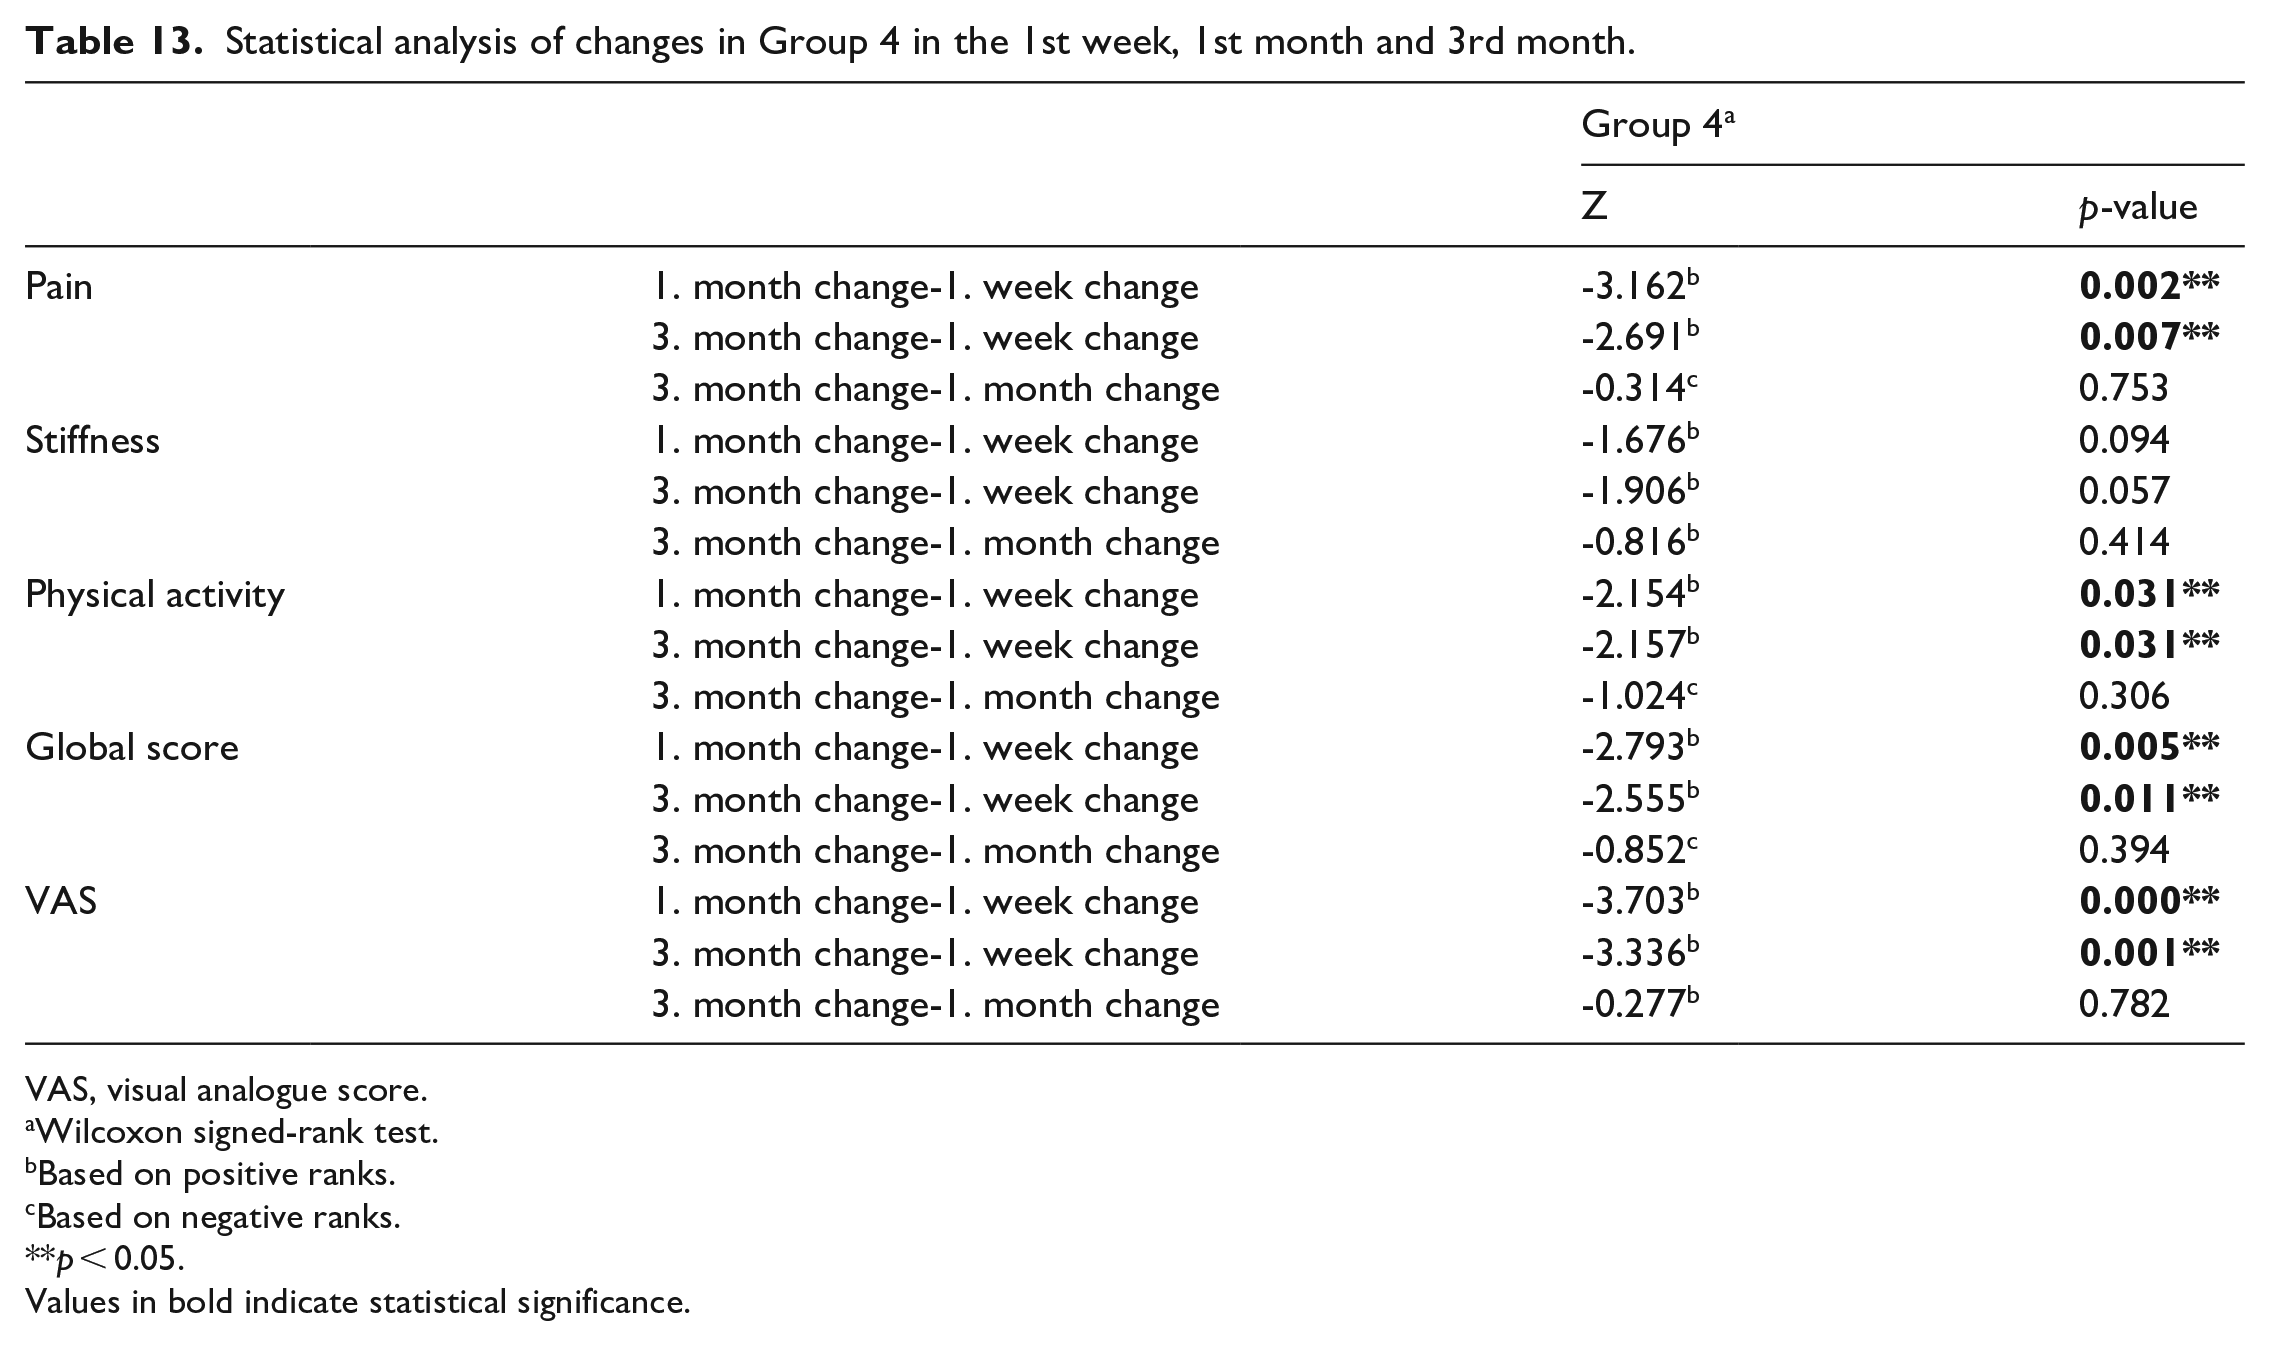
Considering the WOMAC pain score averages of the patients in Group 4, the 1st-week change compared to pre-treatment was 8.91 ± 3.45 (62.94%), the 1st-month change was 6.87 ± 3.82 (48.54%) and the 3rd-month change 6.87 ± 3.19 (48.53%). While the maximum pain change average was observed in the 1st week, the minimum pain change average was observed in the 3rd month (Table 12). The 1st-month change in pain was compared to the 1st-week change; the change in the 3rd month was statistically less significant than the change in the 1st week (p < 0.05). However, the difference between the change in pain in the 1st month and the 3rd month was not statistically significant (Table 13).
The changes in the 1st week, 1st month and 3rd month measurements of the patients in Group 4 compared to the pre-treatment measurements.
SD, standard deviation; PA, physical activity; GS, global score; VAS, visual analogue score.
Statistical analysis of changes in Group 4 in the 1st week, 1st month and 3rd month.
VAS, visual analogue score.
Wilcoxon signed-rank test.
Based on positive ranks.
Based on negative ranks.
p < 0.05.
Values in bold indicate statistical significance.
Considering the WOMAC stiffness score averages of the patients in Group 4, the 1st-week change compared to pre-treatment was 1.40 ± 1.39 (52.85%), the 1st-month change was 1.07 ± 1.43 (40.24%) and the 3rd-month change was 1.02 ± 1.50 (38.66%). While the maximum stiffness change average was seen in the 1st week, the minimum stifness change average was seen in the 3rd month (Table 12). Although the mean stifness change in the 1st month and the 3rd month was less than that in the 1st week, this difference was not statistically significant (Table 13).
When the physical activity averages of the patients in Group 4 were examined, the change in the 1st week compared to the pre-treatment period was 25.08 ± 13.24 (53.71%), in the 1st month is 20.75 ± 13.22 (44.43%), and in the 3rd month change was 21.17 ± 13.27 (45.34%). While the average physical activity change was the highest in the 1st week, the least average physical activity change was observed in the 1st month (Table 12). Changes in physical activity in the 1st month, 1st week and 3rd month were statistically less significant than the change in the 1st week (p < 0.05). However, the difference between 1st- and 3rd-month physical activity changes was not statistically significant (Table 13).
Considering the WOMAC global score averages of the patients in Group 4, the 1st-week change compared to pre-treatment was 35.39 ± 15.78 (55.73%), the 1st-month change was 28.68 ± 15.86 (45.17%) and the 3rd-month change was 29.07 ± 15.41 (45.77%). The maximum global mean score change was seen in Week 1, while the smallest global mean score change was seen in Month 1 (Table 12). In terms of the global scores, the change in the 3rd month was statistically less significant than the change in the 1st week (p < 0.05). However, the difference between the 1st- and 3rd-month global score changes was not statistically significant (Table 13).
When the mean VAS values of the patients in Group 4 were examined, the change in the 1st week compared to the pre-treatment period was 4.56 ± 1.53 (58.16%), in the 1st month was 3.24 ± 1.42 (41.33%) and in the 3rd month was 3.20 ± 1.55 (40.82%). The highest mean of VAS change was seen in Week 1, while the smallest mean of VAS change was seen in the 3d month (Table 12). In terms of VAS change, the change in the 3rd month was statistically less significant than the change in the 1st week (p < 0.05). However, the difference between the 1st- and 3rd-month VAS changes was not statistically significant (Table 13).
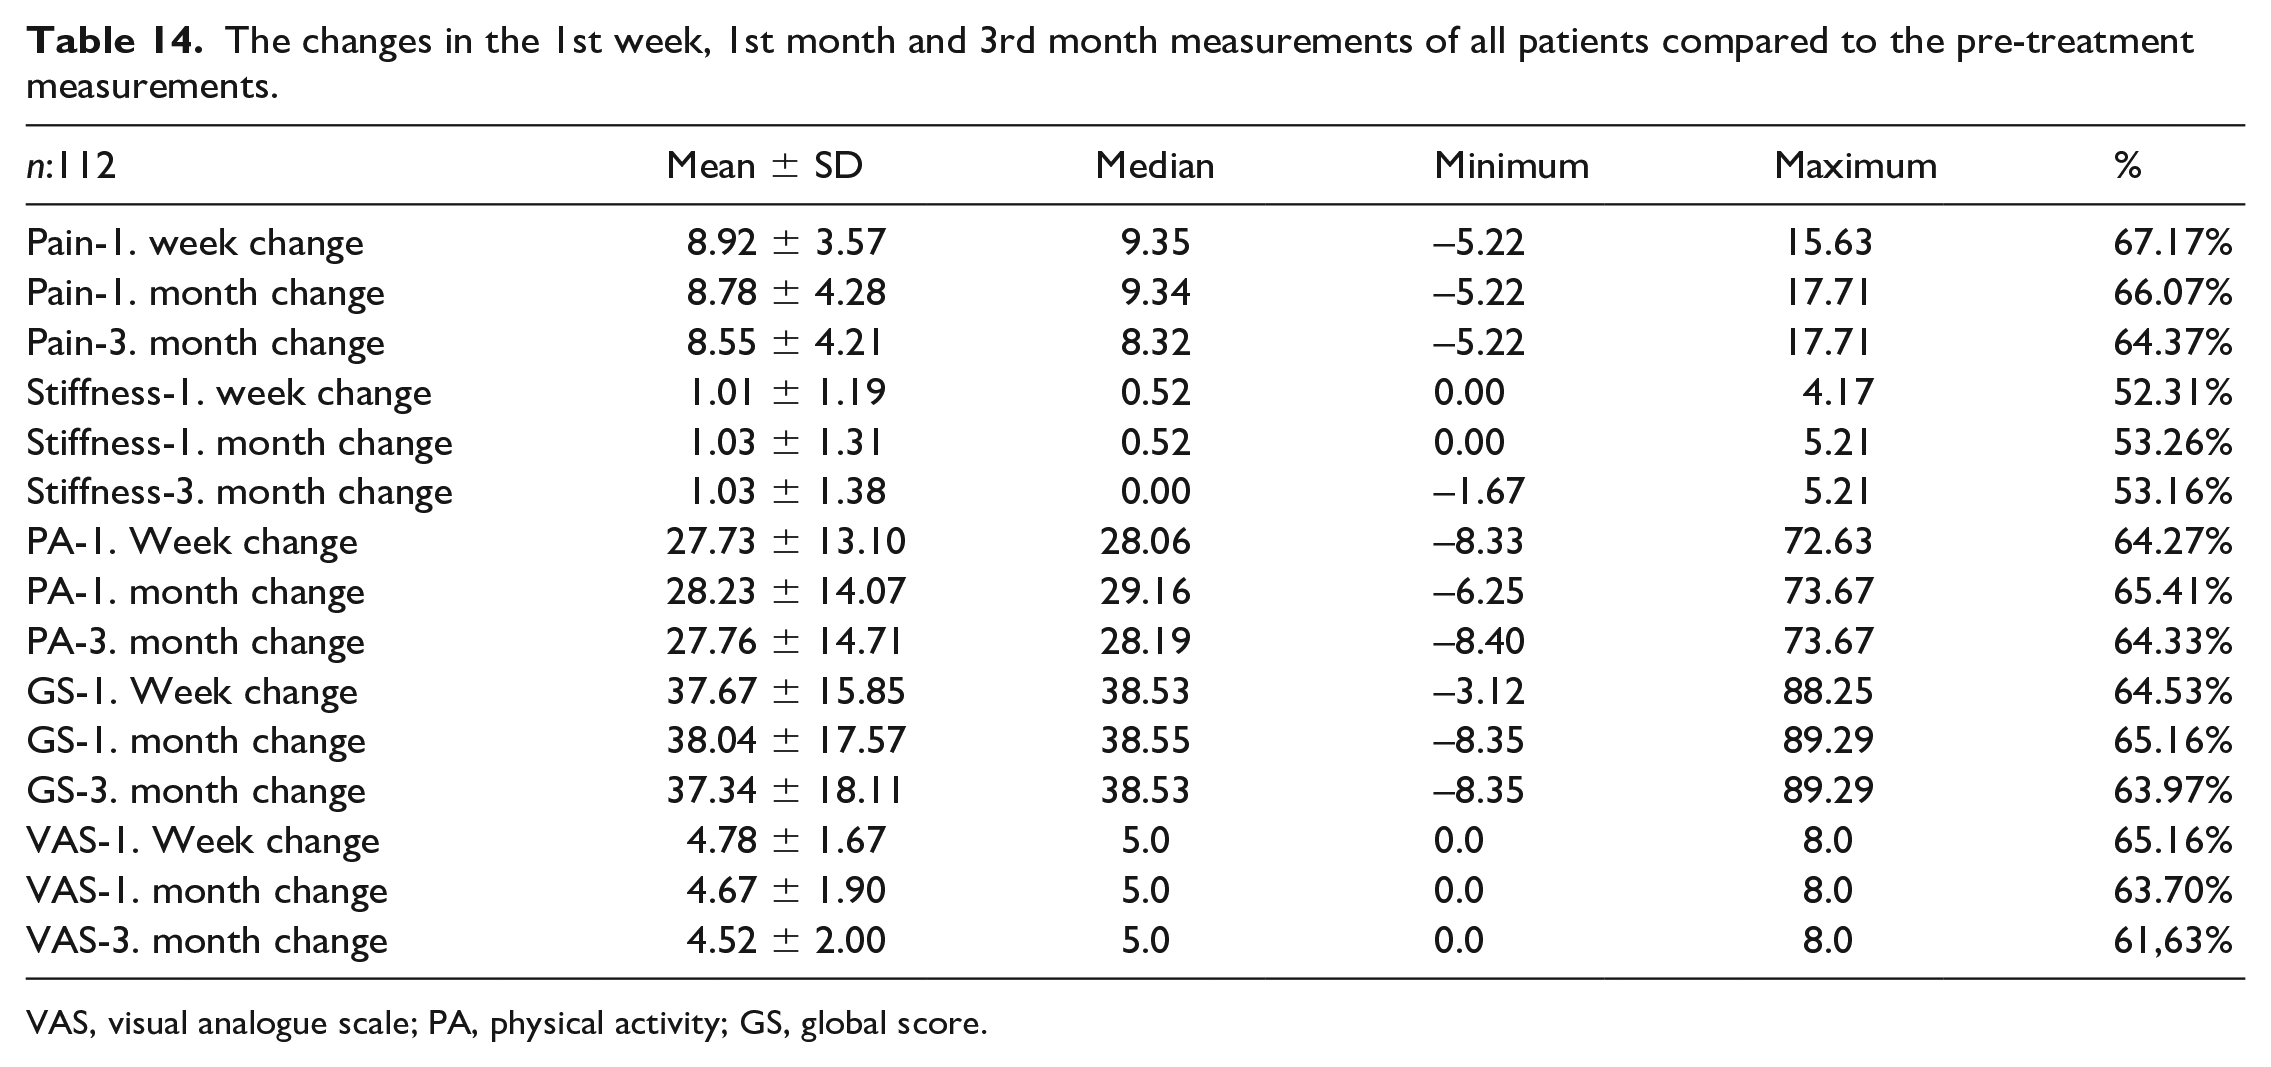
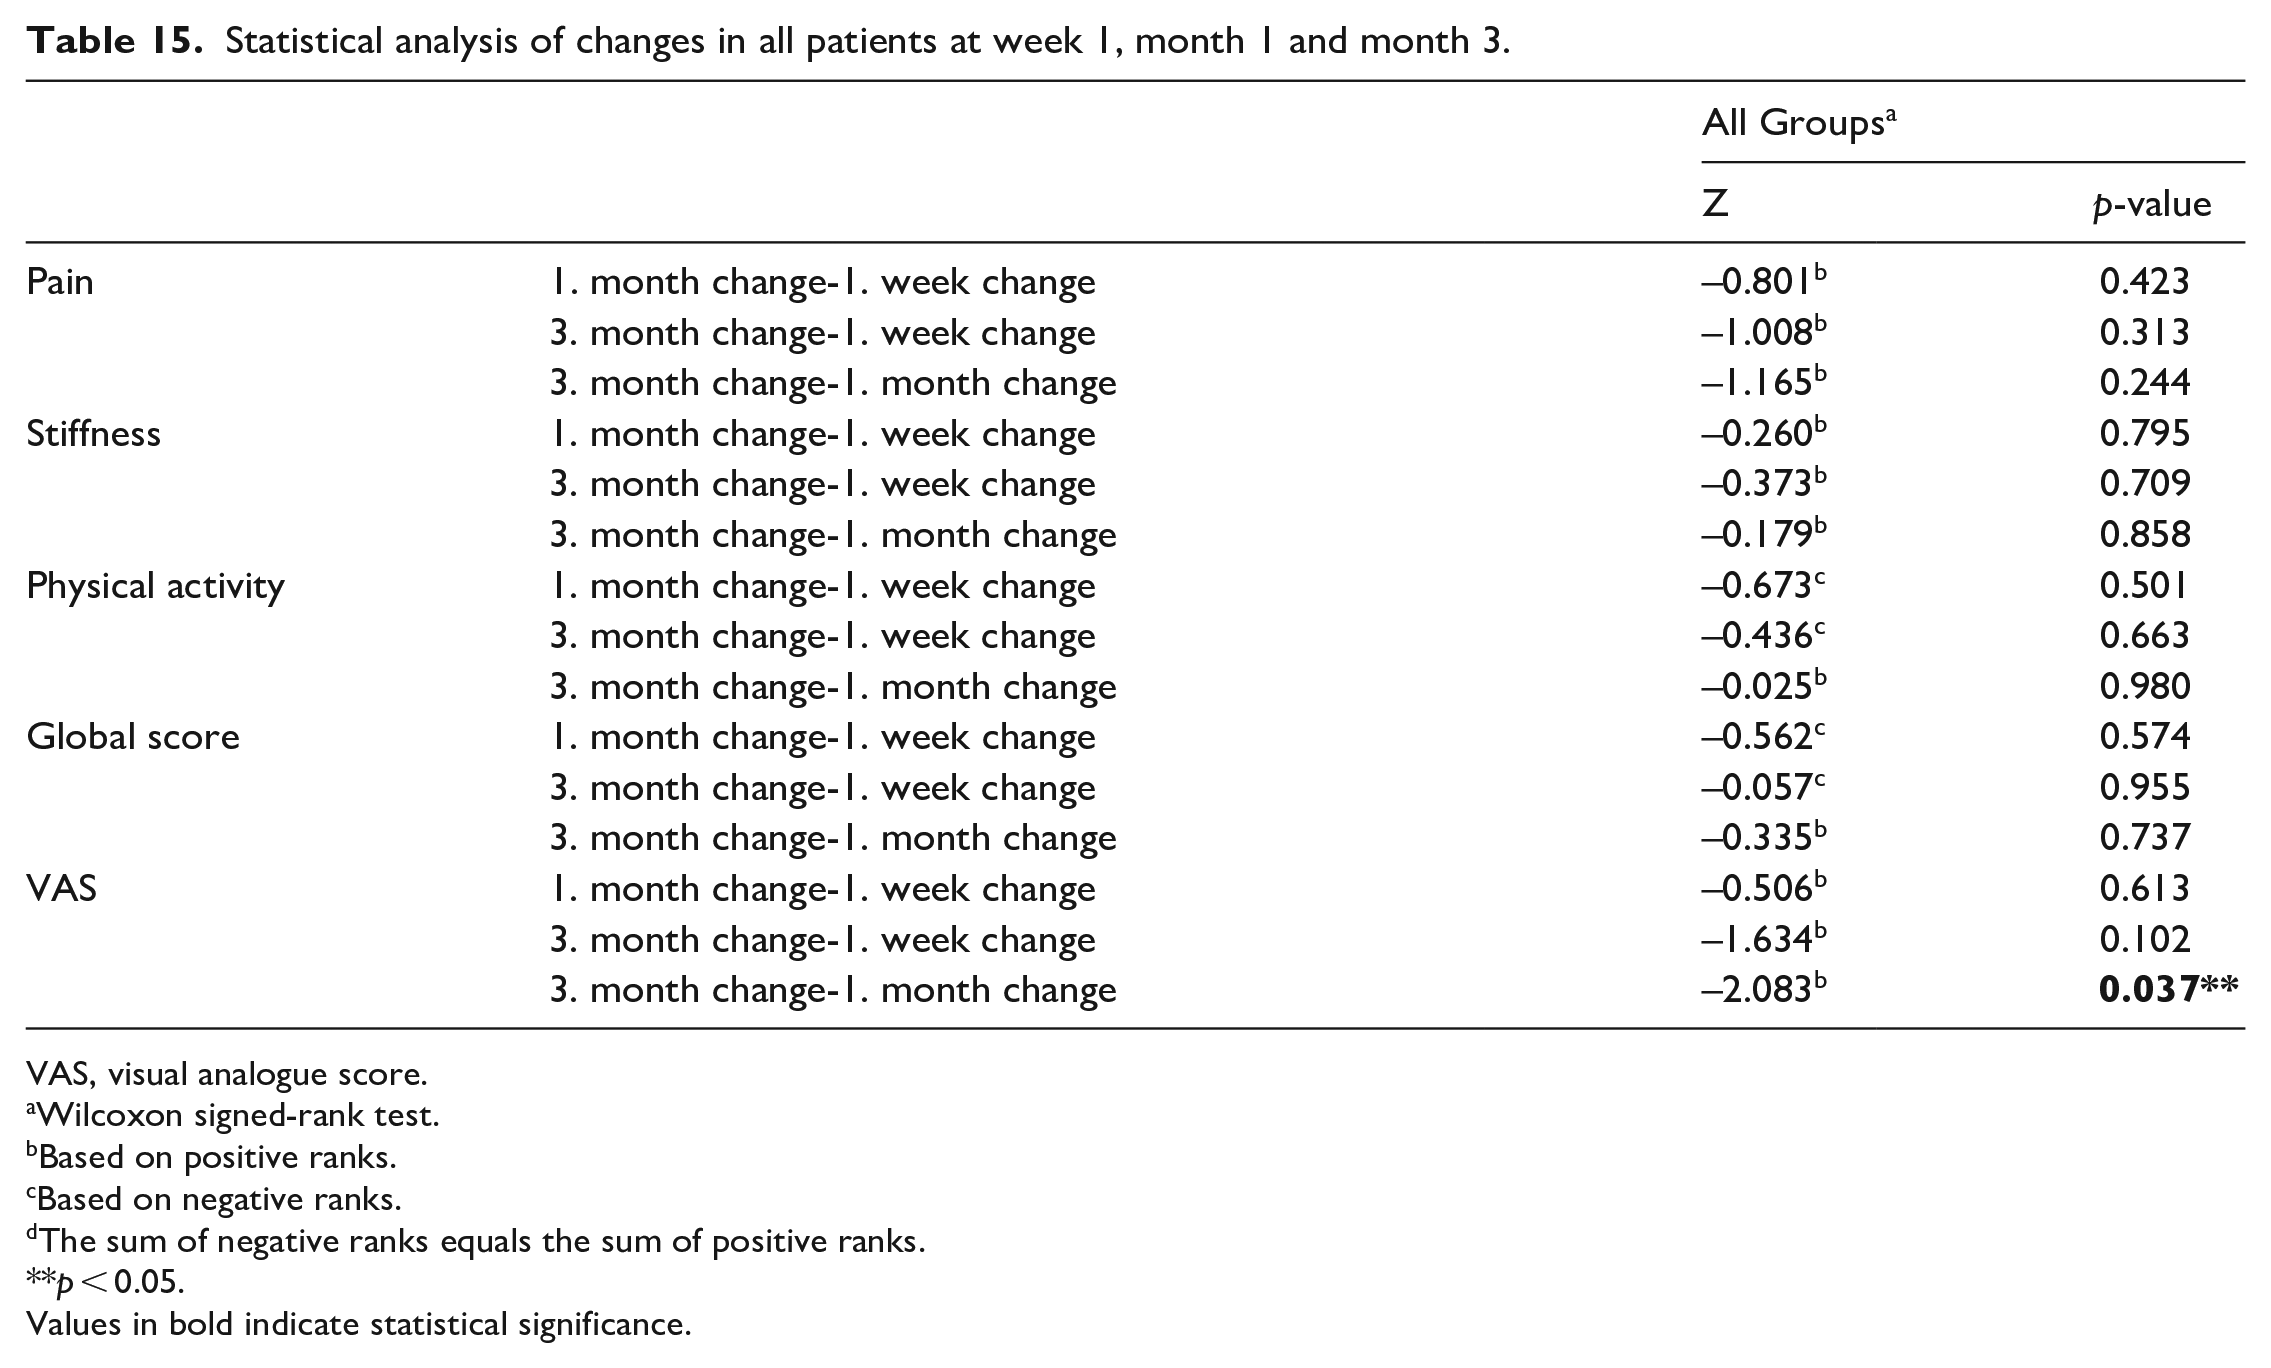
Among all the changes observed in all the patients, the most significant change in WOMAC-pain and VAS was observed in the 1st week. Stiffness was observed in the 1st month for physical activity and global score (Table 14). However, the change in only the VAS values of all patients in the 1st month was statistically significantly higher than the change in the 3rd month (p < 0.05). When all other changes were examined, no statistically significant difference was found (Table 15). No serious complication was observed after PENG block applied in all groups (Table 16).
The changes in the 1st week, 1st month and 3rd month measurements of all patients compared to the pre-treatment measurements.
VAS, visual analogue scale; PA, physical activity; GS, global score.
Statistical analysis of changes in all patients at week 1, month 1 and month 3.
VAS, visual analogue score.
Wilcoxon signed-rank test.
Based on positive ranks.
Based on negative ranks.
The sum of negative ranks equals the sum of positive ranks.
p < 0.05.
Values in bold indicate statistical significance.
Complications.
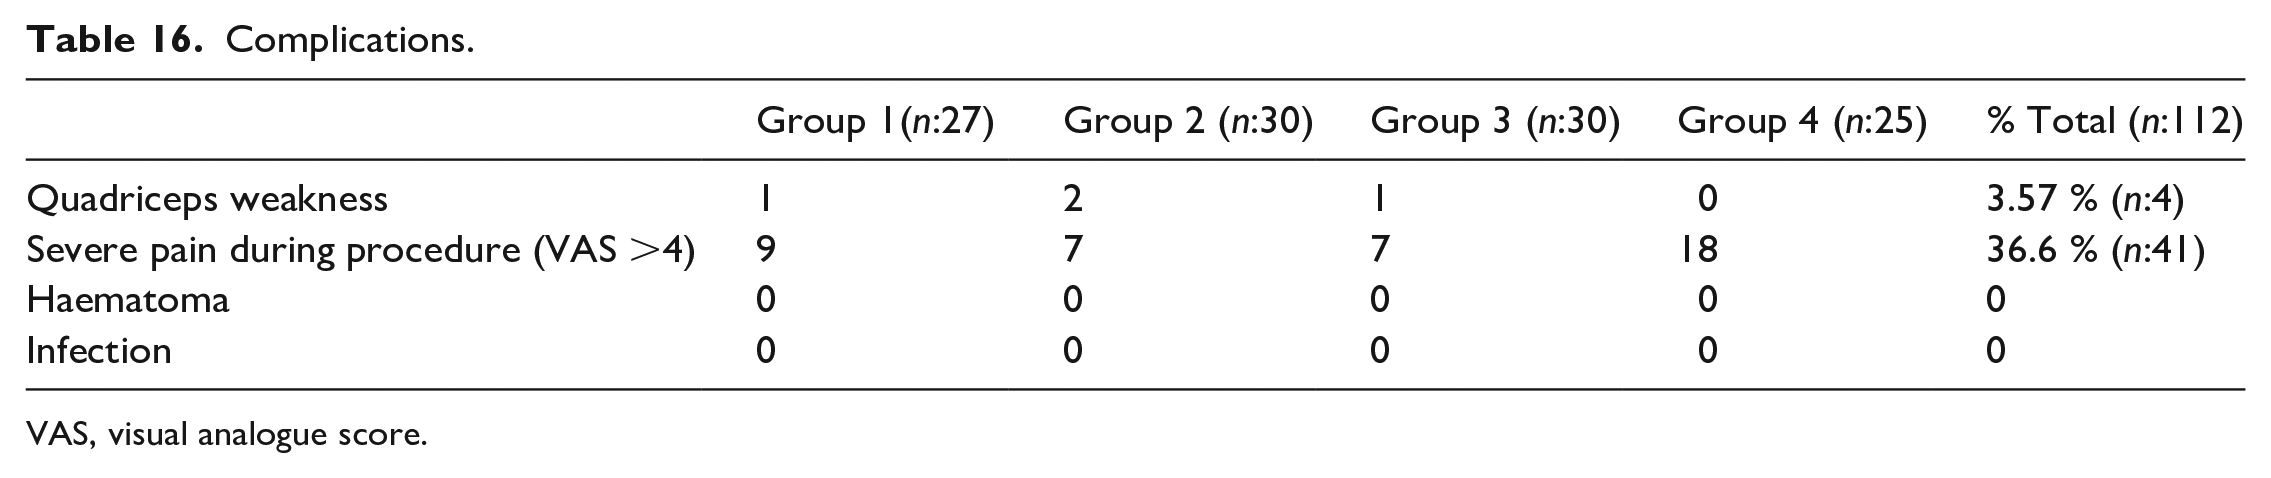
VAS, visual analogue score.
Discussion
In the current study, we investigated the effect of PENG block on pain, stiffness, and physical activity after the 1st week, 1st month and 3rd month of administration in aetiologies that may induce chronic hip pain. In the 112 patients in our study who were administered PENG block for hip discomfort beginning the 1st week, we reported a 62% pain alleviation, a 52% stiffness reduction, and a 53% increase in physical activity. Although these rates reduced slightly in the 1st and 3rd months, they remained >45%.
There is no viable treatment option for hip OA that can prevent the progression of the illness as of yet. Unfortunately, due to their adverse effects, existing oral analgesics are limited in use. The impacts of delivering adequate pain control using safe approaches on these patients’ quality of life were clear. 19 The hip joint’s anterior capsule was densely innervated. It was previously shown that this innervation is provided by the femoral nerve, obturator nerve, and supplementary obturator nerves. 20 The PENG block’s main purpose was to deliver appropriate analgesia by blocking this location. In our study, patients with Stage 2 and 3 hip OA experienced significant pain reduction, beginning in the 1st week.
Physical activity and stiffness were reduced and relieved effectively in the same patient group. At the end of the 3rd month, effective control of these data was still in place. In the 3rd group, patients with Stage 3 coxarthrosis aetiology, although the effects decreased partially when compared with Group 2 data, a reduction of >50% in pain and physical activity was observed from the 1st week. This decline persisted into the 3rd month, with a drop >50%. These findings suggested that a PENG block would be a better option than an intra-hip steroid injection, which is commonly used in the literature.
The sensory innervation of GTPS, which causes pain in the superolateral region of the hip, was most likely provided by a terminal branch of the femoral nerve. Although this issue has yet to be fully resolved, it seems to be the most correct information to explain pain control in GTPS caused by superolateral hip innervation following PENG block because the patients in our study were diagnosed with GTPS. 21 Even 3 months after the PENG block, there was 80% greater pain control in VAS and WOMAC pain scores, indicating analgesia, compared to baseline.
According to the current research, a substantial number of patients experience some degree of residual hip discomfort following THA. According to these studies, the prevalence of chronic pain (26–58%) varies significantly depending on the criterion used. Yet, only a small percentage of individuals experience recurrent moderate-to-severe hip discomfort. Chronic pain caused clinically significant functional impairment. 6 months following surgery, individuals with more severe persistent hip pain faced more restrictions in everyday activities and experienced more psychological anguish. 22 In the case of chronic discomfort following THA, treatment choices remained limited. In this study, patients with cTHA had severe pain and a considerably reduced quality of life. The outcomes of the PENG block in this patient group were highly varied. This group received less benefit from the treatment than the other groups. Although some pain relief was obtained, changes in the level of physical activity and stiffness were less significant. While pain relief began to appear quickly in this group, there was a reduction in its effectiveness after about a week. Although cTHA is common, the limited active therapy choices for this patient group paved the door for the use of PENG block for pain control.
Apart from the case series, we were aware of no previous data in the literature on the use of PENG block for chronic pain control. Nonetheless, it is frequently used in postoperative pain control, and numerous studies have mentioned it but provide poor-quality proof. 13 According to these investigations, pain control began 30 minutes after the block. 23 Except for a few patients in Group 4, pain management could not be obtained in the 1st 30 minutes of our research. After a PENG block, which is usually used to treat chronic hip pain, the first signs of pain alleviation (initial VAS/2) appeared after an average of 48 hours. These findings in our study did not appear to be consistent with other studies on the use of PENG block in postoperative pain control. This could be related to the pathophysiological variations in the mechanisms of postoperative pain and chronic pain generation. 24
After PENG block administration, no major side effects causing mortality or morbidity were observed in our trial. The most noticeable side effect was quadriceps weakness (QW), which appeared approximately 30 minutes after block administration and could linger for 48–72 hours. Regardless of origin, this side effect had an incidence rate of 3.57%. This adverse effect was temporary in all patients who had QW. Because this side effect has already been reported in the literature, 25 we informed the patients about it prior to the block, and the patient was thoroughly monitored for 60 minutes following the block.
When we reviewed the literature, we discovered that the majority of the studies on the PENG block were connected to postoperative pain control. There was no data on pain during the block in these investigations. During the trial, patients with a high VAS score before receiving the PENG block experienced considerable pain throughout the block administration, and this sensation was generally described during the injection. This sensation quickly stiffened up after the block and then vanished. PENG block application was performed on individuals who received acetylsalicylic acid at a dose of 100 mg or less. The block had no negative effects such as hematoma or bleeding in the 23 individuals who received this treatment.
Considering the study’s retrospective design, choice of a single centre, a small number of patients and limitations, the data reported regarding the efficacy and side-effects of PENG block for the treatment of chronic pain will be the first in the literature and would pave the way for many new studies. The study design can be used for a larger number of patients in a randomised controlled way and accompanied by a placebo, to make major contributions to the literature in the future.
In conclusion, this study showed that PENG block provides relief from chronic hip pain. Well-designed clinical trials to evaluate the efficacy of PENG block are still scarce, and the existing ones include a limited number of patients. Better-designed future studies inspired by this study can prove PENG block efficacy. In this sense, our study was a step forward in this investigation.
Footnotes
Declaration of conflicting interests
The author(s) declared no potential conflicts of interest with respect to the research, authorship, and/or publication of this article.
Funding
The author(s) received no financial support for the research, authorship and/or publication of this article.