






Abstract
Background:
Effective preoperative planning is essential for reducing pain, fatigue, and joint damage following total hip arthroplasty (THA). This study investigates the effects of key geometric parameters – neck-shaft angle (NSA), anteversion angle (AVA), and hip offset (HO) – on muscle mechanics and joint reaction forces during normal walking gait using musculoskeletal simulation.
Methods:
A MATLAB-based HO tool combined with a femoral torsion tool was used to generate 45 OpenSim models with systematic variations in NSA, AVA, and HO. All models were evaluated using identical gait kinematics and ground reaction forces to isolate the biomechanical influence of geometric changes.
Results:
Increases in femoral neck length and HO substantially affect muscle lever arms and joint reaction forces, with peak hip and knee joint loading and associated muscle mechanics increasing by up to approximately 2.5-fold compared to the reference model. Changes in NSA, AVA, and HO significantly altered muscle moment arms, muscle activations, and muscle forces, particularly in hip abductors and flexors. Simultaneous variation of all 3 parameters produced markedly larger effects than isolated changes.
Conclusions:
This study highlights the importance of considering prosthesis geometry and implantation parameters during THA planning and biomechanical modelling to optimise gait mechanics and reduce postoperative joint loading.
Introduction
Prediction of postoperative gait following total hip arthroplasty (THA) is a key challenge in orthopedic biomechanics. The selection of primary parameters of the prosthesis device, including femoral neck-shaft angle (NSA), anteversion angle (AVA), and hip offset (HO), can significantly impact pain, joint wear, abnormal gait, and instability. 1 NSA is the angle between the neck and the shaft of femur, AVA represents twist in the femur and measures as the angle between the neck axis and the line that goes through epicondyles in the transverse plane, and HO defines distance from the hip joint centre to the shaft line (Figure 1). These parameters are integral components of the preoperative planning process.
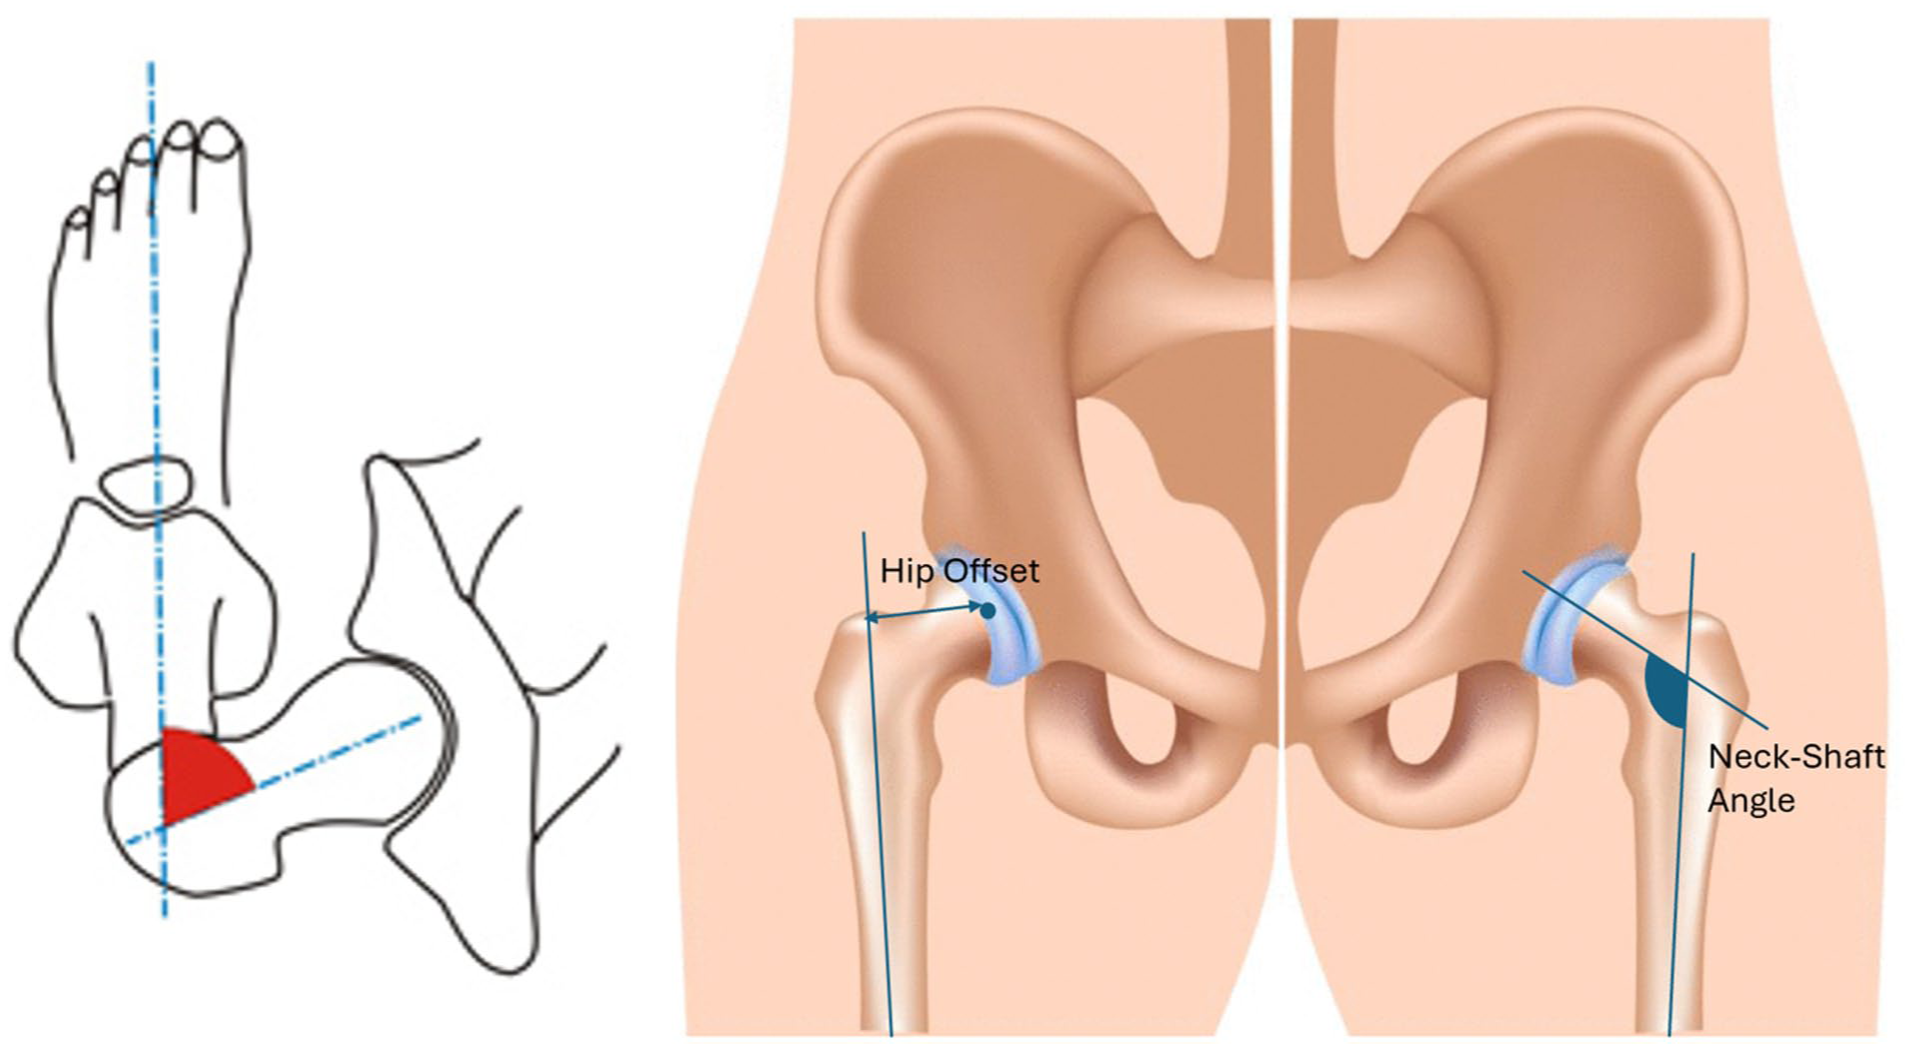
Hip geometrical features, anteversion (left), hip offset, and neck-shaft angle (right).
Despite in vivo measuring of joint loading and muscle force, personalised modelling is an invasive method to predict muscle forces and joint loads perfectly. 2 In some studies, researchers used a 3D personalised model based on their 3D CT-scan model,3 –5 while others used a generic 3D model and made a change to achieve a personalised model.2,6 –9 Using CT-scan is more precise in predicting muscle forces and joint reaction forces (JRFs), but it requires a time-consuming procedure. On the other hand, the latter group is more practical because it requires less time in the 3D procedure of personalising. Among available platforms, OpenSim enables dynamic gait simulation using scaled models combined with experimental kinematics and ground reaction forces, allowing estimation of muscle activations, muscle forces, and JRFs throughout the gait cycle. 10
Previous studies on personalising biomechanical models and gait analysis mainly focused on emulating modifications in AVA,6,11 HO,3,12 and knee varus separately, 7 while the influence of some parameters simultaneously received relatively less attention. In the hip area, only Kainz et al. 13 studied the impact of AVA and NSA at the same time, not considering HO. Given that femoral neck length and HO substantially influence muscle lever arms and joint loading, 2 an assessment of simultaneously variations in NSA, AVA, and HO is still lacking.
We hypothesise that variations in femoral NSA, AVA, and HO – both individually and in combination – significantly alter hip and knee JRFs, muscle moment arms, and muscle activations during normal gait. specifically, increases in HO, NSA and AVA will increase hip and knee JRFs. Therefore, the objective of this study is to systematically quantify the biomechanical effects of THA prosthesis geometry and implantation parameters on joint and muscle forces during gait using musculoskeletal simulation.
Materials and methods
Study design
This is an applied computational simulation study using musculoskeletal modelling and gait simulation. We generated 45 subject-specific OpenSim models by varying NSA, AVA, and HO to evaluate biomechanical outcomes during a standard gait trial. No new human experiments were conducted; the kinematic/GRF data used are publicity available by OpenSim.
Musculoskeletal model
The open-source OpenSim software was used exclusively for musculoskeletal modelling. 10 Our reference model for the simulation was the validated OpenSim model gait2392, specifically designed for gait studies. 14 The model’s degrees of freedom include 3 at the hip joint, 1 at the knee joint, 1 at the ankle joint in each leg and 3 at the torso segment.
To explore how THA implant variables affect muscle forces and joint loads, we generated 45 models based on the reference subject model. The 45 models differed in NSA (Ref, Ref±30°, and Ref±15°), AVA (Ref and Ref±30°), and HO (Ref, Ref+10 mm, and Ref+20 mm). We used the Torsion Tool to personalise NSA and AVA, 4 while we developed an HO personalisation tool to modify this parameter and personalise the OpenSim reference model, gait2392, with all geometric hip implant parameters.
Subject
In the study, gait analysis was employed to evaluate the walking pattern of a 17-year-old healthy male, who stood at a height of 171 cm and weighed 73.1 kg and walked at a speed of 1.41 m/second. Both marker trajectories and ground reaction forces were collected by Kainz et al. 13 The analysis of the data revealed that the subject did not exhibit any abnormal lower geometries that could have impacted his gait patterns.
NSA and AVA deformity simulation
To achieve personalisation of the NSA and AV, we utilised the Torsion Tool developed by Veerkamp, along with a MATLAB-based tool. 4 Using Veerkamp’s Torsion Tool and a custom MATLAB script, subject-specific NSA and AVA values were input (reference: NSA = 123°, AVA = 17°), and the bone geometry – along with muscle and tendon attachment points – was adjusted accordingly to reflect individual anatomy.
HO deformity tool
The HO Tool is a sophisticated MATLAB code (compatible with OpenSim 4.4) to generate a personalised model geometry based on a patient’s HO and NSA. It leverages the subject’s NSA to calculate the change in length of the hip neck as a function of HO change (eq. 1).

The HO Tool reads bone geometries from VTP files, virtually splits the femur at a user-defined separation plane (proximal/distal), and translates the distal femur and lower limb segments along the femoral neck direction to achieve the desired HO change. Concurrently, muscle and tendon attachment points located distal to the separation plane are repositioned accordingly. It is important to note that although we just enlarged the HO, the tool is not limited to increasing or decreasing the neck length. The HO tool will be made publicly available upon request.
Simulation and data analysis
A total of 45 personalised OpenSim models were generated by systematically varying femoral morphology:
NSA: normal (123°), ±30°
AVA: normal (17°), ±15°, ±30°
HO: normal, +10 mm, +20 mm (lower HO values were excluded due to uncertainty in muscle attachment repositioning at reduced offsets).
Model scaling and morphological personalisation (NSA, AVA, HO) were performed using the Torsion Tool and HO Tool, incorporating surface marker data and estimated joint centers. For each model, a standardised simulation pipeline was executed in OpenSim (Figure 2).
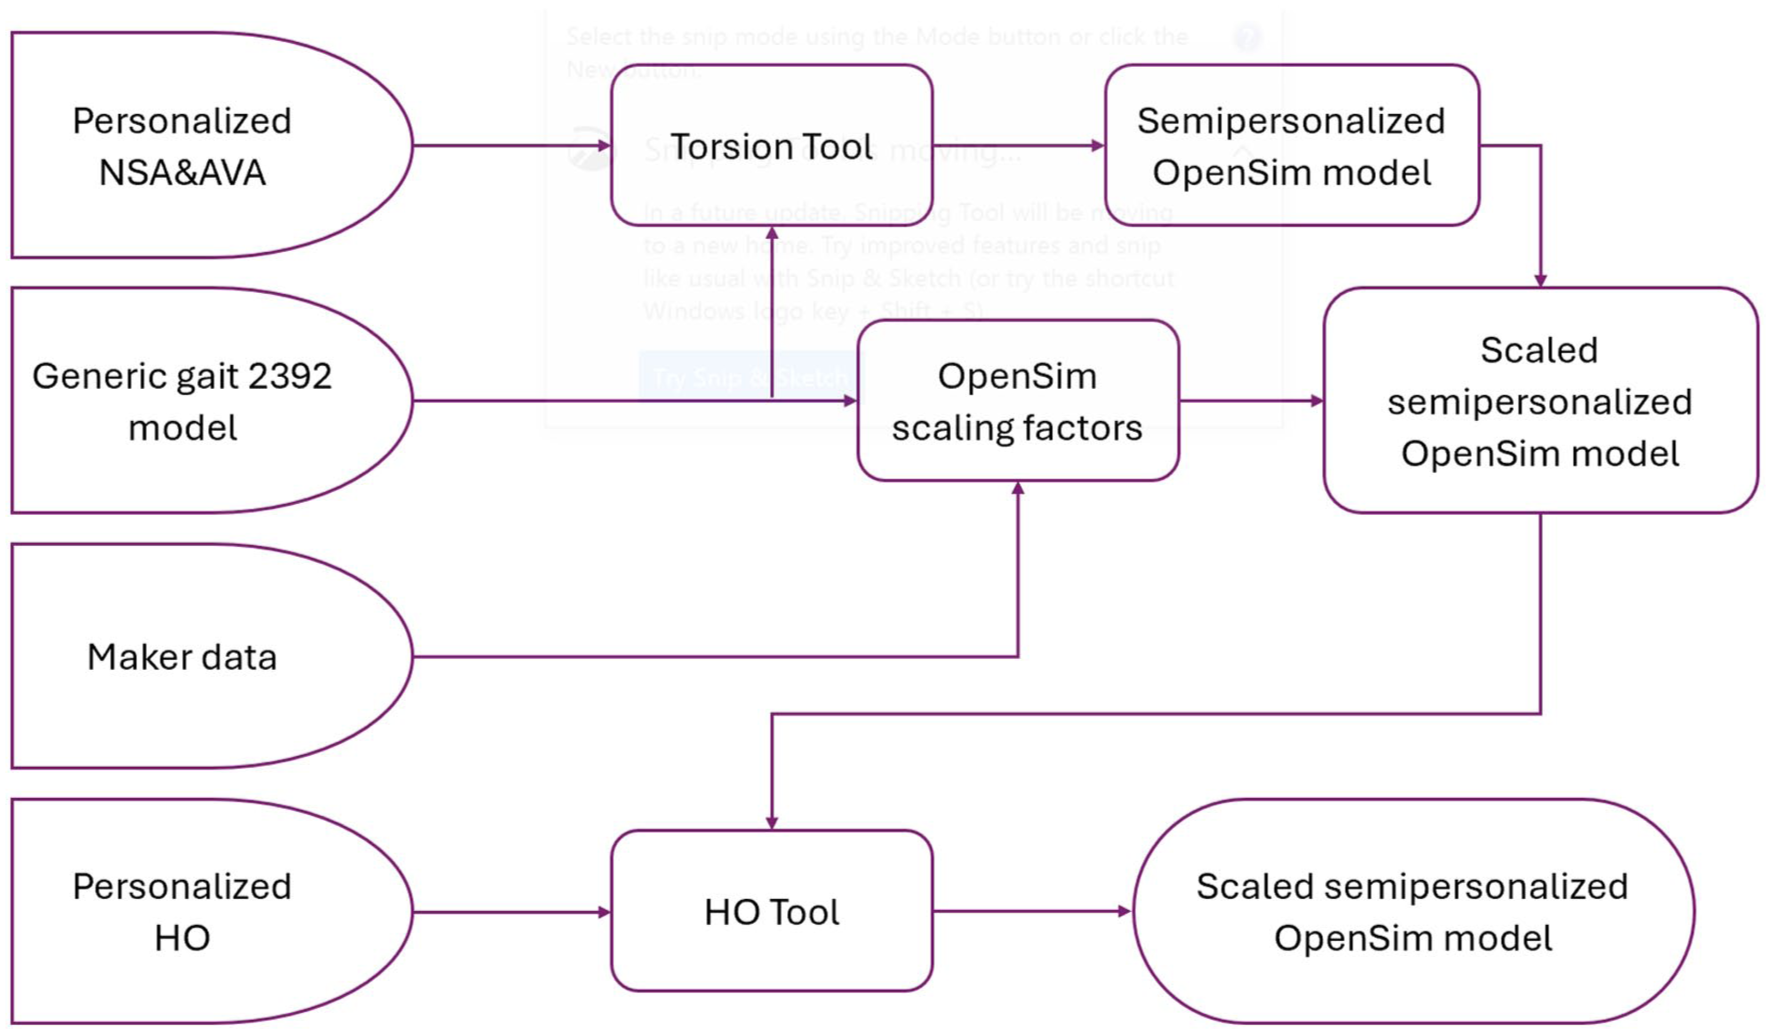
Flowchart of steps involved in creating a custom-scaled model for each individual, considering their personal NSA, AVA, and HO.
Simulations covered a full gait cycle (2.06–3.08 seconds). Joint loads were quantified as the Euclidean norm of forces in the 3 anatomical planes. Additionally, time-averaged agonist and antagonist muscle moments and moment arms were computed separately (based on sign of contribution) across the gait cycle, grouped by functional action: 6 for hip rotation (±internal/external, ±abduction/adduction) and 2 for knee flexion/extension.
Results
All models were compared to evaluate the effects of HO, NSA, and AVA on joint reaction forces, muscle moment arms, muscle activations, and muscle forces during gait.
Joint reaction forces
The research findings shown in Figure 3 suggest that during a complete gait cycle, an increase in HO leads to an increase in JRF in the hip and knee joints. Increasing HO increased hip and knee JRFs across all NSA levels, with the largest effects observed in high-NSA models and further amplified by increased AVA.
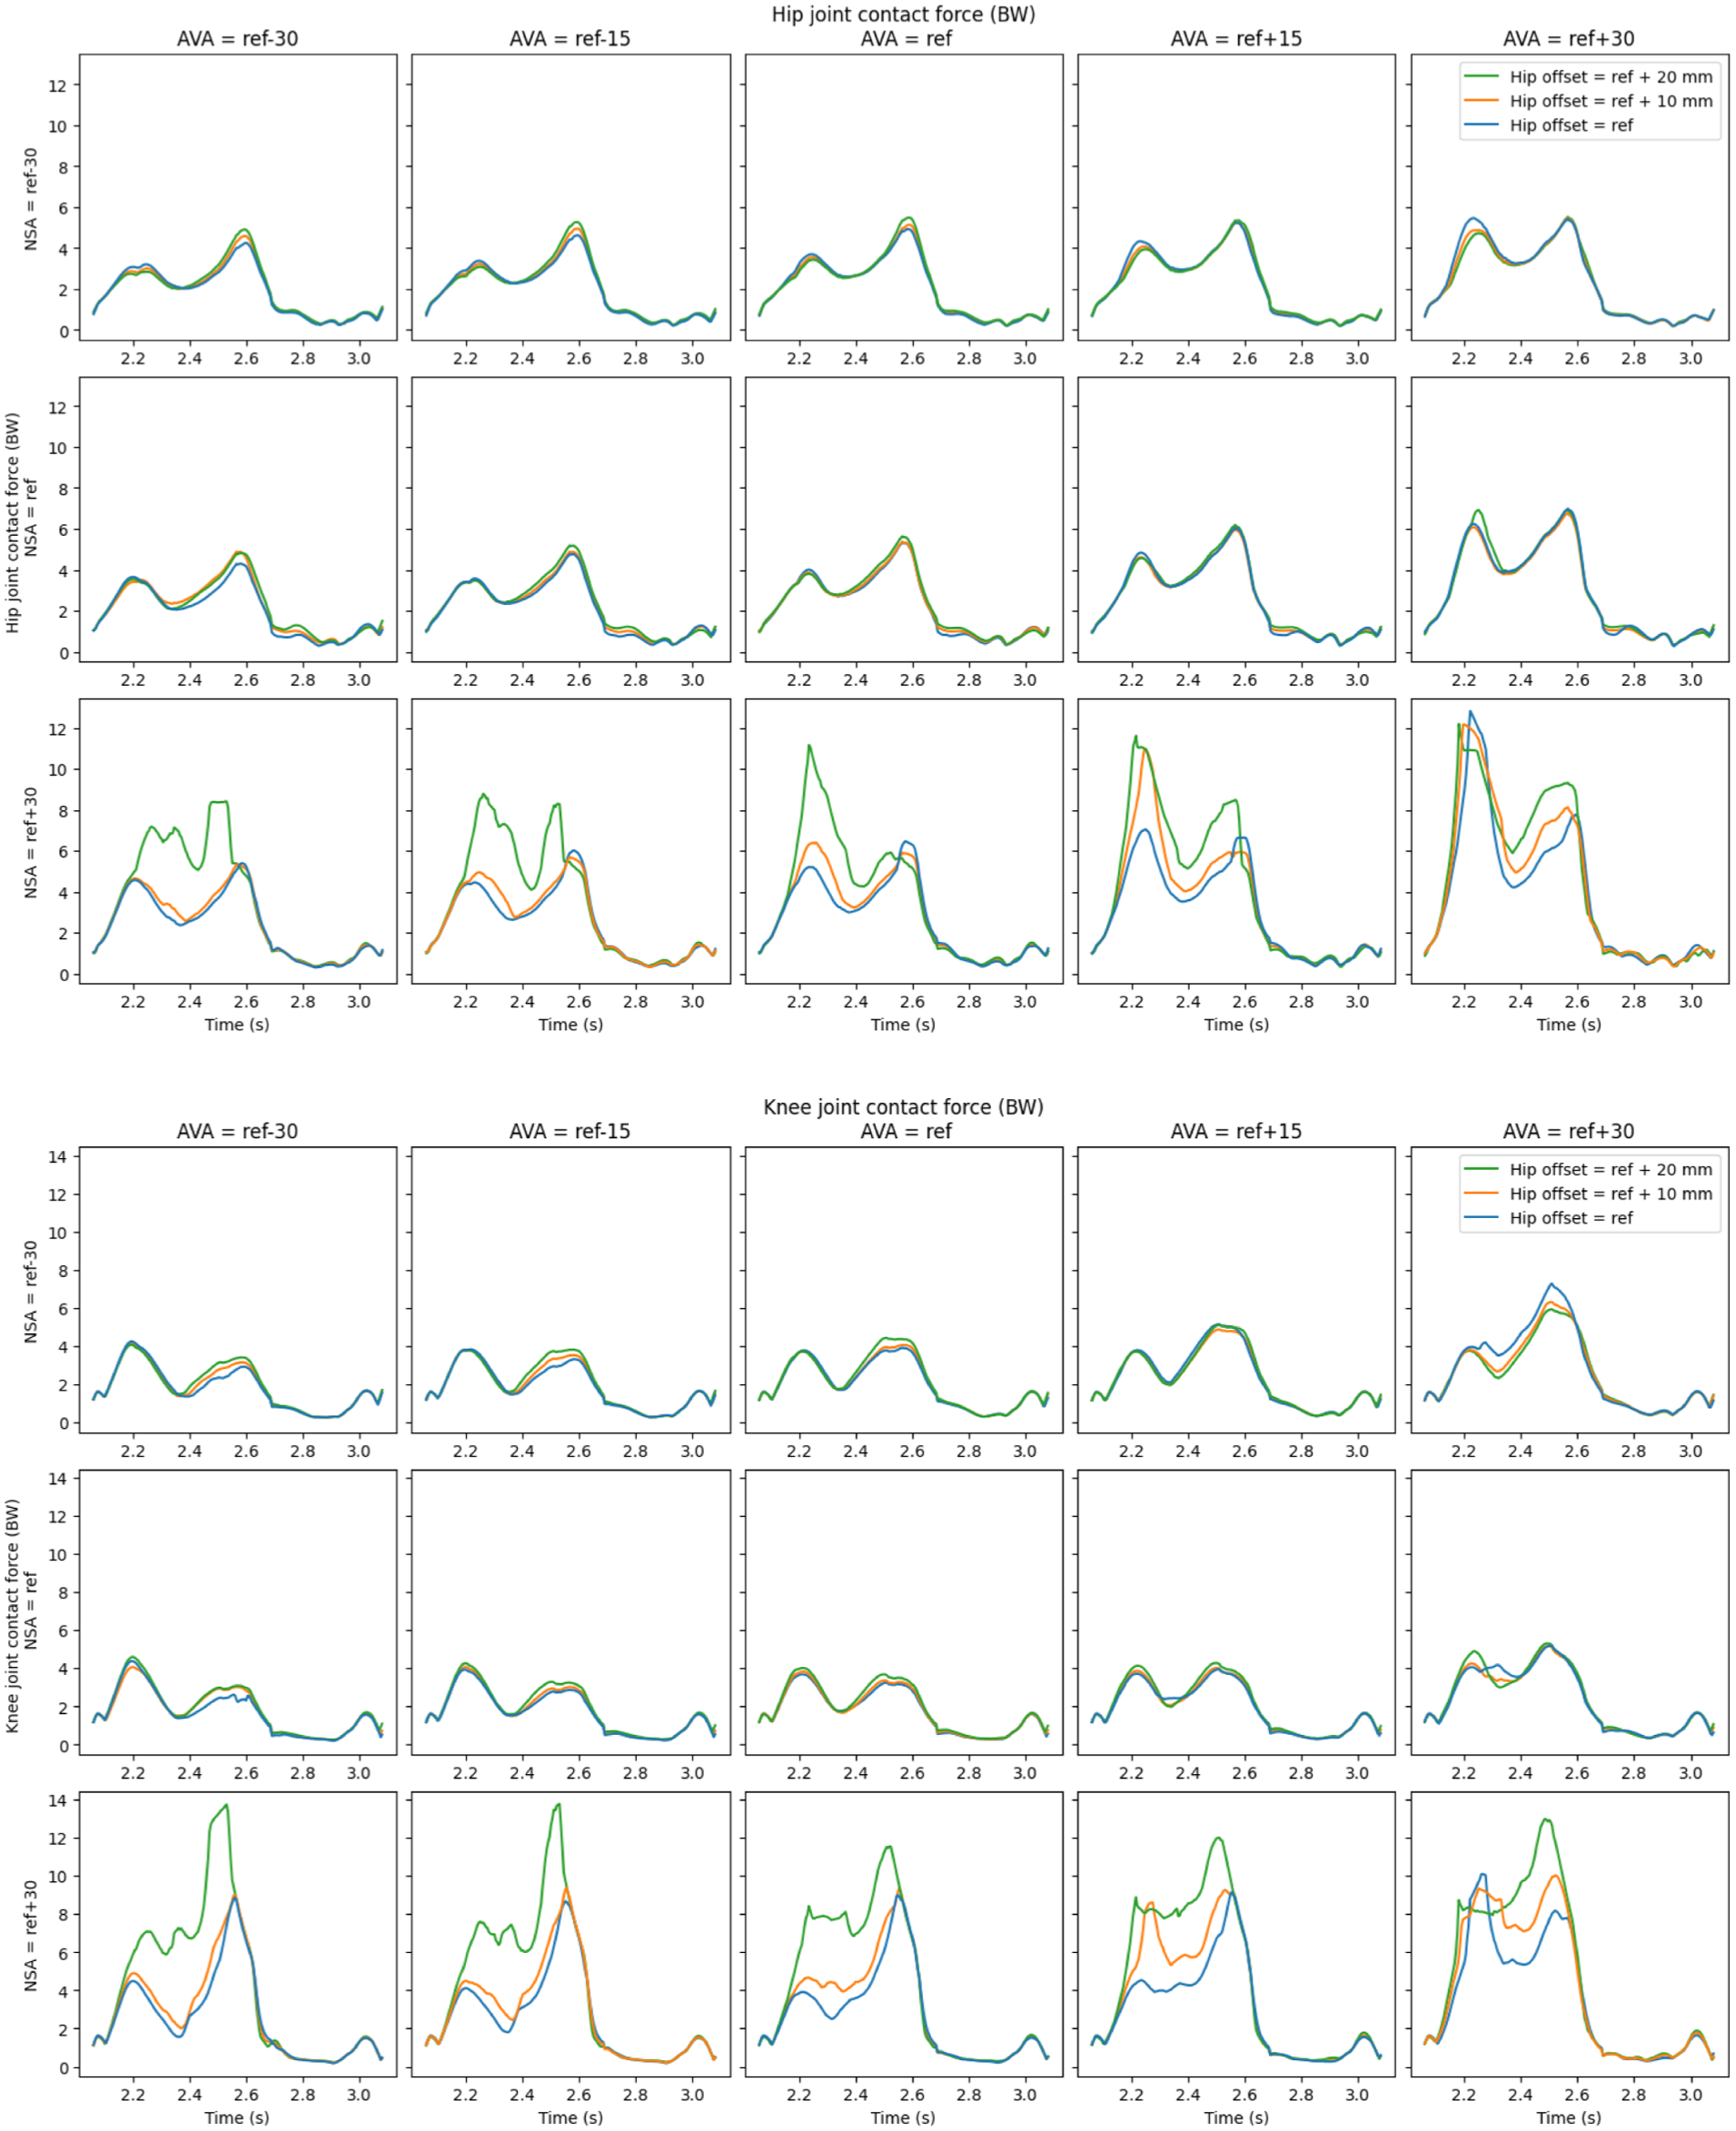
The resultant joint reaction forces (JRFs) in the hip and knee throughout a complete gait cycle, normalised by body weight (BW).
Average JRFs (Figure 4) showed that hip JRF was highly sensitive to combined variations in HO, NSA, and AVA. Increasing AVA from ref−30° to ref+30° increased hip JRF by ~20% in low-NSA models and up to ~65% in high-NSA models. Concurrent increases in all 3 parameters resulted in the highest hip and knee JRFs.
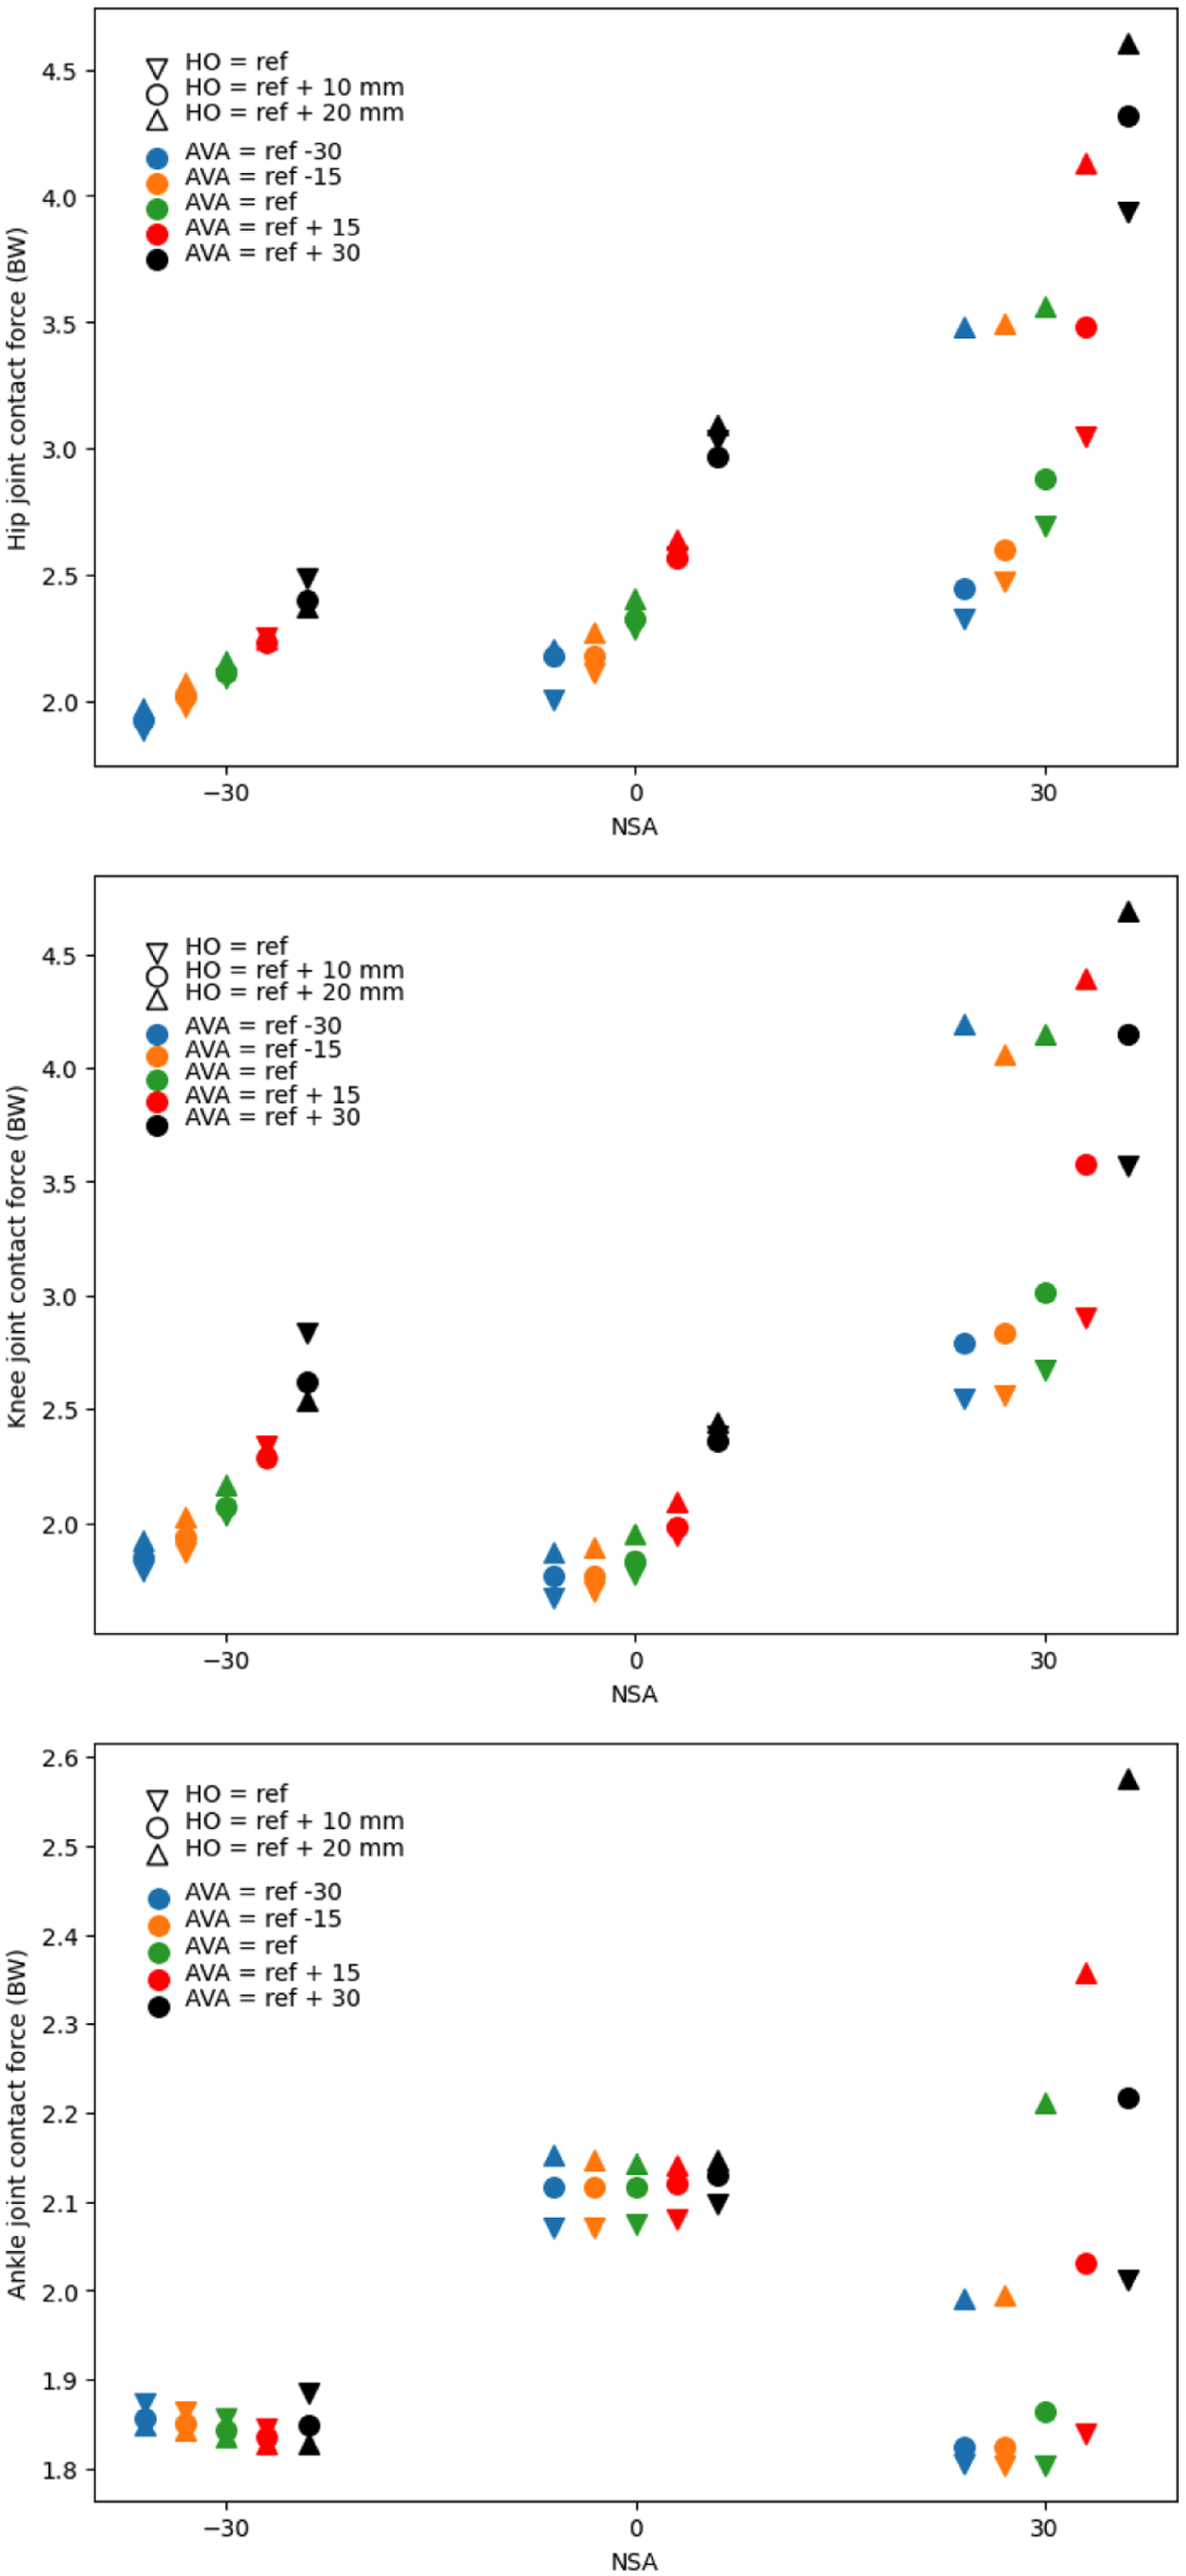
Average of JRFs in a whole gait cycle in the 45 simulated models normalised by body weight (BW).
The increase in AVA and HO has a direct influence on the JRF in the knee. Changes in NSA from normal in either direction (increase/decrease) increase the JRF in the knee, although this increase is much more pronounced in the condition where the NSA is above normal. Also, the increase in knee JRF is more evident in high AVAs in contrast to low AVAs. The effect of high HO is particularly pronounced in high NSA models.
Changes in HO, NSA, and AVA showed no consistent effect on ankle JRF, except in high-NSA models where increased HO and AVA led to higher ankle JRFs.
Muscle moment arms
We have calculated the average of muscle moment arms in the rotation of the hip (6 directions) and knee (2 directions) throughout a whole gait cycle (Figure 5). Knee flexion-extension moment arms were largely unaffected by changes in NSA, AVA, and HO. The hip adduction moment arm average is not affected by these parameters (increasing NSA have a slight effect). In contrast, hip flexion and extension moment arms increased with higher NSA and AVA, while HO showed opposite effects in low- and high-NSA models. Hip abduction moment arms increased with NSA and AVA but decreased with increasing HO. The overall pattern of hip internal and external rotator muscle arms indicates that an increase in HO, AVA, and NSA has positive, approximately zero, and negative effects on this parameter, respectively.
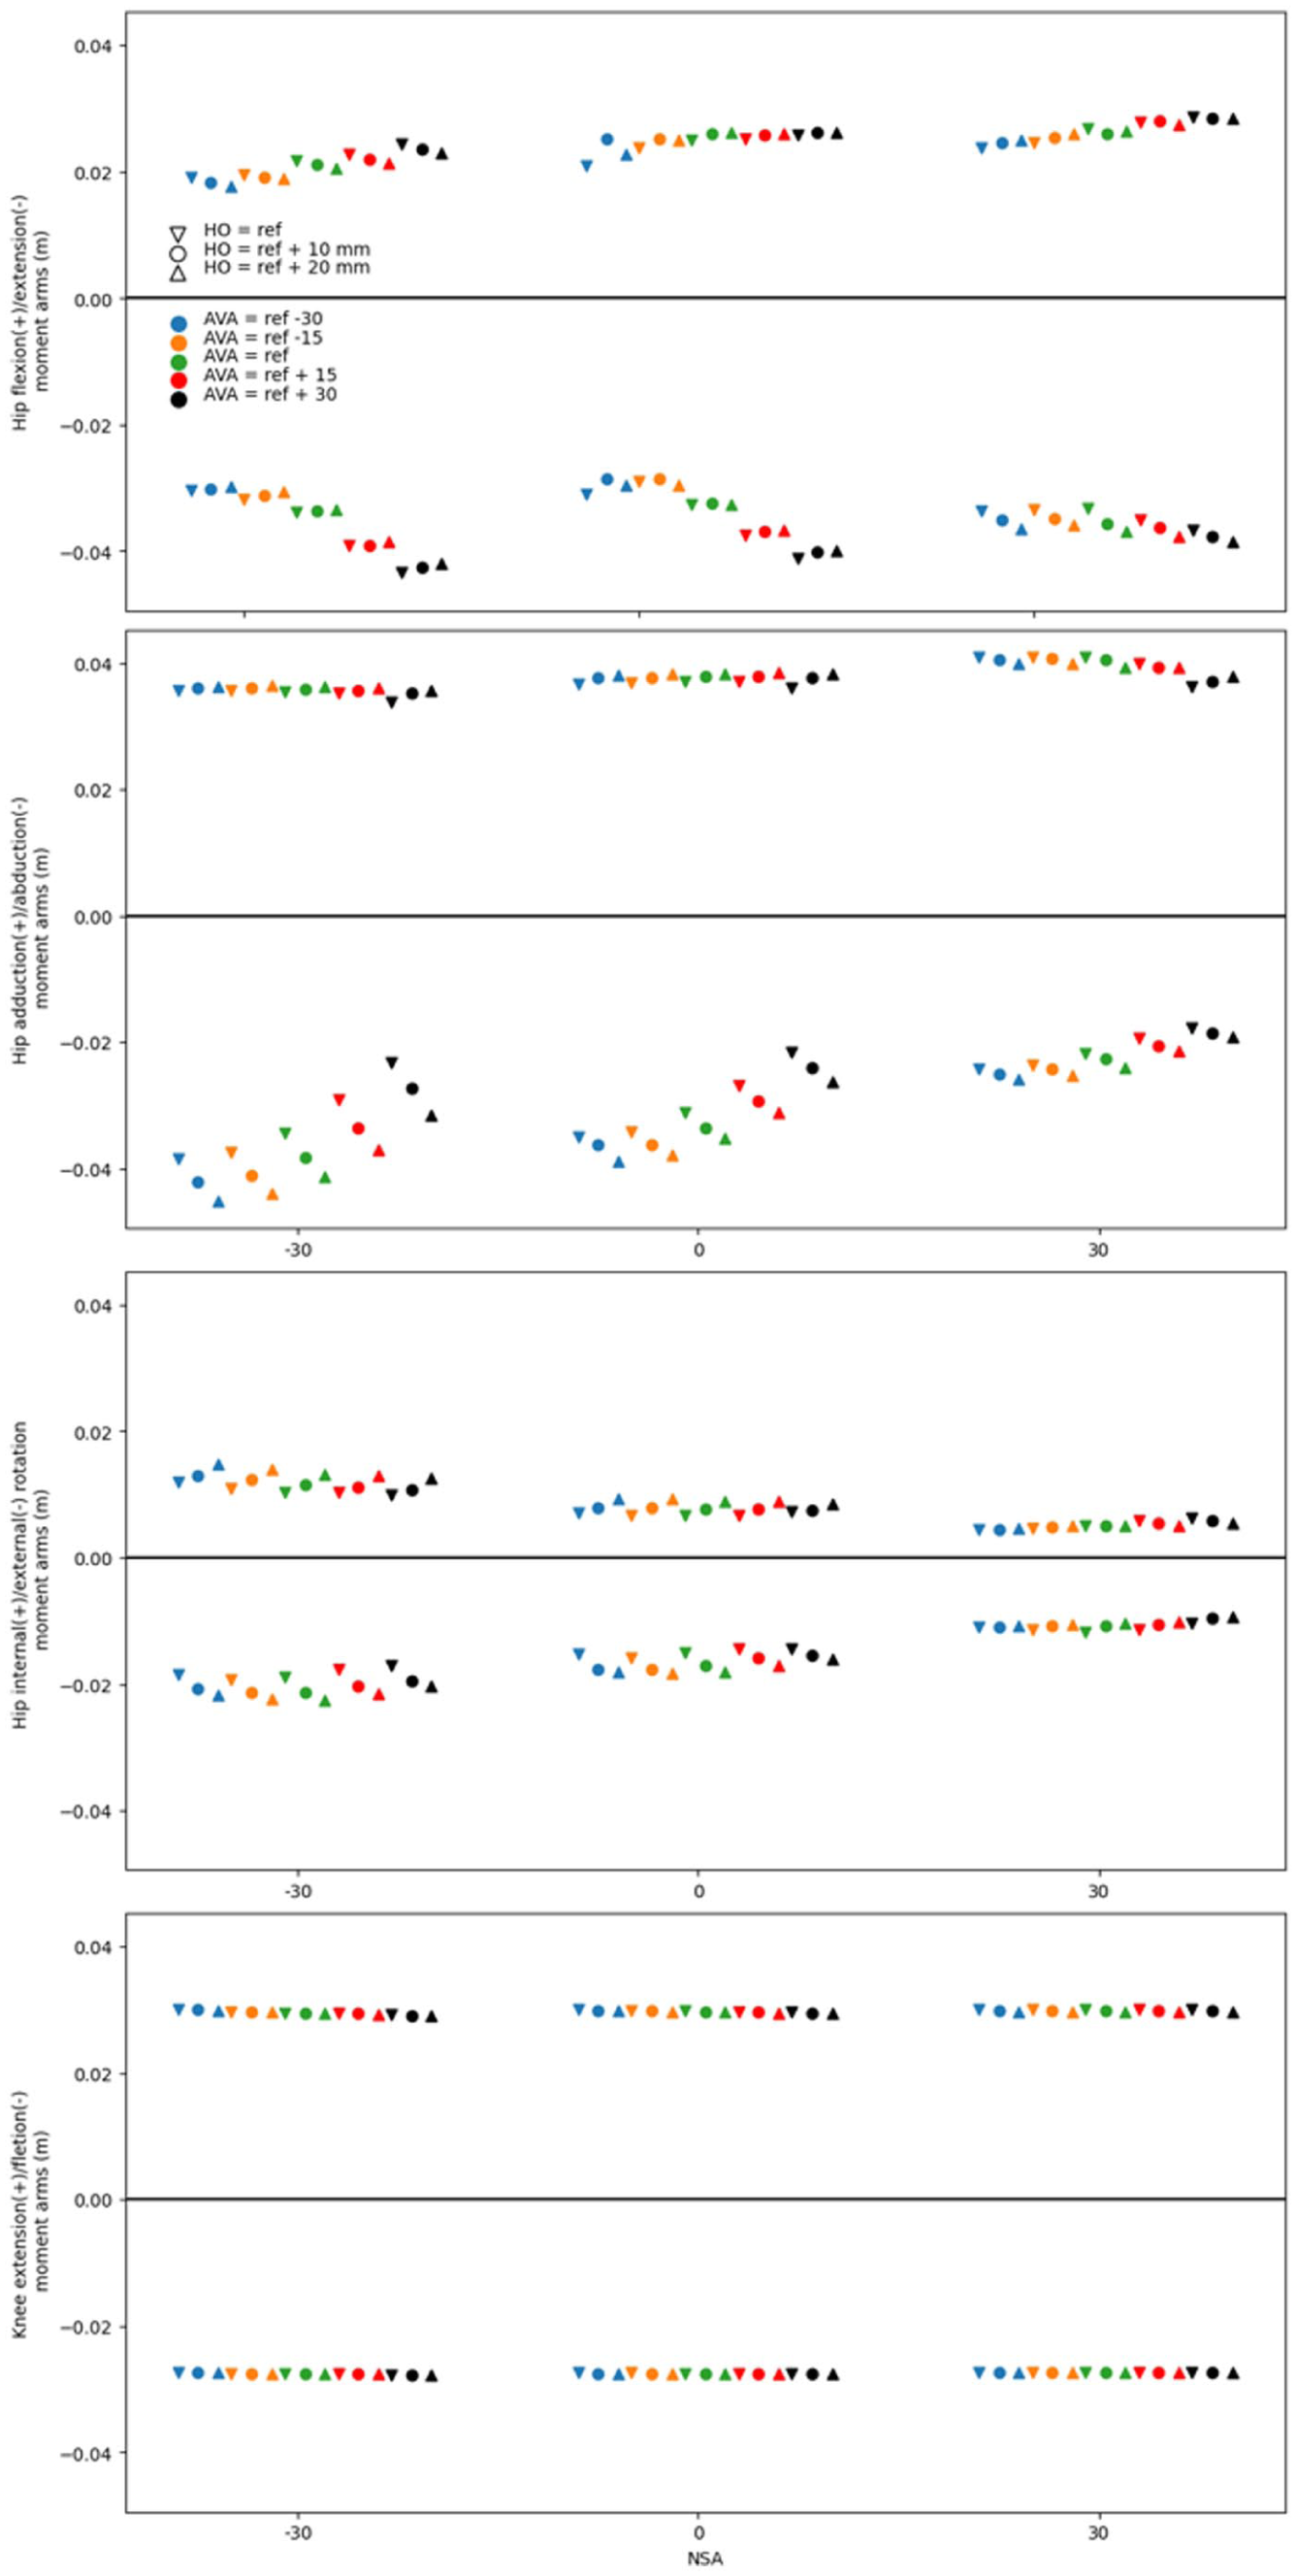
Average muscle moment arms of primary muscles in the hip and knee rotations in a whole gait cycle.
Muscle activations
The scatter plots in Figure 6 show that the HO, AVA, and NSA have a high correlation with each other in making muscle activations. In some muscle groups like knee flexors and extensors, and hip external rotators, high NSA lowers muscle activations that are influenced by AVA, and HO is trifling in high NSA. On the other side, hip internal rotators and hip abductor primary muscles are not sensitive to AVA and HO in low NSAs. In most of the muscle group activations, the effect trends of AVA, NSA, and HO are different. For example, hip adductor activation is higher in abnormal AVAs, but in high NSA and AVA, this is excluded, or more HOs result in more muscle activation in low NSAs but less in high NSAs.
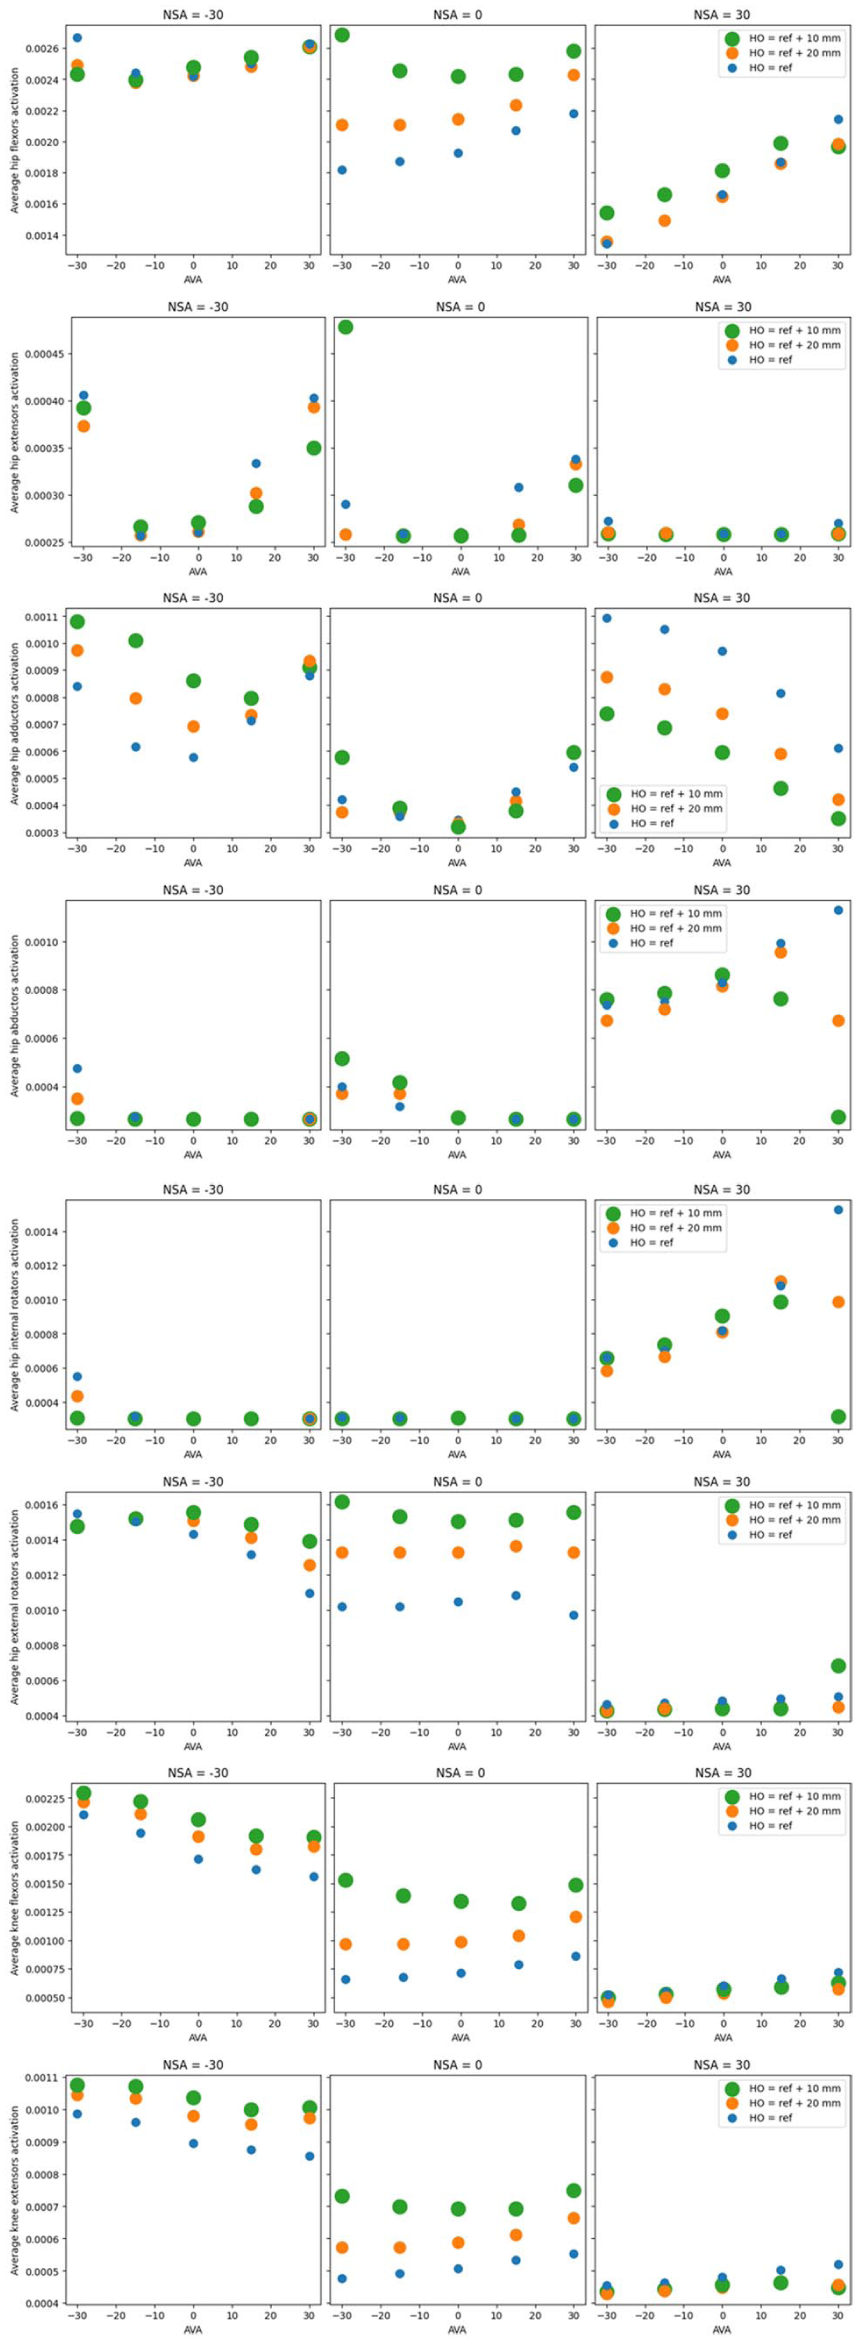
The scatter plots depict the average muscle activation throughout a complete gait cycle. The 3 consecutive scatter plots illustrate the muscle groups for every rotation of the hip and knee joints. Specifically, the scatter plots on the left, middle, and right correspond to NSA = ref – 30°, ref, and ref + degrees, respectively. The model’s AVA is indicated on the x-axis, while the HO value is denoted by the size and colour of the circles.
Muscle forces
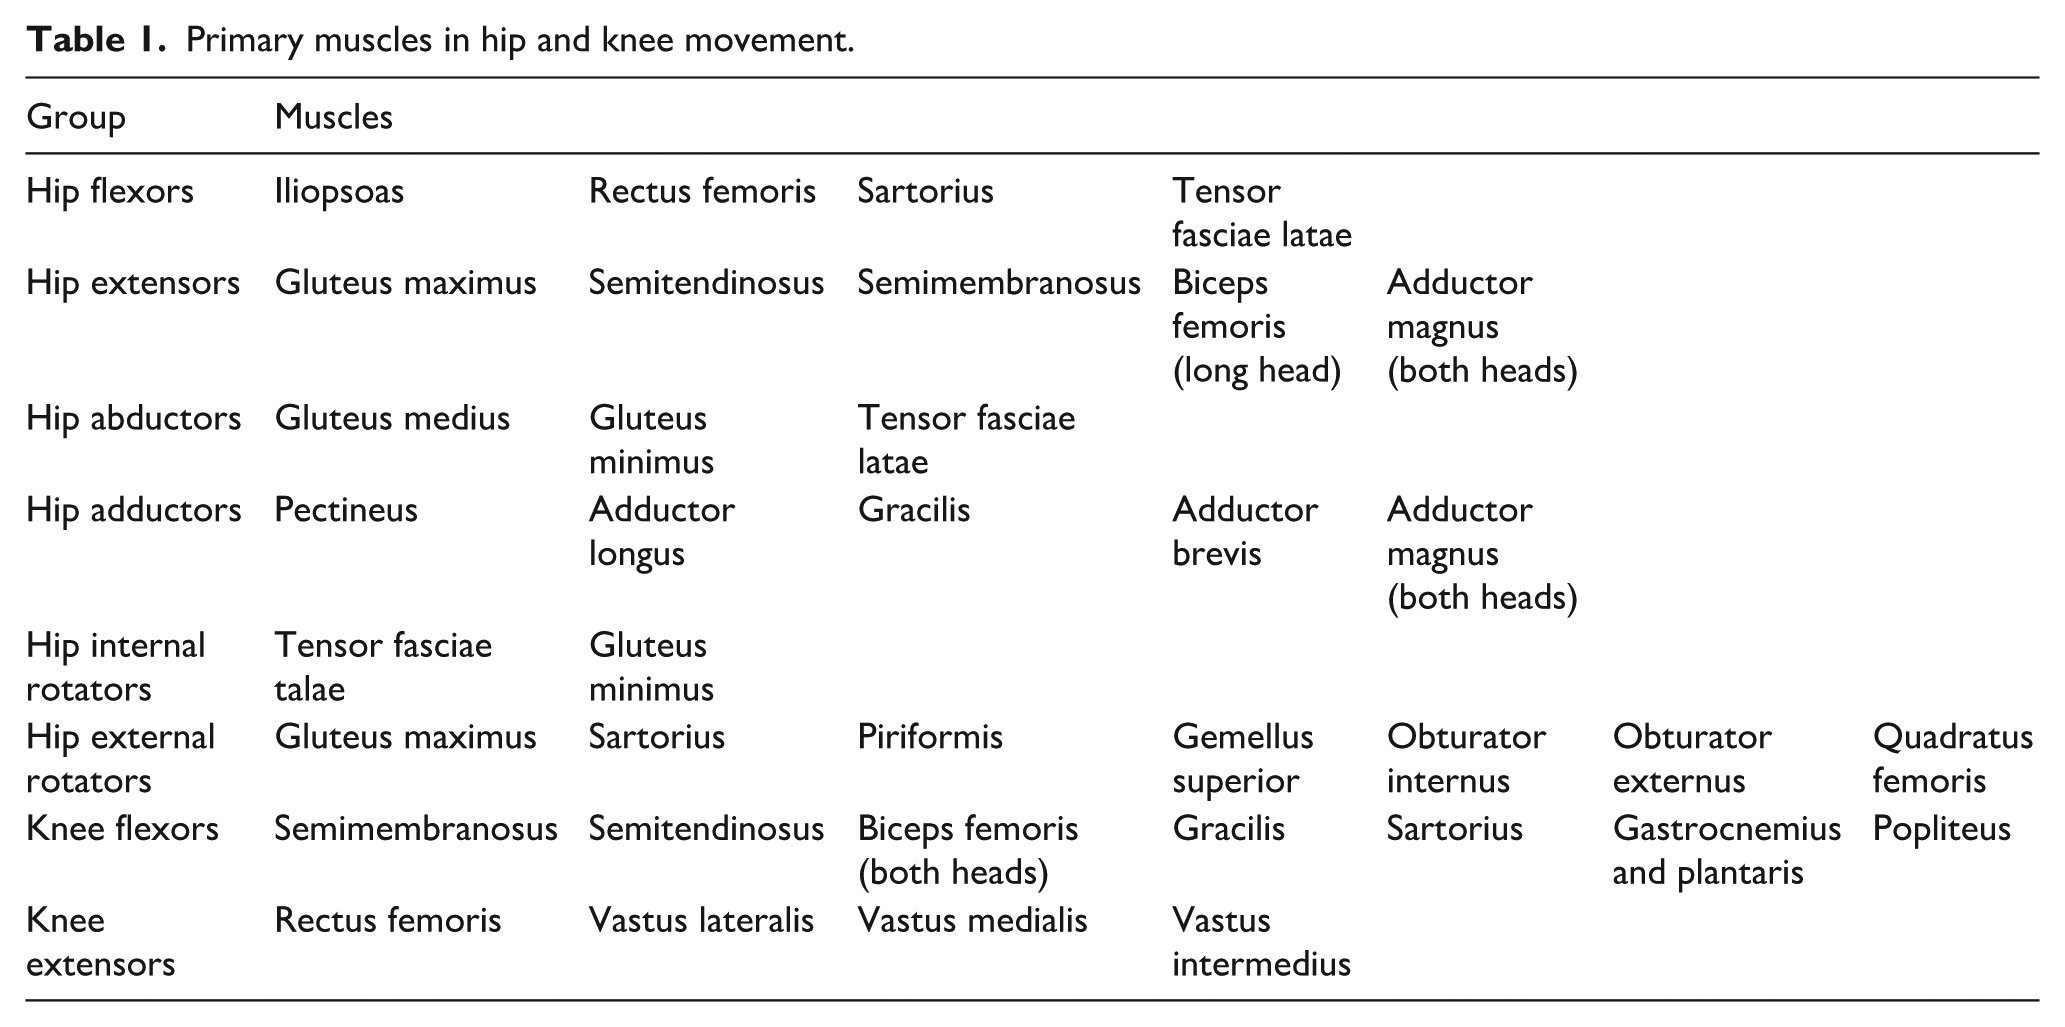
Figure 7 displays scatterplots of mean muscle group forces for all 8°of freedom in the hip and knee. The muscle groups described in Table 1 are the primary muscles and have the greatest influence on movement. Increasing NSA reduces muscle forces in knee flexion and extension, while the same parameter does not show a clear trend in other scatterplots. Enlarging the HO distance does not have an impact on muscle forces in some movements but can have a direct effect on others. For example, hip flexor muscles generate more force when HO is higher, especially in normal NSAs. In some muscles, such as hip adductors and abductors, having a larger HO increases muscle forces when NSA is 30°above normal. Most muscle group forces change as a result of AVA changes. Hip flexors are directly influenced by AVA, while hip adductors and abductors are influenced in the opposite direction.
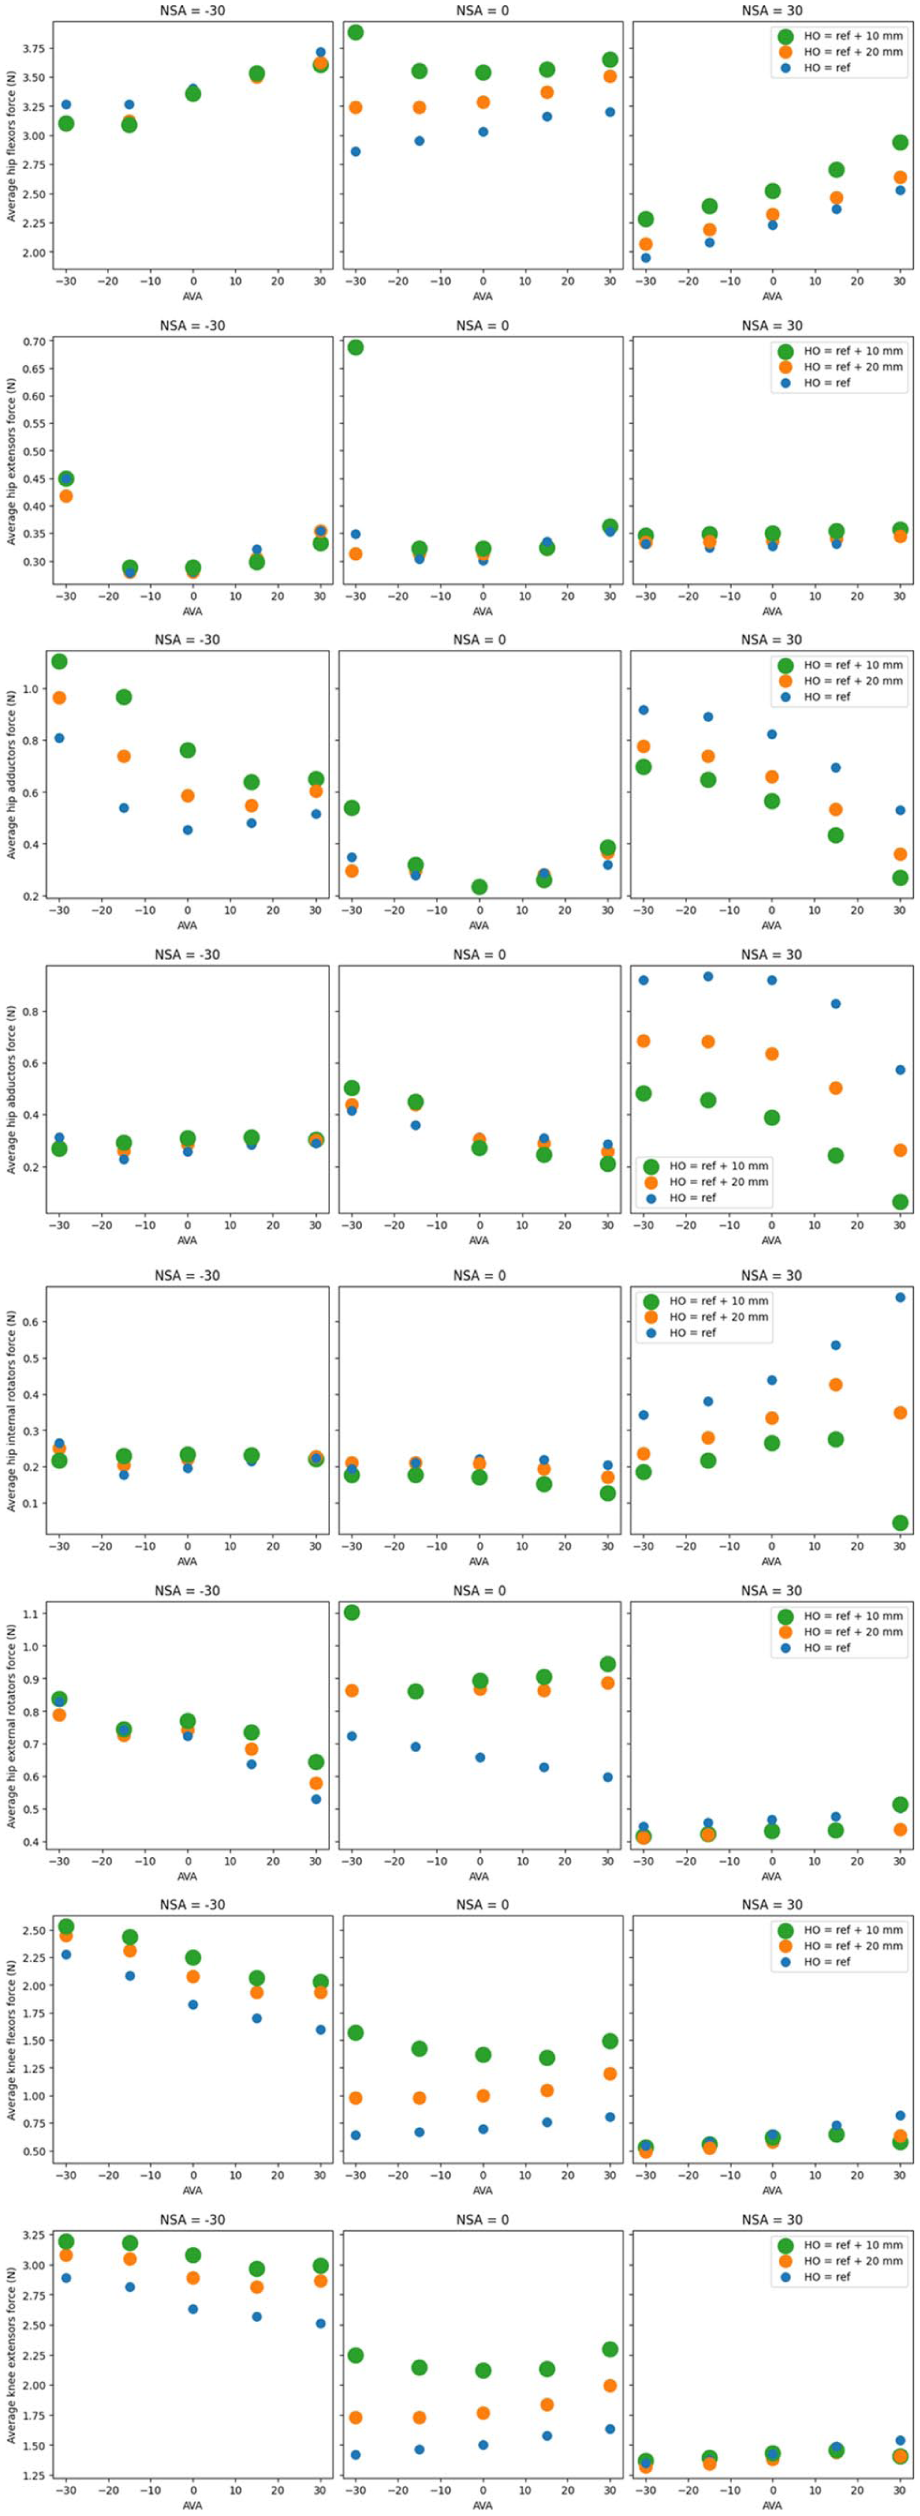
Scatterplots represent the average of muscle group forces. Each row represents a muscle group. In each row, the left, middle, and right plots show different NSAs. Various AVAs and HOs are separated on the x-axis and by colour.
Primary muscles in hip and knee movement.
Discussion
This study provides an in-depth analysis of the effects of femoral prosthesis geometry and surgical parameters – namely HO, AVA, and NSA – on JRFs, muscle moment arms, muscle activations, and muscle forces during normal walking gait. The results demonstrate that variations in these parameters substantially influence muscle mechanics and joint loading. In general, increasing HO, AVA, and NSA leads to higher hip and knee JRFs throughout the gait cycle. This behavior can be explained by the increase in femoral neck length, which introduces larger torques at the hip and knee joints and requires compensatory muscle forces to maintain joint stability. Similarly, increasing NSA enlarges the longitudinal distance between the hip and knee joints and increases the abductor moment arm, resulting in elevated JRFs. Increases in HO and AVA further amplify muscle tension and activation, contributing to higher joint loading.
When bone length increases, surrounding muscles are stretched, leading to increased muscle activation and force generation, as well as changes in muscle moment arms. To preserve a similar range of motion, the neuromuscular system adapts force production to maintain the required joint torques. In the hip joint, increased femoral neck length stretches both abductor and adductor muscles. Likewise, higher NSA strains the hip abductor muscles, while increased AVA strains hip external rotators and retroversion strains internal rotators. Consequently, variations in NSA, HO, and AVA alter muscle lengths and moment arms, requiring adaptations in muscle forces and JRFs to preserve a normal gait pattern.
An increase in AVA tends to shift the knee joints medially, bringing muscle insertions on the femoral shaft closer to the hip joint. As shown in Figure 5, higher AVAs are associated with reduced hip abduction as well as decreased internal and external rotation moment arms. These observations are consistent with previous reports by Kainz et al. 13 Prior studies have also shown that decreasing HO reduces abductor moment arms and increases muscle forces and hip JRFs.3,15 Our findings follow the same trend, particularly in the hip abductor muscle group and in models with lower NSA and AVA. In contrast, increasing NSA aligns the femoral shaft more closely with the body’s longitudinal axis, leading to reduced internal and external rotator moment arms in high-NSA models.
Muscle force generation is directly influenced by activation level; however, this relationship is nonlinear. The effect of activation on muscle force is lower at very low and very high activation levels and more pronounced at moderate activation levels. This behavior is evident from the comparison of Figures 6 and 7. While overall trends in activation and force are consistent, deviations appear at moderate activation levels. For example, when NSA and AVA are 30° above normal and activation is low (1 × 10−³), hip abductor activation and force exhibit similar activation-to-force ratios. In contrast, when AVA is 30° below normal and activation is moderate, this ratio increases (1.23 × 10−³). When NSA and AVA are 30° below normal and activation is high, the ratio decreases again (0.9 × 10−³), indicating nonlinear activation–force coupling across different geometrical conditions.
Figure 7 shows that average hip flexor force increases in models with higher AVA and NSA values, whereas both increasing and decreasing NSA away from the reference condition reduce force generation. When moment arms increase due to changes in AVA or NSA, lower muscle forces may be sufficient to generate the required joint torque for normal gait. Despite notable changes in moment arms, hip extensor forces exhibit relatively small variations across models, suggesting that hip flexors must compensate to overcome extensor resistance and preserve normal hip motion.
As explained by Kainz et al., 13 the influence of HO on muscle forces depends strongly on NSA. In low-NSA configurations, where the femoral neck is nearly perpendicular to the shaft, increasing HO requires greater muscle force for hip adduction. Conversely, in high-NSA configurations, where the neck is more aligned with the shaft, increased moment arms reduce the force required for the same movement. These competing effects explain why changes in HO under normal NSA conditions do not produce a consistent trend in average hip adduction force.
Muscle forces directly affect joint loading, resulting in variations in average JRFs across models with different geometric configurations. As shown in Figure 4, the highest JRFs occur in models combining high NSA, HO, and AVA at the hip, knee, and ankle joints. Importantly, HO and NSA are geometrically coupled, as described in Eq. 1. A 1 cm increase in HO at an NSA of 90° increases neck length by 1 cm, whereas the same HO change at an NSA of 150° increases neck length by approximately 2 cm. These results suggest that femoral neck length has a stronger influence on JRFs than HO alone. In general, reducing HO, NSA, and AVA leads to lower JRFs, indicating that careful selection of prosthesis geometry and implantation angles may reduce joint loading and postoperative wear.
Phase-specific effects were also observed across the gait cycle. As illustrated in Figure 3, AVA primarily influences the first JRF peak during heel strike, whereas HO has a stronger effect during the second peak at heel-off. During heel strike, rapid hip flexion combined with increased AVA leads to higher muscle forces, explaining the observed increase in JRF. During heel-off, knee extension becomes dominant, and knee extensor forces – affected by HO – contribute more strongly to joint loading. High NSA models exhibit greater tolerance to elevated forces, particularly in combination with high HO; however, excessive neck length changes in these configurations result in abnormal joint loading at both the hip and knee.
Overall, the interaction between HO, NSA, and AVA significantly affects muscle activation patterns, muscle tension, moment arms, and joint reaction forces. Elongated bone geometries stretch surrounding muscles, increasing activation and force requirements, while changes in HO and NSA modify muscle length–torque relationships and energy expenditure during gait. A key contribution of this study is the quantification of how femoral neck length and geometric variations influence JRFs across distinct gait phases, with AVA dominating heel-strike loading and HO primarily affecting heel-off mechanics. Although high NSA configurations can tolerate higher forces, this advantage diminishes when combined with excessive HO or AVA due to substantial changes in neck length.
This study is limited by its focus on 3 geometric parameters using generalised musculoskeletal models, which may not capture the full extent of patient-specific anatomical variability. Future work should incorporate additional factors such as pelvic alignment, muscle pathology, and bone density, as well as validation using patient-specific data.
Conclusion
In conclusion, geometrical variations in THA prostheses substantially influence muscle forces, joint reaction forces, and gait biomechanics. By accounting for the combined effects of NSA, HO, and AVA, surgeons may optimise prosthesis selection and implantation to reduce joint loading, minimise wear, and improve postoperative gait outcomes. These findings support the integration of biomechanical modeling into preoperative planning to enable more personalised and effective total hip arthroplasty.
The energy used in gait is the sum of energy consumed by every muscle. The more muscles are activated every moment, the more energy they use. On the other hand, there are 6 degrees of freedom in the hip and 2 in the knee. There are primary muscles that play a significant role in moving the hip and knee in every movement. 16 Table 1 shows the primary muscles for movements. We calculate the mean activation of primary muscles in every movement for all 45 models in Figure 6. For example, scatters in average hip flexor activation are the average activation of the iliopsoas, rectus femoris, sartorius, and tensor fasciae latae in a whole gait cycle.
Footnotes
Declaration of conflicting interests
The authors declared no potential conflicts of interest with respect to the research, authorship, and/or publication of this article.
Funding
The authors received no financial support for the research, authorship, and/or publication of this article.
