






Abstract
Background:
Frailty assessment has become increasingly important in predicting surgical outcomes, particularly in complex revision procedures. Among patients undergoing revision total hip arthroplasty (rTHA) for mechanical prosthetic complications, optimal frailty stratification remains poorly defined. This study compared the Risk Analysis Index (RAI) and the modified 5-item frailty index (mFI-5) in predicting postoperative outcomes within this high-risk population.
Methods:
We conducted a retrospective cohort study of 5631 adult patients undergoing rTHA for mechanical prosthetic complications using data from the 2015–2021 American College of Surgeons National Surgical Quality Improvement Program (ACS-NSQIP). Frailty was assessed using RAI and mFI-5, calculated via published algorithms. Primary outcomes were 30-day all-cause mortality and non-home discharge. Secondary outcomes included major complications, minor complications, unplanned readmission, reoperation, and extended length of stay (LOS >4 days). Discriminative performance was evaluated using receiver operating characteristic curves and area under the curve (AUC) analysis, with bootstrap resampling (100 iterations) for internal validation.
Results:
Mean patient age was 66.80 ± 11.57 years with 57.61% female. Overall, 30-day mortality was 0.4% with major complications occurring in 2.4%. RAI demonstrated superior discrimination for mortality (AUC 0.822) compared to mFI-5 (0.688, p < 0.001). For non-home discharge, RAI achieved AUC 0.735 versus mFI-5 0.607 (p < 0.001). RAI showed strong performance for extended length of stay (AUC 0.624) and minor complications (AUC 0.652), significantly outperforming mFI-5 across multiple outcome measures.
Conclusion:
The Risk Analysis Index significantly outperforms the mFI-5 across key outcomes following revision total hip arthroplasty for mechanical prosthetic complications. Its multidomain structure, which captures age, functional dependence, comorbidities, and acute physiological stress, makes it a superior tool for surgical risk stratification, discharge planning, and identifying high-risk patients who may benefit from targeted perioperative optimisation.
Keywords
Introduction
Revision total hip arthroplasty (rTHA) represents a technically demanding procedure with substantially higher complication rates than primary arthroplasty, performed over 50,000 times annually in the United States. 1 The complexity of revision surgery is compounded when addressing mechanical prosthetic failures, including aseptic loosening, periprosthetic fracture, prosthetic dislocation, implant malalignment, and polyethylene wear. 2 These mechanical complications necessitate extensive surgical dissection, prolonged operative times, and increased physiologic stress compared to routine revisions. Consequently, accurate preoperative risk assessment becomes paramount for surgical planning, patient counseling, and resource allocation, particularly among frail elderly patients who comprise an increasing proportion of revision candidates.3,4
Frailty, defined as a state of decreased physiologic reserve and increased vulnerability to stressors, has emerged as a powerful predictor of adverse surgical outcomes. 5 Multiple instruments have been developed to quantify frailty in surgical populations, each capturing different domains of patient vulnerability. The modified 5-item frailty index (mFI-5) provides a simplified assessment based on comorbidities and functional status. 6 The Risk Analysis Index (RAI), originally validated in spinal surgery populations, offers a more comprehensive evaluation incorporating demographics, functional status, comorbidities, and markers of acute illness. 7
Despite widespread adoption of these frailty measures, their comparative performance in revision arthroplasty remains poorly characterised. Prior studies have typically evaluated single indices in isolation, limiting direct comparison of discriminative ability across different assessment tools.3,8 Furthermore, existing literature has predominantly focused on primary arthroplasty or mixed cohorts, with limited data specific to revision procedures where baseline risk profiles differ substantially. The absence of head-to-head comparisons prevents evidence-based selection of optimal risk stratification tools for this vulnerable population.
This study directly compared the performance of RAI against the traditional mFI-5 for predicting postoperative outcomes following rTHA. Using a large national surgical database, we evaluated the discriminative ability of each index across multiple outcome domains including mortality, complications, functional recovery, and healthcare utilisation. We hypothesised that the comprehensive nature of RAI would provide superior risk stratification compared to the more focused traditional measure.
Methods
Data source and study population
This retrospective cohort study utilised the American College of Surgeons National Surgical Quality Improvement Program (ACS-NSQIP) database from 2015 to 2021. NSQIP represents a validated, risk-adjusted, outcomes-based programme collecting standardised data from over 700 participating hospitals nationwide. Trained surgical clinical reviewers prospectively collect preoperative risk factors, intraoperative variables, and 30-day postoperative outcomes using strict definitions and regular inter-rater reliability auditing.
Adult patients (⩾18 years) undergoing rTHA were identified using Current Procedural Terminology codes 27134 (revision of total hip arthroplasty; both components), 27137 (revision of total hip arthroplasty; acetabular component only), and 27138 (revision of total hip arthroplasty; femoral component only). We specifically included patients with International Classification of Diseases, Tenth Revision codes indicating mechanical prosthetic complications (T84.0-T84.051). Exclusion criteria comprised: missing data for key variables required for index calculation (functional status, body mass index [BMI]), age ⩾90 years due to database top-coding, ASA class V or VI representing moribund patients, and concurrent procedures that might independently affect outcomes.
Frailty index calculations
Risk Analysis Index (RAI): calculated according to published methodology incorporating 11 weighted variables: age (0–30 points based on decade), male sex (+3 points), congestive heart failure within 30 days (+5 points), dyspnea at rest or moderate exertion (+3 points), renal insufficiency defined as creatinine >3mg/dL (+8 points), partially dependent functional status (+7 points), totally dependent functional status (+14 points), residence in facility preoperatively (+1 point), unintentional weight loss >10% in 6 months (+4 points), and disseminated cancer (+9 points). Patients were stratified into established categories: Not Frail (RAI ⩽20), Prefrail (RAI 21–30), Frail (RAI 31–40), and Severely Frail (RAI ⩾41).
Modified 5-item frailty index (mFI-5): Calculated as the sum of 5 equally weighted binary variables: diabetes mellitus (insulin-dependent or non-insulin dependent), hypertension requiring medication, chronic obstructive pulmonary disease, congestive heart failure within 30 days, and dependent functional status (partial or total). Scores ranged from 0–5 with established cutoffs: Not Frail (0), Prefrail (1), Frail (2), and Severely Frail (⩾3).
Outcome measures
Primary outcomes (defined by RAI AUC >0.7) included 30-day all-cause mortality and non-home discharge. Non-home discharge encompassed discharge to skilled nursing facility, rehabilitation facility, separate acute care, hospice, or unskilled facility.
Secondary outcomes comprised: major complications (composite of myocardial infarction, pulmonary embolism, venous thrombosis requiring therapy, sepsis, septic shock, deep incisional surgical site infection, ventilator dependence >48 hours, unplanned intubation, stroke/cerebrovascular accident, or acute renal failure requiring dialysis), minor complications (urinary tract infection, superficial surgical site infection, or transfusion requirement), unplanned readmission within 30 days, unplanned reoperation within 30 days, and extended length of stay (LOS) defined as >75th percentile (>4 days).
Statistical analysis
Continuous variables were reported as means with standard deviations and compared using Kruskal-Wallis tests across frailty categories. Categorical variables were expressed as frequencies with percentages and analysed using chi-square tests. Univariable logistic regression evaluated associations between each frailty index and outcomes, with results reported as odds ratios (OR) and 95% confidence intervals (CI).
Receiver operating characteristic (ROC) curves assessed discriminative performance, with area under the curve (AUC) values compared using DeLong’s test. An AUC of 0.5 indicates no discrimination, 0.7–0.8 acceptable discrimination, 0.8–0.9 excellent discrimination, and >0.9 outstanding discrimination. Internal validation employed bootstrap resampling with 100 iterations to calculate bias-corrected AUC values and assess model optimism. All analyses utilised Stata MP Version 18 (StataCorp, College Station, TX) with 2-sided p < 0.05 considered statistically significant.
Results
Patient characteristics
A total of 5631 adult patients undergoing rTHA for mechanical prosthetic complications were included in the final analytical cohort. The mean age was 66.8 ± 11.6 years, and 57.6% were female. Racial composition included 86.3% White patients, 11.2% Black, 1.6% Asian/Pacific Islander, and 0.9% American Indian/Alaska Native. Most patients were functionally independent (94.3%), while 5.1% were partially dependent and 0.5% were totally dependent.
Comorbidities included hypertension in 60.7%, diabetes mellitus in 13.7% (9.3% non-insulin-dependent, 4.4% insulin-dependent), chronic obstructive pulmonary disease in 6.0%, current smoking in 15.6%, and dyspnea in 5.7%. The mean BMI was 29.9 ± 6.7 kg/m². The average operative time was 143.3 ± 71.1 minutes, and the mean postoperative LOS was 3.4 ± 3.3 days. Patient characteristics are presented in Table 1.
Patient demographics and comorbidities by Risk Analysis Index (RAI) categories.
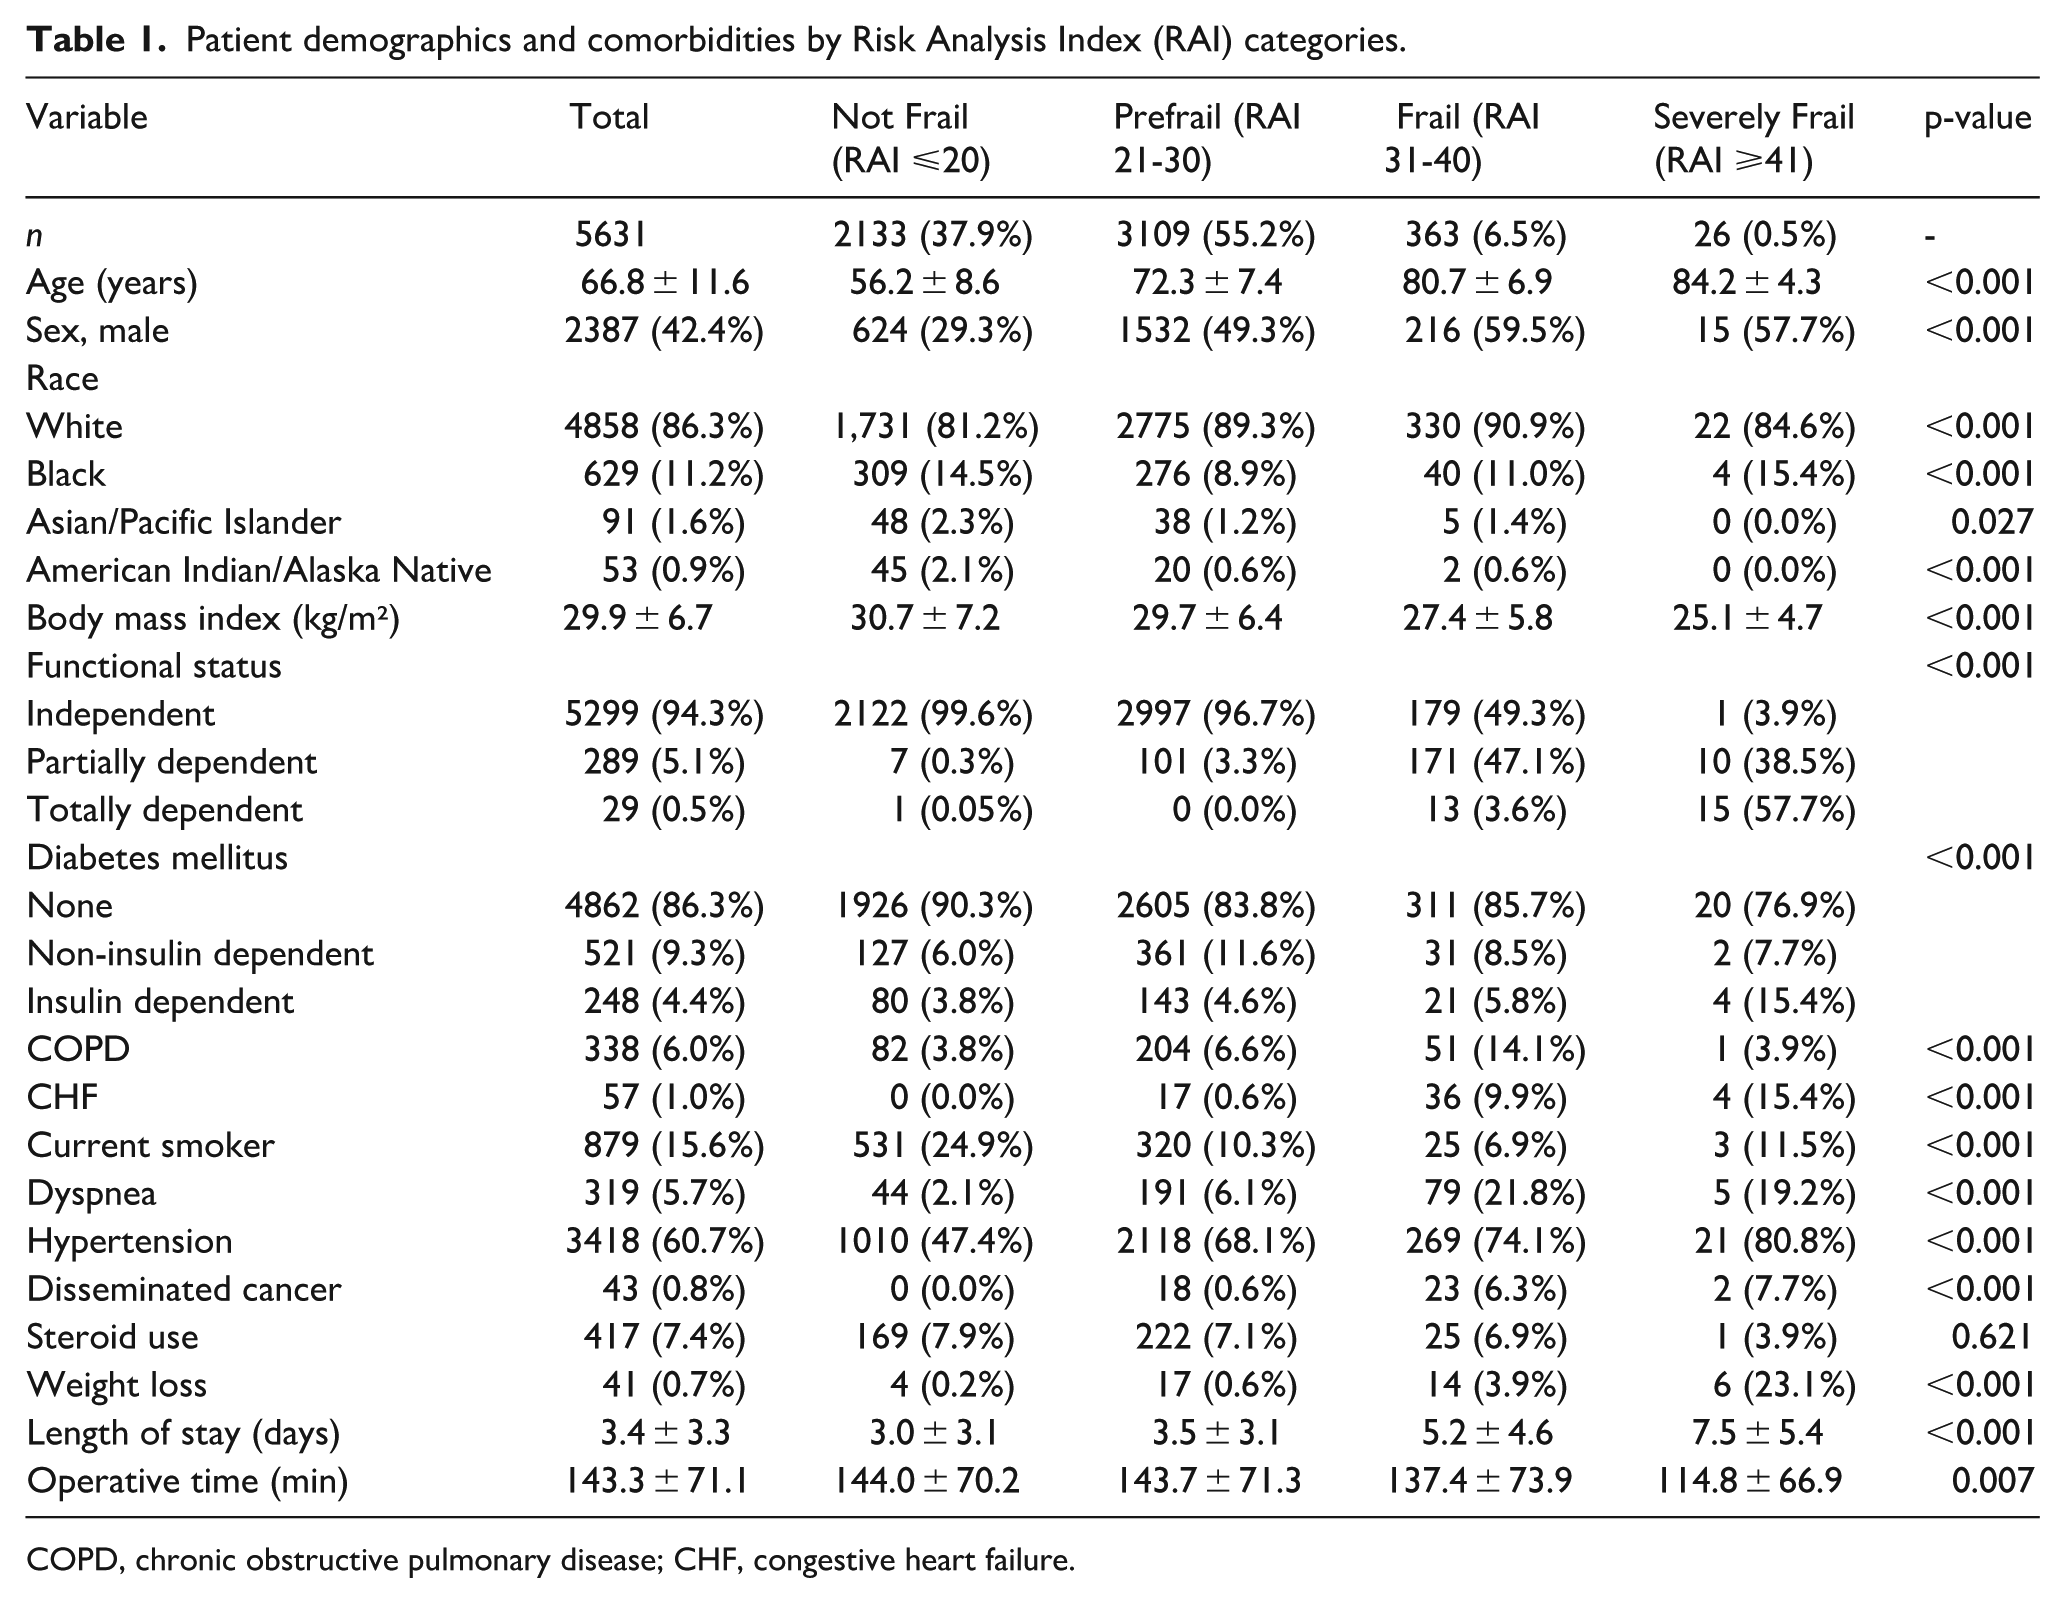
COPD, chronic obstructive pulmonary disease; CHF, congestive heart failure.
Frailty distribution
Using RAI classification, 37.9% of patients were Not Frail, 55.2% Prefrail, 6.5% Frail, and 0.5% Severely Frail. The mFI-5 categorised 34.8% as Not Frail, 53.7% Prefrail, 10.0% Frail, and 1.5% Severely Frail. Increasing frailty by either measure correlated with older age, male sex, higher comorbidity burden, dependent functional status, and prolonged hospitalisation (all p < 0.001). Notably, body mass index decreased with advancing RAI category, contrasting with relatively stable values across mFI-5 strata. Distribution of frailty classifications are presented in Table 2.
Distribution of frailty classifications.
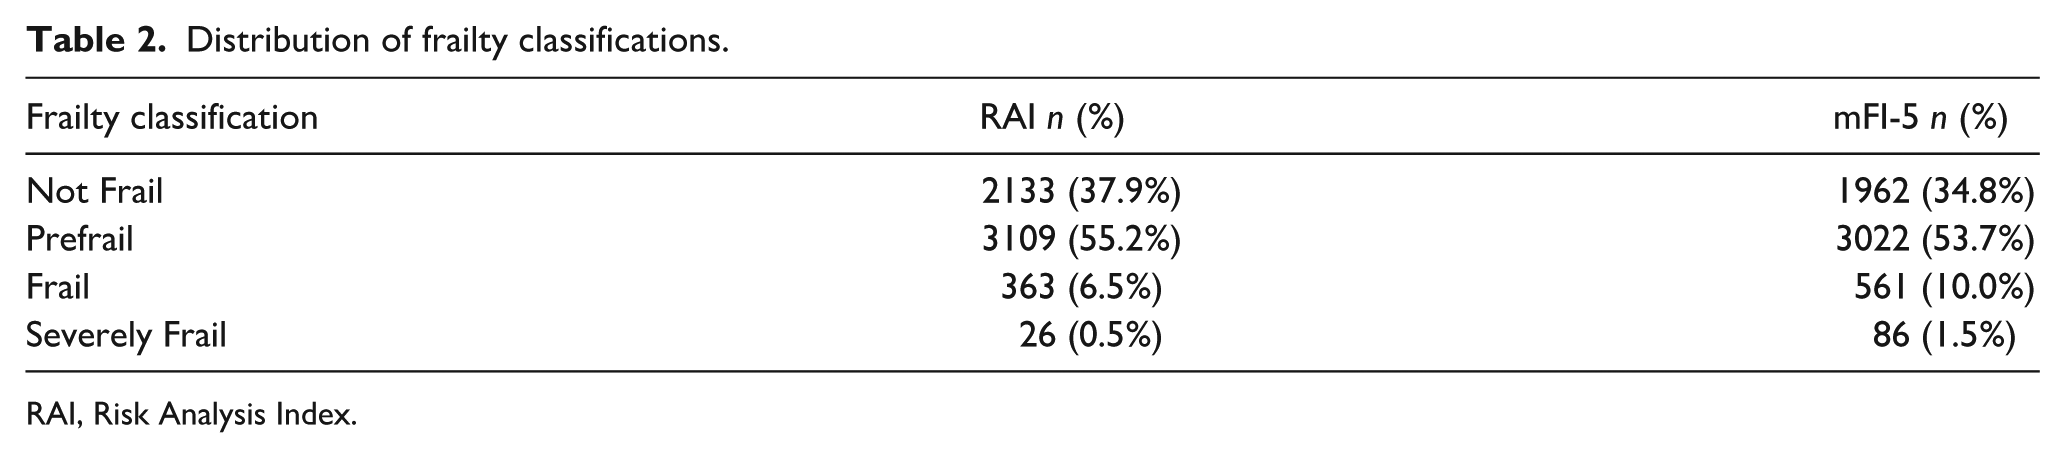
RAI, Risk Analysis Index.
Primary outcomes
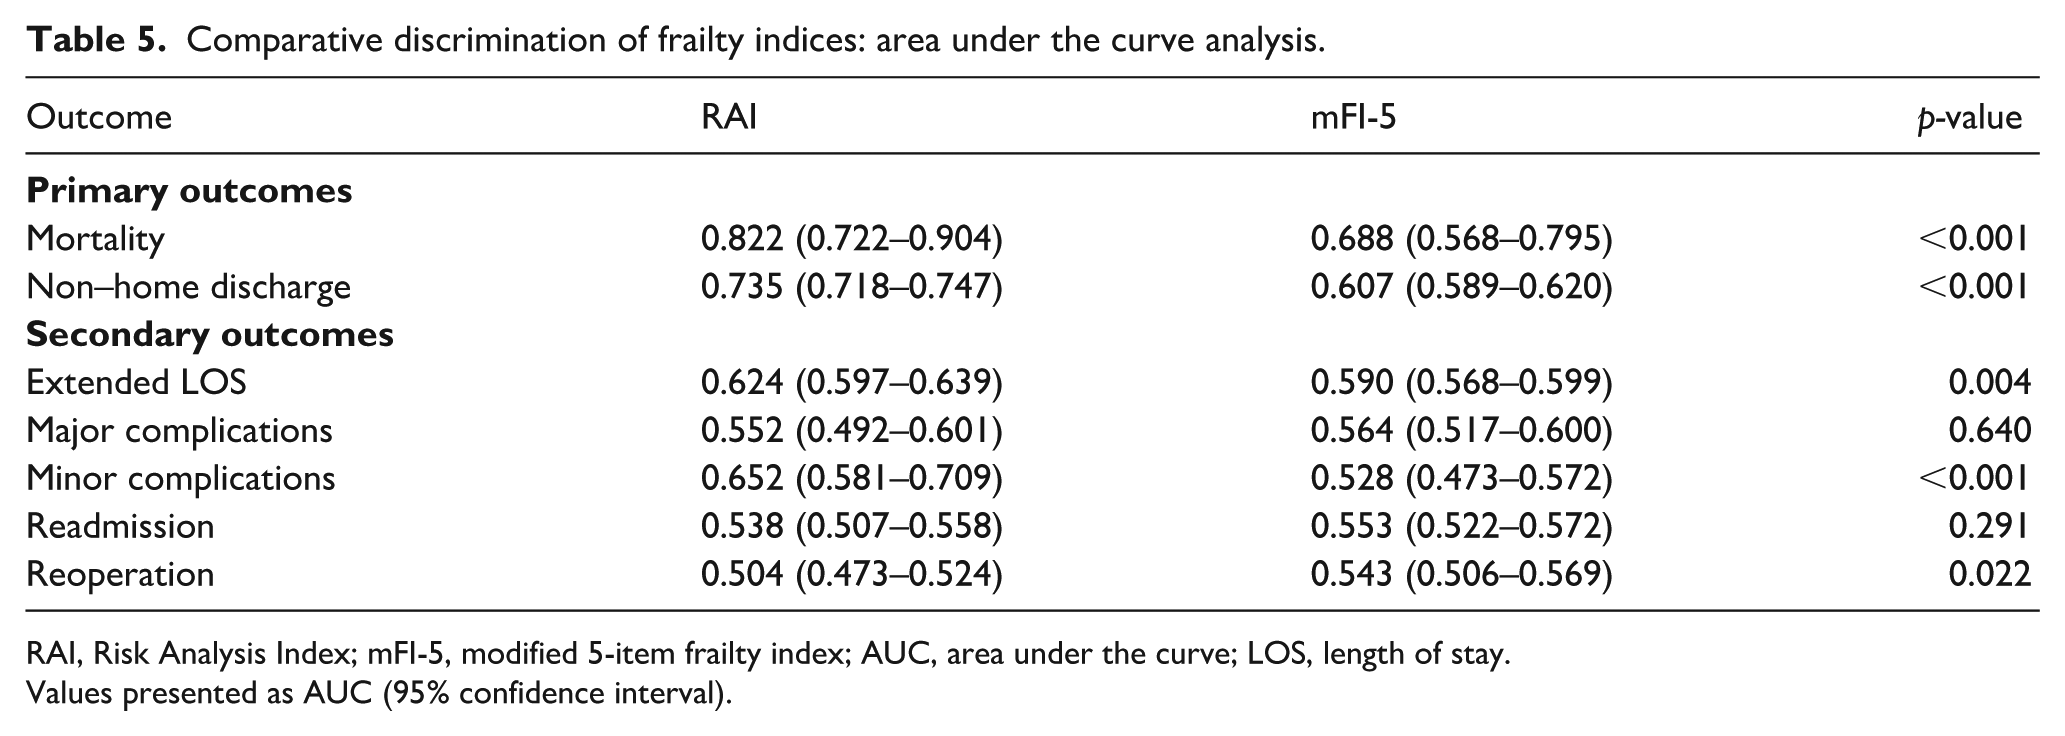
RAI outperformed mFI-5 in predicting both 30-day mortality and non-home discharge. For 30-day mortality, RAI achieved an AUC of 0.822 (95% CI, 0.722–0.904) versus 0.688 (95% CI, 0.568–0.795) for mFI-5 (p < 0.001). Mortality increased from 0.1% in Not Frail to 3.9% in Severely Frail patients (p < 0.001).
Non-home discharge occurred in 28.8% of the overall cohort, with stepwise increases by RAI category: 12.5% in Not Frail, 35.3% in Prefrail, 64.8% in Frail, and 76.9% in Severely Frail patients (p < 0.001). RAI demonstrated superior discrimination (AUC 0.735; 95% CI, 0.718–0.747) compared to mFI-5 (AUC 0.607; 95% CI, 0.589–0.620; p < 0.001). Univariate logistic regression revealed that patients categorised as Severely Frail by RAI had a 43.5-fold increased risk of mortality (OR 43.50; 95% CI, 3.78–500.76) and a 23.4-fold increased risk of non-home discharge (OR 23.35; 95% CI, 8.66–63.04) compared to Not Frail patients (p < 0.001). 30-day outcomes by RAI are presented in Table 3.
30-day outcomes by Risk Analysis Index categories.
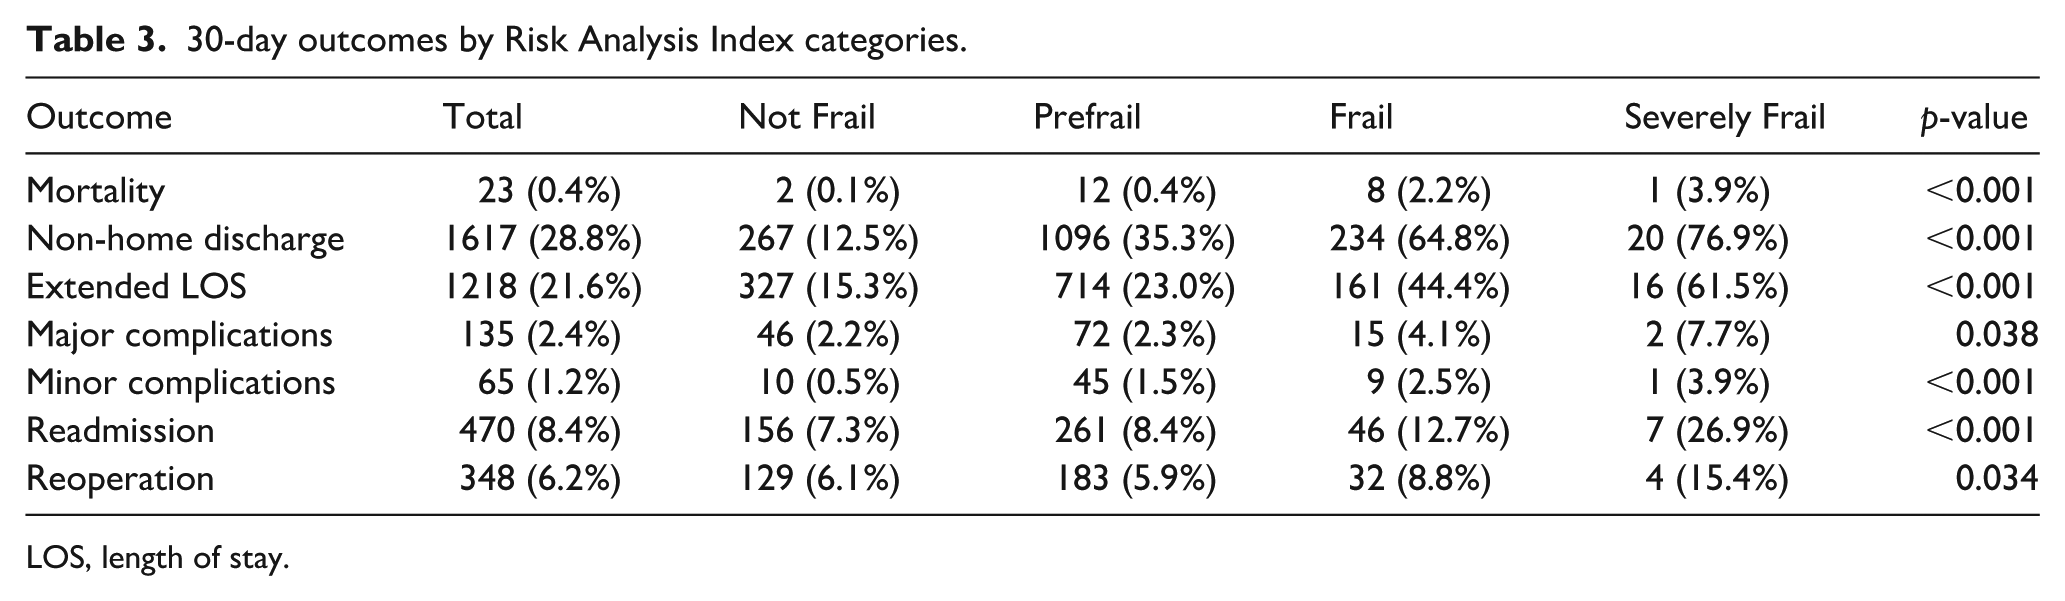
LOS, length of stay.
Secondary outcomes
RAI also showed better or comparable performance for several secondary endpoints. For extended length of stay (>75th percentile), RAI achieved an AUC of 0.624 versus 0.590 for mFI-5 (p = 0.004). Minor complications were best predicted by RAI (AUC 0.652 vs. 0.528, p < 0.001).
Major complications occurred in 2.4% of patients, with modest discrimination from both indices (RAI: AUC 0.552; mFI-5: 0.564; p = 0.640). Similarly, 30-day readmission and reoperation rates were 8.4% and 6.2%, respectively, with poor predictive ability for both indices (readmission AUCs: 0.538 vs. 0.553; reoperation AUCs: 0.504 vs. 0.543). Univariate regression results are presented in Table 4.
Univariate logistic regression analysis: RAI categories and 30-day outcomes.
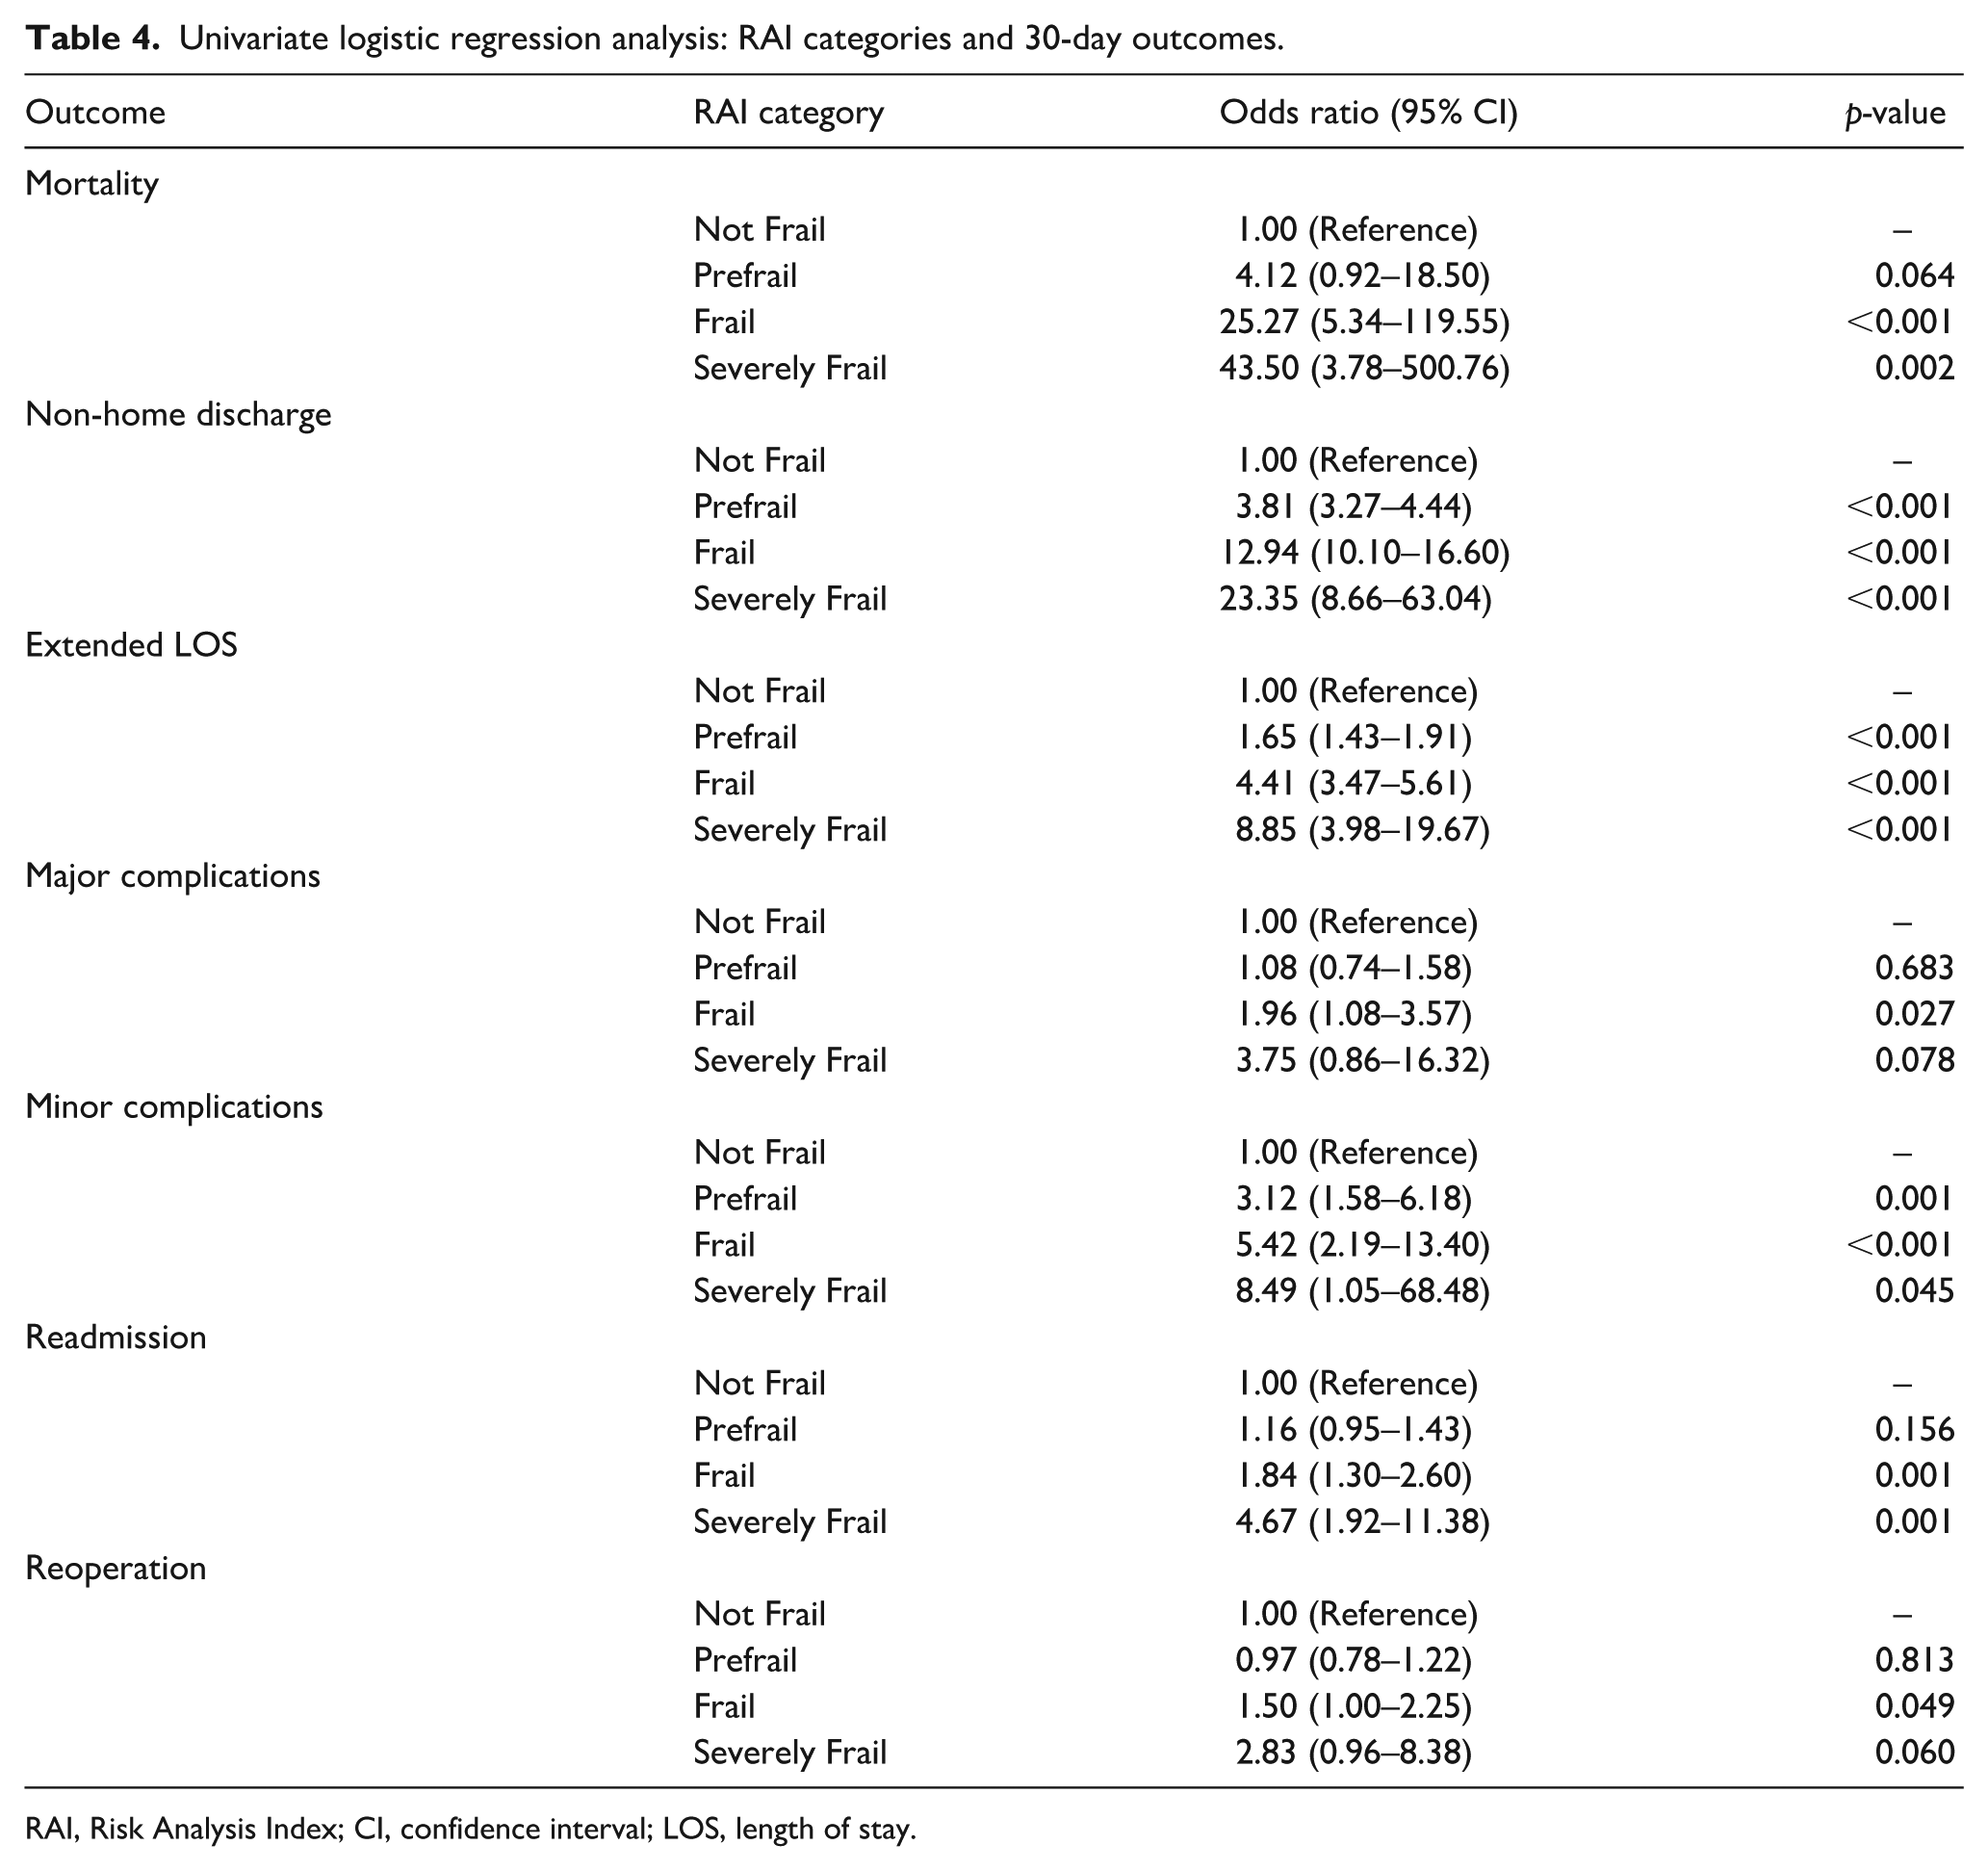
RAI, Risk Analysis Index; CI, confidence interval; LOS, length of stay.
Univariate analysis confirmed increasing odds of complications with advancing RAI frailty category. For instance, the odds of minor complications were 8.5 times higher in Severely Frail patients compared to Not Frail (OR 8.49; 95% CI, 1.05–68.48; p = 0.045). Similar trends were seen for extended LOS and reoperation. AUC results of discriminative performances are presented in Table 5.
Comparative discrimination of frailty indices: area under the curve analysis.
RAI, Risk Analysis Index; mFI-5, modified 5-item frailty index; AUC, area under the curve; LOS, length of stay.
Values presented as AUC (95% confidence interval).
Internal validation
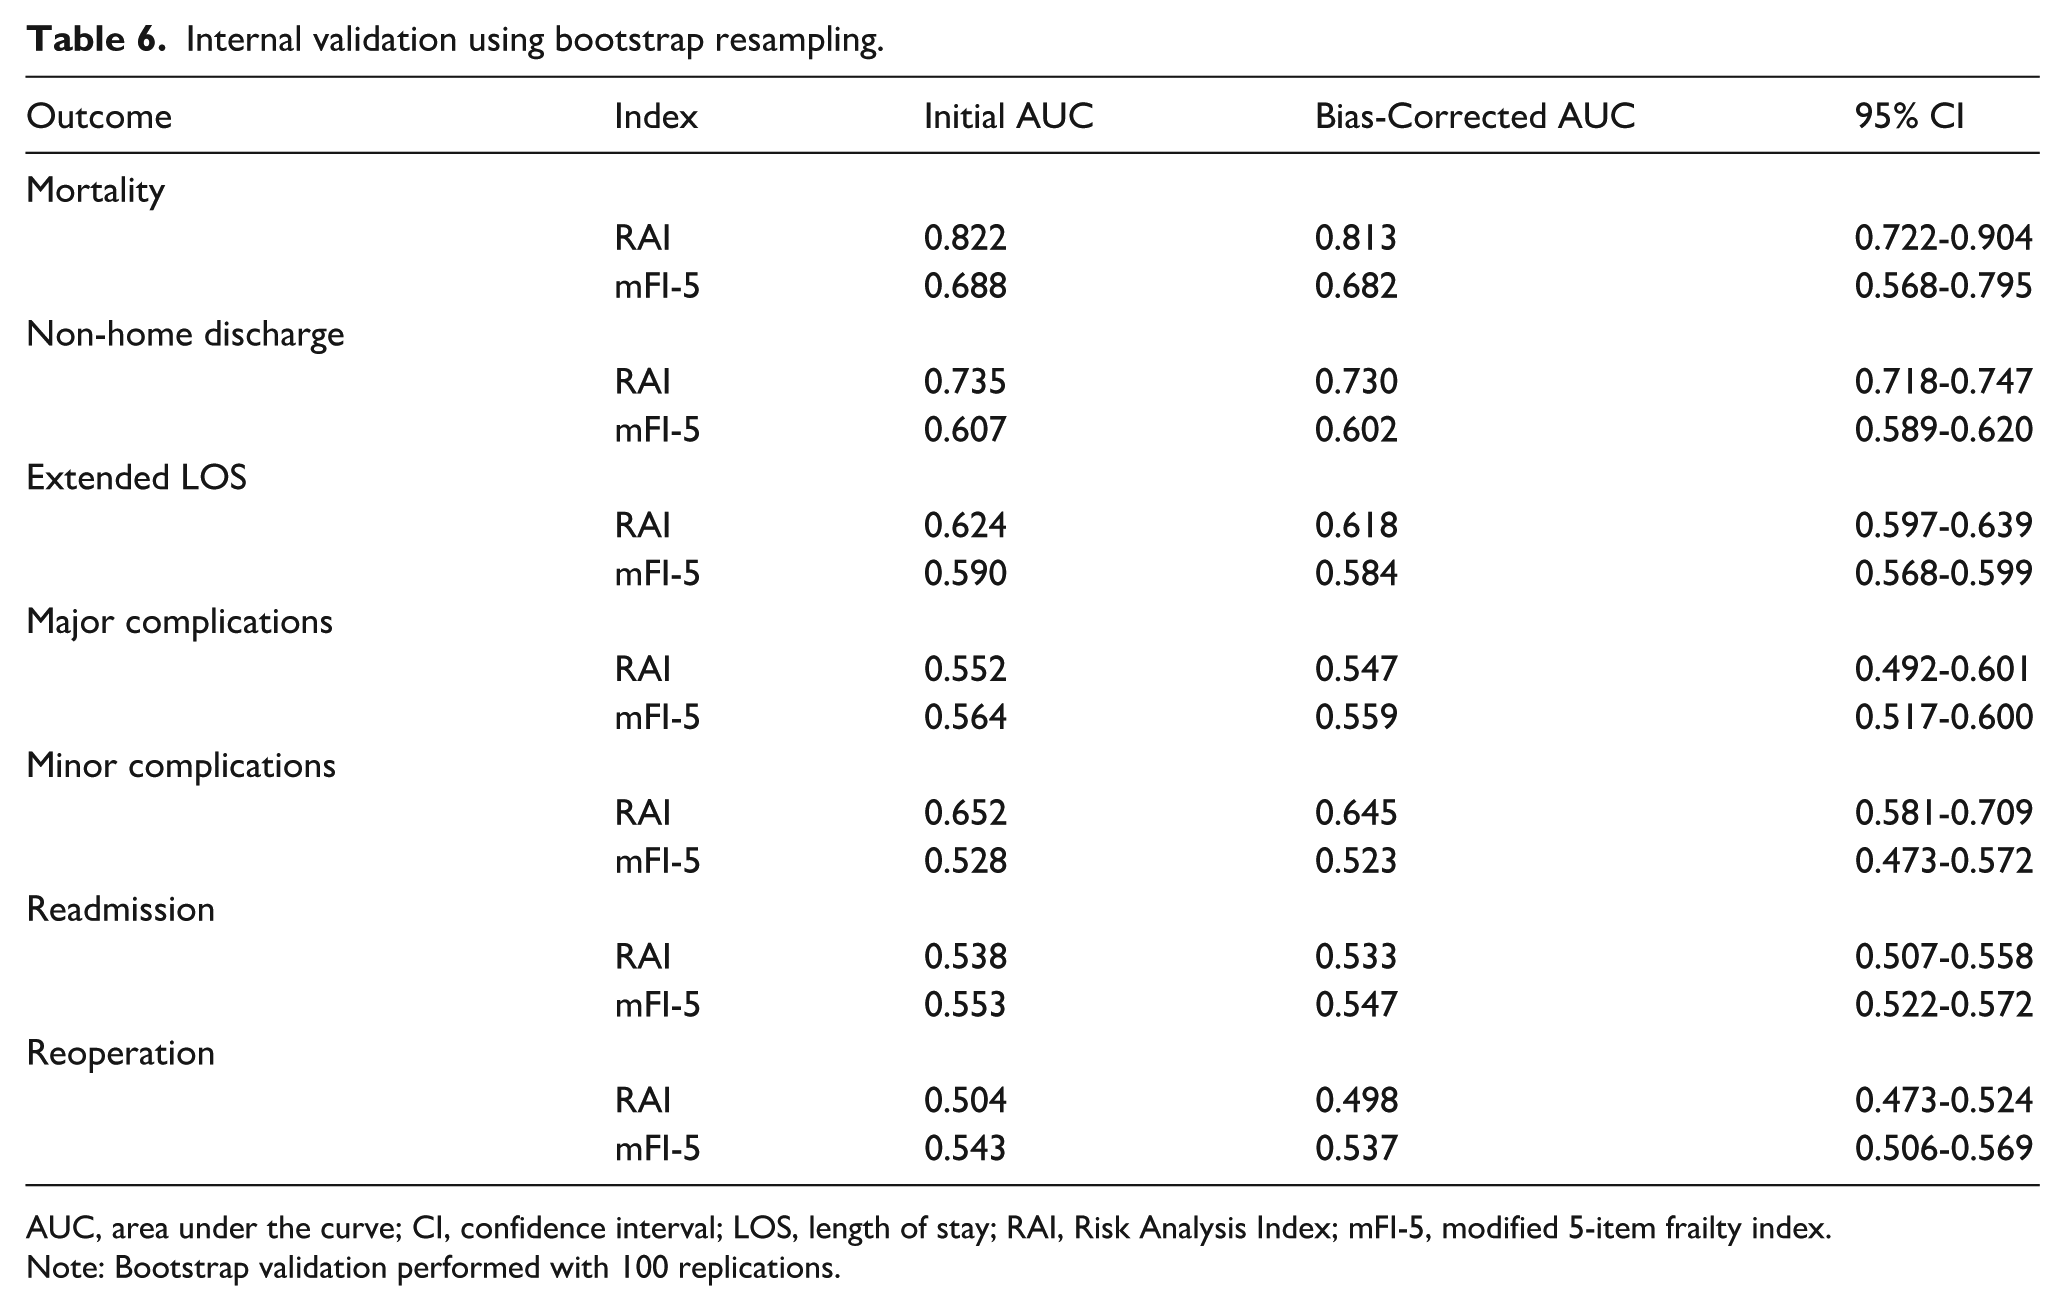
Bootstrap validation (100 replications) demonstrated robust model performance with minimal optimism. The bias-corrected AUC for 30-day mortality was 0.813 for RAI and 0.682 for mFI-5. For non-home discharge, the corrected AUCs were 0.730 (RAI) and 0.602 (mFI-5). Other secondary outcomes showed consistent bias-corrected values with original estimates, affirming the stability of predictive performance. Internal validation results are presented in Table 6.
Internal validation using bootstrap resampling.
AUC, area under the curve; CI, confidence interval; LOS, length of stay; RAI, Risk Analysis Index; mFI-5, modified 5-item frailty index.
Note: Bootstrap validation performed with 100 replications.
Discussion
This large-scale comparative analysis demonstrates that the Risk Analysis Index provides superior risk stratification compared to the traditional modified 5-item frailty index for patients undergoing revision total hip arthroplasty. The comprehensive nature of RAI, incorporating functional status, comorbidity burden, and acute physiologic stressors, enables more accurate prediction of mortality and discharge disposition – outcomes of paramount importance for surgical decision-making and perioperative planning.
Our findings align with emerging literature supporting multi-domain frailty assessment in orthopedic surgery. Johnson et al. 9 analysed 8640 total hip arthroplasty patients, including 2138 revision cases, demonstrating that comprehensive frailty measures predicted wound complications (OR 2.01), reoperation (OR 2.74), and 1-year mortality with greater accuracy than single-domain tools. Similarly, Traven et al. 6 evaluated 13,948 revision arthroplasty patients, finding strong associations between frailty and adverse outcomes, though their analysis relied solely on mFI-5 without comparative assessment.
The superiority of RAI likely stems from its nuanced weighting system and inclusion of acute illness markers absent from traditional indices. While mFI-5 assigns equal weight to all components, RAI recognises the differential impact of various risk factors – allocating 14 points for total dependence versus 3 points for male sex. This granularity proves particularly relevant in revision surgery where functional limitations often reflect both chronic disability and acute decompensation from prosthetic failure.
The clinical implications extend beyond statistical performance. RAI’s superior discrimination for mortality (AUC 0.822) and non-home discharge (AUC 0.735) enables meaningful risk stratification for shared decision-making. Patients in the highest RAI tier faced 43-fold increased mortality risk and 23-fold increased odds of institutional discharge – information crucial for preoperative counseling and discharge planning. These findings support recent work by Zamanzadeh et al., 10 who demonstrated that age-adjusted frailty assessment improved complication prediction in revision arthroplasty, with rates increasing from 15% to 45% across risk tiers.
Interestingly, our analysis revealed limitations of both frailty measures for predicting certain outcomes. Major complications, readmissions, and reoperations showed modest discrimination regardless of index used, suggesting these events may depend more on technical factors or random variation than baseline frailty. This observation parallels findings from Ondeck et al. 11 in primary arthroplasty, where surgical complexity and implant-related factors dominated complication risk.
Several mechanisms may explain RAI’s enhanced performance. First, the inclusion of dyspnea and residence type captures functional limitations not reflected in binary dependence measures. Second, weighting by age recognises the exponential increase in surgical risk with advancing years. Third, markers of acute illness (heart failure exacerbation, renal insufficiency, weight loss) identify patients with active physiologic decompensation beyond chronic disease burden. These features align with contemporary frailty theory emphasising dynamic vulnerability rather than static disability. 5
Recent studies have further validated the importance of comprehensive frailty assessment. Meyer et al. 3 applied the Hospital Frailty Risk Score to 565 revision arthroplasty patients, finding that frail patients had significantly higher rates of readmission (23.8% vs. 9.9%, p = 0.006), surgical complications (28.6% vs. 7.8%, p < 0.001), and medical complications (11.9% vs. 1.0%, p < 0.001). While their approach used diagnostic codes, our direct comparison of prospectively collected clinical variables provides more actionable information for preoperative assessment.
The evolution of frailty indices continues with recent innovations. Tram et al. 12 showed that frail patients undergoing rTHA experienced higher rates of complications, readmissions, longer hospital stays, and increased costs. Our data align with these patterns while demonstrating that RAI offers superior discrimination compared to simpler indices. Similarly, Momtaz et al. 13 developed an rTHA-specific frailty index, finding stepwise increases in complication risk across categories (OR 1.4, 3.2, and 10.8 for increasing frailty levels; p < 0.001). However, their index required multiple additional variables not routinely collected, limiting practical implementation.
The predictive power of RAI also surpasses that observed in studies using single predictors. Shin et al. 14 demonstrated that mFI ⩾0.45 predicted Clavien-Dindo grade IV complications with an OR of 5.14 – impressive but still inferior to the discrimination achieved by RAI in our analysis. This underscores the value of comprehensive assessment over simplified screening tools.
Our findings carry important implications for quality improvement initiatives. Risk-adjusted outcome reporting increasingly influences hospital rankings, reimbursement, and surgical eligibility determinations. Adopting RAI for preoperative assessment could enhance risk adjustment accuracy, ensuring appropriate credit for centers treating complex patients. Furthermore, identifying high-risk patients enables targeted interventions – prehabilitation, nutritional optimisation, care coordination – shown to improve outcomes in frail surgical populations.15,16
Study strengths include the large nationally representative sample, comprehensive outcome assessment, rigorous statistical methodology, and head-to-head comparison of validated indices. The focus on revision procedures for mechanical complications addresses a clinically important but understudied population facing unique challenges. Internal validation confirms generalisability while bootstrap methods quantify model optimism.
Limitations warrant consideration. NSQIP data collection extends only 30 days postoperatively, potentially missing delayed complications or functional recovery trajectories. The retrospective design precludes causal inference, and unmeasured confounders may influence observed associations. Database constraints prevented evaluation of newer frailty instruments or patient-reported outcomes increasingly recognised as important quality metrics. Additionally, top-coding of age at 89 years may underestimate risk in the oldest patients.
Future research should pursue external validation in diverse healthcare settings, including community hospitals with different case mix and resources. Prospective studies could evaluate whether RAI-guided interventions improve outcomes – for example, whether deferring elective revision in severely frail patients or implementing enhanced recovery protocols in high-risk cases reduces complications. Development of procedure-specific modifications might further enhance predictive accuracy. Integration with emerging technologies – wearable devices quantifying activity, machine learning algorithms processing electronic health records – could enable dynamic risk assessment responsive to changing clinical status.
Conclusion
The Risk Analysis Index demonstrates superior performance compared to the traditional modified 5-item frailty index for predicting critical outcomes following revision total hip arthroplasty. Its comprehensive assessment capturing functional status, comorbidity burden, and acute physiologic compromise enables accurate identification of high-risk patients most likely to experience mortality or require institutional discharge. These findings support adopting RAI as the preferred risk stratification tool for revision arthroplasty, facilitating informed decision-making, appropriate resource allocation, and targeted interventions to optimise outcomes in this vulnerable population. As healthcare systems increasingly emphasise value-based care, accurate risk assessment becomes essential for delivering high-quality, patient-centred surgical services while stewarding limited resources responsibly.
Footnotes
Declaration of conflicting interests
The authors declared no potential conflicts of interest with respect to the research, authorship, and/or publication of this article.
Funding
The authors received no financial support for the research, authorship, and/or publication of this article.
